
 ?Mathematical formulae have been encoded as MathML and are displayed in this HTML version using MathJax in order to improve their display. Uncheck the box to turn MathJax off. This feature requires Javascript. Click on a formula to zoom.
Abstract
Healthcare budgets worldwide are under constant pressure to reduce costs while improving efficiency and quality. This phenomenon is also visible in clinical laboratories. Efficiency gains can be achieved by reducing the error rate and by improving the laboratory’s layout and logistics. Performance indicators (PIs) play a crucial role in this process as they allow for performance assessment. This review aids in the process for selecting laboratory PIs—which is not trivial—by providing an overview of frequently used PIs in the literature that can also be used in clinical laboratories. We conducted a systematic review of the laboratory medicine literature on PIs. As the testing process in clinical laboratories can be viewed as a production process, we also reviewed the production processes literature on PIs. The reviewed literature relates to the design, optimization or performance assessment of such processes. The most frequently cited PIs relate to pre-analytical errors, timeliness, resource utilization, cost, and the amount of congestion. Their citation frequency in the literature is used as a proxy for their importance. PIs are discussed in terms of their definition, measurability and impact. The use of suitable PIs is crucial in production processes, including clinical laboratories. By also reviewing the production processes literature, additional relevant PIs for clinical laboratories were found. The PIs in the laboratory medicine literature mostly relate to laboratory errors, while the PIs in the production processes literature relate to the amount of congestion in the process.
Introduction
In the era of value-based healthcare (VBHC), where improving the ratio of patient outcomes to costs is central, improving laboratory efficiency is gaining increasing interest. Ideally, high-quality testing is performed both rapidly and economically. In laboratories containing expensive equipment, even small inefficiencies can become expensive. Improved laboratory efficiency can be achieved by reducing the error rate or by improving laboratory layout and logistics. Performance indicators (PIs) play an important role in this improvement process because they can be used to assess laboratory performance. A PI is an objective and improvable measure through which process performance can be quantified. The increasing level of laboratory automation allows for the collection of data that is needed for the calculation of the values of these PIs. However, selecting suitable PIs is not trivial. This article aids in the PI selection process by providing an overview of the most frequently used laboratory PIs and their corresponding definition, measurability and impact on performance. Their citation frequency in the literature is used as a proxy for their importance.
There are extensive lists of PIs for the whole clinical laboratory testing process [Citation1–7]. These lists are usually the outcome of a medical literature review or are based on best practices. Clinical laboratories can be seen as production processes; the samples are the jobs and the analyzers and other laboratory apparatuses are the machines. The added value of this article lies in the exploration of additional PIs by also investigating the literature on production processes. An integrated set of PIs valuable for laboratory performance improvement should be considered.
Materials and methods
We conducted a systematic literature search in Embase, Medline Ovid, Web of Science and CINAHL EBSCOhost to construct a comprehensive list of PIs used in laboratory medicine, including pathology, hematology, and clinical chemistry. The chosen keywords relate to process design, workflow optimization, laboratory improvement, and PIs. The term Quality Indicator was also included as a keyword in our search strategy, as it is often used for indicators of laboratory performance in the laboratory medicine literature. However, the term PI is used throughout this review article. PIs are often based on error rates; therefore, articles on laboratory errors were also included. Since this article focusses on the efficiency of the sample flow, articles solely focused on analytical quality and/or appropriateness of test requests were excluded. Proper test ordering behavior can be guided by laboratory professionals [Citation8] but is primarily a result of the physician’s action. Therefore, the ordered tests can be seen as input for the laboratory and this review focuses on the consequences of the direct actions of the laboratory staff and apparatus when handling samples.
Additionally, we conducted a Scopus search using keywords related to the design, performance assessment or optimization of production processes to find additional PIs suitable for clinical laboratories. The articles from the production processes literature were only included if the flow of jobs through the described process resembles the sample flow through the laboratory testing process. For example, the process of assembling an airplane, where all required parts are brought to the assembly area, is significantly different than a laboratory testing process. Production processes can also differ in the way they meet their demand. Companies that produce on a make-to-stock basis anticipate the orders of their customers and produce the items beforehand [Citation9]. However, companies that produce on a make-to-order basis only produce items that have been ordered. Clinical laboratories produce on a make-to-order basis. Articles do not always state how the described production process meets its demand, and therefore, we did not filter articles based on this aspect.
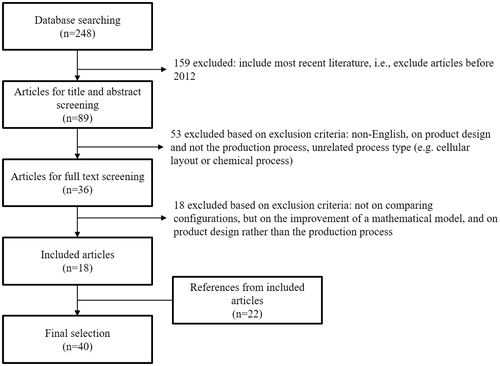
Articles published in January 2012 up to and including November 2017 were included to obtain an overview of the most recent literature but also to exclude outdated laboratory testing methods. After relevant articles had been identified through full-text screening, the references included in these articles were then considered to identify additional relevant articles. However, in order not to miss important articles, no filter on the publication date was used for the references of the initially included articles. The article selection procedure and applied exclusion criteria are shown in and . The title and abstract screening of the laboratory medicine literature was performed by two independent reviewers. The final selection contains 161 articles from the laboratory medicine literature and 40 articles from the production processes literature. The search strategies are outlined in Supplemental Data 1.
Figure 1. Article selection process for performance indicators in laboratory medicine literature.
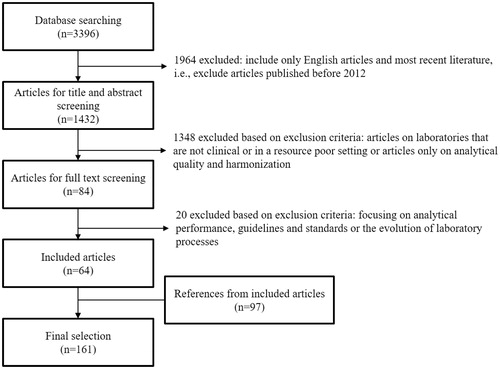
Figure 2. Article selection process for performance indicators in production processes literature.
Results
PIs play an important role in production processes, including clinical laboratories. PIs allow objective quantification of important aspects of the process under consideration. They appear to be necessary to understand the performance of the process, to monitor and control operational efficiency, to make improvements, to measure effectiveness of decisions and to take suitable actions for maintaining competitiveness [Citation10]. They can be used to compare laboratory configurations, which can benefit laboratory management in their discussion with potential vendors. Some articles have identified PIs that take the form of a yes-no question, especially when it comes to the quality of laboratory services, such as “Does the laboratory provide advice on test interpretation?” [Citation11]. However, we agree with Ricós et al. [Citation12] that PIs must be expressed in numerical terms and must be expressed relative to a value relating to the incident for proper performance interpretation.
Performance indicators in laboratory medicine
It has been shown that the pre-analytical phase is the most error-prone and that fewer errors occur in the analytical phase [Citation13,Citation14]. Sample hemolysis and inadequate sample volume are some examples of common pre-analytical errors. In addition, analytical and post-analytical errors include incorrect data transcription, tests without quality control, unreported critical values and untimely results. Corresponding PIs can be expressed as error rates or percentages. shows the absolute citation frequencies of the PIs that are most frequently proposed or analyzed in the laboratory medicine literature. The source articles for each PI are shown in Supplemental Data 2. Articles on the development or analysis of the same PI list are grouped, which is explained further in Supplemental Data 2. Therefore, the 161 included articles result in 132 distinct PI lists. Turnaround time is cited in 63% of these lists, identification error in 33%, timeliness in 32%, sample hemolysis in 26%, inadequate sample volume in 25%, labeling error in 21%, wrong container in 20%, sample clotted and samples lost/not received in 19% and cost in 18%.
Figure 3. Top 10 performance indicators in laboratory medicine literature and their absolute citation frequency.
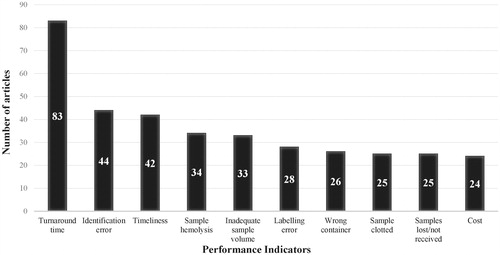
The PIs shown in mainly correspond to the pre-analytical phase because we excluded articles solely focused on analytical quality and because most errors in the testing process occur in the pre-analytical phase. These pre-analytical errors can result in sample rejection and can therefore require extra work in order to resolve them. In the remainder of this section, we describe the PIs from in the format: definition, measurability and impact.
Turnaround time
Definition: Turnaround time (TAT) is the time between two steps in the diagnostic process. The definitions of these two steps depend on the goals of the laboratory. Steindel et al. [Citation15] showed that the time between the moment the sample arrives at the laboratory until the results are reported, is the most commonly used definition of TAT by clinical laboratories.
Measurability: The TAT can be calculated by subtracting the timestamps of the two steps under consideration. Due to the non-Gaussian nature of the distribution of the TAT of Emergency Department (ED) test results, frequency-based summary statistics, such as the 90th percentile value or the median of the distribution are often used [Citation15,Citation16]. As a consequence, the impact of data outliers is limited [Citation15]. Furthermore, the efficiency of an intervention is reflected in the reduction of the outlier rate and not necessarily on the mean TAT [Citation17]. A more predictable TAT may be preferred over a shorter mean TAT.
Impact: TAT is often used by clinicians to benchmark laboratory performance [Citation18]. Steindel et al. [Citation19] found no significant correlation between routine test TAT and patient length of stay (LOS). However, Holland et al. [Citation20] showed that the average ED LOS significantly correlates with the laboratory TAT outlier rate. In the case study reported by Cole [Citation21], due to common delays between test ordering and arrival in the laboratory, tests were labeled as priority tests even though there were few medical emergencies.
Identification error
Definition: An identification error often arises from a request form or a sample bearing incorrect patient or physician information.
Measurability: The corresponding PI can be calculated as follows [Citation2,Citation22]:
or
Impact: Incorrect identification can negatively affect patient safety in the form of misdiagnosis and unsuitable treatment [Citation23]. In a study by D’Angelo et al. [Citation24], 159 h of manual rework was required due to 45 misidentified specimens during a period of three weeks. There are several known ways to decrease identification errors, such as the labeling of specimens in the presence of the patient and the selection of suitable identifiers to be noted on the sample and request [Citation23]. Labeling errors can lead to misidentification, but this is not always the case. It is possible that a label contains correct information while a label-scanner has difficulty scanning it due to a fold in the label. Since most of the included articles do not provide the definition of a labeling error, we consider these PIs separately.
Timeliness
Definition: A laboratory result is timely if it is reported to the physician prior to a predefined due date. This due date can be customized and may depend on the next appointment of the patient, the cause of the test request or the outcome of the test. It can also be a general due date, where a test result is considered timely if its TAT is less than a predefined TAT goal [Citation25]. Timeliness of subprocesses may be considered as well, for example the timeliness of phlebotomy [Citation26].
Measurability: If timeliness is assessed by using a TAT goal, the TAT of the result must be retrievable and the TAT goal must be known. If timeliness is assessed by setting a target due date, both this due date and the actual delivery time must be known. Due dates can, for example, be retrieved from the schedules of the physicians. Therefore, a result is timely if
Some studies consider the on-time percentage [Citation26], while others consider the total or the average tardiness [Citation27].
Impact: Tardy test results can affect the quality of care, physician satisfaction and patient satisfaction. The International Federation of Clinical Chemistry and Laboratory Medicine (IFCC) proposes the timeliness of reporting critical values as a PI, because these values can indicate life threatening status of a patient [Citation2]. Knowing the due date of test results allows for the possibility to delay testing to less busy times during the day. Finally, flexible scheduling of samples on analyzers is necessary if customized delivery dates, and therefore multiple levels of priority, are used.
Sample hemolysis
Definition: Hemolysis of blood samples occurs when red blood cells are damaged, leading to free hemoglobin in the sample.
Measurability: The corresponding PI can be defined as follows [Citation28]:
Impact: Sample hemolysis can cause serious analytical interference [Citation28]. In Begum et al. [Citation29], Jafri et al. [Citation30] and Chawla et al. [Citation31], sample hemolysis was the main cause of sample rejection. Sample hemolysis can be caused by incorrect handling of the sample [Citation32], inadequate vascular condition during phlebotomy [Citation33] or improper equipment [Citation33,Citation34].
Inadequate sample volume
Definition: The sample volume is inadequate when the volume of the provided sample does not meet the minimum volume requirements for testing.
Measurability: The corresponding PI can be calculated as follows
For this indicator, the IFCC also counts the samples for which it was possible to perform all the requested tests, but where the sample volume was less than requested [Citation2].
Impact: In some cases, if the sample volume is insufficient, not all requested tests can be performed. A possible solution is to train phlebotomy staff on the volume requirements for each test [Citation33].
Labeling error
Definition: The 2017-Q tracks considered the rate of mislabeled samples by considering the cases in which labeling errors resulted in relabeling and corrected reports [Citation36]. In Michael et al. [Citation37], unlabeled samples, samples bearing only one identifier and samples that had a container-requisition mismatch were considered to have a labeling error.
Measurability: The corresponding PI can be defined as follows:
Impact: By implementing a single piece flow and decreasing the batch size, labeling errors can be detected earlier in the testing process, which decreases the associated rework [Citation37].
Wrong container
Definition: This error occurs when samples are collected in an unsuitable container for analysis, e.g. blood collection in an EDTA container instead of a citrate container in case of hemostasis testing.
Measurability: The corresponding PI can be calculated as follows [Citation2]:
Impact: Samples collected in a wrong container have either an incorrect result or a delayed diagnosis [Citation38] as they have to be resampled [Citation33]. In Sakyi et al. [Citation32], where this is reported as the most frequent pre-analytical error, samples were incorrectly sent to the laboratory in anticoagulated tubes. Phlebotomy staff negligence and lack of education are possible causes of this error [Citation32,Citation33].
Sample clotted
Definition: Clotted samples can be defined as whole blood samples with a red clot or plasma samples with a fibrin clot [Citation39]. Possible causes are the absence of standardized collection procedures or the absence of tube shaking after blood withdrawal [Citation40].
Measurability: The corresponding PI can be calculated as follows [Citation35]:
Impact: Clotted samples result in time-consuming rework and may lead to incorrect or non-reportable results. The regular occurrence of clotted samples requires intensification of the training of phlebotomy personnel.
Sample lost/not received
Definition: A lost sample can be defined as a sample that is unable to be located to complete all requested tests [Citation41].
Measurability: For this PI, the number of samples not received by the laboratory [Citation29,Citation42] or the number of samples lost within the laboratory [Citation41] can be compared with the total number of samples. Thus, for example:
Impact: Lost samples can be a major burden for the patient as blood has to be resampled, which results in rework and delayed test results. Providing various sample collection points can make phlebotomy more convenient, but this can also increase the rate of lost samples [Citation43]. In Kirchner et al. [Citation43], out of all the expected but not received samples, urine samples were missing most often. This can be difficult to improve as the receipt of urine samples is mostly controlled by personnel outside of the laboratory [Citation6].
Cost
Definition: In a clinical laboratory, there are numerous sources of cost, such as personnel cost, inventory cost, maintenance cost and reagent cost. The cost corresponding to actions and resources is expressed as their monetary value. Material handling is also a source of cost but is considered separately in this article as its price can, for example, be expressed in terms of the resulting delay in reporting time.
Measurability: Cost can be directly measured in terms of a monetary value, but often a proxy such as invested time is used. For example, decreasing personnel overtime will decrease the specimen processing costs [Citation44].
Impact: From the VBHC perspective, it is desirable to deliver high quality laboratory services at a reasonable cost. Onyenekwu et al. [Citation45] concluded that retesting of critical values increases laboratory running costs, but does not necessarily provide additional value. The tradeoff between cost and the gain in system performance should be taken into account when considering alternative layouts or when considering investment in alternative resources [Citation46–48].
Performance indicators in production processes
Clinical laboratories are make-to-order production processes. In the testing process, several steps have to be traversed in a particular order before results can be reported to the physician. Therefore, the PIs described in the production processes literature are of considerable value for the testing process. shows the absolute citation frequencies of the most frequently used PIs in the production processes literature. Work-in-process and turnaround time are cited in 58% of the included articles from the production processes literature, resource utilization in 48%, cost in 33%, material handling cost in 30%, throughput in 25%, timeliness in 20% and waiting time, maintenance/downtime and safety in 18%.
Figure 4. Top 10 performance indicators in production processes literature and their absolute citation frequency.
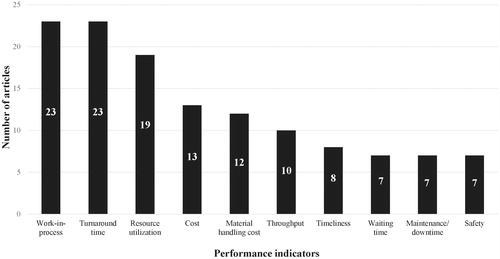
TAT, timeliness and cost are of the top 10 most frequently used PIs in both the laboratory medicine and production processes literature (as shown in both and ). As expected, TAT appears to be important in both the laboratory medicine and production processes literature, while timeliness appears to be more important in the laboratory medicine, than the production processes, literature. Improving timeliness is more often discussed in the scheduling and make-to-order literature. Articles on make-to-stock processes and on the optimal positioning of equipment within the production area are included in this review and usually do not include timeliness as a PI.
Seven additional PIs were identified as suitable for laboratory performance assessment by reviewing the production processes literature. In the remainder of this section, we describe the PIs from in the format: definition, measurability and impact.
Work-in-process
Definition: The work-in-process (WIP), or work-in-process inventory, is the amount of unfinished work remaining in the process (e.g. the number of samples that have not finished testing). This unfinished work includes the unfinished samples in queue. The samples that are being analyzed can either be included in [Citation49] or excluded from [Citation50] the WIP. Similarly, samples awaiting their first processing step can either be included in [Citation51] or excluded from [Citation50] the WIP.
Measurability: WIP can be expressed in number of samples or in terms of the remaining processing time for these samples. From Little’s law [Citation52] it follows that the average number of samples in a system is equal to the average arrival rate multiplied by the average time spent in that system. Therefore,
The WIP at time t can be calculated by counting all the unfinished samples in the laboratory at that time. To compute more detailed WIP statistics beyond the average WIP, the initial and final timestamps of the work on each sample are needed.
Impact: High WIP can be due to high queue lengths, which indicate insufficient resource capacity. High WIP also corresponds to increased space occupation and holding costs. Yang et al. [Citation53] studied a laboratory facing congestion during peak demand and found that by aiming for a constant WIP, performance improvements were achieved [Citation53].
Resource utilization
Definition: There are several types of resources that can be considered, such as equipment, staff and laboratory space. The utilization of a resource is obtained by comparing the amount of time it is used with its total availability.
Measurability: Given the total time a resource was available and the total time it was processing samples, we can calculate its utilization:
Impact: Manufacturing companies prefer a high machine utilization [Citation49]. The same is true for clinical laboratories that have expensive equipment because high resource utilization indicates efficient use of these resources. However, customers usually prefer short and reliable delivery times, but this may require a lower resource utilization [Citation49]. Therefore, laboratory management has to decide on a desired level of resource utilization. Lote et al. [Citation44] aimed to improve resource utilization by having a more leveled utilization among laboratory technicians. Kadi et al. [Citation46] evaluated bottlenecks in current and alternative configurations of hormone and biochemistry laboratories. To this end, the authors computed the utilization of each resource to identify the resources with the highest utilization [Citation46].
Material handling cost
Definition: The material handling cost is the cost required to transport material from one location to another. The material handling cost can be expressed in terms of a monetary value, but also in terms of time or distance.
Measurability: Examples of material handling cost are the total walking distance of laboratory staff to process a single sample or the total time a sample spends traveling between the work areas before it is completely processed. To express the material handling cost in terms of transportation time, departure and arrival times must be available. Drawing staff walking routes onto the laboratory layout to visualize these routes enables the identification of unnecessary walking and possible interventions to improve sample flow [Citation25,Citation54–56].
Impact: By setting the material handling cost as a PI, logistic efficiency can be achieved by improving transport routes. This PI is particularly important in the early stages of laboratory design or when considering laboratory redesign. Hayes et al. [Citation54] were able to redesign sample and resource flow in such a way that 187 km of unnecessary walking was avoided on a yearly basis. The optimal placement of equipment has a significant impact on process performance, which is reflected in the large body of work done on this topic [Citation57–60].
Throughput
Definition: The throughput is equal to the total number of items assembled or processed by a system over a predefined period [Citation53,Citation61]. In a laboratory, the samples can be seen as the items and the whole laboratory or an individual workstation can be seen as the system under consideration. The maximal throughput is the throughput in case of unlimited demand for tests and is bound by the capacity and the processing speed of each resource. It provides performance insights in case of maximal workload.
Measurability: Given the number of samples processed over a predefined period, we can calculate the throughput as:
The maximal throughput of a laboratory is not always measurable. To measure the maximal throughput of a laboratory, the maximal throughput of each resource must be known; however, measuring the work pace of the staff under maximal workload may not be possible.
Impact: In general, the aim is to maximize the throughput. An increased throughput corresponds with an increased production rate, which implies that more samples were processed in the laboratory for a given time period. Laboratories having a sufficiently high maximal throughput are able to tackle peak demand and, in case of machine downtime, are able to rapidly process delayed samples when the laboratory is operational again. These laboratories can decide to accept more samples such as samples corresponding to clinical trials.
Waiting time
Definition: Waiting time is defined as the time spent waiting for a value-adding operation. Examples are the time samples spend waiting in the queue of an analyzer or the time samples spend waiting before being transferred to the next processing step. Incubation time is not considered as waiting time, as this step is necessary for the testing process.
Measurability: To compute the waiting time of a sample in a queue, the moment a sample arrives at this queue and the moment the sample exits this queue must be retrievable. For example:
Unfortunately, the time the sample arrives at an analyzer queue and the time the sample is moved manually from one processing step to another are not always logged.
Impact: In a study by Denkena et al. [Citation62], approximately 50% of the total processing time consists of waiting time. Waiting times are usually positively correlated with sojourn times, which implies that results can be reported earlier if the waiting times are decreased. However, in case of batch processing, a shorter waiting time for one sample can increase the sojourn times of subsequent samples. Furthermore, high waiting times can indicate a bottleneck in the process.
Maintenance/downtime
Definition: For this PI, we consider the time the laboratory equipment is unable to properly process samples. Downtime may be due to preventive maintenance or due to sudden machine failure. In this article, machine failure and maintenance are combined, because they are closely related.
Measurability: Machine failure is often not explicitly or automatically logged in laboratory data, but may be noticed when longer processing times are visible. Periodic maintenance times are usually known, but are also not likely to be explicitly logged in laboratory information systems. Therefore, a prospective study may be more suitable than a retrospective study to assess this PI. Various measures have been proposed in the literature for this PI such as total time of maintenance operations [Citation27], total number of maintenance operations [Citation27] and as in [Citation6]:
Impact: Equipment downtime delays the time it takes to report results [Citation22,Citation30]. Nevertheless, maintenance operations are unavoidable. Laboratories that have higher failure rates experience more uncertainty and variability in their result reporting time, which can affect patient and physician satisfaction. A suitable maintenance policy can reduce failure rates. In Sakyi et al. [Citation32], equipment malfunction, such as broken probes, is a major source of analytical error. Couchman et al. [Citation63] described a laboratory containing two analyzers that are alternately turned off at night to minimize downtime and extend their lifespan.
Safety
Definition: This PI measures the frequency of accidents or other adverse events related to laboratory services.
Measurability: Safety has been measured in terms of the number of accidents [Citation6,Citation12,Citation22], the distance to hazardous areas [Citation64] or the risk of pollution [Citation65]. An example of an accident is a needle injury [Citation2]. Even though numerous articles claim that safety is important, most of them do not state how it can be measured or they aim to improve patient safety by improving other PIs such as the misidentification rate or the rate of delayed critical values.
Impact: Clinical laboratories aim to provide a safe environment for their staff and patients. A safe working environment positively affects employee satisfaction. A proper laboratory layout, such as the correct placement of units containing chemical waste and proper safety guidelines, such as wearing gloves when handling samples, can decrease the risk of accidents.
Relations between performance indicators
The value of laboratory medicine can be expressed, among others, in terms of TAT, timeliness and the cost per test [Citation66]. These three PIs are frequently used both in the laboratory medicine literature and in the production processes literature. shows how these three PIs are related to the other PIs described in this article, although it does not show all possible relations. When optimizing the testing process, there should be an awareness that PIs can be positively or negatively correlated. An example of a negative correlation between PIs is that the higher the TAT, the lower the number of samples that is delivered on time. For make-to-order processes, on the other hand, which have a specific demand, a decrease in TAT will not result in a significant increase in daily throughput. Nonetheless, an increased maximal throughput can decrease the TAT. For make-to-stock processes TAT and throughput are negatively correlated. Furthermore, optimizing one resource by increasing its maximal throughput can result in a decrease in its WIP, but it can also result in increased WIP in subsequent resources [Citation49].
Figure 5. Relations between performance indicators.
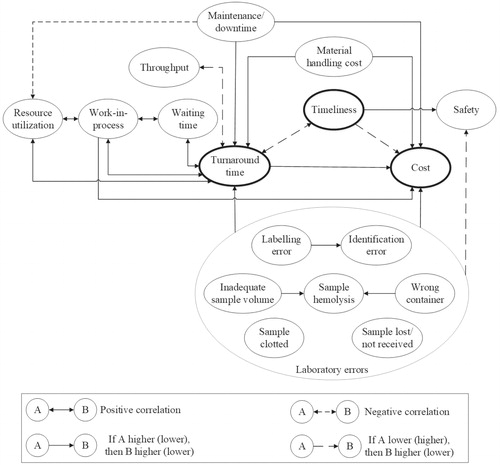
On the other hand, according to Little’s law, WIP is positively correlated with the waiting time and TAT. Resource utilization, from a laboratory’s perspective, is positively correlated with WIP and TAT because higher resource utilization corresponds to higher TAT and increased WIP [Citation49]. Increased material handling costs in terms of transport time will increase the TAT. Laboratory errors are positively correlated with cost and TAT, but negatively correlated with safety.
An important tradeoff has to be made when considering the investment in new resources. An additional resource can result in a reduction in TAT and can function as back-up in the event of downtime of a similar resource. However, an additional resource incurs investment costs and quality control costs. Whether potential performance improvements outweigh the cost should always be investigated.
Discussion
The importance of PIs for clinical laboratories is reflected in the large body of existing work [Citation1–7]. PIs are the foundation of process improvement and are therefore the basis of methods such as lean and mathematical optimization. Lean methodologies aim at improving efficiency by eliminating waste, i.e. non-value adding activities, and reducing the risk of errors in a process [Citation16,Citation37,Citation54]. Mathematical modeling has been used, for example, to optimally divide the workload and decrease TAT in the histopathology department [Citation67].
Selected PIs should reflect the laboratory’s performance goals and are essential in defining waste. This review aims at improving the knowledge on suitable laboratory PIs by showing that additional PIs can be adapted from the production processes literature. When comparing the top 10 PIs in the laboratory medicine literature with those from the production processes literature, we noticed that these sets are different. Six additional PIs, relating to the smoothness of the sample flow, were identified from the production processes literature. These are WIP, resource utilization, material handling cost, throughput, waiting time and maintenance/downtime. Laboratory management should consider integrating these two sets into clinical laboratories.
This review describes the most frequently cited PIs that are suitable for laboratories in terms of definition, measurability and impact. The relations between the described PIs are discussed but note that they can also affect PIs that were not described in this article. Laboratory errors can, for example, increase the sample rejection and recollection rate, which in turn can decrease patient satisfaction and increase TAT [Citation39]. PIs focusing on analytical quality are not in the scope of this article. Included errors, such as sample hemolysis, decrease the quality of laboratory results. However, by participation of a laboratory in external proficiency testing programs, analytical quality of results can be monitored and improved.
Even though the testing process in a clinical laboratory can be seen as a production process, there are differences in how these two fields optimize their processes. However, in recent years clinical laboratories have also been applying lean principles, which are improvement methods that were developed for manufacturing industries [Citation68]. The difference in how a process is improved in the laboratory medicine literature and in the production processes literature can be illustrated by considering the PI TAT. TAT is important in both fields as it is often used as a benchmark for performance. However it is important to note that TAT of itself is less indicative than PIs such as sample hemolysis and resource utilization. A high TAT indicates unsatisfactory performance, but does not directly pinpoint any source of inefficiency. As depicted in , the described pre-analytical errors can lead to a higher TAT. Similarly, high WIP, low throughput, long waiting times and downtime correspond to higher TAT. Improving laboratory performance by reducing the error rate is common practice in laboratory medicine, which is shown in . On the other hand, the PIs in relate to the amount of congestion, which causes unnecessary delay in the process. Furthermore, error-related PIs are more patient-based, while the congestion-related PIs are more population-based. Laboratory staff can immediately act upon a laboratory error, in which proper guidelines, quality checks and suitable equipment can be used to decrease errors. However, congestion-related improvements require a comprehensive process redesign, possibly requiring an underlying mathematical model to determine the optimal setting.
Despite the importance of PIs, a survey conducted in the UK shows that only a few laboratories collect pre-analytical error data on a regular and extensive basis [Citation28]. Sciacovelli et al. [Citation69] claim that even though many laboratory professionals believe that the use of PIs benefits the testing process, it remains challenging to maintain the long-term interest of the staff and to continue collecting data in a standardized and systematic way. Automation of laboratory services and the increasing capabilities of laboratory information systems can decrease the data registration burden. However, the implementation of automation projects can be challenging due to the inability to properly assess laboratory performance and needs [Citation70], and here too PIs play an important role. Relevant PIs could be implemented in the laboratory information system and then visualized on a dashboard within the laboratory. Insights into the actionable PIs and the current state of the laboratory can, for example, aid in the prediction of the TAT of a sample.
A laboratory can tailor each described PI definition to address its needs. Examples are the two chosen steps in the diagnostic process for TAT measurement and the chosen cutoff index for sample hemolysis. The quantitative analysis of a PI strongly depends on how it is defined. The chosen definition can depend, among others, on the type of tests performed, the laboratory’s needs and the capabilities of the laboratory’s equipment and information system. Take again, for example, sample hemolysis and TAT. Sample hemolysis can be uncovered by visual inspection or the use of automated serum indices, depending on the available laboratory equipment. For the latter case, the chosen cutoff value for sample rejection is often based on the hemolysis index provided by the manufacturer of the analyzer or the laboratory’s own rules [Citation71]. Unfortunately, this is not a harmonized value [Citation71]. For the analysis of TAT there are several possible start and end times, some of which are listed in Steindel et al. [Citation15] and Hawkins [Citation72], accompanied with how often each definition is used. Possible start times are “physician request” and “sample reception in lab”. Possible end times are “result reporting” and “physician acts on results”. The exact definition of TAT differs per laboratory, per physician, per discipline and possibly per type of test. Due to all these possible factors that can affect the exact definition of a PI, we see a lack of standardization in the literature. Therefore, we aim to provide a clear and general definition of each PI in this article.
In this review, a potential bias may have been introduced on the citation frequency of a PI by including the references of the initially included articles published in 2012 to 2017. The search strategy in this article is structured in such a way that emphasis is put on PIs that are currently important in laboratories. However, it is possible that these PIs are already well-studied in older literature. Unfortunately, this potential bias is inevitable.
Optimal laboratory configurations will be determined in future research through mathematical modeling. PIs that reflect the laboratory’s needs are necessary to define optimality. They are also required for performance assessment and to compare laboratory configurations. The use of suitable PIs will result in the identification of areas of improvement and potential workflow modifications.
Correction Statement
This article has been republished with minor changes. These changes do not impact the academic content of the article.
SUPPLEMENTAL_DATA_2_CritRevClinLabSci.docx
Download MS Word (162.9 KB)SUPPLEMENTAL_DATA_1_CritRevClinLabSci.docx
Download MS Word (13.9 KB)Acknowledgments
The authors thank Wichor Bramer, biomedical information specialist at Erasmus MC, for helping with the construction of the laboratory medicine search strategy.
Disclosure statement
The principal investigator (Yolanda de Rijke) serves on an advisory board for Roche Diagnostics. Although a financial conflict of interest was identified for management based on the overall scope of the project and its potential benefit to Roche Diagnostics, the research findings are not necessarily related to the interest of Roche Diagnostics.
Additional information
Funding
Related Research Data
References
- College of American Pathologists 2019-QTracks [cited 2019 Jul]. Available from: https://estore.cap.org/OA_HTML/ibeCCtpSctDspRte.jsp?section=10498&sitex=10020:22372:US
- IFCC: Quality indicators in laboratory medicine [cited 2018 Apr]. Available from: http://217.148.121.44/MqiWeb/Page_QualityIndicators.jsf
- Shahangian S, Snyder SR. Laboratory medicine quality indicators: a review of the literature. Am J Clin Pathol. 2009;131:418–431.
- Shcolnik W, de Oliveira CA, de Sao Jose AS, et al. Brazilian laboratory indicators program. Clin Chem Lab Med. 2012;50:1923–1934.
- NVKC. Kwaliteitsindicatoren klinische chemie; Overzicht indicatoren en toelichting 2016 [cited 2018 Sep]. Available from: https://www.nvkc.nl/sites/default/files/WIKOrapport191016.pdf
- Ruiz Morer R, Ibarz M, Llopis MA, et al. Quality indicators for extra-analytical processes in clinical laboratory: ten years’ experience. Rev Lab Clin. 2016;9:147–158.
- The Royal College of Pathologist. Key Performance Indicators for laboratory services: Recommendations from the Royal College of Pathologists 2013 [cited 2019 Apr]. Available from: https://www.rcpath.org/uploads/assets/uploaded/131d8206-d7be-4d9b-a29e4f90a35eba15.pdf
- Elnenaei MO, Campbell SG, Thoni AJ, et al. An effective utilization management strategy by dual approach of influencing physician ordering and gate keeping. Clin Biochem. 2016;49:208–212.
- Haskose A, Kingsman BG, Worthington D. Performance analysis of make-to-order manufacturing systems under different workload control regimes. Int J Prod Econ. 2004;90:169–186.
- Hon KKB. Performance and evaluation of manufacturing systems. CIRP Ann Manuf Technol 2005;54:675–690.
- Barth JH. Clinical quality indicators in laboratory medicine: a survey of current practice in the UK. Ann Clin Biochem. 2011;48:238–240.
- Ricós C, García-Victoria M, de la Fuente B. Quality indicators and specifications for the extra-analytical phases in clinical laboratory management. Clin Chem Lab Med. 2004;42:578–582.
- Hawkins R. Managing the pre- and post-analytical phases of the total testing process. Ann Lab Med. 2012;32:5–16.
- Plebani M, Sciacovelli L, Aita A, et al. Performance criteria and quality indicators for the pre-analytical phase. Clin Chem Lab Med. 2015;53:943–948.
- Steindel SJ, Howanitz PJ. Physician satisfaction and emergency department laboratory test turnaround time: observations based on College of American Pathologists Q-Probes studies. Arch Pathol Lab Med. 2001;125:863–871.
- White BA, Baron JM, Dighe AS, et al. Applying Lean methodologies reduces ED laboratory turnaround times. Am J Emerg Med. 2015;33:1572–1576.
- Lou AH, Elnenaei MO, Sadek I, et al. Evaluation of the impact of a total automation system in a large core laboratory on turnaround time. Clin Biochem. 2016;49:1254–1258.
- Rizk MM, Zaki A, Hossam N, et al. Evaluating laboratory key performance using quality indicators in Alexandria University Hospital Clinical Chemistry Laboratories. J Egypt Public Health Assoc. 2014;89:105–113.
- Steindel SJ, Jones BA, Howanitz PJ. Timeliness of automated routine laboratory tests: a College of American Pathologists Q-Probes study of 653 institutions. Clin Chim Acta. 1996;251:25–40.
- Holland LL, Smith LL, Blick KE. Reducing laboratory turnaround time outliers can reduce emergency department patient length of stay: an 11-hospital study. Am J Clin Pathol. 2005;124:672–674.
- Cole GW. Biochemical test profiles and laboratory system design. Hum Pathol. 1980;11:424–434.
- Agarwal R, Chaturvedi S, Chhillar N, et al. Role of intervention on laboratory performance: evaluation of quality indicators in a tertiary care hospital. Ind J Clin Biochem. 2012;27:61–68.
- Adcock DM, Favaloro EJ, Lippi G. Critical pre-examination variables in the hemostasis laboratory and their quality indicators. Clin Biochem. 2016;49:1315–1320.
- D'Angelo R, Zarbo RJ. The Henry Ford production system: measures. Am J Clin Pathol. 2007;128:423–429.
- Rutledge J, Xu M, Simpson J. Application of the Toyota Production System improves core laboratory operations. Am J Clin Pathol. 2010;133:24–31.
- Le RD, Melanson SEF, Santos KS, et al. Using Lean principles to optimise inpatient phlebotomy services. J Clin Pathol. 2014;67:724–730.
- Renna P. Maintenance policy in job-shop manufacturing systems with reminder cell. Ijsom. 2016;24:459–483.
- Cornes MP, Atherton J, Pourmahram G, et al. Monitoring and reporting of preanalytical errors in laboratory medicine: the UK situation. Ann Clin Biochem. 2016;53:279–284.
- Begum F. A study of preanalytical errors in a hospital based clinical biochemistry laboratory and formulation of measures for correction. Int J Bioassays. 2014;3:3270–3275.
- Jafri L, Khan AH, Ghani F, et al. Error identification in a high-volume clinical chemistry laboratory: five-year experience. Scand J Clin Lab Invest. 2015;75:296–300.
- Chawla R, Goswami B, Singh B, et al. Evaluating laboratory performance with quality indicators. Lab Med. 2010;41:297–300.
- Sakyi AS, Laing EF, Ephraim RK, et al. Evaluation of analytical errors in a clinical chemistry laboratory: a 3 year experience. Ann Med Health Sci Res. 2015;5:8–12.
- Jiang Y, Jiang H, Ding S, et al. Application of failure mode and effects analysis in a clinical chemistry laboratory. Clin Chim Acta. 2015;448:80–85.
- Kulkarni S, Ramesh R, Srinivasan AR, et al. Evaluation of preanalytical quality indicators by Six Sigma and Paretòs Principle. Indian J Clin Biochem. 2018;33:102–107.
- Fei Y, Kang F, Wang W, et al. Preliminary probe of quality indicators and quality specification in total testing process in 5753 laboratories in China. Clin Chem Lab Med. 2016;54:1337–1345.
- CAP. 2017 surveys and anatomic pathology education programs [cited 2018 Aug]. Available from: http://www.cgikk.com/CAP-2017-Media/2017-surveys-catalog.pdf
- Michael CW, Naik K, McVicker M. Value stream mapping of the pap test processing procedure: a lean approach to improve quality and efficiency. Am J Clin Pathol. 2013;139:574–583.
- Pawan AT, Seema PT, Rita MS, et al. An interventional study on total testing process of clinical chemistry laboratory of a tertiary care teaching hospital. Int J Med Res Health Sci. 2017;6:79–85.
- Cao L, Chen M, Phipps RA, et al. Causes and impact of specimen rejection in a clinical chemistry laboratory. Clin Chim Acta. 2016;458:154–158.
- Li HY, Huang XN, Yang YC, et al. Reduction of preanalytical errors in clinical laboratory through multiple aspects and whole course intervention measures. J Evid Based Med. 2014;7:172–177.
- Hawker CD, Roberts WL, Garr SB, et al. Automated transport and sorting system in a large reference laboratory: Part 2. Implementation of the system and performance measures over three years. Clin Chem. 2002;48:1761–1767.
- Banks P, Brown R, Laslowski A, et al. A proposed set of metrics to reduce patient safety risk from within the anatomic pathology laboratory. Lab Med. 2017;48:195–201.
- Kirchner MJ, Funes VA, Adzet CB, et al. Quality indicators and specifications for key processes in clinical laboratories: a preliminary experience. Clin Chem Lab Med. 2007;45:672–677.
- Lote R, Williams EJ, Ülgen OM. Simulation of medical laboratory operations to achieve optimal resource allocation. Conference Paper Presented at: Proceedings of European Conference on Modelling and Simulation; 2009 Jun 9–12; Madrid, Spain. p. 249–255.
- Onyenekwu CP, Hudson CL, Zemlin AE, et al. The impact of repeat-testing of common chemistry analytes at critical concentrations. Clin Chem Lab Med. 2014;52:1739–1745.
- Kadi D, Kuvvetli Y, Colak S. Performance analysis of a university hospital blood laboratory via discrete event simulation. Simul. 2016;92:473–484.
- Rossetti MD, Kumar A, Felder RA. Mobile robot simulation of clinical laboratory deliveries. Proceedings of the 1998 Winter Simulation Conference; 1998 Dec 13–16; Washington, USA. p. 1415–1422.
- Ramli R, Cheng KM, editors. A combined approach of simulation and analytic hierarchy process in assessing production facility layouts. IAP Proceedings 2014;1605:1092. ICCMSE 4-7 April 2014, Athens, Greece.
- Scholz-reiter B, Toonen C, Lappe D. Impact of market dynamics on performance and internal dynamics of job-shop systems. Int J Syst Appl Eng Dev. 2011;5:5–544.
- Dallery Y, Gershwin SB. Manufacturing flow line systems: a review of models and analytical results. Queueing Syst. 1992;12:3–94.
- Sagawa JK, Nagano MS. Modeling the dynamics of a multi-product manufacturing system: a real case application. Eur J Oper Res. 2015;244:624–636.
- Little J. Little's Law as viewed on its 50th anniversary. Oper Res. 2011;59:536–549.
- Yang T, Wang TK, Li VC, et al. The optimization of total laboratory automation by simulation of a pull-strategy. J Med Syst. 2015;39:162.
- Hayes KJ, Reed N, Fitzgerald A, et al. Applying lean flows in pathology laboratory remodelling. J of Health Org and Mgt. 2014;28:229–246.
- Smith ML, Wilkerson T, Grzybicki DM, et al. The effect of a Lean quality improvement implementation program on surgical pathology specimen accessioning and gross preparation error frequency. Am J Clin Pathol. 2012;138:367–373.
- YörükoĞlu K, Özer E, Alptekin B, et al. Improving histopathology laboratory productivity: process consultancy and A3 problem solving. Turk Patoloji Derg. 2017;33:47–57.
- Kumar V, Verma P, Onkar, et al. Facility and process layout analysis of an SME using simulation: A case study of a manufacturing company. Conference Paper Presented at: International Conference on Industrial Engineering and Operations Management. 2016 Mar 8–10, Kuala Lumpur, Malaysia. p. 1294–1304.
- Jung S. Facility siting and plant layout optimization for chemical process safety. Korean J Chem Eng. 2016;33:1–7.
- Adeyeri MK, Mpofu K, Ayodeji SP, et al. Animated simulation of pilot soya beans oil production process plant. Proceedings of the IASTED International Conference Modelling and Simulation (AfricaMS 2014); 2014 Sep 1–3, Gaborone, Botswana. p. 161–168.
- Drira A, Pierreval H, Hajri-Gabouj S. Facility layout problems: a survey. Annu Rev Control. 2007;31:255–267.
- Modrak V, Soltysova Z, Bednar S. Performance evaluation of layout designs by throughput rate and operational complexity. Procedia CIRP. 2017;62:175–180.
- Denkena B, Dengler B, Doreth K, et al. Interpretation and optimization of material flow via system behavior reconstruction. Prod Eng Res Devel. 2014;8:659–668.
- Couchman A, Jones DI, Griffiths KD. Predicting the future performance of a clinical biochemistry laboratory by computer simulation. Simul Model Pract Th. 2002;10:473–495.
- Han K, Cho S, Yoon ES. Optimal layout of a chemical process plant to minimize the risk to humans. Procedia Comput Sci. 2013;22:1146–1155.
- Azadeh A, Nazari T, Charkhand H. Optimisation of facility layout design problem with safety and environmental factors by stochastic DEA and simulation approach. Int J Prod Res. 2015;53:3370–3389.
- Price CP, St John A. The real value of laboratory medicine. Jrnl App Lab Med. 2016;1:101–103.
- Leeftink AG, Boucherie RJ, Hans EW, et al. Predicting turnaround time reductions of the diagnostic track in the histopathology laboratory using mathematical modelling. J Clin Pathol. 2016;69:793–800.
- Zarbo RJ, Tuthill JM, D'Angelo R, et al. The henry ford production system reduction. Am J Clin Pathol. 2009;131:468–477.
- Sciacovelli L, Lippi G, Sumarac Z, et al. Quality indicators in laboratory medicine: the status of the progress of IFCC Working Group “Laboratory Errors and Patient Safety” project. Clin Chem Lab Med. 2017;55:348–357.
- Hawker CD. Laboratory automation: total and subtotal. Clin Lab Med. 2007;27:749–770.
- Petinos P, Gay S, Badrick T. Variation in laboratory reporting of Haemolysis - a Need for Harmonisation. Clin Biochem Rev. 2015;36:133–137.
- Hawkins RC. Laboratory turnaround time. Clin Biochem Rev. 2007;28:179–194.