
 ?Mathematical formulae have been encoded as MathML and are displayed in this HTML version using MathJax in order to improve their display. Uncheck the box to turn MathJax off. This feature requires Javascript. Click on a formula to zoom.
Abstract
Urine drug testing is one of the objective tools available to assess adherence. To monitor adherence, quantitative urinary results can assist in differentiating “new” drug use from “previous” (historical) drug use. “Spikes” in urinary concentration can assist in identifying patterns of drug use. Coupled chromatographic-mass spectrometric methods are capable of identifying very small amounts of analyte and can make clinical interpretation rather challenging, specifically for drugs that have a longer half-life. Polypharmacy is common in treatment and rehabilitation programs because of co-morbidities. Medications prescribed for comorbidities can cause drug-drug interaction and phenoconversion of genotypic extensive metabolizers into phenotypic poor metabolizers of the treatment drug. This can have significant impact on both pharmacokinetic (PK) and pharmacodynamic properties of the treatment drug. Therapeutic drug monitoring (TDM) coupled with PKs can assist in interpreting the effects of phenoconversion. TDM-PKs reflects the cumulative effects of pathophysiological changes in the patient as well as drug-drug interactions and should be considered for treatment medications/drugs used to manage pain and treat substance abuse. Since only a few enzyme immunoassays for TDM are available, this is a unique opportunity for clinical laboratory scientists to develop TDM-PK protocols that can have a significant impact on patient care and personalized medicine. Interpretation of drug screening results should be done with caution while considering pharmacological properties and the presence or absence of the parent drug and its metabolites. The objective of this manuscript is to review and address the variables that influence interpretation of different drugs analyzed from a rehabilitation and treatment programs perspective.
1. Introduction
Urine drug testing (UDT) was first reported in 1965 when Dole and Nyswander introduced methadone as a treatment for heroin use and abuse. They monitored for the presence of methadone in urine using cation exchange resin paper followed by thin-layer chromatography [Citation1]. Since then, there have been significant advancements in the analytical techniques [Citation2]. Coupled chromatographic methods using tandem mass spectrometry (MS) are almost de rigueur today. Despite the technological advancement in detecting drugs, clinical drug interpretation has remained stagnant. There is a general lack of pharmacokinetic (PK) information that is needed for proper result interpretation.
In the clinical laboratory, drug testing is requested (i) to identify drugs in emergency department patients and allow initiation of appropriate intervention; (ii) as a tool to monitor drug use and adherence in treatment and rehabilitation programs (e.g. opiate dependency and pain management programs); (iii) to monitor medicinal agents prescribed for therapeutic reasons (therapeutic drug monitoring (TDM)) and; (iv) to identify drug use in the workplace (i.e. workplace drug testing). Each of these programs has a different objective as well as different technological and analytical requirements.
One of the advantages offered by UDT is that it is one of the more objective tools available for tracking patient adherence to treatment, and it can expose possible drug abuse and misuse. Therefore, UDT is an important step toward establishing and maintaining safe and effective use of opioid analgesics in the treatment of chronic pain [Citation3]. While UDT techniques measure the presence of drugs, it does not provide information to clinicians on how much drug was taken, when it was taken, or for how long after use will the drug screen give positive results. Nevertheless, UDT has become a defacto part of standard of care in rehabilitation and treatment programs.
Guidelines vary in their recommendations for UDT [Citation4], and surprisingly little is known about risk factors for aberrant results [Citation5]. Thus, it is not surprising that, in a systematic literature review, Dupouy and colleagues [Citation6] questioned the utility of UDT and concluded that pragmatic intervention studies are necessary to demonstrate the usefulness of UDT.
Before we can discuss interpretation, it is important to address the advantages and the limitations of biomatrices and drug testing methods. Not only the analytical method, but also the pharmacological properties of the drug, have a significant impact on the interpretation of the results and need to be considered. The authors call this the “pharmacological” approach in interpreting drug testing results.
This review is the result of many questions that have been received from peers and attending physicians regarding the interpretation of toxicology screening results. Herein, we report responses to these simple and complex questions in combination with summaries of related topics, supported by many years of work in this field. The objective of this manuscript is to review and address the practical issues that Laboratory Directors face in interpreting results obtained during analysis of biomatrices from patients in rehabilitation and treatment programs. Unless otherwise stated, most of the data presented here were obtained in the author’s (BMK) laboratory. To simplify, we have divided this manuscript it into three parts:
Part I: Review of Biological Matrices and Analytical Techniques used in Drug Analysis
Part II: Variables that influence Interpretation of UDT Analytical Results and
Part III: Drugs of Abuse and Pain Management
2. Part I: review of biological matrices and analytical techniques used in drug analysis
2.1. Biomatrices
The objective of this section is to review the different biomatrices and analytical methods used to analyze the various drugs tested in the toxicology laboratory and to briefly review variables that influence drug concentration and therefore, result interpretation. An in-depth discussion of the variables that influence result interpretation in the context of UDT will follow in Part II.
Blood, along with urine, is one of the most commonly used biofluids in drug analysis; however, advances in analytical technology have led to an increased use of alternative matrices, such as oral fluid, meconium, dry blood spots, hair, and nails, to detect drug use. The latter two matrices are useful in providing historical information. Cord blood, meconium, and newborn hair are of interest in addressing neonatal exposure to drug use during pregnancy. This manuscript will address these biomatrices as they are now used and gaining prominence in clinical/toxicology laboratories.
2.1.1. Blood (serum/plasma)
One of the primary issues with blood is that it must be obtained by an invasive procedure and is available only in small volumes. Immunoassays (IAs), using small volumes, are only available for few drugs that have TDM protocols. The concentration of drug(s) is generally low and requires a higher level of sophistication in the analytical protocol. The growth in the number of coupled chromatographic-MS instruments in clinical laboratories affords an enormous opportunity in developing new drug assays where IAs are not available. Expanding new drug assays and their interpretation is an opportunity for the clinical laboratory scientist that can have a significant impact on personalized medicine and patient care.
Analytically, the assay results can be both accurate and precise, but there are a number of variables that affect blood drug concentration and subsequent interpretation. Some of the significant variables that effect serum drug concentrations include noncompliance of the patient, drug-drug interactions, pathophysiological changes (kidney and liver disease), altered protein binding, and genetics (phenoconversion of fast and slow metabolizers).
Drug-drug interactions can result in the inhibition or induction of drug metabolizing enzymes, cytochrome P450 amongst others, and can significantly change the elimination half-life of the drug and the corresponding blood concentrations. Medications prescribed for co-morbidities can cause drug-drug interaction and phenoconversion. Phenoconversion is when a genotypic extensive metabolizer is converted into a phenotypic poor metabolizer of a drug, thereby modifying the drug’s PK and pharmacodynamic response [Citation7], which may ultimately result in toxicity.
A significant number of drugs are bound to albumin (primarily acidic drugs) and α-1-acid glycoprotein (AGP) (primarily basic drugs) [Citation8]. AGP is an acute phase protein and its concentration increases several fold during an acute phase response to trauma, as well as pathophysiological conditions like inflammation, infection, and pregnancy amongst others. This increase in plasma concentrations of AGP can alter the ratio of unbound (i.e. free) and bound drug, resulting in an increase in the proportion of bound drug with a corresponding decrease in free drug concentration. This change can be clinically significant for highly bound drugs, such as methadone, as it is the free drug that crosses the blood-brain barrier and is pharmacologically active. In the case of methadone, a decrease in the free drug concentration will cause withdrawal symptoms to appear and dose adjustment will be required.
Protein binding, pathophysiology, genetics, as well as drug-drug interactions can have significant impacts on the interpretation of the clinical results. Both renal and hepatic dysfunction can also adversely affect plasma drug concentrations. Drugs that are eliminated through the kidney, such as digoxin, can accumulate in plasma resulting in an increased plasma level and toxicity.
Most laboratories measure total drug concentration and not free drug concentration. Total drug concentration does not reflect any change in the ratio between free and bound drug. This is a significant issue in interpreting serum/plasma concentrations of drugs. An increase or decrease in free drug concentration can result in either toxicity or an ineffective clinical response. Both of these may require dose adjustment. Changes in free drug concentration can result in significant clinical consequences affecting both the PK and pharmacodynamic response of the drug. To illustrate the significance of protein binding consider tacrolimus, a transplant immunosuppressant, and glyburide, a sulfonylurea used to treat Type II diabetes. Both drugs are highly protein bound (>98%). The pharmacologically active free drug component of these drugs is <2%. Thus, any changes in protein binding can change the free to bound drug ratio and have a profound pharmacodynamic effect, as the free drug concentration can fluctuate by ±50%. Free drug concentrations can be measured by determining the concentration of drug in a plasma ultra-filtrate, through an appropriate filter or by equilibrium dialysis across a semi permeable membrane. Since, for most drugs, it is the unbound fraction that is pharmacologically active, measuring this fraction in our laboratories may be more useful [Citation9].
2.1.2. Urine
When identifying unknown drugs in a patient, urine is the matrix of choice. It is readily available in larger volumes, contains metabolites, and requires a less invasive collection procedure compared to blood collection. In addition, both the parent drug and metabolites are usually present in higher concentrations. The amount of drug excreted in urine and its detection period () is limited by variables that affect blood concentration, such as drug-drug interactions, drug-disease interactions, and genetics. In addition to these, in vivo dilution, dose, urine pH, pKa of the drug, lag time between drug/medication administration, and sample void are significant variables that will influence the amount excreted in urine. A major limitation of urine samples is that they can only provide a snapshot of the amount of drug present at the time of sample collection.
Table 1. Drug half-lives and approximate urine detection periods.
Opioids and benzodiazepines undergo extensive glucuronidation and/or sulfation resulting in the production of conjugated metabolites that can be difficult to detect by IA or MS. To overcome this, many laboratories hydrolyze urine as part of their pre-analytical procedure. Acid, alkaline, and enzymatic hydrolysis has been evaluated by various authors [Citation10–13]. The enzymatic method is time consuming with incubation times ranging from 15 min to 24 h, leading to a longer turn-around-time. Longer incubation times at higher temperatures greater than 50 °C lead to analyte degradation and in turn inaccurate reporting. Acid hydrolysis, although quicker, can degrade drugs such as benzodiazepines and opioids (hydrocodone to hydromorphone or oxycodone to oxymorphone) and again lead to inaccurate reporting. Acid hydrolysis is also of concern for the detection of 6-mono-acetylmorphine (6-MAM) as it is de-acetylated and converted to morphine, thus, impeding the detection of heroin in patient urine samples. Acid hydrolysis also requires the laboratory to utilize equipment that is capable of detecting analytes at a much lower level due to incomplete hydrolysis. Thus, prior to implementing the hydrolysis protocol, laboratories need to assess if their method can detect the parent/metabolite at their suggested cutoffs. Hydrolysis can have an impact on clinical interpretation as the method can influence the amount of drug present and detected in the urine sample.
Urine samples should be collected under supervision/observation to prevent specimen substitution and in vitro addition of adulterants to the specimen. Drinking copious amount of fluids is one of the common methods of adulteration, although this can be detected by measuring urine creatinine (UCr) and specific gravity (SpGr). Various methods to detect tampered samples have been described in literature [Citation14–17] and are now used in toxicology laboratories to identify manipulated samples [Citation14,Citation18,Citation19]. Drug testing clinical laboratories use synthetic urine to make controls, which are unfortunately now commercially sold and can be used to “fool” a positive drug test [Citation14,Citation20].
2.1.3. Hair
Unlike blood and urine, which can only provide a “snapshot” at the time of sampling, hair provides a historical picture of drug use in previous weeks or months depending on the length of hair. Besides forensic use, this biological matrix can be used to detect drug use that occurred during pregnancy, as the drugs are incorporated into the neonate’s hair [Citation21]. Hair can be segmented to examine drug exposure within a particular time window of interest, generally in months, although detection of a drug in multiple consecutive segments does not necessarily mean multiple exposures [Citation22].
Hair grows at approximately 1 cm/month (0.96–1.38 cm/month) [Citation23,Citation24], although this varies depending on age, gender, overall health, diet, hormones, ethnicity, race, location on scalp, seasonal change, and climate. In addition, trauma, stress, and anxiety all affect hair growth primarily because they decrease the blood and oxygen supply to the scalp, which is essential to healthy hair growth. The preferred site to sample hair is the posterior vertex where there is minimal variability between hair strands. Once the drugs or metabolites are incorporated into the hair, they do not undergo further metabolism or degradation.
There are a number of limitations to the use of hair as a matrix. In 1990, David N. Bailey [Citation25]. wrote in an editorial in JAMA “While, at first glance, this practice may seem to be an efficacious one, it likely will not become standard for some time, if at all”. Although this matrix has been in use for over a decade, there is a lack of standardizations in pre-analytical protocols for samples pretreatment and handling [Citation26,Citation27]. Proficiency testing schemes, an important component in toxicology laboratories, are also lacking. Since many of the illicit drugs can be smoked, false positive test results may occur from passive exposure of the hair to vaporized drugs in the environment. The ability to differentiation between systemic exposure and external contamination is still being debated. Interpretation due to “endogenous” external contamination caused by sweat and sebum is still a challenge [Citation28]. Tsanaclis and colleagues [Citation28] state “False positives due to external contamination of hair samples pose a significant problem to the interpretation of results. Whilst it is likely that most external contamination is removed by washing the hair sample prior to analysis, complete removal of external contamination cannot be ensured, whichever wash protocol is used”. Drug incorporation is also affected by hair treatments, such as hair bleaching, conditioners, and the use of hair sprays [Citation29]. If the hair wash products contain ethanol, they can produce false positive results for fatty acid ethyl esters (FAEEs), which is a biomarker for fetal alcohol spectrum disorder (FASD) [Citation30]. Thus, only laboratories proficient in both analysis and interpretation of the results should consider offering hair analysis [Citation31].
2.1.4. Cord blood and umbilical cord tissue
Drugs administered to pregnant women have the potential to cross the placenta and reach the fetus.
Measuring concentrations in fetal blood or amniotic fluid can be indicative of trans-placental passage of drugs and metabolites during pregnancy. An alternative matrix for monitoring in utero drug exposure is umbilical cord tissue [Citation32]. Testing umbilical cord tissue enables analysis to occur immediately after birth; in contrast to meconium testing that is delayed up to three days prior to specimen availability. Umbilical cord is easily and noninvasively collected and may reflect a long window of drug detection; however, because there have been few studies of cord tissue to date, it is difficult to interpret results.
2.1.5. Meconium
Meconium is formed by the fetus as early as the 12th week of gestation. It is comprised of intestinal epithelial cells, mucus, amniotic fluid, bile, and water that are ingested by the fetus in utero during the entire pregnancy. Throughout the pregnancy, different xenobiotics that the mother may have ingested or used are deposited in the meconium, either directly from bile secretion or from fetal swallowing of amniotic fluid which contains the xenobiotics that are excreted via the fetal urine [Citation33,Citation34]. The use of this matrix to assess a fetus’ exposure to illicit drugs or over the counter medications is relatively new and considered as the gold standard for neonatal drug testing. Blood and urine cannot accurately assess a fetus’ exposure as drugs must first cross the placenta and are prone to both maternal and fetal metabolism. The advantage of meconium is that it represents fetal tissue and is a direct measure of fetal exposure. Unlike blood or urine, which only provides evidence of acute exposure, meconium provides information on xenobiotics, which accumulate even if the exposure is low and occurs repeatedly over time. Further, there is over 90% concordance for all drugs tested between meconium and cord blood, indicating that it is an important biofluid that can be used to rule out in utero exposure. While both umbilical cord tissue and meconium are used to confirm in utero substance exposure, the results are not necessarily equivalent [Citation35].
There are several challenges to this matrix. Meconium collection can prove to be difficult for several reasons. The sample size may not be sufficient for analysis, especially if the meconium is excreted in utero or prior to a physician ordering any tests. To obtain all of the meconium, it must be collected several times as it is expelled in stages and not all at once. Samples excreted later in the postpartum period can lead to false positive test results for FAEEs [Citation36]. With respect to testing, obtaining a truly homogenous mixture can be challenging. The sample is heterogeneous and must be mixed to obtain a homogenous mixture and this can be difficult as the meconium is “sticky” and will adhere to the collection tube as well as any utensils used to mix it. Sample preparation and extraction protocols developed for other biomatrices are not easily transferable for this “sticky” matrix. Samples need to be refrigerated as quickly as possible to prevent analyte degradation and to preserve stability of the drugs and metabolites. Drugs are stable for at least nine months if stored at −15 °C [Citation37]. To prevent drug loss, the specimen can be suspended in an organic solvent such as buffered methanol for up to 72 h at room temperature. Interpretation of results can be challenging as any medication given to the newborn prior to meconium passage will also be detected [Citation38].
Given the complexity of this sticky and heterogeneous matrix, testing should be performed only by laboratories proficient in both analysis and interpretation of the results.
2.1.6. Saliva (oral fluid)
Saliva is a noninvasive alternative to blood that presents fewer possibilities for adulteration compared with urine specimens. Saliva is the ultra-filtrate of plasma and thus drug concentrations are generally lower than in plasma or serum.
Saliva is an acidic (pH 6–7.5) biological fluid composed of secretions from the salivary glands. Bicarbonate, phosphate, and protein buffers help to maintain the pH range within the mouth. Saliva is approximately 99% water, 0.3% protein (mostly enzymes), and 0.3% mucin with the balance being salts. Ninety percent of the saliva is produced in the parotid, submandibular, and sublingual glands. The remaining 10% is produced by the salivary glands, distributed in the labial, buccal, lingual, and palatal areas of the oral mucosa [Citation39,Citation40]. Oral fluid (OF) is the collection of saliva and other debris from food and other items in the oral cavity.
Drugs and metabolites distribute rapidly to salivary glands and passively diffuse into saliva within minutes of drug administration. Since saliva is an ultra-filtrate, only the free or unbound fraction of the drug is excreted by the salivary gland into the saliva [Citation41,Citation42]. Physiochemical characteristics of the drug, such as molecular weight, lipophilicity, plasma drug-protein binding, and drug pKa amongst others, influence diffusion into saliva. If the pKa for a basic drug is ≥8.5 and ≤5.5 for an acidic drug, or the drug is nonionic, then the salivary pH has no effect on the passive diffusion, however, many drugs have a pKa close to 8.5 [Citation43]. Drug levels can fluctuate dramatically because of changes in saliva pH. Depending on the pKa, drugs may or may not be excreted in saliva. P-glycoprotein, a transport protein present in salivary glands, may also hinder transport of some drugs (e.g. methadone).
Although the mouth produces between 0.75–1.5 L of saliva per day, a number of conditions can cause dry mouth or xerostomia [Citation44] and reduce this output by 50% or more. This is often a side effect of physiological factors, illicit drug use, and prescription or over the counter medications [Citation45].
A wide variety of devices to collect saliva (OF), including passive drool and expectoration (with or without stimulation), are now available [Citation46]. Food and agents such as citric acid candy and chewing gum will inevitably change the pH and concentration of drug in the OF, lowering drug concentration by many folds [Citation47]. Drugs can also adsorb onto the collection device. Cannabinoids are particularly susceptible to drug adsorption [Citation46,Citation48]. Wide inter-individual variability of saliva pH is the likely explanation for the inconstancy of saliva to plasma concentration ratios for ionized drugs [Citation49]. Although significant correlation has frequently been observed between OF and plasma or blood concentrations, there is high intra-subject and inter-subject variability [Citation46]. This variability does not allow for the prediction of blood concentrations from OF concentrations.
2.1.7. Dry blood spots
Dry matrix was first described in 1913 by Ivar Bang [Citation50] to estimate blood glucose concentration. In 1963, Guthrie [Citation51] used a blotting paper to test for phenylketonuria and subsequently called it Dry Blood Spot (DBS) test. His technique of blood sampling is now widely used to obtain DBS for newborn screening. In 2002, Schütz and colleagues [Citation52] combined DBS sampling with gas chromatography (GC)- MS detection to show its utility in forensic cases where only small sample volumes or bloodstains were available. Since the initial DBS report, there have been significant advances in DBS technology, which is reflected in the increase in the number of publications, although there still remain many challenges in its implementation [Citation53].
DBS as a qualitative adherence tool in clinical practice is useful, however, quantitative assessment of analytes still needs careful review and validation [Citation54]. All DBS samples are extracted and then analyzed using GC or liquid chromatography (LC) coupled with MS methods. DBS coupled with LC/GC-MS has been used for a myriad of analytes from drugs of abuse (DOA) to PK studies to antiretroviral studies [Citation55–58].
A significant limitation to DBS technology is hematocrit (HCT) and the introduction of the internal standard, a requirement of all chromatographic methods. The HCT impact on DBS analysis is likely due to the differences in viscosity. DBS size decreases with increasing blood viscosity. Red blood cell-to-plasma ratio is directly related to the analyte concentration as blood viscosity will dictate the amount of sample in the spot and can result in decreased analyte concentrations with extracted samples [Citation59]. Although the impact of HCT is well established, the variability resulting from this phenomenon is not, and it remains the biggest challenge to more wide-spread adoption of DBS sampling in clinical practice [Citation54]. Recent advancements to address the effect of HCT include collecting and depositing a fixed volume of blood, regardless of the blood HCT, and analyzing the entire sample rather than a sub-aliquot (sub punch) [Citation60]. The advantages of DBS technology are that it can be automated and is not restricted to blood samples but can also be applied to other matrices such as dried serum, urine, and saliva spots [Citation61–63].
Each of the matrices discussed above have unique qualities that provide advantages in various settings, although they are not a replacement for blood or urine. Hair testing can assist in detecting both historical drug use as well as neonatal exposure to drugs during pregnancy. Meconium and cord tissue can also help in identifying maternal drug use primarily during the third trimester. Saliva/OF is a noninvasive method to detect recent substance use. Finally, DBS is an emerging matrix that can be useful when sample volume is an issue and can be applied to virtually any biomatrix.
2.2. Analytical methods
2.2.1. Enzyme immunoassay (EIA)
The principle of homogeneous IA was first described by Rubenstein and colleagues in 1972 [Citation64]. Its application as an Enzyme-Multiplied Immunoassay Technique (EMIT) for opiate (morphine) UDT was detailed by Schneider and colleagues in 1973 [Citation65]. Most IAs involve chemically linking antibodies or antigens with a label that is detectable because it either produces a color change in a solution, fluoresce under light, or because they can be induced to emit light or radiation. It is the change in signal that this laboratory method detects.
Enzyme IA (EIA) can be classified fundamentally into two different types of assays: heterogeneous and homogeneous. IA methods that require separation of the antibody-antigen complex are referred to as heterogeneous IAs while those that do not require separation are referred to as homogeneous IAs. The heterogeneous IAs include the enzyme-linked immunosorbent assay (ELISA), which is based on the same principles as a radioimmunoassay (RIA), another heterogeneous IA. In the heterogeneous IA, after incubation of the antigen with the antibody(ies), the antigen–antibody complexes that are formed are separated from free antigen and antibody(ies). This is accomplished by one of a number of different techniques and the activity in one or both of the fractions is determined. In the homogeneous IA, which are most commonly used in most toxicology laboratories, no such separation is required.
Some of the common EIA procedures include: EMIT, Cloned Enzyme Donor Immunoassay (CEDIA), Fluorescence Polarization Immunoassay (FPIA), and Kinetic Interaction of Microparticles in Solution (KIMS). EIA methods range from bedside or point-of-care tests (POCTs) to more sophisticated laboratory-based immunological methods. Because of simplicity of use, many DOA POCTs have found their way in physician offices and emergency rooms of hospitals. EIA techniques can provide fast and reliable results; however, the results must be interpreted with caution as false positives can and do occur [Citation66–68].
EIAs are very sensitive, and since drugs can be found in the urine for many days after last use, UDT has to be carefully setup so it can account for the requirements of the program(s) it is supporting. EIA procedures to detect DOA are commonly used because of ease of performance. They can be automated on routine chemistry instruments already familiar to the laboratory professionals. By contrast, the chromatographic procedures for detecting DOA generally require expensive equipment and specially trained staff. While easier to use, EIA procedures generally only screen for a limited number of drugs or drug “class”. This is a significant limitation as it cannot differentiate between different drugs within a specific group/class (e.g. differentiation of morphine from codeine in the opiates group, or amphetamine from methamphetamine or MDMA in the amphetamine group). Substances with similar chemical structures can cross-react to give false positive results, which is another limitation of EIA. A positive EIA result is therefore considered as a presumptive positive and requires the identification/confirmation of the specific drug present in the urine sample. Since false positives do occur, and all positive results need to be confirmed using GC-MS or LC-MS [Citation69].
Test results above or below the detection threshold are reported either as positive or negative, respectively. If the UDT is “negative”, the attending physician often interprets this as “drug screen negative”, implying that no drugs were present, despite the fact that only a limited number of drugs or a single class of drugs were screened for.
EIA procedures can often be more sensitive than chromatographic procedures since chromatographic procedures detect the individual drug/compound, whereas EIA detects total amount (drug + metabolite + cross-reacting substances). Typically, a positive test reflects total concentration of the parent drug + its metabolite(s) + interfering substance(s) present in the urine sample.
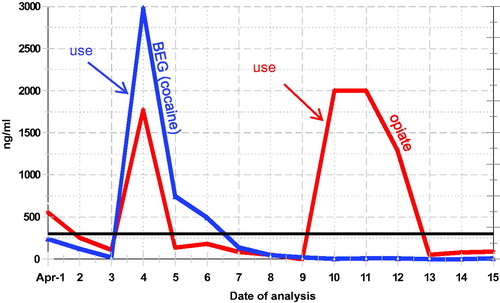
Clinical laboratories use calibrators and quality control samples to monitor EIA, and the laboratory instruments can and do provide “quantitative” results. However, urinary concentrations of excreted drugs are subject to many variables, such as dose, adherence, hydration, pH, half-life of the drug, clearance, drug-drug interaction, drug-disease interaction, genetic variations, patient’s pathophysiology and lag time between sample collection and drug intake. All of these can affect the amount of the drug and metabolite concentrations in urine and can result in a false negative finding [Citation70]. These variables make “quantitative” interpretation of the test result difficult, if not impossible. Therefore, these results are often referred to as semi-quantitative. EIA DOA calibration curves are typically curvy-linear and the linear dynamic range for EIA quantitation is narrow; this is a significant limitation of the DOA EIAs. For clinical follow-up of the most frequently encountered drugs in the region, a semi-quantitative result for the drug and/or its metabolite can be helpful; although urinary concentration cannot be related to amount of drug used or time of use. Frequent analysis following trends and “spikes” in concentration can provide information of continuous and potentially new use (). The authors have often detected “spikes” in benzodiazepine and benzoylecgonine (cocaine metabolite) concentration to identify specific days of use.
Figure 1. Cocaine and Opiate use profile. Following urine concentrations can show new drug use occurred.
False positive tests occur when a drug being tested is not present in the biofluid, but an interfering drug or substance is present that may cross-react with the reagents to give a positive signal. Thus, all presumed positive results should be confirmed by a chromatographic method. A false negative test occurs when the drug is present but is not found, either because the lower limit of detection (LOD) of the assay is set too high, or the absolute quantity of the drug in the specimen is below the LOD, as is often the case in diluted samples.
IAs have many limitations as described above that can result in false positive and false negative results. While interpreting urine IA results, it is imperative to understand the limitations of EIA. All positive results on IAs must be confirmed using a chromatographic (GC/LC/capillary electrophoresis (CE)-MS) method.
2.2.2. Chromatography
Before a sample can be submitted for chromatography, the analytes need to be extracted from the biomatrices. Liquid-liquid and Solid Phase Extraction (SPE) are the most common methods used to extract the analyte of interest from the biomatrices pre chromatography. In 1990, Arthur and Pawliszyn [Citation71] introduced Solid Phase Micro Extraction (SPME) as a method to extract analytes from various matrices. SPME is a miniaturized and solvent-free sample preparation technique for chromatographic-spectrometric analysis [Citation72]. Briefly in SPME procedure, a small diameter fiber is coated with a stationary phase and is placed in an aqueous sample or suspended above the sample (i.e. the head space). The vial is heated and the analytes partition into the stationary phase and are then thermally desorbed, on-column, in the injector of a gas chromatograph. SPME has been used in a wide range of analytical applications, including saliva, gaseous environmental, food, bioanalytical, and solid samples [Citation73–77]. In their Nature Protocols manuscript, Risticevic and colleagues [Citation73] describe the various analytical conditions required for the various matrices. Details on the pros and cons of various SPME procedures have been discussed by Pragst [Citation72].
New or novel psychoactive substances (NPS) introduced into the global drug market pose a significant risk to public health [Citation78–83]. An increasing number of these novel substances is appearing on the illicit market. Testing for these NPS or designer drugs (e.g. synthetic cathinones and cannabinoids) is challenging as there is a continual change in synthetic compounds. Analyses of these drugs require a chromatographic (GC/LC-MS) approach with new methods being reported in literature [Citation79]. However, the difficulties in interpreting the results of these NPS is highlighted by Gerostamoulos and coworkers [Citation84] in their Letter to the Editor with their comment “Unless our knowledge of the toxicity of these substances improves significantly through pharmacological studies, we simply should exercise caution when interpreting any concentration of an NPS regardless of the matrix in which it is measured”.
2.2.2.1. High performance liquid chromatography (HPLC)/gas chromatography (GC)
Both GC and high-performance liquid chromatography (HPLC) are separation methods used in toxicology laboratories. These methods can also be coupled with various types of detectors. For example, GC may be coupled with flame ionization detector (FID), electron capture (EC), nitrogen/phosphorous (NP), and MS, while HPLC may be coupled with ultraviolet, fluorescence, MS, and more. When GC or HPLC is coupled with an MS detector, these methods are both sensitive and specific and can help in the differentiation of opiates (e.g. morphine from codeine, 6-mono-acetyl-morphine, etc.). They can also separate the various antihistamines, tricyclic antidepressants, benzodiazepines, and methadone from its metabolite, 2-ethylidene-1-5-dimethyl-3,3-diphenylpyrrolidine (EDDP).
2.2.2.2. Capillary electrophoresis (CE)
CE was first described in 1981 by Jorgenson and Lukacs [Citation85] and is a relatively new separation technique compared to the traditional techniques such as HPLC or GC. Similar to these traditional methods, sample requirements for CE are minimal and it has also been interfaced with MS [Citation86]. A major advantage of CE over other separation techniques is its ability to separate both charged and non-charged molecules. CE has been used to separate peptides [Citation87] and small molecular weight biomolecules such as cathinone and its derivatives [Citation88]. Recently, DiBattista and colleagues [Citation89] described a high throughput CE-MS system to analyze DOA in urine samples. CE-MS provides attractive features that make it a viable and competitive alternative to other methods for use in toxicology laboratories.
2.2.3. Mass spectrometry (MS)
MS is an analytical chemistry technique that helps to identify the amount and type of chemical(s) present by ionizing chemical species and sorting the ions based on their mass-to-charge (m/z) ratio and the abundance of gas-phase ions. Therefore, MS can be used to detect and identify compounds or drugs of interest. The mass spectrometer as a detector has been coupled with different separation methods, including GC and HPLC and more recently with CE [Citation86]. GC-MS, CE-MS and LC-MS, as the names imply, are each a combination of two different techniques.
All mass spectrometers have an ion source, a mass analyzer, and an ion detector. The nature of these components varies based on the type of mass spectrometer, the type of data acquired, and the physical properties of the sample. Samples are introduced into the mass spectrometer in a liquid/gas or dried form and ionized by the ion source (e.g. electrospray ionization (ESI) and matrix-assisted laser desorption/ionization (MALDI)). The results are plotted as spectra of ion signal as a function of the m/z ratio of masses within a sample and can be used to elucidate the chemical structures of molecules [Citation90]. Commonly used mass analyzers include time-of-flight (TOF), quadrupoles, and ion traps, with each having specific characteristics. A number of different approaches, besides the ones listed above, are now being used in toxicology laboratories.
Tandem MS, also known as MS/MS or MSn, generally involves at least two stages of mass analysis. The ions formed in the first stage are separated by m/z ratio. This stage (MS1) is used to isolate a precursor ion. This precursor ion then undergoes, either spontaneously or by some activation, a fragmentation to yield product ions and neutral fragments. A second spectrometer (MS2) analyzes the product ions. Tandem MS offers further information about specific ions. In this approach, distinct ions of interest are selected based on their m/z ratio from the first round of MS and are then fragmented by one of a number of methods of dissociation, and this process can be repeated a number of times (MSn) [Citation91,Citation92]. If there are overlapping peaks (compounds) that are not separated by either of the separation methods, but have different molecular weight/structure, MSn can help in the resolution of these compounds. Mass spectral libraries are available to assist in the identification of the mass-spectrum.
2.2.3.1. High resolution mass spectrometry (HRMS)
The objective of a mass spectrometric analysis is to identify an analyte, particularly in the presence of other analytes. High-resolution mass spectrometry (HRMS) provides an accurate mass and has a higher number of significant figures (decimal points) in its resolution. Accurate mass measurement requires the highest possible mass resolution, to ensure that only a single elemental composition contributes to the mass spectral peak in question. The resolving power should be such that it can provide mass accuracy sufficient to assign a unique elemental composition from the spectral peak as is needed in the elucidation of the chemical structure [Citation90,Citation93]. Ramanathan and Korfmacher [Citation94] describe HRMS as “… with nominal mass accuracy, one can distinguish an analyte of 520 Da (nominal mass) from an analyte of 521 Da (nominal mass). With high mass accuracy, one can distinguish an analyte of 520.2000 Da (exact mass) from an analyte of 520.2371 Da (exact mass)”. HRMS also requires a higher level of sophistication of the interpreting scientist. LC coupled with high-resolution tandem MS (LC-HR-MS/MS) is considered as the reference method specifically for the detection and identification of NPS and untargeted toxicological screening [Citation95].
Ion suppression and matrix effects are significant in MS analysis. Ion suppression or enhancement caused by sample matrix, solvent, or LC-MS system components should be addressed while setting up MS assays. Studies should be performed using the desired matrix (i.e. plasma, urine, OF, DBS) and tested with analyte concentration in expected physiologic concentrations. If ion suppression is not assessed and corrected, it is possible that the target analyte may be undetected even when using very sensitive instrumentation [Citation96,Citation97]. Internal standards are routinely used in chromatography to monitor fluctuations in the analytical response that are caused by variations in experimental conditions. Since analytical protocols are standardized, monitoring changes in internal standard area-count can be helpful in detecting changes in the analytical procedure [Citation98,Citation99].
Coupled chromatographic-MS DOA methods are very sensitive and capable of identifying very small amounts of analyte making clinical interpretation rather challenging, specifically for drugs that have a longer half-life. Most of these chromatographic coupled assays are also capable of “seeing” endogenous substances that can make both identification and interpretation challenging and require highly trained staff to both operate and interpret the results.
Workplace drug testing: For workplace-related drug test results to stand up in a court of law, the test must be done by at least two different methods that employ different physiochemical principles. The laboratory protocol also requires “chain-of-custody” for the sample that is being processed. EIA is used to tentatively identify (presumptive positive) the drug class, while GC-MS is used to confirm and identify the specific drug. Currently GC-MS is considered to be the gold standard for confirmation and is the procedure of choice in workplace drug testing laboratories, although LC-MS/MS is gradually being introduced. For more information on workplace drug testing, please see SAMHSA: Mandatory Guidelines for Federal Workplace Drug Testing Programs [Citation100].
3. Part II: variables that influence interpretation of UDT analytical results
The objective of this section of the manuscript is to review and address the variables that influence interpretation of the analytical results from rehabilitation and treatment programs.
To help in the proper interpretation of laboratory results, communication between the laboratory and the clinician need to be established so that questions that are raised during analysis and interpretation of results can be appropriately addressed. A UDT program should be tailored to meet the requirements of the clinical program it is supporting. The program may require adjusting the detection cutoff and/or pre-analytical treatment (e.g. hydrolysis) of the urine sample. Questions that require addressing, such as the reason for drug testing, will dictate the biomatrices, analytical method, and sample pretreatment protocol. It is important to note that chromatographic procedures are capable of detecting a very small amount of drug and can make clinical interpretation challenging for drugs/medications with a long half-life (e.g. diazepam) or those are taken chronically.
In the clinical care environment, the primary question that a clinician needs addressed is patient compliance: “Is my patient adhering to their treatment program? I want to know if the positive test result is from old use or new use”. If the physician is following a patient’s adherence, then sequential urinary concentration of the drug and or metabolite can prove to be helpful () as it allows comparison between current and previous results. Following “spikes” and “trends” in the urine concentration can often identify when “new” drug use took place. If the patient is compliant in a rehabilitation treatment program, then the drug concentration of the abused drug MUST decline, although this decline may not be linear due to hydration and/or PK characteristics of the drug. The authors call this the “pharmacological” approach to monitoring adherence to a treatment program. A qualitative “positive” or “negative” result, by itself, does not allow for such an interpretation.
The interpretation of the analytical results needs to be carefully considered as there are many influencing variables, even a normal diet. For example, poppy seed ingestion [Citation101] can result in an analytically true positive opiate result, although it is a false positive for drug use. Other variables include urine SpGr and UCr, pH, Na and Cl, temperature, glutaraldehyde, nitrite, and fingerprinting. Another important consideration is sample tampering and adulteration.
The detection period of the drug depends on many variables. These include dosage, co-morbidities, genetic variability, pathophysiology, as well as the limitations and detection threshold of the assay itself. The opiate cutoff of 2000 ng/mL, as recommended by SAMHSA [Citation100], for workplace drug testing to counter “poppy seed defense” may indeed be too high for a clinical adherence program.
Urine drug concentrations are often calculated relative to UCr. This is done in order to correct for in vivo dilution, which can vary through time as it is dependent on an individual’s fluid intake. These calculations, however, assume stable renal function and creatinine production, which is an assumption that can lead to errors. Although, UCr correction smooths the trend, it does not add value to the interpretation when following a patient who is purporting adherence to the treatment program. In the absence of renal disease, low UCr does alert the clinician to potential sample tampering.
From a positive result, besides concluding that the patient has taken the identified drug/metabolite, it is not possible to determine on timing (e.g. time of last use), quantity (e.g. amount of drug used), or mode of drug administration (e.g. IV, smoking, inhalation, insufflation, oral). It is also not possible to extrapolate the degree of impairment) from a positive UDT result. Further, the lab cannot compare one patient’s quantitative urine results with another patient’s urine result and conclude that one may have taken more or less drug than the other.
3.1. Sample tampering/adulteration and its markers
The results of UDT are only as good as the collected sample, and it is important that laboratories are able to detect adulterated urine. Many patients try to mask their drug use by tampering with their samples. This is done both by drinking copious amounts of fluids (in vivo), or by adding substances to their urine samples (in vitro) [Citation17,Citation19,Citation102]. Many “body cleansing” agents that are available on the internet to “beat the drug test” require drinking copious amounts of water thereby causing in vivo dilution of the drug in question. Submitting fake urine [Citation14] and substituting with a “clean” sample are other methods of adulteration [Citation16].
Adulterants, such as Stealth (a peroxidase), chromates (Pyridine, Urine Luck™ Instant Clean ADD-IT-ive), nitrite (Klear, Whizzies), and glutaraldehyde (UrinAid), can be purchased online and surreptitiously added to the urine sample [Citation103]. Some adulterants, including isopropyl alcohol, soaps, bleach, and perfumes, are readily identified by their odor. Soaps are also identified by excessive bubbling. Use of solid adulterants is detected by the presence of residues in the container. The objective of these adulterants is to interfere with the IAs by changing the characteristics of the urine test medium. Sample integrity tests, such as UCr and SpGr, urine temperature, and pH, have now become part of the routine sample validity tests. A number of reagent vendors offer integrity tests but, as Matriciani and colleagues [Citation104] report, many cannot detect some of these adulterants.
Urine EIA “negative” or “false negative” drug screens are often encountered even when the patient is on chronic dosing. Substituting “clean” or drug-negative urine for drug-positive urine is a common way to fool the drug-screening system. Non-adherence, diversion or in vivo dilution can also explain false negative results. Although many drugs (morphine, hydrocodone, hydromorphone, fentanyl, oxycodone, etc.) have a relatively short half- life, they will, at some point in time, reach a steady state when chronic dosing. We have seen cases of patients on oxycodone doses ranging from 5 mg/day to >100 mg/day for whom the urine was negative for oxycodone. A different patient on a fentanyl patch (25 μg/x 3 days), whose urine test was previously positive, was now negative. These results were most likely due to non-adherence to the treatment regimen; however, absence of a metabolite may indicate sample tampering. Therefore, a negative result in patients on chronic dosing should be investigated.
3.1.1. Urine specific gravity (SpGr) vs. Urine creatinine (UCr)
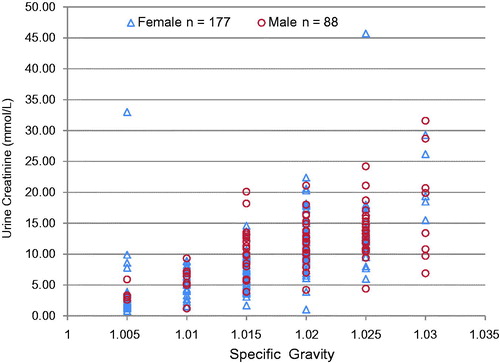
As a dilution marker, UCr is superior to urine SpGr. In a study of 265 urine samples (88 male and 177 female) (), we found that for every given value of SpGr, wide ranges of creatinine values were possible. The dynamic range for SpGr is narrow as compared with that of creatinine. Patients are known to add NaCl (common salt) to the urine; this will affect SpGr but not UCr. Our data suggest that UCr is a better marker of dilution. Creatinine concentration of ≤2 mmol/L (≤20 mg/dL) is usually a result of ingestion of large volumes of water (or other liquids). This is often referred to as “water loading” and is a common practice when attempting to dilute urine so that any drug in the urine will be diluted below the detection threshold of the test. Many products to “beat the urine drug test” sold on the internet call for copious amounts of water intake with their product. A UCr concentration ≤2.0 mmol/L (≤ 20 mg/dL) and a SpGr of more than 1.0010 but less than 1.0030, and thus outside the normal range of 1.005–1.030, is an indication that the sample has been diluted.
Figure 2. Urine specific gravity vs Urine creatinine. Numerous urine creatinine concentrations are possible for every specific gravity value, suggesting urine creatinine is a better marker of dilution.
3.1.2. Urine pH
Urine pH (<5.0 and >8.0), in the absence of urinary tract infection, may be an indicator of sample tampering. However, it is important to note that certain diets can also inadvertently result in high urine pH. Storage can also affect the pH of urine. The pH values of specimens stored at -20 °C are relatively stable, whereas pH results >9 can be achieved at storage temperatures of room temperature or higher [Citation18]. It is common for methadone patients to take bicarbonate of soda or antacids (e.g. Alka Seltzer™) to alkalinize their urine. At alkaline pH >7.5, methadone is renally reabsorbed. Body clearance decrease from 134 ± 21 ml/min (acidic) to 91.9 ± 9.1 ml/min (alkaline) and the elimination half-life increases from 19.5 ± 3.6 h (acidic urine) to 42.1 ± 8.8 h (alkaline urine). Increase in half-life allows the patients to divert part of their methadone treatment drug to the street. Increased half-life allows the patient to divert part of his/her methadone dose for illicit sale. Typically, EIA results will give a negative or a barely positive result for methadone. In such cases, chromatography will typically show the presence of EDDP and trace amounts or no methadone in the urine. Alkalinizing or acidifying the urine pH in vivo can also change the excretion pattern of other drugs such as amphetamines [Citation105]. Thus, it is important to measure urine pH for all samples coming from the opiate treatment program.
3.1.3. Urine Na and Cl
Patients are known to add bleach and common salt to their urine. One small packet of common salt, available in restaurants, contains an average of 800 mg of NaCl (author studies). These packets are small enough that they can be easily hidden in the palm of the hand and covertly added to the voided urine. A concentration in excess of >700 mmol/L for both Na and Cl are obtained when a packet of NaCl is added to the urine (author’s unpublished studies). shows descriptive statistics for >5000 urine samples that were used to develop reference ranges (95 percentiles) for urine Na, Cl and Cr.
Table 2. Descriptive statistics for urine reference ranges.
3.1.4. Urine temperature
Temperature of freshly voided urine reflects the core body temperature; therefore, temperature is a good marker of freshly voided urine. Urine temperature should be taken within one minute of voiding and should be between 34 °C to 36 °C, based on a study the authors conducted using 100 consecutive samples. Please note that the temperature falls very rapidly. Urine containers with Liquid Crystal Display temperature strips are available, but these may be expensive. An electronic thermometer may be cheaper alternative.
3.1.5. Glutaraldehyde
Glutaraldehyde is used as a sterilization agent and as a preservative. It is mainly available as an aqueous solution found in cleaning and sterilizing solutions. It is also the active ingredient in a commercial adulterant called “UrinAid.” The presence of glutaraldehyde in a urine specimen, detected using a fluorometric method [Citation106], is indicative of adulteration [Citation103].
3.1.6. Nitrite
Random urine samples have a low nitrite concentration and are a marker of urinary tract infection or bacterial growth due to improper storage of the urine sample. Nitrite is normally found in some food and commercial products. It is also the active ingredient in “Whizzies” and “Klear”, which are used for adulterating urine samples. Nitrite can interfere with cannabinoid GC-MS confirmation due to little or no recovery of the ions of 9-THCA and its deuterated internal standard [Citation107]. Urry and coworkers [Citation107] studied nitrite concentration in urine samples from various sources and found that nitrite-tampered samples had concentrations above or equal to 1000 μg/mL.
3.1.7. Fingerprinting
One method of sample tampering is by the patient resubmitting a previously submitted sample, or multiple patients submitting the same urine sample. Kapur and coworkers [Citation16] developed a urine fingerprinting algorithm that uses the four diet-dependent chemistries (urine pH, Cr, Na and Cl) as markers to flag the previously submitted or duplicate urine sample. The algorithm uses a ± 1 standard deviation (SD) of the assay as a window for similarity. For duplicate or resubmitted sample to be detected all measurements must be quantitative and precise. Briefly, the lab starts with one analyte in the batch of samples (e.g. Na). All samples that have identical Na values or are within the method’s ±1SD of each other are selected. On this batch, the second analyte (e.g. Cr) is subjected to the same process. This process is repeated until all the analytes have been compared, including any other test results that are available. As the number of similar analytes increases, the number of samples selected decreases and the probability of the urine samples being duplicate increases. Probability calculations and details are described in Kapur and coworkers [Citation16]. If “bladder sharing” is suspected, the fingerprinting protocol as described should be considered. Since many laboratories now have laboratory information systems (LIS), the algorithm can be automated to flag this type of adulteration. In the author’s lab, this algorithm protocol was implemented with a daily printout of potential duplicate samples.
4. Part III: drugs of abuse and pain management
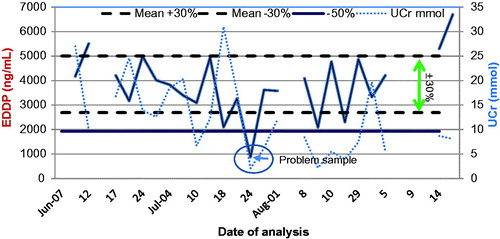
This section reviews the pharmacological and analytical characteristics of drugs that are abused and used to manage pain. Pain medications are usually prescribed to be taken chronically so that steady state plasma concentrations and corresponding pharmacodynamic effects can be achieved. Steady state drug concentrations in serum imply that the urine excretion window (UEW) of the drug/metabolite is also at “steady state” in patients with stable renal function. shows the concentration of methadone metabolite EDDP in a patient receiving methadone chronically. clearly shows that UCr correction does not add value when monitoring trends. Here, patient’s non-adherence can be detected when the urine EDDP concentration falls outside the UEW.
Figure 3. Urine EDDP (methadone metabolite) profile. EDDP excretion window is at “steady state” in patients on chronic dosing. Non-adherence or problem samples can be identified. UCr does not add value to interpretation.
Interpretation of both urine and plasma drug screening/testing requires the understanding of each drug’s pharmacological properties, metabolism, and other influencing factors. Results are highly dependent on the detection threshold (cutoff) of the assay method. This section focuses on variables that are pertinent to the interpretation of the results.
4.1. Alcohol (ethanol)
Ethanol (i.e. alcohol) is water soluble and distributes into total body water (TBW). The same dose of alcohol per unit of body weight can produce a very different blood alcohol concentration (BAC) in different individuals because of the large variations in proportions of fat and water in their bodies. Women generally have a higher percentage of body fat, so they have higher peak BAC with the same alcohol dose when compared with men of the same height and weight. The same is true between young males (age ∼25 y) and seniors (age ∼65 y), as TBW decreases with age in males. Seniors with same height and weight will have higher BAC for the same alcohol dose as compared to young adult [Citation108–110].
Between 92–95% of ingested ethanol is oxidized (metabolized) into acetaldehyde by three different enzymes: alcohol dehydrogenases (ADHs), catalase and the inducible microsomal Cytochrome P450 enzyme, specifically CYP2E1. The remainder is unchanged and excreted in urine, sweat, and expired air. The Km of ADH for ethanol is low (about 1 mM), so ADH gets saturated at low concentrations of ethanol and the overall elimination follows “zero” order elimination kinetics. At concentrations below 1 mM, elimination follows Michaelis-Menten kinetics. At higher BAC, alcohol oxidation increases due to the induction of CYP2E1 [Citation111].
A small fraction (<0.02%) of ethanol undergoes a phase II conjugation reaction with glucuronic acid, catalyzed by endoplasmic reticulum UDP-glucuronosyltransferase, to produce ethyl β glucuronide (EtG) [Citation112,Citation113]. Animal (e.g. rat and rabbit) studies have shown that ethanol may also undergo sulfate conjugation with 3′-phosphoadenosine 5′-phosphosulfate through the action of cytosolic sulfotransferase to produce ethyl sulfate (EtS) [Citation114,Citation115].
Plasma ethanol, methanol, isopropanol, acetone, and ethylene glycol analysis are typically performed using GC with a FID. However, if GC/FID is not available, then the analysis can be performed by enzymatic methods using ADH and alcohol oxidase (AO). Methanol, isopropanol, acetone, and ethylene glycol do not interfere with the commercially available yeast ADH methods. AO is nonspecific and will also give a positive result with this enzymatic method for other alcohols, such as methanol, isopropanol, and ethylene glycol. If only ethanol is positive, then both enzymatic methods should give a very similar result. If either of the other alcohols is present, then the difference between the ADH and AO methods will represent the other volatiles. Anion gap is elevated in the presence of methanol or ethylene glycol.
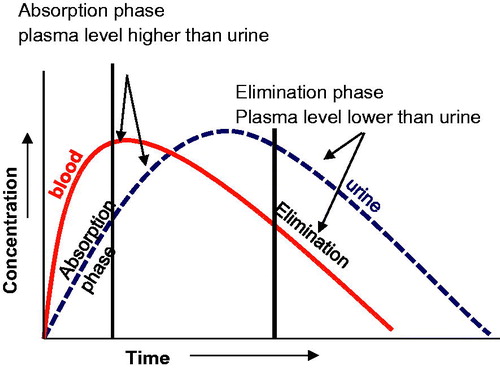
Alcohol contents in various organs and fluids are proportional to their water content. The ratio of ethanol concentration in plasma or serum to that of whole blood is 1.12 ± 0.02:1 [Citation116]. Ethanol enters the kidneys through passive diffusion with water, so it is not affected by in vivo dilution or changes in pH. Since alcohol distributes in TBW, drinking copious amounts of water will not affect BAC or urine alcohol concentration (UAlc). Running around the block and sweating also does not reduce BAC. The BAC and UAlc curves are displaced in time as there is time lag in the production and diffusion of alcohol into the bladder. During the alcohol absorption phase, UAlc is lower than the BAC. During the elimination phase UAlc is higher than BAC. Urine alcohol can be positive for alcohol for about 1–2 h after BAC has fallen to zero. UAlc concentration reflects the average BAC between voiding (). Urine alcohol is a direct marker of alcohol use itself, but its detection period is relatively short.
Figure 4. Alcohol blood and urine profile. The blood alcohol concentration and urine alcohol concentration curves are displaced in time as there is time lag in the production and diffusion of alcohol into the bladder.
Alcohol impaired drivers often use “Hip-Flask defence”. This is when the impaired driver claims that the drinking took place after the driving infraction took place [Citation117,Citation118]. Two successive UAlc from voids taken an hour apart can assist in interpreting the hip-flask defence. If there is an increase between the two UAlc this is indicative of drinking after driving. A decreasing UAlc concentration suggests that there was no consumption of alcohol after the driving infraction [Citation119].
Glucose in a diabetic patient’s urine can convert to ethanol in vitro through anaerobic metabolism by bacteria and/or yeast present in the sample and give a positive result [Citation120,Citation121]. Although, this is analytically a true positive, clinically it is a false positive result. Urine should be tested for glucose if ethanol is positive. This should be a “reflex” test, i.e. if UAlc is positive then urine glucose (UGlu) must be done in tandem and reported. If both UAlc and UGlu are positive, it is not possible to distinguish the source of alcohol (i.e. alcohol from in vivo source or through in vitro conversion). We studied the stability of glucose in the urine of alcohol drinking and non-alcohol drinking diabetic patients. In diabetic patients’ urine, the glucose concentration decreases and alcohol concentration increases over time. The urine of a diabetic patient drinking alcohol is also positive for EtG whereas it is negative in the urine of a diabetic patient who was not drinking (). EtG, a direct minor metabolite of ethanol is formed following alcohol consumption, can be helpful in the differentiation of the origin of the alcohol.
Table 3. Urine glucose stability in a diabetic patient NOT drinking alcohol.
Table 4. Urine glucose stability in a diabetic patient who has been drinking alcohol.
4.1.1. Biomarkers of alcohol abuse
There are numerous direct and indirect makers of alcohol use and abuse. Goldberg and Kapur describe the various circulating enzymes and proteins that have been reported as markers of alcohol use [Citation122]. A small amount of ethanol is eliminated via the non-oxidative pathway into EtG, EtS, phosphatidylethanol (PEth) and FAEEs [Citation123]. These are direct markers of alcohol exposure or use and are metabolites of ethanol itself. All of these ethanol metabolites can be detected in plasma, urine, meconium, and hair. The detection periods vary between the biomarkers and the amount of ethanol consumed. The presence of these markers in meconium suggest that alcohol was used during the last trimester, although care needs to be taken in collecting the appropriate sample [Citation36].
Indirect markers, such as carbohydrate-deficient transferrin, 5-hydroxytryptophol, haemoglobin-associated acetaldehyde, will not be reviewed here and the reader is directed to many excellent reviews on these biomarkers [Citation124,Citation125].
4.1.1.1. Ethyl β glucuronide (EtG)
EtG is a non-oxidative, minor metabolite of ethanol formed by glucuronidation of ethanol catalyzed by UDP-glucuronosyl-transferase [Citation112]. In humans, only a very small fraction (about 0.02%) of the ethanol consumed, is excreted in the urine as EtG [Citation113]. Owing to the markedly prolonged elimination time compared with ethanol itself, measurement of EtG in urine is used as a sensitive and specific biomarker for alcohol intake. EtG urinary excretion kinetics are well known [Citation126].
Borucki et al. [Citation124] using LC-MS/MS showed that after moderate drinking, EtG concentration was 100% sensitive up to 39.3 h after the last drink and thereafter decreased, falling to below the method’s limit of quantification of 0.1 mg/L at 102.5 h. Urine IAs have been developed for EtG and there is a good correlation between the commercially available IA test and a lab-based MS test [Citation127]. UAlcs do not need to be corrected for UCr, whereas the EtG concentration may need UCr correction if following a patient’s adherence in an alcohol treatment program. EtG in hair has been used as a marker of alcohol abuse. False positives have been reported for both hair [Citation128] and urine [Citation129–131]. The concentrations of EtG in OF are considerably lower than those in blood and its detection window is also shorter [Citation132].
4.1.1.2. Ethyl sulfate (EtS)
EtS, a phase II metabolite of ethanol, is a stable compound and a biomarker of recent alcohol exposure [Citation133,Citation134]. Although its window of detection is similar to that of EtG, there are differences between the two markers in their pathways of formation and degradation. Therefore, concurrent determination of EtS and EtG will improve sensitivity when being used as biomarkers of recent drinking. However, false positives have been reported in the urine of a patient drinking “non-alcoholic” beer [Citation130].
Hoiseth and coworkers studied the PKs of EtG and EtS in blood of both social and heavy drinkers and found that the elimination rates were similar in the absence of kidney disease [Citation135]. This group also studied the concentrations of both EtG and EtS in serum and whole blood and found that these alcohol biomarkers are higher in serum than whole blood with the median ratio of serum/whole blood to be 1.68 for EtG and 1.30 for EtS [Citation136].
4.1.1.3. Phosphatidylethanol (PEth)
PEth represents a group of glycerophospholipid homologues, each with a unique set of long chain carboxylic acid residues [Citation137,Citation138]. A total of 48 homologues of PEth by LC-ESI-MS/MS have been identified, with PEth 16:0/18:1 being the major homologue [Citation137]. PEth is formed in cell membranes by the transphosphatidylation of phospholipid by phospholipase D (PLD) in the presence of ethanol [Citation139]. PLD has a higher binding affinity for ethanol than water, resulting in the preferential production of PEth over phosphatidic acid in the presence of alcohol. Gnann and colleagues [Citation138] suggest that quantitating the PEth 16:0/18:1 homologue may allow for the differentiation between alcoholics and social drinkers.
PEth is typically analyzed using LC-MS/MS. It is recommended that venous blood be obtained in an EDTA coated tube, and it should not be centrifuged. The sample is stable for 24 h at room temperature and for 3 weeks at +4 °C. For longer periods of storage, whole blood should be kept frozen at −80 °C in a plastic tube. Storage at −20 °C is not recommended [Citation140]. A fully automated DBS as a sample collection method for PEth 16:0/181 and 16:0/18:2 has recently been described [Citation141].
The mean half-life of PEth in blood from alcoholics is reported to be four days, with it still being measurable after up to 2 weeks of sobriety [Citation142,Citation143]. Varga and coworkers investigated traditional alcohol biomarkers (carbohydrate-deficient transferrin, gamma-glutamyl transpeptidase and mean corpuscular volume and found PEth to be a more sensitive indicator of alcohol consumption. In 16 volunteers who had a single drink, leading to an estimated BAC of 1 g/Kg, PEth could be detected for up to 12 days using SPE-LC-MS/MS [Citation144]. However, more than a week of moderate drinking was required before PEth was detectable in blood and a single dose of ethanol (50 g) did not give measurable PEth-concentrations [Citation145].
4.1.1.4. Fatty acid ethyl esters (FAEEs)
FAEEs, the esterification products of non-oxidative metabolism of ethanol and fatty acids, have been implicated as mediators of ethanol induced organ damage [Citation146]. FAEE synthase, the enzyme responsible for the formation of FAEEs, is present selectively in the organs commonly damaged by ethanol abuse [Citation147]. FAEEs found in various organs have shown to be biomarker of ethanol abuse [Citation148–150]. Laposata proposed an algorithm, which includes FAEEs, to assess recent and chronic intake of ethanol [Citation151].
In their 2014 consensus statement, the Society of Hair Testing (SoHT) recommended EtG and FAEEs as direct biomarkers of chronic alcohol consumption, which is defined by >60 g/day for several months. The concomitant use of these two biomarkers is recommended in order to prevent false positive or false negative results [Citation152]. The SoHT also suggests that ethyl myristate, ethyl palmitate, ethyl oleate, and ethyl stearate be measured, and their sum be used for interpretation. The recommended cutoffs for the two biomarkers are: EtG >30 pg/mg in the 0–6 cm proximal scalp hair segment and; FAEEs >0.5 ng/mg in the 0–3 cm proximal segment or 1.0 ng/mg in the 0–6 cm proximal segment respectively. It is important to note that false positives are possible for both EtG and FAEEs with this method [Citation153].
4.2. Amphetamine & MDMA (ecstasy)
Amphetamine is a potent central nervous system (CNS) stimulant of the phenethylamine class that is used in the treatment of attention deficit hyperactivity disorder (ADHD), narcolepsy, and obesity. First discovered in 1887, it exists as two enantiomers: levoamphetamine and dextroamphetamin. Amphetamine has been used to treat nasal congestion and depression. It has been used as an athletic performance enhancer, cognitive enhancer, and recreationally as an aphrodisiac and euphoriant. Chemical synthesis has yielded amphetamine derivatives where many functional groups have been substituted and have different pharmacological properties. These derivative compounds have been formed by replacing, or substituting, one or more hydrogen atoms in the amphetamine core structure with substituents [Citation154]. Some of the examples of these substituted amphetamines are methamphetamine, ephedrine, cathinone, phentermine, mephentermine, bupropion, methoxyphenamine, selegiline, amfepramone, pyrovalerone, 3,4-Methylenedioxymethamphetamine (MDMA/Ecstasy), and 2,5-Dimethoxy-4-methylamphetamine (DOM).
Most of the amphetamine derivatives will give a positive amphetamine EIA result even though the cross-reactivity for some of them is reported as poor. The new generation MDMA EIA assays are also known to detect the amphetamine derivatives but have the same limitations of “false positives” due to cross-reactivity. Many antihistamines, such as phenylpropanolamine, ephedrine, pseudoephedrine, and diphenhydramine, can also give a false positive. In a study conducted by the author [Citation67], almost 50% of the false positives were observed due to the presence of various antihistamines and other drugs. These interference rates have not changed substantially since the 1980s and are true of all amphetamine EIA assays. If a positive EIA amphetamine result is obtained, it must be followed up with chromatography to either confirm or identify the interfering substance.
Amphetamine is a weak base with a pKa of 9.9, and its excretion varies during the day [Citation155]. It is not influenced by changes in urine volume output but is related to changes in urine pH [Citation105,Citation156]. These results are in concordance with nonionic diffusion of bases in the distal portion of the kidney tubules. The higher the urine pH, the higher will be the ratio of un-ionized amphetamine in the luminar fluid of the kidney tubules [Citation155]. A positive correlation between urinary pH and the plasma amphetamine half-life has been demonstrated, with an increase in half-life of about 7 h for every unit increase in urinary pH [Citation157]. Thus, in a subject where amphetamine use or abuse is suggested, urine pH should be measured to help in the interpretation of the results.
Selegiline (also known as L-deprenyl), a substituted phenethylamine, is metabolized into the active metabolites desmethyl-selegiline, L-methamphetamine, and L-amphetamine. A patient receiving this Parkinson drug will have a urine drug screen positive for amphetamine and/or methamphetamine. Vyvanse (Lisdexamfetamine dimesylate) prescribed for ADHD is an inactive prodrug that is converted in vivo to dextro-amphetamine and will give a positive result for amphetamine [Citation158]. Labetalol, which is used to treat hypertension, has been reported to cause false positive results with this test [Citation159]. Thus, a patient’s medical history should be obtained in order to correctly interpret a positive amphetamine result.
4.3. Benzodiazepines
The benzodiazepines, often referred to as “benzos”, are a class of drugs that include diazepam, nordiazepam, temazepam, and oxazepam amongst others. Many are metabolized and excreted as oxazepam glucuronide. Clorazepate and chlordiazepoxide are also metabolized to oxazepam. The other members of this family, such as ketazolam, camazepam, oxazolam, pinazepam, halazepam, and medazepam, are prodrugs also metabolized to oxazepam [Citation160]. Thus, it is not surprising that most of the commercial EIAs are developed to detect oxazepam. These assays detect the benzodiazepine “class” and cannot differentiate between the different members of its class. For identification, chromatographic methods need to be used [Citation161]. Many laboratories hydrolyze urine to cleave and convert the glucuronide metabolites to their immune-reactive antigen. This makes the assay more sensitive and some of the drugs in this class can be detected for a considerable period of time. Although this may be considered as an advantage, it makes clinical interpretation of the test results for drugs that have a long half-life, such as diazepam, difficult as the detection period increases considerably.
Diazepam: Half-life of diazepam is reported to be between 20–80 h. In the author’s laboratory some patients were observed to be positive by EIA for as long as 2 weeks after last dose. This occurred without hydrolyzing the urine specimen prior to analysis. Benzodiazepine EIA quantitation can help in patient follow-up by monitoring “spikes” and “trends” in the urine concentration, which can often identify when “new” drug use took place.
Clonazepam: This benzodiazepine is used to treat seizure or panic disorder and is prescribed in doses ranging from 0.125–3.0 mg. Its half-life is between 18–50 h with protein binding reported at 85%. Peak blood concentration occurs between 1–4 h. Clonazepam undergoes extensive biotransformation, with less than 0.5% of the dose being excreted in the urine over 24 h. Thus, clonazepam’s pharmacological properties are such that, even though the benzodiazepine EIA assay has a good cross-reactivity profile, the amount excreted may fall below the detection limit of the assay. Clonazepam and its metabolite 7-aminoclonazepam may be quantified in plasma, serum, or whole blood using chromatographic methods to monitor adherence in patients. Both are unstable in biofluids and samples should be preserved with sodium fluoride [Citation162].
Flunitrazepam (Rohypnol): Flunitrazepam is a CNS depressant and a potent hypnotic in the benzodiazepine class. It can cause amnesia and has an infamous reputation as a date-rape drug. Although some generic benzodiazepine EIA assays have a good cross-reactivity profile, the assay detects the class of compounds; hence flunitrazepam specifically cannot be identified. However, the amino derivative of flunitrazepam can be detected by chromatographic methods.
Dimenhydrinate (Gravol), Oxaprozin (Daypro, an anti-inflammatory drug), and sertraline (Zoloft) have been reported to give false positives for benzodiazepines [Citation163].
4.4. Barbiturates
The barbiturates EIA assay will detect most of the barbiturates. Abuse of barbiturates was common in the 1970s and 1980s with secobarbital, amobarbital, and butalbital being the most frequently abused. Currently, the incidence of barbiturate-positive urine is low, and as a result, many laboratories have discontinued offering this as a routine test. Instead, the test may need to be specifically requested. Of note, phenobarbital has been used as an additive/adulterant in street heroin.
Primidone is an anticonvulsant of the barbiturate class. It is a structural analog of phenobarbital and related to barbiturate-derivative anticonvulsants. Primidone metabolizes to phenobarbital and phenylethylmalondiamide. The rate of metabolism of primidone into phenobarbital has shown to be inversely related to age [Citation164].
4.5. Cannabinoids
Cannabis, also known as marijuana among other names, is one of the most used and abused drugs in the world. Cannabis is a genus of flowering plants in the family Cannabaceae. Marijuana refers to the dried leaves, flowers, stems, and seeds from the Cannabis sativa, Cannabis indica, or Cannabis ruderalis plant. The psychoactive effects of cannabis are mainly produced by (‒)-trans-δ9-tetrahydrocannabinol (THC) [Citation165]. The most widely consumed plant form is reported to contain 3% to 20% THC, with some reports suggesting up-to 33% THC. Over 500 compounds that have been isolated thus far and are collectively known as cannabinoids [Citation166,Citation167]. THC, cannabidiol (CBD), and cannabinol are the three major cannabinoids contained in marijuana, which do not have nitrogen atoms in their structures. THC is the most psychoactive cannabinoid, producing euphoria, relaxation, intensification of ordinary sensory experiences, perceptual alterations, diminished pain, and difficulties with memory and concentration [Citation168]. CBD is not psychoactive.
THC is highly lipophilic and has a large volume of distribution with a high octanol/water partition coefficient of LogP = 6.97 [Citation169]. Within minutes of smoking, the blood concentration falls by almost 90% as it is rapidly distributed and accumulates into the adipose tissues [Citation170]. It is gradually released from the adipose tissue and its non-psychoactive marijuana metabolite δ-9- tetrahydrocannabinoic acid (THC-COOH/THC-acid) appears in the urine and can be detected from days to weeks after use. In an in-patient setting (author study) urine tests were found to be positive for up to 20 days after last use. There is literature suggesting that it can be longer in some cases [Citation171,Citation172]. CBD’s PK profile as well as its plasma and urine excretion pattern are similar to that of THC [Citation171].
Pharmacodynamic and PK properties of THC vary as a function of its route of administration. Psychotropic effects after oral ingestion are delayed and appear after 30–90 min [Citation171]. When smoked, THC is rapidly absorbed and effects appear within minutes after smoking, with peak plasma concentrations of both THC and CBD being attained within 3–10 min. The maximum plasma concentrations are also higher relative to oral ingestion [Citation173]. Bioavailability of THC after inhalation is reported to be from 10–35% and is attributable to inhalational characteristics such as number, duration and interval of puffs, breath hold time, inhalation volume, inhalational device, size of inhaled particles, and site of deposition within the respiratory system [Citation174,Citation175].
THC and its major (inactive) metabolite, THC-COOH, can be measured in blood, urine, hair or OF using chromatographic techniques. Cannabinoids enter the hair through capillaries and sweat and can be detected. Detection period depends on frequency and potency of marijuana consumed [Citation176]. THC-COOH is also known to adsorb to the wall and lids of the sample containers. It should be noted that THC-COOH concentrations are not stable in vitro and will decrease with time. This can be a significant issue when the concentration is near the assay detection threshold [Citation177]. If a sample is repeated a few days later, it might not give the same initial result. It is conceivable that a sample that was positive could be negative when repeated a week later.
There is no reliable method for determining the time the individual last smoked marijuana by analyzing urine. There is a significant correlation between body mass index, volume of distribution (adipose tissue), and time until last positive urine cannabinoid test [Citation178]. Smoking history and volume of distribution are significant variables. During abstinence, the release of THC from adipose tissue into the blood is highly variable, possibly based on differences in activity, diet, and enzymatic activity. Factors that affect redistribution of THC from adipose tissue and excretion into urine can result in significant inter subject variability in urinary THC-acid concentrations [Citation179].
THC metabolism is polymorphic and shows great variability throughout the population. Both THC and CBD are metabolized predominantly in the liver via the cytochrome P450 isozymes CYP2C9, CYP2C19, and CYP3A4. CBD is additionally metabolized by CYP1A2 and CYP 2D6 [Citation180]. Since almost 80% of the medications are collectively metabolized by these enzymes [Citation181], PK drug-drug interactions between prescribed medications and THC/CBD can occur through the inhibition or induction of these enzymes.
As previously noted, THC is metabolized to 11-hydroxy-δ9-THC, which is further metabolized to THC-COOH [Citation180]. EIAs are calibrated to detect THC-COOH, the urinary metabolite of THC. Although this assay is robust, some antibiotics and nonsteroidal anti-inflammatory drugs (NSAIDs), such as ibuprofen, have been shown to randomly cause a false positive by EIA [Citation182]. False positive results can also occur with naproxen, dronabinol, efavirenz, and hemp seed oil. Baby wash soap has even been reported to cause a false positive result [Citation66].
Niedbala and coworkers studied passive (second-hand smoke) exposure to cannabis smoke in urine and saliva samples. They found that using GC-MS/MS with a THC detection threshold of 3 ng/mL, THC concentrations in OF passive subjects declined in a linear fashion within 45 min to below the GC-MS/MS detection threshold, although two of their subjects who were smokers were positive for a longer time period. All urine specimens from their subjects tested negative using EIA (cutoff of 50 ng/mL) [Citation183]. Other studies have shown that passive inhalation generally results in urine levels that are generally below the EIA detection threshold of 50 ng/mL [Citation184,Citation185] unless the exposure occurs in an unventilated space. A HPLC-MS method for breath marijuana was first reported by Valentine and coworkers in 1979 [Citation186]. More recently, Luo and colleagues reported that by azo-coupling based derivatization and LC-MS/MS, they could detect breath THC concentrations between 0.5–2.5 pg/mL [Citation187].
4.6. Cocaine (benzoylecgonine)
Cocaine is a powerfully addictive stimulant drug made from the leaves of Erythroxylon coca, the coca plant native to South America. Coca leaves are chewed and used in various foods and beverages [Citation188]. Although cocaine is mostly smoked, other routes of administration include intranasal and intravenous. It is a lipophilic drug that is extensively bio-transformed in vivo ().
Figure 5. Cocaine metabolism. All chemical formulas are from their respective pages in Wikipedia.
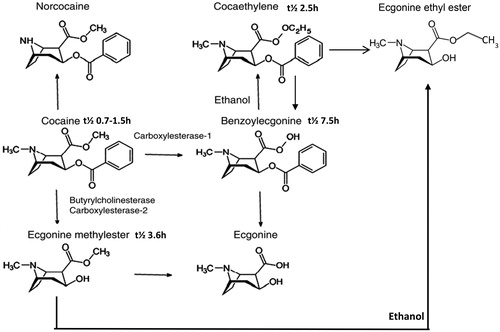
The two major cocaine metabolites in human urine are benzoylecgonine (BEG) [Citation189,Citation190] and ecgonine methyl ester (EME) [Citation191]. Cocaine is readily hydrolyzed into these metabolites in a process that is mediated by cholinesterase [Citation192]. The reaction rate is dependent on the drug concentration and is inhibited by freezing or by the addition of fluoride. Baselt [Citation193] studied the stability of cocaine and reported that cocaine hydrolysis is pH and temperature dependent and occurs more rapidly under alkaline conditions [Citation194]. In humans, it is inactivated by the hydrolysis of one or both ester linkages. This degradation of cocaine by enzymatic and chemical processes also takes place after death and in biological material collected and stored for further analyses.
The half-lives of cocaine, EME, and BEG are reported to be 1.5 h, 3.6 h, and 7.5 h, respectively [Citation188,Citation195]. A small percent of cocaine appears in urine. All IA procedures detect BEG. The EIA test is very robust [Citation68] and to date the authors are not aware of any substance that gives a false positive reaction. Cocaine, the parent drug detectable by chromatography, has a short half-life, and if detected, indicates that cocaine was used within the previous few hours. It is not possible to distinguish between crack cocaine and cocaine-base use.
Cocaine abusers frequently and simultaneously use alcohol and claim that it prolongs euphoria [Citation196]. When alcohol is used concurrently with cocaine, cocaethylene is formed through trans-esterification of cocaine. Cocaethylene is an active metabolite and more potent than cocaine itself. It can reach plasma concentrations equal to or greater than cocaine [Citation196,Citation197]. Cocaethylene is metabolized to BEG with a half-life approximately 2.5 h [Citation197]. Cocaethylene is detectable in urine by chromatographic methods and its presence is indicative of the patient using both cocaine and alcohol.
4.7. Gabapentin/pregabalin
Gabapentin and Pregabalin are gabapentinoids and analogs of gamma-aminobutyric acid. Gabapentin was initially approved in 1993 by the US Food and Drug Administration (FDA) only for treatment of epilepsy. In 2004, it was also approved as an analgesic for post herpetic neuralgia [Citation198]. The combined use of gabapentin and pregabalin is considered a valuable addition to the treatment of neuropathic pain and inflammatory nociception [Citation199]. Gabapentin and pregabalin are not metabolized or bound to plasma proteins and they are excreted unchanged in the urine. There is considerable variability between patients taking gabapentin; the bioavailability is inversely related to the dose making its PKs unpredictable. However, this is not the case with orally administered pregabalin. The elimination half-life of gabapentin and pregabalin are reported to be 4.8–8.7 h and 5.5–6.3 h, respectively [Citation199]. Within subject variability of gabapentin is small enough that TDM is a viable method in dose individualization [Citation200].
Although gabapentin and pregabalin themselves do not have addictive powers uis generis (“wanting”), they do have the potential to become addictive in patients with substance abuse disorders [Citation201].
4.8. Opiates and opioids
The terms “opiates” and “opioids” are often confused and used interchangeably. They should not be. The term “opioids” refers to any compound that binds to an opioid receptor (μ, κ and δ) to produce an analgesic effect, whereas the term “opiates” refer to the alkaloid compounds that are naturally derived from the environment and act like opioids endogenously [Citation202].
Opiates are alkaloids derived from the poppy (Papaver somniferum) plant. There are also semi-synthetic counterparts (e.g. hydromorphone, hydrocodone). Considerable confusion exists in the terminology used by clinicians and the toxicology laboratory. Although the “opiate” EIA test is designed to detect the antigen morphine, many compounds that have similar chemical structure (e.g. codeine, hydrocodone, hydromorphone) will cross-react and give a “false positive” result. Synthetic and semi-synthetic “opioids”, such as methadone, buprenorphine, fentanyl, and oxycodone, are not detected by the “opiate” IA and have separate IAs.
Opiate/opioid metabolism is complex. They are susceptible to a variety of oxidation/reduction, methylation/demethylation, and acetylation/deacetylation reactions, catalyzed primarily by the cytochrome P450 enzymes. Additionally, each opioid/opiate and their metabolites are often enzymatically glucuronidated before excretion. The functional activity of each opiate/metabolite is a function of its activity for opiate receptors and its CNS penetration, which have not always been well defined. Various opiate metabolism pathways are illustrated in .
Figure 6. Opiate metabolism. All chemical formulas are from their respective pages in Wikipedia.
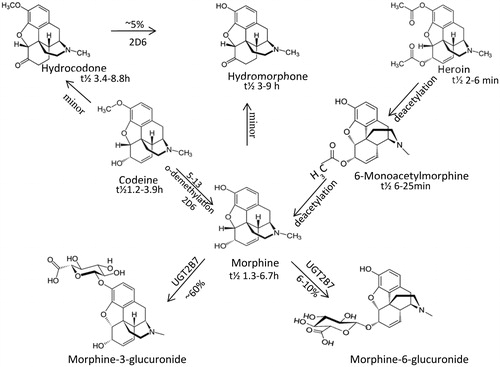
Opiate IAs will give a positive result if morphine, codeine, hydrocodone, or hydromorphone is present in the urine sample. Ingestion of poppy seeds is known to give a positive opiate result [Citation101]. Our studies have shown that eating even one poppy seed bagel will yield a positive opiate test. Although this is analytically a true positive, clinically it is a false positive.
4.8.1. Heroin
Heroin (diacetylmorphine, morphine diacetate,) is a highly addictive, illegal drug used by millions of addicts around the world. Heroin (like opium and morphine) is made from the resin of poppy plants. Milky sap-like opium is first removed from the pod of the poppy flower [Citation203] and refined to make morphine, and then further refined into heroin.
Most heroin is injected, creating additional risks for the user who faces the danger of contracting HIV, hepatitis, or other infections. Heroin is an opioid analgesic and has many common street names: H, smack, boy, horse, brown, black, tar amongst others. It is typically injected and is the “opiate” of choice on the street. Orally taken it undergoes extensive first-pass metabolism (in the liver) via deacetylation. When the drug is injected, it avoids first-pass effect and rapidly crosses the blood–brain barrier because of the presence of the acetyl groups. Once in the brain, it is deacetylated into the active 6-MAM and the inactive 3-mono-acetylmorphine (3-MAM) metabolite, and then is further deacetylated to morphine. Under the chemical name diamorphine, diacetylmorphine is prescribed as a strong analgesic in the United Kingdom.
The half-life of heroin in plasma is reported to be about 2–3 min. As a result, heroin per se is not tested for in the routine clinical lab setting.
4.8.1.1. 6-Mono-acetylmorphine (6-MAM)
Heroin is rapidly metabolized by cholinesterase and arylesterase to 6-MAM. Its half-life is reported to be between 10–40 min, and it may be detectable from 2 h to up to 24 h after heroin use [Citation204]. 6-MAM is further metabolized to morphine. Poppy seed use does not give a positive 6-MAM result. A positive result for 6-MAM indicates heroin use within the previous few hours. The detection window is both dose- and method dependent.
4.8.2. Morphine
Morphine is used primarily to treat both acute and chronic severe pain, and it undergoes extensive first-pass metabolism. Morphine binds to μ-opioid receptors and has a half-life of 1.5–7 h. It is primarily glucuronidated at positions 3 and 6, to form morphine-3-glucuronide (M3G) and its more potent active metabolite morphine-6-glucuronide (M6G) by the enzyme UGT2B7 [Citation205]. Morphine is 35% protein-bound and has oral bioavailability of 20–40%. M6G, the active metabolite responsible for much of the analgesic effects, accumulates following chronic administration or in renally impaired individuals. The half-life of M6G is reported to be 4 ± 1.5 h. Close to 90% of a single dose of morphine is eliminated within 72 h, with 75% being present as M3G and less than 10% as unchanged morphine. A small amount (5%) is demethylated to nor-morphine.
4.8.3. Codeine
Codeine is an opiate used to treat pain and also used as a cough medicine. There are different sources for codeine: (1) intake of a codeine-containing medication (2) as contaminants in street heroin and (3) poppy seeds have shown to contain codeine besides morphine. Morphine is a metabolite of codeine and it is not uncommon to find morphine when chromatographic procedure is used for analysis.
Codeine is primarily metabolized in the liver, with some metabolism also taking place within the intestines and brain. Roughly 50–70% of codeine is glucuronidated to codeine-6-glucuronide by UGT2B7 [Citation206], 10–15% is N-demethylated to nor codeine by CYP3A4 [Citation207], 0–15% undergoes O-demethylation to morphine by CYP2D6 [Citation208] and up to 11% is metabolized to hydrocodone [Citation209].
In normal metabolizers, an average of about 10% of codeine is metabolized to morphine, while in ultra-rapid metabolizers, those who possess more than 2 functional copies of the CYP2D6 allele, most of the codeine can be converted to morphine leading to an increased risk of adverse drug effects related to morphine toxicity [Citation210,Citation211].
4.8.4. Hydrocodone/hydromorphone
Hydrocodone is a semi-synthetic opioid prescribed for pain management. It is metabolized by CYP2D6 to hydromorphone and by CYP3A4 to nor-hydrocodone and to a lesser extent 6α-hydrocol and 6β-hydrocol [Citation212]. Hydrocodone is sometimes referred to as a “pro-drug” because the more active compound is its metabolite hydromorphone and may not be the administered drug. Administration of hydrocodone results in the urinary excretion of substantial amounts of the parent drug along with nor-hydrocodone and smaller amounts of its active metabolite, hydromorphone. In a study, Valtier and Bebarta [Citation213] showed that hydrocodone reaches peak concentrations between 1.45–7 h post dose and can be detectable for up to 98 h. Even though hydrocodone was detected at rather high concentrations, in their study hydromorphone was detected at very low concentrations and could be detected for as long as hydrocodone. Hydromorphone is renally excreted so in patients with renal abnormalities half-life can increase significantly.
Hydromorphone is detected in patients treated with high-dose morphine. A minor pathway for the biotransformation of morphine to hydromorphone has been identified in humans (). The ratio of hydromorphone to morphine ranges from 0.2–2.2% [Citation214].
4.8.5. Poppy seed interference
A few years ago, we conducted a study with seven volunteers (three females and four males). Each volunteer ate one poppy seed bagel in the morning. We monitored their urine for 2 days for opiates using EIA procedures. All urine samples gave positive results for almost 36 h by the EIA procedure. In this small study, women were generally positive for a longer period. Analytically, this is a true positive but clinically a false positive. These results are not surprising as poppy seed is an oilseed obtained from the opium poppy (Papaver somniferum) plant. All parts of the plant can contain opium alkaloids, especially morphine and codeine.
In two cases the opiate concentration was over 5000 ng/mL. We subjected three urine samples with concentrations over 2000 ng/mL to HPLC (Bio-Rad REMEDi HPLC) chromatographic screens. None of these were positive for morphine or codeine. The discrepant results between the two procedures can be explained as follows: The individual concentration of the opiate (morphine, codeine) is very low from this dietary source; therefore, they are not detected by this chromatographic procedure that did not involve extraction or hydrolysis. If urine samples from poppy seed bagel consumers were subjected to GC-MS, morphine would most likely be detected [Citation101].
In response to the poppy seed interference and “poppy seed legal defense”, SAMHSA [Citation215] raised the detection threshold for opiate EIA from 300 ng/mL to 2000 ng/mL for all workplace drug testing programs in the autumn of 1998.
If a person tests positive for codeine and morphine after ingesting poppy seeds, is there a way to confirm in urine sample that the opiates positive was indeed from poppy seeds rather than from a pharmaceutical product? Various studies have shown that poppy seeds contain both morphine and codeine, and that morphine content is higher than codeine. So, urine morphine concentration will be higher than codeine after poppy seed ingestion. The reverse will be true and codeine concentration will be higher than morphine when codeine was taken as a pharmaceutical product. In normal metabolizers, about 10% of codeine is metabolized by the cytochrome P450 enzyme systems into morphine and other metabolites. Thus, in a urine sample from an individual taking codeine as a pharmaceutical preparation, there will be a large amount of codeine and small amount of morphine. The proportions/ratio may vary from individual to individual depending on their intrinsic enzymatic activity; the pattern however will be the same (i.e. codeine concentration is higher and morphine concentration is lower). The ratio, morphine higher than codeine, has been confirmed by many studies in literature where the authors have given poppy seeds to volunteers. In all cases the authors also analyzed poppy seed contents and have found that morphine concentration is always higher than codeine [Citation101,Citation216–219].
4.8.6. Meperidine (pethidine)
Meperidine, also known as pethidine, is a synthetic µ-opioid receptor agonist that is structurally similar to atropine. Although meperidine efficacy has been questioned [Citation220], intrapartum analgesia practice in the United Kingdom still uses pethidine during labor [Citation221].
Meperidine is metabolized by N-demethylation to nor-meperidine and hydrolyzed to meperidinic acid by carboxylesterases [Citation222]. Verbeeck and coworkers [Citation223] studied the effect of urinary pH and the excretion of both meperidine and nor-meperidine and found that a change in urinary pH has a profound effect on the excretion of both meperidine (pKa 8.63) and its metabolite nor-meperidine (pKa 9.68), and are consistent with their pKa. The 48 h urinary recovery of unchanged drug changed 22-fold as the urine pH was modified from acidic to alkaline. Alteration in urine pH did not appreciably change blood concentration/time curves for both parent and metabolite [Citation223]. If meperidine is suspected, urine pH needs to be checked.
4.8.7. Methadone
Methadone is a long acting µ receptor full agonist that was introduced to treat heroin addictions in 1965 [Citation1]. Methadone as prescribed is a mixture of both R- and S- enantiomers with R-being the µ opioid agonist responsible for the therapeutic effects as compared to the S-enantiomer which is a poor µ agonist. The R- and S- enantiomers can be separated using chiral chromatography [Citation224]. Methadone is also used to treat chronic pain due to its agonist effects on NMDA receptors and the management of cancer and neuropathic pain [Citation225,Citation226]. It is highly protein bound (86%), predominately to AGP and not significantly to albumin [Citation8]. Thus, any factors that alters the plasma concentration of this acute phase reactant or influence the nature of the binding sites can have significant effect on the in vivo binding. As AGP concentration increases, plasma free methadone concentration decreases [Citation224], possibly manifesting as opioid withdrawal symptoms, since only free methadone can cross the blood-brain barrier [Citation227]. Methadone is demethylated in the liver by the cytochrome P450 system to its inactive metabolites. Following hepatic metabolism, the metabolites are excreted in the urine. Nine metabolites have been detected in urine [Citation228,Citation229].
Methadone (pKa 8.94) excretion is urine pH dependent; it is reabsorbed at alkaline pH, and excretion is enhanced at acidic pH [Citation230]. Many studies, including our own experience, show that as urine pH increases to greater than 7.5, the concentration of methadone (i.e. excretion) in urine decreases. EIA may give a negative result under these circumstances and chromatography may detect just trace amounts of methadone. The author (BMK) has seen cases with negative EIA results for methadone urine on patients with urine pH ≥7.5 (). Some patients are known to take Alka-Seltzer®, an over the counter antacid, which can cause urine pH to increase. Some are also known to add methadone in vitro to the urine sample. Testing for methadone therefore is not recommended. However, its metabolite EDDP is not affected by urine pH and is therefore a better marker for monitoring adherence and adulteration. A specific assay for EDDP is available. Tapentadol and verapamil have been reported to cause false positive results with DRI® methadone EIA [Citation159].
Table 5. Effect of urine pH on methadone excretion.
4.8.7.1. Methadone plasma concentration
Many patients on methadone will request a change in dosage. Changes in their medication, urine pH, non-adherence, or diversion of the drug to the street are amongst the many reasons the patient may initiate this request. Thus, it is highly desirable to know if a patient is compliant with their medication dosage. Urine methadone analysis cannot help as it is qualitative and results only indicate if the patient had taken the medication. One of the major benefits of TDM is being able to monitor adherence to the dose prescribed and has been recommended [Citation231–233]. However, a very wide range of trough and peak plasma concentrations (65 ng/mL to as high as 1255 ng/mL) [Citation234] have been reported, making plasma concentrations difficult to interpret. This wide range is not surprising as most of these patients also have co-morbidities and receive other medications in addition to methadone. These medications can cause drug-drug interaction and profoundly change methadone’s PKs and corresponding plasma concentration [Citation235,Citation236]. The author’s (BMK) laboratory calculated half-life on consecutively received plasma samples between 2002 and 2018. This group of patients had 2 to 13 different medications prescribed to them for their comorbidities. The mean half-life of methadone was found to be 31 ± 21 h (±SD) (n = 287, range 6.5––167 h. We suggest that plasma methadone concentration and half-life be measured in these patients as it will reflect the cumulative effects of drug-drug interactions as well as any other pathophysiological change in the patient. The authors call this as TDM-Pharmacokinetic approach, and it can be applied to manage methadone dosage changes.
Half-life measurement: It is assumed that the patient is on chronic dosing and will be at steady state. The half-life of methadone can be measured by taking two plasma samples: trough and post peak samples. To assure that methadone has distributed, the methadone post peak (post-dose) sample must be taken at least four or more hours post-dose since methadone plasma concentrations are reported to peak between about 2.5–3 h [Citation237,Citation238]. Sampling less than 4 h post-dose will lead to errors as methadone may not have distributed. These levels need not be the “true” post peak or trough, as long as they are separated in time [Citation239]. Half-life is then calculated from the following formula ():
(1)
(1)
(2)
(2)
Figure 7. Calculation of methadone half life. In a once a day (24 h) dosing. C4h (C post peak) must be measured 4 or more hours after last dose to ensure drug distribution has taken place.
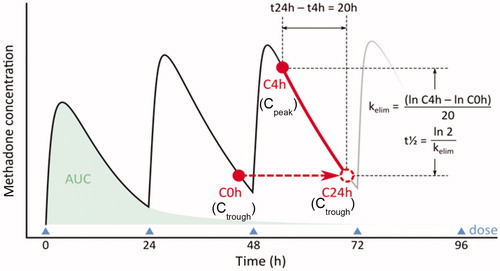
Before initiating trough and post peak blood concentrations, it is recommended to clinically stabilize the patient and wait for approximately two to three weeks for methadone to reach steady state concentration. Should, at a later stage, methadone dosage adjustment be required, then trough and post peak concentrations can be repeated and compared with the previously established baseline trough and half-life values when the patient was stable.
Interpretation:
Half-life same but trough or pre-dose concentration is either lower or higher
Lower pre-dose concentration: → non-adherence
Higher pre-dose concentration: → increase in dose
Half-life changed
Change in clinical condition and/or
change in medication resulting in drug-drug interaction
Dose adjustments may be required if (a) there are changes in clinical condition, (b) other medications are added that may cause changes in half-life and clearance of methadone [Citation235] or (c) the patient is non-compliant.
The principle described here for methadone can be applied to most treatment mediations. Although to perform half-life measurement a significant number of samples are required, limited sampling has been described and can be used [Citation239,Citation240].
4.8.7.2. Methadone metabolite: EDDP
EDDP is the major metabolite of methadone. A negative test for EDDP in the presence of methadone by EIA or a large amount of methadone and “trace” amounts of EDDP by chromatography suggests in vitro addition of methadone. EDDP excretion is not influenced by urinary pH.
In a patient on chronic methadone dosing, both methadone and its metabolite will be at steady state. Urinary EDDP concentrations will also be at steady state. Studies by the authors (unpublished data) suggest that this steady state UEW (in ng/mL) has a mean of ∼±30%. For simplicity’s sake, it is suggested that methadone physicians consider a ± 50% UEW range. If the EDDP concentrations fall outside this range, then questions regarding adherence and sample tampering need to be considered. Urinary creatinine does not add value to this the interpretation ().
As mentioned above, EDDP also facilitates the detection of in vitro addition of methadone. If EDDP is negative by EIA, the sample can be subjected to methadone analysis. If methadone is detected, then the sample was tampered with by in vitro addition of methadone. The following algorithm can be applied:
Urine negative for methadone but positive for EDDP:
Check urine pH: most likely over 7.5 (methadone is reabsorbed at high urine pH). Investigate reason for elevated urine pH
Urine positive for methadone but negative for EDDP
Consider sample tampering - methadone added post-void to the urine sample.
The following are potential reasons for change in EDDP concentration: change in methadone dose (), non-adherence to methadone dose, in vivo dilution, or change in co-medication that alters the half-life of methadone due to drug-drug interactions [Citation235].
Figure 8. Urine EDDP (methadone metabolite) and change in methadone dose. Urine EDDP concentrations fall in tandem with decreasing methadone dose.
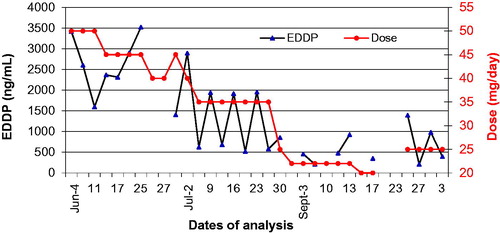
4.8.8. Buprenorphine
Buprenorphine is a partial agonist-antagonist that binds to the μ-opioid receptor with high affinity to produce analgesic effects in the CNS. It is a semi-synthetic derivative of thebaine. Buprenorphine (Subutex™) and buprenorphine with naloxone (Suboxone™) are used to treat opioid dependence. Naloxone is not orally absorbed but when injected it blocks the effect of the buprenorphine, hence its addition to buprenorphine prescription medication Suboxone™. While both buprenorphine and methadone are used for short- and long-term opioid replacement therapy, buprenorphine has the advantage of being a partial agonist and has a “ceiling effect”. Ceiling effect is that after a certain threshold dose, the dose-response curve starts to flatten and mitigates the potential for life-threatening respiratory depression in cases of abuse. Full agonists, such as oxycodone, morphine, and methadone, have no ceiling effect, thus exert stronger effects and side effects with increasing dosage. Buprenorphine works by displacing other opioids from the µ-receptors they occupy in the brain. Buprenorphine and the combination of buprenorphine with naloxone are supplied as sublingual tablets.
Buprenorphine is metabolized by CYP3A4 in the liver to form nor-buprenorphine by N-dealkylation [Citation241]. Its half-life is reported to be 37 h. Buprenorphine glucuronidation occurs through UGT1A1 and UGT2B7, whereas that of nor-buprenorphine occurs through UGT1A1 and UGT1A3 [Citation242]. Nor-buprenorphine, a high affinity P-glycoprotein substrate, has limited blood-brain-barrier penetration [Citation243].
To monitor adherence, buprenorphine/nor-buprenorphine ratio can be considered. In most patients, it takes an estimated 7 h for the ratio between nor-buprenorphine and buprenorphine to become higher than 1 [Citation244]. Donroe and coworkers [Citation245] reviewed the patterns of urine buprenorphine and nor-buprenorphine concentrations in patients prescribed sublingual buprenorphine in an office-based addiction treatment setting. They separated patients who were suspected of sample tampering from those who did not. Patients who were not suspected of sample tampering rarely had buprenorphine concentrations of >1000 ng/mL. Although their sample size was small, these authors suggest that buprenorphine ≥700 ng/mL offered the best accuracy for discriminating between adulterated and non-adulterated specimens.
The buprenorphine EIA comes with two detection thresholds: 5 ng/mL and 10 ng/mL. Urine buprenorphine screening is used to assess buprenorphine compliance and to detect illicit use. Structurally unrelated drugs, namely chloroquine and hydroxychloroquine, have been reported to interfere in the buprenorphine EIA [Citation246]. Recently the antipsychotics, amisulpride (Amazeo) or sulpiride (Dogmatil), have shown to give false positives for buprenorphine by the CEDIA method [Citation247]. Blood/plasma samples for long term storage should be stored at −80 °C [Citation248].
4.8.9. Fentanyl
Fentanyl was synthesized by Janssen Pharmaceuticals in the 1960s and introduced into clinical practice in 1968. It is estimated to be between 80 and 100 times more potent than morphine. In managing pain, fentanyl is often provided via transdermal patches or buccal tablets. This allows the drug to distribute throughout fatty tissues, leading to slower release and prolonged effects. Fentanyl undergoes extensive pulmonary first-pass metabolism as well as hepatic metabolism via CYP3A4 to the inactive metabolite, norfentanyl [Citation249]. The DRI® fentanyl EIA cross-reacts with norfentanyl, acetyl fentanyl, and risperidone [Citation250]. There are a number of fentanyl analogs, a heterogeneous class of opioids, on the illicit market. These include acetyl-fentanyl, alpha-methyl fentanyl, butyrfentanyl, carfentanil, sufentanil, ß-hydroxyfentanyl, and furanylfentanyl [Citation251]. Acetyl-fentanyl, a very potent fentanyl derivative, has been implicated in several deaths in the United States and in Europe [Citation252,Citation253]. There are other fentanyl derivatives, such as sufentanil, alfentanil, lofentanil, and remifentanil, in clinical use. Remifentanil has a short half-life between 1–20 min, limiting it primarily to continuous infusion for epidural pain relief during obstetric delivery [Citation181].
4.8.10. Oxycodone
Oxycodone is a semi-synthetic opioid synthesized from poppy-derived thebaine. It is a narcotic analgesic generally indicated for relief of moderate to severe pain. Oxycodone undergoes N-demethylation to nor-oxycodone and O-demethylation to oxymorphone. The cytochrome CYP3A4 and CYP2D6 mediate the oxidation of oxycodone to oxymorphone. [Citation254,Citation255]. Inhibitors and inducers of these CYPs can increase or decrease oxycodone’s clearance and half-life [Citation212]. Half-life of oxycodone is also age dependent. Patients aged 70–90 y have almost twice the plasma concentration as compared to young adults [Citation256].
Oxycodone is excreted as free drug (8–14%) and as conjugated oxycodone in over 24 h. Noroxycodone is excreted mostly unconjugated and oxymorphone as conjugate [Citation257]. Oxycodone EIA is now available from different reagent manufacturers.
Opiates such as morphine and codeine do not give a positive result with the DRI® oxycodone EIA. As part of our evaluation of this urine EIA assay, we compared 269 oxycodone-positive urine IA results with GC-MS results. In our study, there was only one false positive by EIA. Our studies show a positive predictive value of 99.5%. False negative results were invariably associated with values near the detection threshold (200 ng/mL) of the assay. Oxycodone (Oxycodone™, slow release OxyContin™, OxyNEO™, Percocet™, Percodan™, etc.) does not yield a positive opiate IA test. However, a false positive is possible if a large amount of oxycodone is present in the urine. Oxymorphone, the metabolite of oxycodone, is not detected in patients receiving high-dose morphine [Citation214].
A positive result for oxycodone with EIA indicates the presence of oxycodone and/or oxymorphone (DRI® Oxycodone EIA). A sample from a patient on chronic dosing (i.e. at steady state) should always yield a positive result; if negative, check the sample for dilution. Monitoring urine concentrations can assist in following patients receiving oxycodone (). Chromatographic methods can differentiate between the parent oxycodone and its metabolite nor-oxycodone. Urine positive only for oxycodone and no metabolites suggests that oxycodone was added in vitro (sample tampering).
Figure 9. Oxycodone dose and urine EIA profile. Although oxycodone dose (mg/day) is increasing, oxycodone (ng/mL) concentrations are inconsistent with dose change. Following urinary ng/mL can show non-adherence to dose changes.
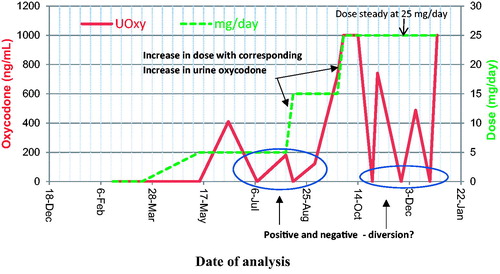
4.8.10.1. Oxymorphone
Oxymorphone, a semi-synthetic opioid, is an analgesic more potent than morphine, but with less sedative effects [Citation258]. It undergoes extensive hepatic first-pass metabolism primarily by glucuronidation. There is drug-drug interaction with drugs metabolized by the CYP2C9 and CYP3A4 [Citation249]. Less than 2% of Oxymorphone is excreted [Citation259] and is detectable by chromatographic methods.
4.8.11. Tramadol
Tramadol is a centrally acting synthetic codeine analog opioid of the benzenoid class that is used to treat moderate to moderately severe pain. Tramadol is metabolized by CYP2B6, CYP2D6, CYP2C19, and CYP3A4 in the liver to its active metabolite O-desmethyl-tramadol, which shows a higher affinity for opioid receptors than the parent drug. The mean terminal elimination half-life of tramadol is approximately 8 h [Citation260]. In patients with renal failure, half-life of tramadol increased suggesting renal clearance and that both dose and intervals of tramadol need to be adjusted in patients with renal impairment [Citation261]. Tramadol half-life is dose dependent in overdose [Citation262]. Although tramadol can be detected by EIA, chromatographical protocol has been recommended [Citation263].
Tramadol has a lower risk of addiction than other opioids; although it is associated with two significant adverse drug reactions: seizure and serotonin syndrome [Citation264]. Tramadol seizures usually occur in patients already taking anticonvulsant medications.
4.9. Pharmacokinetics and pharmacogenetics
The objective of pharmacogenetics is to help predict a patient’s response to a specific medication prior to the drug being administrated leading to the possibility of and assist with personalized medical management [Citation265–269].
Most drugs undergo biotransformation via cytochrome P450 (CYPs) family of enzymes and are responsible for almost 80% of the phase 1 metabolism of these drugs [Citation181]. There is variation in the population genetics and alleles of CYP genes vary among different ethnic populations. A number of these CYP enzymes are polymorphic and metabolize numerous clinically, physiologically, and toxicologically important compounds. Genetic polymorphisms in CYPs account for numerous inter- and intra-individual variations in drug metabolism, which can lead to therapeutic failure due to either induction or inhibition of the metabolizing enzyme [Citation211,Citation255,Citation270]. Cytochrome P450 enzymes, especially CYP2D6, play a major role in drug metabolism. Many drugs can function as substrates, inhibitors, or inducers of CYP2D6 enzyme expression [Citation271]. The inter-individual variability of treatment response and toxicity are also influenced by the polymorphisms of this enzyme.
Since many patients are on multiple medications because of comorbidities, drug-drug and drug-disease interactions frequently occur. Prescribed co-medications for co-morbidities can cause drug-drug interaction and phenoconversion. Phenoconversion is when a genotypic extensive metabolizer is converted into phenotypic poor metabolizer of a drug. This change can modify the clinical response of the drug and result in toxicity [Citation7]. Phenoconversion makes clinical interpretation of CYP P450 pharmacogenetic testing results a significant challenge [Citation265,Citation272]. This also influences the plasma concentration and the amount of drug excreted in urine.
Importance of measuring plasma drug concentrations cannot be overemphasized, and we suggest that clinicians follow TDM-PKs for the treatment drug. The principle described in section “Methadone plasma concentration” for methadone can be applied to most treatment mediations. Although to perform half-life measurement a significant number of samples are required, limited sampling has been described and can be used [Citation239,Citation240]. TDM-PKs reflects the cumulative effects of drug-drug interactions as well as any other pathophysiological change in the patient. Although the data to provide this information is currently lacking for most drugs, it is a unique opportunity for the laboratory scientist to develop the tests and protocols to provide clinical laboratory support in patient care.
This is personalized medicine with an input from the clinical laboratory scientist and their participation in clinical care.
4.10. Summary
When dealing with questions of false positive and false negative results in toxicology, it is critical to have complete information and an up-to-date list of all medications from the physician. This should also include any non-prescribed over the counter supplements, herbs, and naturopathic medications. Besides making pharmacological sense, semi-quantitative urinary results will assist in differentiating “new” drug use from “previous” (i.e. historical) drug use. “Spikes” in urinary concentrations may assist in identifying patterns of drug use.
When requesting a drug screen, it is helpful for the physician to let the laboratory know which specific drug is suspected or being looked for in the specimen. Instead of using generic terms, such as “opiates”, “narcotics”, or “synthetic opiates”, the ordering physician should be more specific. For example, rather than ordering an “opiate” screen, the physician should request a screen for oxycodone or fentanyl. Some drug assays may require modification of the routine analytical protocol and knowing what the physician is looking for helps to tailor the method. As new “opiates” or NPS come onto the market, laboratories aim to add these to the list of tested substances on an ongoing basis.
Drug IAs are available only for a limited number of drugs, whereas most chromatographic-MS coupled methods have a very large repertoire of drugs/chemicals depending on the drug library attached to the system. Interpretation of drug screening results should be done with caution, while considering not only the presence or absence of the parent drug but also the pharmacological properties of the parent drug and its metabolites, the analyte concentration, technology used and the potential of sample tampering.
Despite the existence of sophisticated drug testing methods, it is still possible to obtain incorrect test results. “Positive” or “negative” drug findings can have a serious impact on an individual in a rehabilitation/treatment program. Therefore, it is imperative that persons conducting such tests should adhere to the strictest standards of laboratory performance.
The practice of clinical toxicology is rapidly evolving and the laboratory’s role in affecting patient care is an expanding space. The recent growth in the number of LC-MS instruments in many clinical laboratories has created an enormous growth potential by offering ‘in-house’ developed free drug assays and TDM-PKs of the treatment drug. TDM-PKs reflects the cumulative effects of pathophysiological changes in the patient as well as drug-drug and drug-disease interactions. This is an untapped opportunity for the clinical laboratory scientist to both educate the treating physician and have a significant impact on patient care and personalized medicine.
| Abbreviations | ||
| 3-MAM | = | 3-mono-acetylmorphine |
| 6-MAM | = | 6-mono-acetylmorphine |
| AGP | = | α-1-acid glycoprotein |
| ADH | = | Alcohol dehydrogenase |
| ADHD | = | Attention deficit hyperactivity disorder |
| AO | = | Alcohol oxidase |
| BAC | = | Blood alcohol concentration |
| BEG | = | Benzoylecgonine |
| CBD | = | Cannabidiol |
| CE | = | Capillary electrophoresis |
| CEDIA | = | Cloned Enzyme Donor Immunoassay |
| CNS | = | Central nervous system |
| DBS | = | Dry Blood Spot |
| DOA | = | Drugs of abuse |
| DOM | = | 2,5-Dimethoxy-4-methylamphetamine |
| EC | = | Electron capture |
| EDDP | = | 2-ethylidene-1-5-dimethyl-3,3-diphenylpyrrolidine |
| EIA | = | Enzyme immunoassay |
| ELISA | = | Enzyme-linked immunosorbent assay |
| EME | = | Ecgonine methyl ester |
| EMIT | = | Enzyme-Multiplied Immunoassay Technique |
| ESI | = | Electrospray ionization |
| EtG | = | Ethyl β glucuronide |
| EtS | = | Ethyl sulfate |
| FAEE | = | Fatty acid ethyl ester |
| FASD | = | Fetal alcohol spectrum disorder |
| FDA | = | US Food and Drug Administration |
| FID | = | Flame ionization detector |
| FPIA | = | Fluorescence Polarization Immunoassay |
| GC | = | Gas chromatography |
| HCT | = | Hematocrit |
| HRMS | = | High-resolution mass spectrometry |
| IA | = | Immunoassay |
| KIMS | = | Kinetic Interaction of Microparticles in Solution |
| LC | = | Liquid chromatography |
| LIS | = | Laboratory information systems |
| LOD | = | Limit of detection |
| M3G | = | Morphine-3-glucuronide |
| M6G | = | Morphine-6-glucuronide |
| MALDI | = | Matrix-assisted laser desorption/ionization |
| MDMA/Ecstasy | = | 3,4-Methylenedioxymethamphetamine |
| MS | = | Mass spectrometry |
| m/z | = | Mass-to-charge ratio |
| NP | = | Nitrogen/phosphorous |
| NPS | = | Novel or new psychoactive substances |
| NSAID | = | Nonsteroidal anti-inflammatory drug |
| OF | = | Oral fluid |
| PEth | = | Phosphatidylethanol |
| PK | = | pharmacokinetic |
| PLD | = | Phospholipase D |
| POCT | = | Point of care test |
| RIA | = | Radioimmunoassay |
| SoHT | = | Society of Hair Testing |
| SPE | = | Solid Phase Extraction |
| SpGr | = | Specific gravity |
| SPME | = | Solid Phase Micro Extraction |
| TBW | = | Total body water |
| TDM | = | Therapeutic drug monitoring |
| THC | = | (‒)-trans-δ9-tetrahydrocannabinol |
| THC-COOH/THC-acid | = | δ-9- tetrahydrocannabinoic acid |
| TOF | = | Time-of-flight |
| UAlc | = | Urine alcohol concentration |
| UDT | = | Urine drug testing |
| UCr | = | Urine creatinine |
| UEW | = | Urine excretion window |
| UGlu | = | Urine glucose |
Acknowledgment
We gratefully acknowledge Dr. Prateek Lala's assistance in drawing .
Disclosure statement
No potential conflict of interest was reported by the author(s).
Correction Statement
This article has been corrected with minor changes. These changes do not impact the academic content of the article.
References
- Dole VP, Nyswander M. A medical treatment for diacetylmorphine (Heroin) Addiction. A clinical trial with methadone hydrochloride. JAMA. 1965;193:646–650.
- Langman LJ, Kapur BM. Toxicology: then and now. Clin Biochem. 2006;39(5):498–510.
- Christo PJ, Manchikanti L, Ruan X, et al. Urine drug testing in chronic pain. Pain Physician. 2011;14(2):123–143.
- Nuckols TK, Anderson L, Popescu I, et al. Opioid prescribing: a systematic review and critical appraisal of guidelines for chronic pain. Ann Intern Med. 2014;160(1):38–47.
- Turner JA, Saunders K, Shortreed SM, et al. Chronic opioid therapy urine drug testing in primary care: prevalence and predictors of aberrant results. J Gen Intern Med. 2014;29(12):1663–1671.
- Dupouy J, Memier V, Catala H, et al. Does urine drug abuse screening help for managing patients? A systematic review. Drug Alcohol Depend. 2014;136:11–20.
- Shah RR, Smith RL. Addressing phenoconversion: the Achilles' heel of personalized medicine. Br J Clin Pharmacol. 2015;79(2):222–240.
- Israili ZH, Dayton PG. Human alpha-1-glycoprotein and its interactions with drugs. Drug Metab Rev. 2001;33(2):161–235.
- Musteata FM. Measuring and using free drug concentrations: has there been 'real' progress? Bioanalysis. 2017;9(10):767–769.
- Toennes SW, Maurer HH. Efficient cleavage of conjugates of drugs or poisons by immobilized beta-glucuronidase and arylsulfatase in columns. Clin Chem. 1999;45(12):2173–2182.
- Kang MG, Lin HR. Systematic evaluation and validation of benzodiazepines confirmation assay using LC-MS-MS. J Anal Toxicol. 2019;43(2):96–103.
- Sitasuwan P, Melendez C, Marinova M, et al. Comparison of Purified beta-glucuronidases in patient urine samples indicates a lack of correlation between enzyme activity and drugs of abuse metabolite hydrolysis efficiencies leading to potential false negatives. J Anal Toxicol. 2019;43(3):221–227.
- Muller LD, Opdal MS. Developing a rapid semi-automated sample preparation with alkaline hydrolysis in a 96-well plate for quantification of 11-nor-DELTA9-tetrahydrocannabinol-9-carboxylic acid in urine samples by UHPLC-MS/MS. J Pharm Biomed Anal. 2018;161:296–304.
- Goggin MM, Tann C-M, Miller A, et al. Catching fakes: new markers of urine sample validity and invalidity. J Anal Toxicol. 2017;41(2):121–126.
- Jaffee W, Trucco E, Levy S, et al. Is this urine really negative? a systematic review of tampering methods in urine drug screening and testing. J Subst Abuse Treat. 2007;33(1):33–42.
- Kapur B, Hershkop S, Koren G, et al. Urine fingerprinting: detection of sample tampering in an opiate dependency program. Ther Drug Monit. 1999;21(2):243–250.
- Fu S. Adulterants in urine drug testing. Adv Clin Chem. 2016;76:123–163.
- Cook JD, Strauss KA, Caplan YH, et al. Urine pH: the effects of time and temperature after collection. J Anal Toxicol. 2007;31(8):486–496.
- Feldhammer M, Saitman A, Nguyen L, et al. Dilution of Urine Followed by Adulteration in an Attempt to Deceive the Laboratory. J Anal Toxicol. 2019;43(1):e7–e9.
- Kim VJ, Okano CK, Osborne CR, et al. Can synthetic urine replace authentic urine to "beat" workplace drug testing? Drug Test Anal. 2019;11(2):331–335.
- Koren G. Measurement of drugs in neonatal hair; a window to fetal exposure. Forensic Sci Int. 1995;70(1-3):77–82.
- Kintz P. Issues about axial diffusion during segmental hair analysis. Ther Drug Monit. 2013;35(3):408–410.
- Saitoh M, Uzuka M, Sakamoto M. Rate of hair growth. Adv Biol Skin Hair Growth. 1967;9:183–194.
- Saitoh M, Uzuka M, Sakamoto M. Human hair cycle. J Invest Dermatol. 1970;54(1):65–81.
- Bailey DN. Drug screening in an unconventional matrix: hair analysis. JAMA. 1989;262(23):3331.
- Wille SM, Baumgartner MR, Fazio VD, et al. Trends in drug testing in oral fluid and hair as alternative matrices. Bioanalysis. 2014;6(17):2193–2209.
- Scholz C, Quednow BB, Herdener M, et al. Cocaine hydroxy metabolites in hair: indicators for cocaine use versus external contamination. J Anal Toxicol. 2019;43(7):543–552.
- Tsanaclis L, Andraus M, Wicks J. Hair analysis when external contamination is in question: a review of practical approach for the interpretation of results. Forensic Sci Int. 2018;285:105–110.
- Kidwell DA, Smith FP, Shepherd AR. Ethnic hair care products may increase false positives in hair drug testing. Forensic Sci Int. 2015;257:160–164.
- Hartwig S, Auwarter V, Pragst F. Effect of hair care and hair cosmetics on the concentrations of fatty acid ethyl esters in hair as markers of chronically elevated alcohol consumption. Forensic Sci Int. 2003;131(2-3):90–97.
- Cuypers E, Flanagan RJ. The interpretation of hair analysis for drugs and drug metabolites. Clin Toxicol. 2018;56(2):90–100.
- Montgomery DP, Plate CA, Jones M, et al. Using umbilical cord tissue to detect fetal exposure to illicit drugs: a multicentered study in Utah and New Jersey. J Perinatol. 2008;28(11):750–753.
- Ostrea EM, Jr., Bielawski DM, Posecion NC. Jr. Meconium analysis to detect fetal exposure to neurotoxicants. Arch Dis Child. 2006;91(8):628–629.
- Colby JM, Cotten SW. Facing challenges in neonatal drug testing. Clinical Laboratory News. 2018. Available from: https://www.aacc.org/publications/cln/articles/2018/march/facing-challenges-in-neonatal-drug-testing
- Colby JM, Adams BC, Morad A, et al. Umbilical cord tissue and meconium may not be equivalent for confirming in utero substance exposure. J Pediatr. 2019;205:277–280.
- Zelner I, Hutson JR, Kapur BM, et al. False-positive meconium test results for fatty acid ethyl esters secondary to delayed sample collection. Alcohol Clin Exp Res. 2012;36(9):1497–1506.
- Ostrea EM. Jr. Testing for exposure to illicit drugs and other agents in the neonate: a review of laboratory methods and the role of meconium analysis. Curr Probl Pediatr. 1999;29(2):37–56.
- Palmer KL, Krasowski MD. Alternate matrices: meconium, cord tissue, hair, and oral fluid. In: Langman LJ, Snozek CLH, editors. LC-MS in drug analysis: methods in molecular biology vol. 1872. New York, NY: Humana Press; 2019. p. 191–197.
- Ilea A, Andrei V, Feurdean CN, et al. Saliva, a magic biofluid available for multilevel assessment and a mirror of general health-a systematic review. Biosensors. 2019;9(1):27.
- Kaczor-Urbanowicz KE, Martin Carreras-Presas C, Aro K, et al. Saliva diagnostics - current views and directions. Exp Biol Med (Maywood)). 2017;242(5):459–472.
- Cone EJ, Clarke J, Tsanaclis L. Prevalence and disposition of drugs of abuse and opioid treatment drugs in oral fluid. J Anal Toxicol. 2007;31(8):424–433.
- Pichini S, Altieri I, Zuccaro P, et al. Drug monitoring in nonconventional biological fluids and matrices. Clin Pharmacokinet. 1996;30(3):211–228.
- Kidwell DA, Holland JC, Athanaselis S. Testing for drugs of abuse in saliva and sweat. J Chromatogr. 1998;713(1):111–135.
- Abebe W. Khat and synthetic cathinones: emerging drugs of abuse with dental implications. Oral Surg Oral Med Oral Pathol Oral Radiol. 2018;125(2):140–146.
- Aps JK, Martens LC. Review: the physiology of saliva and transfer of drugs into saliva. Forensic Sci Int. 2005;150(2-3):119–131.
- Desrosiers NA, Huestis MA. Oral fluid drug testing: analytical approaches, issues and interpretation of results. J Anal Toxicol. 2019;43(6):415–443.
- Drummer OH, Gerostamoulos J, Batziris H, et al. The incidence of drugs in drivers killed in Australian road traffic crashes. Forensic Sci Int. 2003;134(2-3):154–162.
- Bakke E, Hoiseth G, Arnestad M, et al. Detection of drugs in simultaneously collected samples of oral fluid and blood. J Anal Toxicol. 2019;43(3):228–232.
- Mucklow JC, Bending MR, Kahn GC, et al. Drug concentration in saliva. Clin Pharmacol Ther. 1978;24(5):563–570.
- Bang IC. Ein verfahren zur mikrobestimmung von blutbestandteilen. Biochem Z. 1913;49:19–39. [German]
- Guthrie R, Susi A. A simple phenylalanine method for detecting phenylketonuria in large populations of newborn infants. Pediatrics. 1963;32:338–343.
- Schutz H, Gotta JC, Erdmann F, et al. Simultaneous screening and detection of drugs in small blood samples and bloodstains. Forensic Sci Int. 2002;126(3):191–196.
- Kumar P, Agrawal P, Chatterjee K. Challenges and opportunities in blood flow through porous substrate:A design and interface perspective of dried blood spot. J Pharm Biomed Anal. 2019;175:112772.
- Kloosterboer SM, de Winter BCM, Bahmany S, et al. Dried blood spot analysis for therapeutic drug monitoring of antipsychotics: drawbacks of its clinical application. Ther Drug Monit. 2018;40(3):344–350.
- Ambach L, Menzies E, Parkin MC, et al. Quantification of cocaine and cocaine metabolites in dried blood spots from a controlled administration study using liquid chromatography-tandem mass spectrometry. Drug Test Anal. 2019;11(5):709–720.
- Duthaler U, Berger B, Erb S, et al. Using dried blood spots to facilitate therapeutic drug monitoring of antiretroviral drugs in resource-poor regions. J Antimicrob Chemother. 2018;73(10):2729–2737.
- Freeman JD, Rosman LM, Ratcliff JD, et al. State of the science in dried blood spots. Clin Chem. 2018;64(4):656–679.
- Zakaria R, Allen KJ, et al. Advantages and challenges of dried blood spot analysis by mass spectrometry across the total testing process. J Inter Feder Clin Chem Lab Med. 2016;27(4):288–317.
- Velghe S, Delahaye L, Stove CP. Is the hematocrit still an issue in quantitative dried blood spot analysis? J Pharm Biomed Anal. 2019;163:188–196.
- Denniff P, Spooner N. Volumetric absorptive microsampling: a dried sample collection technique for quantitative bioanalysis. Anal Chem. 2014;86(16):8489–8495.
- Gaugler S, Al-Mazroua MK, Issa SY, et al. Fully automated forensic routine dried blood spot screening for workplace testing. J Anal Toxicol. 2019;43(3):212–220.
- Caramelo D, Rosado T, Oliveira V, et al. Determination of antipsychotic drugs in oral fluid using dried saliva spots by gas chromatography-tandem mass spectrometry. Anal Bioanal Chem. 2019;411(23):6141–6153.
- Ribeiro A, Prata M, Vaz C, et al. Determination of methadone and EDDP in oral fluid using the dried saliva spots sampling approach and gas chromatography-tandem mass spectrometry. Anal Bioanal Chem. 2019;411(10):2177–2187.
- Rubenstein KE, Schneider RS, Ullman EF. "Homogeneous" enzyme immunoassay. A new immunochemical technique. Biochem Biophys Res Commun. 1972;47(4):846–851.
- Schneider RS, Lindquist P, Tong-In WE, et al. Homogeneous enzyme immunoassay for opiates in urine. Clin Chem. 1973;19(8):821–825.
- Cotten SW, Duncan DL, Burch EA, et al. Unexpected interference of baby wash products with a cannabinoid (THC) immunoassay. Clin Biochem. 2012;45(9):605–609.
- Kapur BM. False positive drugs of abuse immunoassays. Clin Biochem. 2012;45(9):603–604.
- Bertholf RL, Sharma R, Reisfield GM. Predictive value of positive drug screening results in an urban outpatient population. J Anal Toxicol. 2016;40(9):726–731.
- Langman LJ, Snozek CLH, editors. LC-MS in drug analysis methods and protocols. New York, Heidelberg, Dordrecht, London: Humana Press, Springer; 2012. p. 1–222.
- Nilsson MI, Widerlov E, Meresaar U, et al. Effect of urinary pH on the disposition of methadone in man. Eur J Clin Pharmacol. 1982;22(4):337–342.
- Arthur CL, Pawliszyn J. Solid phase microextraction with thermal desorption using fused silica optical fibers. Anal Chem. 1990;62(19):2145–2148.
- Pragst F. Application of solid-phase microextraction in analytical toxicology. Anal Bioanal Chem. 2007;388(7):1393–1414.
- Risticevic S, Lord H, Górecki T, et al. Protocol for solid-phase microextraction method development. Nat Protoc. 2010;5(1):122–139.
- Azzi-Achkouty S, Estephan N, Ouaini N, et al. Headspace solid-phase microextraction for wine volatile analysis. Crit Rev Food Sci Nutr. 2017;57(10):2009–2020.
- Hamidi S, Ipour-Ghorbani N, Hamidi A. Solid phase microextraction techniques in determination of biomarkers. Crit Rev Anal Chem. 2018;48(4):239–251.
- Seidi S, Rezazadeh M, Alizadeh R. Miniaturized sample preparation methods for saliva analysis. Bioanalysis. 2019;11(2):119–148.
- Ghosh C, Singh V, Grandy J, et al. Recent advances in breath analysis to track human health by new enrichment technologies. J Sep Sci. 2020;43(1):226–240.
- United Nations Office on Drugs and Crime. UNODC Early Warning Advisory on New Psychoactive Substances. 2020 [cited 2020 Mar 22]. Available from: https://www.unodc.org/LSS/Page/NPS
- Graziano S, Anzillotti L, Mannocchi G, et al. Screening methods for rapid determination of new psychoactive substances (NPS) in conventional and non-conventional biological matrices. J Pharm Biomed Anal. 2019;163:170–179.
- Kraemer M, Boehmer A, Madea B, et al. Death cases involving certain new psychoactive substances: A review of the literature. Forensic Sci Int. 2019;298:186–267.
- Alexandre J, Carmo H, Carvalho F, et al. Synthetic cannabinoids and their impact on neurodevelopmental processes. Addict Biol. 2020;25(2):e12824.
- Rinaldi R, Bersani G, Marinelli E, et al. The rise of new psychoactive substances and psychiatric implications: A wide-ranging, multifaceted challenge that needs far-reaching common legislative strategies. Hum Psychopharmacol. 2020;35:e2727.
- Peacock A, Bruno R, Gisev N, et al. New psychoactive substances: challenges for drug surveillance, control, and public health responses. Lancet. 2019;394(10209):1668–1684.
- Gerostamoulos D, Elliott S, Walls HC, et al. To measure or not to measure? that is the NPS question. J Anal Toxicol. 2016;40(4):318–320.
- Jorgenson JW, Lukacs KD. Free-zone electrophoresis in glass capillaries. Clin Chem. 1981;27(9):1551–1553.
- Barbula GK, Safi S, Chingin K, et al. Interfacing capillary-based separations to mass spectrometry using desorption electrospray ionization. Anal Chem. 2011;83(6):1955–1959.
- Deterding LJ, Moseley MA, Tomer KB, et al. Nanoscale separations combined with tandem mass spectrometry. J Chromatogr. 1991;554(1-2):73–82.
- Moini M, Rollman CM. Compatibility of highly sulfated cyclodextrin with electrospray ionization at low nanoliter/minute flow rates and its application to capillary electrophoresis/electrospray ionization mass spectrometric analysis of cathinone derivatives and their optical isomers. Rapid Commun Mass Spectrom. 2015;29(3):304–310.
- DiBattista A, Rampersaud D, Lee H, et al. High throughput screening method for systematic surveillance of drugs of abuse by multisegment injection-capillary electrophoresis-mass spectrometry. Anal Chem. 2017;89(21):11853–11861.
- Kapur BM, Allgeier H, Reichstein T. [The glycosides of the roots from Kanahia laniflora (Forssk.) R. Br. 1. Isolation]. [German]. Helv Chim Acta. 1967;50(7):2147–2171.
- Kondrat RW, McClusky GA, Cooks RG. Multiple reaction monitoring in mass spectrometry/mass spectrometry for direct analysis of complex mixtures. Anal Chem. 1978;50(14):2017–2021.
- Murray KK, Boyd RK, Eberlin MN, et al. Definitions of terms relating to mass spectrometry (IUPAC Recommendations 2013. ). Pure Appl Chem. 2013;85(7):1515–1609.
- Marshall G, Blakney T, Chen T, et al. Mass resolution and mass accuracy: how much is enough? Mass Spectrometry. 2013;2(Special_Issue):S0009–S0009. Iss.
- Ramanathan R, Korfmacher W. Hrms or hrams? Bioanalysis. 2016;8(16):1639–1640.
- Huestis MA, Brandt SD, Rana S, et al. Impact of novel psychoactive substances on clinical and forensic toxicology and global public health. Clin Chem. 2017;63(10):1564–1569.
- Annesley TM. Ion suppression in mass spectrometry. Clin Chem. 2003;49(7):1041–1044.
- Furey A, Moriarty M, Bane V, et al. Ion suppression; a critical review on causes, evaluation, prevention and applications. Talanta. 2013;115:104–122.
- Le Blaye O. Variations in internal standard response: some thoughts and real-life cases. Bioanalysis. 2019;11(18):1715–1725.
- van de Merbe NC, Koster RA, Ohnmacht C. Very complex internal standard response variation in LC-MS/MS bioanalysis: root cause analysis and impact assessment. Bioanalysis. 2019;11(18):1693–1700.
- Mandatory Guidelines for Federal Workplace Drug Testing Programs. Department of Health and Human Services, Agency: Substance Abuse and Mental Health Services Administration(SAMHSA), HHS. 2017. Available from: https://www.samhsa.gov/sites/default/files/workplace/frn_vol_82_7920_.pdf
- Selavka CM. Poppy seed ingestion as a contributing factor to opiate-positive urinalysis results: the Pacific perspective. J Forensic Sci. 1991;36(3):685–696.
- Mikkelsen SL, Ash KO. Adulterants causing false negatives in illicit drug testing. Clin Chem. 1988;34(11):2333–2336.
- Dasgupta A. How people try to beat drug testing: issues with urinary adulterants and their detection. Clinical Laboratory News. 2015. Available from: https://www.aacc.org/publications/cln/articles/2015/february/Drug-Testing.aspx
- Matriciani B, Huppertz B, Keller R, et al. False-negative results in the immunoassay analysis of drugs of abuse: can adulterants be detected by sample check test? Ann Clin Biochem. 2018;55(3):348–354.
- Beckett AH, Rowland M, Turner P. Influence of urinary ph on excretion of amphetamine. Lancet. 1965;1(7380):303.
- Wu AH, Forte E, Casella G, et al. CEDIA for screening drugs of abuse in urine and the effect of adulterants. J Forensic Sci. 1995;40(4):614–618.
- Urry FM, Komaromy-Hiller G, Staley B, et al. Nitrite adulteration of workplace urine drug-testing specimens. I. Sources and associated concentrations of nitrite in urine and distinction between natural sources and adulteration. J Anal Toxicol. 1998;22(2):89–95.
- Kapur BM. CBAC: computerized blood alcohol concentration a computer model as a clinical and an educational tool. Ann Biochim Clin Que. 1991;30(2):36–39.
- Watson PE, Watson ID, Batt RD. Total body water volumes for adult males and females estimated from simple anthropometric measurements. Am J Clin Nutr. 1980;33(1):27–39.
- Cederbaum AI. Alcohol metabolism. Clin Liver Dis. 2012;16(4):667–685.
- Cederbaum AI. Regulation of pathways of alcohol metabolism by the liver. Mt Sinai J Med. 1980;47(3):317–328.
- Foti RS, Fisher MB. Assessment of UDP-glucuronosyltransferase catalyzed formation of ethyl glucuronide in human liver microsomes and recombinant UGTs. Forensic Sci Int. 2005;153(2-3):109–116.
- Dahl H, Stephanson N, Beck O, et al. Comparison of urinary excretion characteristics of ethanol and ethyl glucuronide. J Anal Toxicol. 2002;26(4):201–204.
- Bostrom H, Vestermark AE. Studies on ester sulphates. 7. On the excretion of sulphate conjugates of primary aliphatic alcohols in the urine of rats. Acta Physiol Scand. 1960;48:88–94.
- Manautou JE, Carlson GP. Comparison of pulmonary and hepatic glucuronidation and sulphation of ethanol in rat and rabbit in vitro. Xenobiotica. 1992;22(11):1309–1319.
- Winek CL, Carfagna M. Comparison of plasma, serum, and whole blood ethanol concentrations. J Anal Toxicol. 1987;11(6):267–268.
- Jones AW. Top ten defence challenges among drinking drivers in Sweden. Med Sci Law. 1991;31(3):229–238.
- Iffland R, Jones AW. Evaluating alleged drinking after driving–the hip-flask defence. Part 1. Double blood samples and urine-to-blood alcohol relationship. Med Sci Law. 2002;42(3):207–224.
- Kronstrand C, Nilsson G, Cherma MD, et al. Evaluating the hip-flask defence in subjects with alcohol on board: An experimental study. Forensic Sci Int. 2019;294:189–195.
- Alexander WD, Wills PD, Eldred N. Urinary ethanol and diabetes mellitus. Diabet. Diabet Med. 1988;5(5):463–464.
- Saady JJ, Poklis A, Dalton HP. Production of urinary ethanol after sample collection. J Forensic Sci. 1993;38(6):1467–1471.
- Goldberg DM, Kapur BM. Enzymes and circulating proteins as markers of alcohol abuse. Clin Chim Acta. 1994;226(2):191–209.
- Nanau RM, Neuman MG. Biomolecules and biomarkers used in diagnosis of alcohol drinking and in monitoring therapeutic interventions. Biomolecules. 2015;5(3):1339–1385.
- Borucki K, Schreiner R, Dierkes J, et al. Detection of recent ethanol intake with new markers: comparison of fatty acid ethyl esters in serum and of ethyl glucuronide and the ratio of 5-hydroxytryptophol to 5-hydroxyindole acetic acid in urine. Alcohol Clin Exp Res. 2005;29(5):781–787.
- Oppolzer D, Barroso M, Gallardo E. Bioanalytical procedures and developments in the determination of alcohol biomarkers in biological specimens. Bioanalysis. 2016;8(3):229–251.
- Halter CC, Dresen S, Auwaerter V, et al. Kinetics in serum and urinary excretion of ethyl sulfate and ethyl glucuronide after medium dose ethanol intake. Int J Legal Med. 2008;122(2):123–128.
- Leickly E, McDonell MG, Vilardaga R, et al. High levels of agreement between clinic-based ethyl glucuronide (EtG) immunoassays and laboratory-based mass spectrometry. Am J Drug Alcohol Abuse. 2015;41(3):246–250.
- Fosen JT, Morini L, Sempio C, et al. Levels of Hair ethyl glucuronide in patients with decreased kidney function: possibility of misclassification of social drinkers. Alcohol Clin Exp Res. 2016;40(3):451–456.
- Costantino A, DiGregorio EJ, Korn W, et al. The effect of the use of mouthwash on ethylglucuronide concentrations in urine. J Anal Toxicol. 2006;30(9):659–662.
- Thierauf A, Gnann H, Wohlfarth A, et al. Urine tested positive for ethyl glucuronide and ethyl sulphate after the consumption of "non-alcoholic" beer. Forensic Sci Int. 2010;202(1-3):82–85.
- Musshoff F, Albermann E, Madea B. Ethyl glucuronide and ethyl sulfate in urine after consumption of various beverages and foods–misleading results? Int J Legal Med. 2010;124(6):623–630.
- Hoiseth G, Yttredal B, Karinen R, et al. Ethyl glucuronide concentrations in oral fluid, blood, and urine after volunteers drank 0.5 and 1.0 g/kg doses of ethanol. J Anal Toxicol. 2010;34(6):319–324.
- Helander A, Beck O. Ethyl sulfate: a metabolite of ethanol in humans and a potential biomarker of acute alcohol intake. J Anal Toxicol. 2005;29(5):270–274.
- Wurst FM, Dresen S, Allen JP, et al. Ethyl sulphate: a direct ethanol metabolite reflecting recent alcohol consumption. Addiction. 2006;101(2):204–211.
- Hoiseth G, Morini L, Polettini A, et al. Serum/whole blood concentration ratio for ethylglucuronide and ethyl sulfate. J Anal Toxicol. 2009;33(4):208–211.
- Hoiseth G, Morini L, Polettini A, et al. Blood kinetics of ethyl glucuronide and ethyl sulphate in heavy drinkers during alcohol detoxification. Forensic Sci Int. 2009;188(1-3):52–56.
- Gnann H, Engelmann C, Skopp G, et al. Identification of 48 homologues of phosphatidylethanol in blood by LC-ESI-MS/MS. Anal Bioanal Chem. 2010;396(7):2415–2423.
- Gnann H, Thierauf A, Hagenbuch F, et al. Time dependence of elimination of different PEth homologues in alcoholics in comparison with social drinkers. Alcohol Clin Exp Res. 2014;38(2):322–326.
- Alling C, Gustavsson L, Anggard E. An abnormal phospholipid in rat organs after ethanol treatment. FEBS Lett. 1983;152(1):24–28.
- Isaksson A, Walther L, Hansson T, et al. Phosphatidylethanol in blood (B-PEth): a marker for alcohol use and abuse. Drug Test Anal. 2011;3(4):195–200.
- Luginbuhl M, Gaugler S, Weinmann W. Fully automated determination of phosphatidylethanol 16:0/18:1 and 16:0/18:2 in dried blood spots. J Anal Toxicol. 2019;43(6):489–496.
- Varga A, Hansson P, Johnson G, et al. Normalization rate and cellular localization of phosphatidylethanol in whole blood from chronic alcoholics. Clin Chim Acta. 2000;299(1-2):141–150.
- Hansson P, Caron M, Johnson G, et al. Blood phosphatidylethanol as a marker of alcohol abuse: levels in alcoholic males during withdrawal. Alcohol Clin Exp Res. 1997;21(1):108–110.
- Schrock A, Thierauf-Emberger A, Schurch S, et al. Phosphatidylethanol (PEth) detected in blood for 3 to 12 days after single consumption of alcohol-a drinking study with 16 volunteers. Int J Legal Med. 2017;131(1):153–160.
- Varga A, Hansson P, Lundqvist C, et al. Phosphatidylethanol in blood as a marker of ethanol consumption in healthy volunteers: comparison with other markers. Alcohol Clin Exp Res. 1998;22(8):1832–1837.
- Laposata EA, Lange LG. Presence of nonoxidative ethanol metabolism in human organs commonly damaged by ethanol abuse. Science. 1986;231(4737):497–499.
- Lange LG, Bergmann SR, Sobel BE. Identification of fatty acid ethyl esters as products of rabbit myocardial ethanol metabolism. J Biol Chem. 1981;256(24):12968–12973.
- Laposata EA, Scherrer DE, Mazow C, et al. Metabolism of ethanol by human brain to fatty acid ethyl esters. J Biol Chem. 1987;262(10):4653–4657.
- Laposata EA, Scherrer DE, Lange LG. Fatty acid ethyl esters in adipose tissue. A laboratory marker for alcohol-related death. Arch Pathol Lab Med. 1989;113(7):762–766.
- Soderberg BL, Salem RO, Best CA, et al. Fatty acid ethyl esters. Ethanol metabolites that reflect ethanol intake. Am J Clin Pathol. 2003;119(0):94–S99.
- Laposata M. Fatty acid ethyl esters: short-term and long-term serum markers of ethanol intake. Clin Chem. 1997;43(8:Pt 2):1527–1534.
- Kintz P. 2014 consensus for the use of alcohol markers in hair for assessment of both abstinence and chronic excessive alcohol consumption. Forensic Sci Int. 2015;249:A1–A2.
- Kintz P, Nicholson D. Testing for ethanol markers in hair: discrepancies after simultaneous quantification of ethyl glucuronide and fatty acid ethyl esters. Forensic Sci Int. 2014;243:44–46.
- Hagel JM, Krizevski R, Marsolais F, et al. Biosynthesis of amphetamine analogs in plants. Trends Plant Sci. 2012;17(7):404–412.
- Beckett AH, Rowland M. Rhythmic urinary excretion of amphetamine in man. Nature. 1964;204:1203–1204.
- Davis JM, Kopin IJ, Lemberger L, et al. Effects of urinary ph on amphetamine metabolism. Ann N Y Acad Sci. 1971;179(6):493–501.
- Anggård E, Gunne L-M, Jönsson L-E, et al. Pharmacokinetic and clinical studies on amphetamine-dependent subjects. Eur J Clin Pharmacol. 1970;3(1):3–11.
- Hutson PH, Pennick M, Secker R. Preclinical pharmacokinetics, pharmacology and toxicology of lisdexamfetamine: a novel d-amphetamine pro-drug. Neuropharmacology. 2014;87:41–50.
- Saitman A, Park HD, Fitzgerald RL. False-positive interferences of common urine drug screen immunoassays: a review. J Anal Toxicol. 2014;38(7):387–396.
- Drummer OH. Methods for the measurement of benzodiazepines in biological samples. J Chromatogr. 1998;713(1):201–225.
- Maurer H, Pfleger K. Identification and Differentiation of Benzodiazepines and Their Metabolites in Urine by Computerized Gas Chromatography-Mass Spectrometry. J Chromatogr Biomed Appl. 1987;422:85–101.
- Baselt RC, editor. Disposition of toxic drugs and chemicals in man. 9th ed. Seal Beach (CA): Biomedical Publications; 2011. p. 376–377.
- Nasky KM, Cowan GL, Knittel DR. False-positive urine screening for benzodiazepines: an association with sertraline?: a two-year retrospective chart analysis. Psychiatry (Edgmont)). 2009;6(7):36–39.
- Battino D, Avanzini G, Bossi L, et al. Plasma levels of primidone and its metabolite phenobarbital: effect of age and associated therapy. Ther Drug Monit. 1983;5(1):73–79.
- Pertwee RG. Cannabinoid pharmacology: the first 66 years. Br J Pharmacol. 2009;147(S1):S163–S171.
- ElSohly MA, Slade D. Chemical constituents of marijuana: the complex mixture of natural cannabinoids. Life Sci. 2005;78(5):539–548.
- Radwan MM, ElSohly MA, Slade D, et al. Biologically active cannabinoids from high-potency Cannabis sativa. J Nat Prod. 2009;72(5):906–911.
- Carlini EA. The good and the bad effects of (-) trans-delta-9-tetrahydrocannabinol (Delta 9-THC) on humans. Toxicon. 2004;44(4):461–467.
- Thomas BF, Compton DR, Martin BR. Characterization of the lipophilicity of natural and synthetic analogs of delta 9-tetrahydrocannabinol and its relationship to pharmacological potency. J Pharmacol Exp Ther. 1990;255(2):624–630.
- Ashton CH. Pharmacology and effects of cannabis: a brief review. Br J Psychiatry. 2001;178:101–106.
- Grotenhermen F. Pharmacokinetics and pharmacodynamics of cannabinoids. Clin Pharmacokinet. 2003;42(4):327–360.
- Huestis MA, Henningfield JE, Cone EJ. Blood cannabinoids. I. Absorption of THC and formation of 11-OH-THC and THCCOOH during and after smoking marijuana. J Anal Toxicol. 1992;16(5):276–282.
- Huestis MA. Human cannabinoid pharmacokinetics. Chem Biodivers. 2007;4(8):1770–1804.
- Martin JH, Schneider J, Lucas CJ, et al. Exogenous cannabinoid efficacy: merely a pharmacokinetic interaction? Clin Pharmacokinet. 2018;57(5):539–545.
- Solowij N, Broyd SJ, van Hell HH, et al. A protocol for the delivery of cannabidiol (CBD) and combined CBD and 9-tetrahydrocannabinol (THC) by vaporisation. BMC Pharmacol Toxicol. 2014;15:58.
- Taylor M, Lees R, Henderson G, et al. Comparison of cannabinoids in hair with self-reported cannabis consumption in heavy, light and non-cannabis users. Drug & Alcohol Review. 2017;36(2):220–226.
- McShane AJ, S B, Heideloff C, et al. Falsely low urine d9-tetrahydrocannabinol COOH levels from metal lid specimen containers with a low-density polyethylene lining. Jrnl App Lab Med. 2017;1(5):590–592.
- Clark TM, Jones JM, Hall AG, et al. Theoretical explanation for reduced body mass index and obesity rates in cannabis users. Cannabis Cannabinoid Res. 2018;3(1):259–271.
- Goodwin RS, Darwin WD, Chiang CN, et al. Urinary elimination of 11-nor-9-carboxy-delta9-tetrahydrocannnabinol in cannabis users during continuously monitored abstinence. J Anal Toxicol. 2008;32(8):562–569.
- Stout SM, Cimino NM. Exogenous cannabinoids as substrates, inhibitors, and inducers of human drug metabolizing enzymes: a systematic review. Drug Metab Rev. 2014;46(1):86–95.
- Kapur BM, Lala PK, Shaw JL. Pharmacogenetics of chronic pain management. Clin Biochem. 2014;47(13-14):1169–1187.
- Rollins DE, Jennison TA, Jones G. Investigation of interference by nonsteroidal anti-inflammatory drugs in urine tests for abused drugs. Clin Chem. 1990;36(4):602–606.
- Niedbala S, Kardos K, Salamone S, et al. Passive cannabis smoke exposure and oral fluid testing. J Anal Toxicol. 2004;28(7):546–552.
- Morland J, Bugge A, Skuterud B, et al. Cannabinoids in blood and urine after passive inhalation of Cannabis smoke. J Forensic Sci. 1985;30(4):997–1002.
- Solowij N, Galettis P, Broyd SJ, et al. Second-Hand exposure of staff administering vaporised cannabinoid products to patients in a hospital setting. Drugs in R & D. 2018;18(1):41–44.
- Valentine JL, Bryant PJ, Gutshall PL, et al. Detection of d9-tetrahydrocannabinol in human breath following marijuana smoking. Anal Lett. 1979;12(8):867–880.
- Luo YR, Yun C, Lynch KL. Quantitation of cannabinoids in breath samples using a novel derivatization LC–MS/MS assay with ultra-high sensitivity. J Anal Toxicol. 2019;43(5):331–339.
- Coe MA, Jufer Phipps RA, Cone EJ, et al. Bioavailability and pharmacokinetics of oral cocaine in humans. J Anal Toxicol. 2018;42(5):285–292.
- Fish F, Wilson WD. Excretion of cocaine and its metabolites in man. J Pharm Pharmacol. 1969;21(Suppl):135–138.
- Kogan MJ, Verebey KG, DePace AC, et al. Quantitative determination of benzoylecgonine and cocaine in human biofluids by gas-liquid chromatography. Anal Chem. 1977;49(13):1965–1969.
- Inaba T, Stewart DJ, Kalow W. Metabolism of cocaine in man. Clin Pharmacol Ther. 1978;23(5):547–552.
- Stewart DJ, Inaba T, Lucassen M, et al. Cocaine metabolism: cocaine and norcocaine hydrolysis by liver and serum esterases. Clin Pharmacol Ther. 1979;25(4):464–468.
- Baselt RC. Stability of cocaine in biological fluids. J Chromatogr. 1983;268(3):502–505.
- Isenschmid DS, Fischman MW, Foltin RW, et al. Concentration of cocaine and metabolites in plasma of humans following intravenous administration and smoking of cocaine. J Anal Toxicol. 1992;16(5):311–314.
- Barnett G, Hawks R, Resnick R. Cocaine pharmacokinetics in humans. J Ethnopharmacol. 1981;3(2-3):353–366.
- Jatlow P, Elsworth JD, Bradberry CW, et al. Cocaethylene: a neuropharmacologically active metabolite associated with concurrent cocaine-ethanol ingestion. Life Sci. 1991;48(18):1787–1794.
- Rose JS. Cocaethylene: a current understanding of the active metabolite of cocaine and ethanol. Am J Emerg Med. 1994;12(4):489–490.
- Mack A. Examination of the evidence for off-label use of gabapentin. J Manag Care Pharm. 2003;9(6):559–568.
- Senderovich H, Jeyapragasan G. Is there a role for combined use of gabapentin and pregabalin in pain control? Too good to be true? Curr Med Res Opin. 2018;34(4):677–682.
- Burns ML, Kinge E, Stokke OM, et al. Therapeutic drug monitoring of gabapentin in various indications. Acta Neurol Scand. 2019;139(5):446–454.
- Bonnet U, Scherbaum N. How addictive are gabapentin and pregabalin? A systematic review. Eur Neuropsychopharmacol. 2017;27(12):1185–1215.
- Trescot AM, Datta S, Lee M, et al. Opioid pharmacology. Pain Physician. 2008;11(2 Suppl):S133–S153.
- Zerell U, Ahrens B, Gerz P. Documentation of a heroin manufacturing process in Afghanistan. Bull Narc. 2005;57(1-2):11–31.
- von EM, Villen T, Svensson JO, et al. Interpretation of the presence of 6-monoacetylmorphine in the absence of morphine-3-glucuronide in urine samples: evidence of heroin abuse. Ther Drug Monit. 2003;25(5):645–648.
- Ohno S, Kawana K, Nakajin S. Contribution of UDP-glucuronosyltransferase 1A1 and 1A8 to morphine-6-glucuronidation and its kinetic properties. Drug Metab Dispos. 2008;36(4):688–694.
- Coffman BL, Rios GR, King CD, et al. Human UGT2B7 catalyzes morphine glucuronidation. Drug Metab Dispos. 1997;25(1):1–4.
- Caraco Y, Tateishi T, Guengerich FP, et al. Microsomal codeine N-demethylation: cosegregation with cytochrome P4503A4 activity. Drug Metab Dispos. 1996;24(7):761–764.
- Yue QY, Hasselstrom J, Svensson JO, et al. Pharmacokinetics of codeine and its metabolites in Caucasian healthy volunteers: comparisons between extensive and poor hydroxylators of debrisoquine. Br J Clin Pharmacol. 1991;31(6):635–642.
- Oyler JM, Cone EJ, Joseph RE, Jr, et al. Identification of hydrocodone in human urine following controlled codeine administration. J Anal Toxicol. 2000;24(7):530–535.
- Gasche Y, Daali Y, Fathi M, et al. Codeine intoxication associated with ultrarapid CYP2D6 metabolism. N Engl J Med. 2004;351(27):2827–2831.
- Koren G, Cairns J, Chitayat D, et al. Pharmacogenetics of morphine poisoning in a breastfed neonate of a codeine-prescribed mother. Lancet. 2006;368(9536):704.
- DePriest AZ, Puet BL, Holt AC, et al. Metabolism and disposition of prescription opioids: a review. Forensic Sci Rev. 2015;27(2):115–145.
- Valtier S, Bebarta VS. Excretion profile of hydrocodone, hydromorphone and norhydrocodone in urine following single dose administration of hydrocodone to healthy volunteers. J Anal Toxicol. 2012;36(7):507–514.
- Cone EJ, Caplan YH, Moser F, et al. Evidence that morphine is metabolized to hydromorphone but not to oxymorphone. J Anal Toxicol. 2008;32(4):319–323.
- Mandatory Guidelines for Federal Workplace Drug Testing Programs. Department of Health and Human Services. 2010. Available from: https://www.gpo.gov/fdsys/pkg/FR-2010-04-30/pdf/2010-10118.pdf
- Smith ML, Nichols DC, Underwood P, et al. Morphine and codeine concentrations in human urine following controlled poppy seeds administration of known opiate content. Forensic Sci Int. 2014;241:87–90.
- ElSohly HN, Stanford DF, Jones AB, et al. Gas chromatographic/mass spectrometric analysis of morphine and codeine in human urine of poppy seed eaters. J Forensic Sci. 1988;33(2):347–356.
- Hayes LW, Krasselt WG, Mueggler PA. Concentrations of morphine and codeine in serum and urine after ingestion of poppy seeds. Clin Chem. 1987;33(6):806–808.
- Samano KL, Clouette RE, Rowland BJ, et al. Concentrations of morphine and codeine in Paired oral fluid and urine specimens following ingestion of a poppy seed roll and raw poppy seeds. J Anal Toxicol. 2015;39(8):655–661.
- Latta KS, Ginsberg B, Barkin RL. Meperidine: a critical review. Am J Ther. 2002;9(1):53–68.
- Kranke P, Weibel S. Pain relief during labour: challenging the use of intramuscular pethidine. Lancet. 2018;392(10148):617–619.
- Zhang J, Burnell JC, Dumaual N, et al. Binding and hydrolysis of meperidine by human liver carboxylesterase hCE-1. J Pharmacol Exp Ther. 1999;290(1):314–318.
- Verbeeck RK, Branch RA, Wilkinson GR. Meperidine disposition in man: influence of urinary pH and route of administration. Clin Pharmacol Ther. 1981;30(5):619–628.
- Lehotay DC, George S, Etter ML, et al. Free and bound enantiomers of methadone and its metabolite, EDDP in methadone maintenance treatment: relationship to dosage. ? Clin Biochem. 2005;38(12):1088–1094.
- Fainsinger R, Schoeller T, Bruera E. Methadone in the management of cancer pain: a review. Pain. 1993;52(2):137–147.
- Ripamonti C, Zecca E, Bruera E. An update on the clinical use of methadone for cancer pain. Pain. 1997;70(2-3):109–115.
- Garrido MJ, Aguirre C, Niz IF, et al. Alpha1-acid glycoprotein (AAG) and serum protein binding of methadone in heroin addicts with abstinence syndrome. CP. 2000;38(01):35–40.
- Pond SM, Kreek MJ, Tong TG, et al. Altered methadone pharmacokinetics in methadone-maintained pregnant women. J Pharmacol Exp Ther. 1985;233(1):1–6.
- Sullivan HR, Smits SE, Due SL, et al. Metabolism of d-methadone: Isolation and identification of analgesically active metabolites. Life Sci. 1972;11:1093–1104.
- Nilsson MI, Meresaar U, Anggard E. Clinical pharmacokinetics of methadone. Acta Anaesthesiol Scand. 1982; 26Supplementum.(74):66–69.
- Wolff K, Strang J. Therapeutic drug monitoring for methadone: scanning the horizon. Eur Addict Res. 1999;5(1):36–42.
- Eap CB. On the usefulness of therapeutic drug monitoring of methadone. Eur Addict Res. 2000;6(1):31–33.
- Bell J, Seres V, Bowron P, et al. The use of serum methadone levels in patients receiving methadone maintenance. Clin Pharmacol Ther. 1988;43(6):623–629.
- de Vos JW, Geerlings PJ, van den BW, et al. Pharmacokinetics of methadone and its primary metabolite in 20 opiate addicts. Eur J Clin Pharmacol. 1995;48(5):361–366.
- Kapur BM, Hutson JR, Chibber T, et al. Methadone: a review of drug-drug and pathophysiological interactions. Crit Rev Clin Lab Sci. 2011;48(4):171–195.
- Li Y, Kantelip JP, Gerritsen-van SP, et al. Interindividual variability of methadone response: impact of genetic polymorphism. Mol Diagn Ther. 2008;12(2):109–124.
- Wolff K, Rostami-Hodjegan A, Shires S, et al. The pharmacokinetics of methadone in healthy subjects and opiate users. Br J Clin Pharmacol. 2003;44(4):325–334.
- Eap CB, Buclin T, Baumann P. Interindividual variability of the. Clin Pharmacokinet. 2002;41(14):1153–1193.
- Cornell University JaSIWMC. Calculate the half-life of a drug from two plasma levels separated by a time interval. 2000. [cited 2019 Mar 28]. Available from: http://www-users.med.cornell.edu/∼spon/picu/calc/halfcalc.htm
- Medellin-Garibay SE, Correa-Lopez T, Romero-Mendez C, et al. Limited sampling strategies to predict the area under the concentration-time curve for rifampicin. Ther Drug Monit. 2014;36(6):746–751.
- Cone EJ, Gorodetzky CW, Yousefnejad D, et al. The metabolism and excretion of buprenorphine in humans. Drug Metab Dispos. 1984;12(5):577–581.
- Chang Y, Moody DE. Glucuronidation of buprenorphine and norbuprenorphine by human liver microsomes and UDP-glucuronosyltransferases. Drug Metab Lett. 2009;3(2):101–107.
- Brown SM, Campbell SD, Crafford A, et al. Glycoprotein is a major determinant of norbuprenorphine brain exposure and antinociception. J Pharmacol Exp Ther. 2012;343(1):53–61. P
- Kronstrand R, Nystrom I, Andersson M, et al. Urinary detection times and metabolite/parent compound ratios after a single dose of buprenorphine. J Anal Toxicol. 2008;32(8):586–593.
- Donroe JH, Holt SR, O’Connor PG, et al. Interpreting quantitative urine buprenorphine and norbuprenorphine levels in office-based clinical practice. Drug Alcohol Depend. 2017;180:46–51.
- Melanson SE, Snyder ML, Jarolim P, et al. A new highly specific buprenorphine immunoassay for monitoring buprenorphine compliance and abuse. J Anal Toxicol. 2012;36(3):201–206.
- Birch MA, Couchman L, Pietromartire S, et al. False-positive buprenorphine by CEDIA in patients prescribed amisulpride or sulpiride. J Anal Toxicol. 2013;37(4):233–236.
- Sorensen LK, Hasselstrom JB. Ascorbic acid improves the stability of buprenorphine in frozen whole blood samples. J Anal Toxicol. 2019;43(6):482–488.
- Vallejo R, Barkin RL, Wang VC. Pharmacology of opioids in the treatment of chronic pain syndromes. Pain Physician. 2011;14(4):E343–E360.
- Wang BT, Colby JM, Wu AH, et al. Cross-reactivity of acetylfentanyl and risperidone with a fentanyl immunoassay. J Anal Toxicol. 2014;38(9):672–675.
- Hendrickson RG, Akpunonu P, Hughes AR, et al. Highly potent fentanyl analogs: apnea from exposure to small quantities of s-hydroxyfentanyl and furanylfentanyl. Clin Toxicol (Phila)). 2019;57(9):813–815.
- Lozier MJ, Boyd M, Stanley C, et al. Acetyl fentanyl, a novel fentanyl analog, causes 14 overdose deaths in rhode island, march-may 2013. J Med Toxicol. 2015;11(2):208–217.
- Finkelstein MJ, Chronister CW, Stanley C, et al. Analysis of acetyl fentanyl in postmortem specimens by gas chromatography-mass spectrometry (GC-MS): method validation and case report. J Anal Toxicol. 2019;43(5):392–398.
- Lalovic B, Phillips B, Risler LL, et al. Quantitative contribution of CYP2D6 and CYP3A to oxycodone metabolism in human liver and intestinal microsomes. Drug Metab Dispos. 2004;32(4):447–454.
- Samer CF, Daali Y, Wagner M, et al. Genetic polymorphisms and drug interactions modulating CYP2D6 and CYP3A activities have a major effect on oxycodone analgesic efficacy and safety. Br J Pharmacol. 2010;160(4):919–930.
- Liukas A, Kuusniemi K, Aantaa R, et al. Plasma concentrations of oral oxycodone are greatly increased in the elderly. Clin Pharmacol Ther. 2008;84(4):462–467.
- Poyhia R, Seppala T, Olkkola KT, et al. The pharmacokinetics and metabolism of oxycodone after intramuscular and oral administration to healthy subjects. Br J Clin Pharmacol. 1992;33(6):617–621.
- Sloan P. Review of oral oxymorphone in the management of pain. Ther Clin Risk Manag. 2008;4(4):777–787.
- Adams MP, Ahdieh H. Pharmacokinetics and dose-proportionality of oxymorphone extended release and its metabolites: results of a randomized crossover study. Pharmacotherapy: J Hum Pharmacol Drug Ther. 2004;24(4):468–476.
- Vandenbossche J, Van PA, Richards H. Single-dose pharmacokinetic study of tramadol extended-release tablets in children and adolescents. Clini Pharmacol Drug Develop. 2016;5(5):343–353.
- Grond S, Sablotzki A. Clinical pharmacology of tramadol. Clin Pharmacokinet. 2004;43(13):879–923.
- Khosrojerdi H, Alipour TG, Danaei GH, et al. Tramadol half life is dose dependent in overdose. Daru. 2015;23:22.
- Danso D, Langman LJ, Jannetto PJ. Targeted Opioid Screening Assay for Pain Management Using High-Resolution Mass Spectrometry. Methods Mol Biol. 2019;1872:41–50.
- Sansone RA, Sansone LA. Tramadol: seizures, serotonin syndrome, and coadministered antidepressants. Psychiatry (Edgmont)). 2009;6(4):17–21.
- Verbeurgt P, Mamiya T, Oesterheld J. How common are drug and gene interactions? Prevalence in a sample of 1143 patients with CYP2C9, CYP2C19 and CYP2D6 genotyping. Pharmacogenomics. 2014;15(5):655–665.
- Perez de los CJ, Sinol N, Trujols J, et al. Association of CYP2D6 ultrarapid metabolizer genotype with deficient patient satisfaction regarding methadone maintenance treatment. Drug Alcohol Depend. 2007;89(2-3):190–194.
- Fonseca F, de la TR, Diaz L, et al. Contribution of cytochrome P450 and ABCB1 genetic variability on methadone pharmacokinetics, dose requirements, and response. PLoS One. 2011;6(5):e19527.
- Bell GC, Crews KR, Wilkinson MR, et al. Development and use of active clinical decision support for preemptive pharmacogenomics. J Am Med Inform Assoc. 2014;21(e1):e93–e99.
- Agarwal D, Udoji MA, Trescot A, et al. Genetic testing for opioid pain management: a primer. Pain Ther. 2017;6(1):93–105.
- Sallee FR, DeVane CL, Ferrell RE. Fluoxetine-related death in a child with cytochrome P-450 2D6 genetic deficiency. J Child Adolesc Psychopharmacol. 2000;10(1):27–34.
- Flockhart DA. Drug Interactions. Cytochrome P450 Drug Interaction Table. Indiana University School of Medicine 2007. [cited 2020 Apr 06]. Available from: https://drug-interactions.medicine.iu.edu/MainTable.aspx
- Shiran MR, Chowdry J, Rostami-Hodjegan A, et al. A discordance between cytochrome P450 2D6 genotype and phenotype in patients undergoing methadone maintenance treatment. Br J Clin Pharmacol. 2003;56(2):220–224.