
Abstract
Circulating cell-free microRNAs (miRNAs) represent a major reservoir for biomarker discovery. Unfortunately, their implementation in clinical practice is limited due to a profound lack of reproducibility. The great technical variability linked to major pre-analytical and analytical caveats makes the interpretation of circulating cell-free miRNA data challenging and leads to inconsistent findings. Additional efforts directed to standardization are fundamental. Several well-established protocols are currently used by independent groups worldwide. Nonetheless, there are some specific aspects in specimen collection and processing, sample handling, miRNA quantification, and data analysis that should be considered to ensure reproducibility of results. Here, we have addressed this challenge using an alternative approach. We have highlighted and discussed common pitfalls that negatively impact the robustness of circulating miRNA quantification and their application for clinical decision-making. Furthermore, we provide a checklist usable by investigators to facilitate and ensure the control of the whole miRNA quantification and analytical process. We expect that these recommendations improve the reproducibility of findings, and ultimately, facilitate the incorporation of circulating miRNA profiles into clinical practice as the next generation of disease biomarkers.
Introduction
In the last decade, circulating cell-free microRNAs (miRNAs) have emerged as a novel tool with potential translation to the clinic [Citation1–6]. The availability of samples, the accessibility to the technology and the relative conceptual simplicity of miRNA quantification have allowed the publication of thousands of studies that propose these small non-coding transcripts as useful tools for medical decision-making. Strikingly, despite the significant efforts invested in the development of innovative circulating miRNA-based biomarkers, their translation to routine clinical practice in the short- or medium-term is far from being a reality [Citation7].
The incorporation of any biomarker to the clinical laboratory requires the standardization and reproducibility of its laboratory measurements. Currently, this is not the case for circulating miRNAs. The low concentration of RNA in plasma/serum, the presence of inhibitors in clinical samples, and factors such as sample quality and storage, among others, have a strong influence on miRNA profiling. Furthermore, the clinical setting constitutes an additional source of variability, since methodological differences in sample processing and miRNA quantification among different centers or departments are expected.
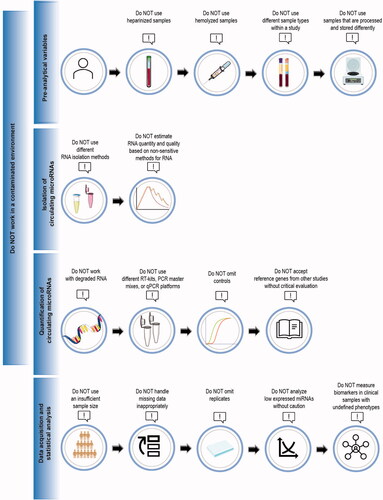
The clinical application of miRNAs requires additional efforts to reduce the technical variability. Improved standardization of quantification is imperative. Unfortunately, we believe that it is not possible to provide a widely accepted standard protocol. Different laboratories use divergent protocols for all the steps of miRNA quantification, from blood collection to data analysis. Nevertheless, there are some crucial and common pitfalls, which unfortunately add variability to assays and overall results, that should be avoided. Here, we have addressed what NOT to do in quantification of circulating miRNAs () and highlighted all aspects that directly impact the reproducibility of miRNA analysis. In particular, we have focused on the gold standard and most widely used technique in the field: RT-qPCR.
Figure 1. What should NOT be done in the development of circulating microRNA-based biomarkers.
Pre-analytical variables
Pre-analytical variables are known to comprise the majority (∼60–70%) of laboratory errors in routine diagnostic testing [Citation8]. Accordingly, this phase has a major influence on miRNA quantification.
What NOT to do
Use heparinized samples
Use hemolyzed samples
Use different sample types within a study
Use samples that are processed and stored differently.
Do NOT use heparinized samples
Additives present in serum and plasma can interfere with circulating miRNA quantification. Samples should be collected using an anticoagulant that is compatible with RT-qPCR. Heparin is known to inhibit the reverse transcriptase and polymerase enzymes used in RT-qPCR [Citation9]. As a general recommendation, heparin tubes should not be used for sample collection. If heparin is required for other biomarker measurements or samples have already been collected in heparin tubes, heparinase treatment should be included in the quantification protocol. Several protocols using different heparinases at different concentrations have been reported [Citation10–13]. It is recommended to test the optimal performance of the chosen heparinase treatment before analyzing study samples.
It is noteworthy that heparin is commonly administered in clinical settings, for example, during myocardial infarction or cardiovascular procedures and surgeries to prevent blood clotting, and may thus be present in the circulation [Citation10,Citation14]. Consequently, confounding by heparin may affect miRNA quantification in some patient cohorts even though samples are appropriately collected in serum or EDTA plasma tubes. Heparinase treatment should also be included in the RT-qPCR protocol in these patient cohorts.
Do NOT use hemolyzed samples
The levels of numerous miRNAs, proposed as potential biomarkers, are altered in hemolyzed samples due to their release from erythrocytes. For example, the levels of miRNAs, such as miR-15b-5p, miR-16-5p, miR-92a-3p, and miR-451a are elevated in hemolyzed plasma samples when compared to non-hemolyzed specimens [Citation15]. Furthermore, hemolysis is frequently reported as the most prevalent pre-analytical error in clinical laboratories (up to 70%) [Citation16]. Therefore, quantification of hemolysis and exclusion of hemolyzed samples is fundamental as part of the quality control protocol in miRNA biomarker studies.
Mere visual detection of samples (pink or red coloration) is not sufficiently sensitive [Citation17]. Hemolysis can be estimated by measuring the absorbance of plasma or serum samples at 414 nm, which is the absorbance peak of free hemoglobin [Citation18]. Alternatively, the extent of hemolysis can be determined measuring specific erythrocyte enriched miRNAs, such as miR-16-5p and miR-451a [Citation18]. The relative expression of miR-451a and the stable miR-23a-3p have also been proposed as indicators of hemolysis in RNA samples or miRNA profiling data [Citation19]. However, both miRNAs can be dysregulated in some pathological conditions, such as myocardial infarction and acute kidney injury, and may thus be unsuitable as universal hemolysis indicators [Citation20]. It has also been proposed to include all samples in miRNA detection after evaluation of hemolysis, independently of the approach used, but use only non-hemolyzed samples in initial biomarker screening. After this initial screening, miRNAs of interest could be measured in the previously identified hemolyzed samples, in order to check whether their expression is affected by hemolysis [Citation21].
Some strategies could be implemented to reduced hemolysis. For example, the use of small diameter needles (23 gauge or above) [Citation22]. Prolonged centrifugation at high speed should be avoided. The use of standard operating procedures for the collection and preparation of plasma and serum is recommended [Citation23].
Do NOT use different sample types within a study
Sample matrix can significantly affect miRNA levels even in the same individuals due to different anticoagulants and blood stabilizers as well as the differential release of miRNAs during the coagulation of serum samples or from residual cellular components during processing [Citation24–27]. Serum is obtained from blood after coagulation whereas plasma is obtained when clotting is prevented with the addition of an anticoagulant. These different sample processing procedures significantly affect miRNA levels. Mompeón et al. [Citation28] have recently illustrated the differences between plasma and serum miRNA expression. The authors reported that plasma and serum exhibit different profiles of circulating miRNAs, with some transcripts specifically associated with the outcome when analyzed in plasma or serum and even opposite associations in both matrixes. Thus, it is essential to use the same sample type consistently within a study.
Do NOT use samples that are processed and stored differently
Multiple steps in sample processing and storage conditions can influence miRNA levels. Centrifugation time, speed, and use of one-step or two-step centrifugation or filtration have a significant effect on the removal of cellular components, especially platelets, and thus miRNA levels [Citation24,Citation29–31]. Additional centrifugation has been suggested to remove platelet contamination from archived thawed samples [Citation30], but even a single freeze-thaw cycle was shown to significantly increase the number of platelet derived microparticles and affect miRNA levels. As such, it is strongly recommended to minimize freeze-thaw cycles [Citation32]. It should be noted that there is marked difference in expression levels of specific miRNAs enriched in thrombocytes, such as miR-27b and miR-425, depending on whether these are quantified in standard plasma or platelet poor plasma (PPP) [Citation32]. As there is a considerable heterogeneity regarding the preparation of PPP, it is important to standardize centrifugation speed and time, as increases in these will deplete the plasma of thrombocytes to a higher degree [Citation31]. Currently, there are no consensus guidelines for the preparation of PPP for miRNA quantification, with regard to centrifugation force, time, and temperature.
Different storage times and temperatures, both before sample processing and over the long-term, affect miRNA levels. It is recommended to process blood samples as quickly as possible or store samples at 4 °C when immediate sample preparation is not feasible [Citation27,Citation33,Citation34]. Clinical laboratory guidelines generally recommend processing of samples within 2 h of blood draw, which is feasible in a clinical routine [Citation35]. The same guideline could be applicable to miRNA analysis, as Page et al. [Citation33] have shown that a delay in sample processing for >2 h significantly affected miRNA profiles. Several studies have suggested that miRNAs remain stable in separated plasma or serum samples at least 24 h at room temperature or 4 °C [Citation29,Citation36,Citation37]. However, Faraldi et al. [Citation38] recently reported that storage at room temperature or 4 °C for 24 h altered miRNA profile depending on sample matrix, which supports rapid freezing of samples for long-term storage. For long-term storage, samples are recommended to be frozen at −20 °C or preferably at −80 °C [Citation33,Citation37,Citation39,Citation40]. Indeed, Grasedieck et al. [Citation39] have shown that miRNA expression remains stable after sample storage at −20 °C for 2–4 years but levels significantly decrease after 6 years at this temperature. Conversely, miRNA expression profiles remained stable in plasma samples stored at −80 °C for over 12 years [Citation33].
Glinge et al. [Citation40] have studied the effect of physical disturbance of blood samples on miRNA stability in different sample types mimicking transportation (1 and 8 h of shaking at 30 rpm) from one center to another. They found that 1 h of physical disturbance had no effect on miRNA levels, while 8 h of disturbance decreased miR-1-3p and miR-21-5p levels in separated plasma and miR-21-5p level in serum, suggesting that long-term physical disturbance of blood samples should be avoided.
Taken together, consistency in sample processing and storage is crucial for minimizing technical variation and obtaining unbiased results.
Circulating microRNA isolation
Reliable quantitative miRNA analysis requires high-quality RNA. Unfortunately, the isolation of small RNA from plasma or serum samples remains challenging, mainly due to the low concentrations reported in these types of matrixes, which requires special considerations.
What NOT to do
Use different RNA-isolation methods for samples meant to be compared with each other
Estimate the quantity and quality of RNAs from biofluids based on non-sensitive methods for RNA
Do NOT use different RNA-isolation methods for samples meant to be compared with each other
Conceptually, two different types of RNA isolation methods exist: Column-based [Citation41] and phenol-chloroform-guanidine thiocyanate [Citation42]. Column-based methods lyse cells or tissue using a guanidine thiocyanate buffer with mercaptoethanol, followed by washes on a silica membrane, which binds nucleic acids, and elution using water or a dilute tris-buffer. Phenol-chloroform-guanidine thiocyanate (the method of Chomczynski) [Citation42] lyse the cells and inactivate ribonucleases (RNases) immediately, using differential precipitation of RNA, DNA, and proteins. The two different methodologies have their advantages and drawbacks. RNA from silica-gel based column methods may be pure and free from most contaminants. Other benefits of this method include the lack of a phase-separation step, allowing simplification of the isolation process. However, column formulation and wash buffers impact short RNA binding. Phenol-chloroform-guanidine thiocyanate RNA isolation gives high yields but isolates less pure RNA with some contaminants often remaining. Purity of RNA isolated using phenol-chloroform-guanidine thiocyanate is very dependent on efficient phase-separation and manual aspiration of the RNA phase following centrifugation: avoid mix phases after the centrifugation step as this will result in an impure RNA preparation. The purity of RNA may be improved by increasing the number of ethanol washes following the precipitation step; however, this can also decrease yields. Concerns related to inefficient recovery of specific small RNA species have also been raised [Citation43]. Thus, within a study, sample comparison cannot be made if samples are extracted using different methods. Of note, it is recommended to use an RNA carrier, such as glycogen, yeast RNA, or bacteriophage RNA, to increase yields of small RNAs in the isolation process.
Do NOT estimate quantity and quality of RNAs from biofluids based on non-sensitive methods for RNA
The absolute amount of RNA isolated from serum or plasma is quite low (nanogram scale per milliliter) [Citation44] and to spectrophotometrically detect the RNA, for example, using NanoDrop™ (Thermo Fisher Scientific, Waltham, MA, USA) or other spectrophotometers, is inappropriate. The presence of contaminants, such as phenol, from RNA isolation and the presence of an RNA carrier, if added, can also confound the readings when measuring samples with low levels of RNA.
Fragment analyzers, such as Experion (Bio-Rad Laboratories, Hercules, CA, USA) or Bioanalyzer (Agilent Technologies, Santa Clara, CA, USA), constitute a useful tool to estimate size distribution of nucleic acid preparations using only minute amounts of sample in a controlled electrophoresis environment. The RNA integrity number (RIN) value developed by Agilent Technologies (Bioanalyzer) is based on the electrophoretic profile of RNA isolated from cells or tissue, which contain specific classes of RNA species of different lengths, such as 18 s and 28 s rRNA peaks, whose areas are used for the RIN algorithm [Citation45]. Biofluids from plasma, serum, urine, or cerebrospinal fluid contain mostly small RNA species [Citation46,Citation47], such as miRNA, and only low amounts of 18 s rRNA and 28 s rRNA. Therefore, RNA samples from biofluids will have inherently low RIN values, and manual inspection of electropherograms is necessary.
Wright et al. [Citation48] compared Bioanalyzer, Qubit™ (Thermo Fisher Scientific, Waltham, MA, USA), and NanoDrop measurements of RNA isolated from plasma. While small RNA fluorometric measurement using an RNA binding dye with preferential binding to smaller RNA species (<1000), as in Qubit small RNA kit, provided much lower yields of RNA than NanoDrop, the variability of measurement was very low, indicating that this method is indeed more specific for small RNAs [Citation48].
An alternative quality control relies on the use of spike-in synthetic standards, mainly derived from Caenorhabditis elegans. The spike-ins go through the entire RNA isolation process and constitute a reliable method to monitor quantification. Therefore, most commonly, the quality and quantity of isolated RNA is established based on RT-qPCR of selected positive controls and spike-ins [Citation49,Citation50].
Circulating microRNA quantification
The short length, small differences in nucleotide sequences, and unequal melting temperatures [Citation51], in addition to the data normalization method, constitute the main barriers in quantification of miRNAs. Although some minimal considerations should be taken into account in order to perform a robust quantification, RT-qPCR constitutes a useful tool to reliably assess miRNA levels.
What NOT to do
Work with degraded RNA.
Use different RT kits, PCR master mixes, or qPCR platforms for samples meant to be compared with each other.
Omit controls to save space and reagents.
Use reference genes from other studies without critical evaluation.
Do NOT work with degraded RNA
Measuring gene expression in partially degraded RNA samples will introduce another source of variability to the clinical or experimental data, which can bias results and lead to faulty conclusions. Decreased RNA integrity reduces the performance of RT-qPCR in miRNA quantification [Citation52]. Thus, a high-quality RNA is considered a pre-requisite for high-throughput analysis.
Correct storage of RNA is crucial to avoid RNA degradation, for example, keeping the RNA aliquot on ice and the lid closed when working on the bench. Avoidance of unnecessary freeze-thaw cycles may also result in reduced degradation.
Do NOT use different RT kits, qPCR master mixes, or qPCR platforms for samples meant to be compared with each other
There are numerous RT kits and qPCR master mixes from different manufacturers on the market, as well as different qPCR platforms. The performance of different RT kits, PCR master mixes, and qPCR instruments can vary significantly in terms of reproducibility and sensitivity [Citation53–56]. Thus, it is important to use the same reagents and qPCR platform for all samples that will be directly compared with each other. It may also be beneficial to test different kits to identify the best performing procedure for the specific miRNA assays to be used.
Do NOT omit controls to save space and reagents
It is indispensable to include appropriate controls on each PCR plate or batch of samples to evaluate the quality and reliability of data [Citation57]. No template control (NTC) is a negative control including all PCR reagents except the template. The NTC control is essential for detecting set-up contamination of the PCR assays and primer-dimer product amplification in SYBR Green assays. Another negative control required for miRNA quantification is the no-reverse transcription RT(–) control obtained by omitting RT enzyme in cDNA synthesis-reaction. RT(–) control is used to identify DNA contamination present in RNA samples. If a carrier is added during the RNA isolation, an RT reaction with carrier RNA only is important to discard the possibility of the presence of contaminants. When comparing data from multiple plates, an inter-plate calibrator or reference sample should be included in each plate to normalize differences in baseline and threshold settings.
Do NOT use reference genes from other studies without critical evaluation
Normalization of RT-qPCR data is one of the most paramount steps in miRNA quantification to obtain reliable and reproducible results. Different normalization strategies can give very different results on miRNA expression [Citation31,Citation58,Citation59]. However, there is no consensus on an optimal normalization strategy [Citation60]. Small nucleolar RNAs, such as U6 and SNORD48, or ribosomal RNAs are commonly used for the normalization of miRNA expression in cell and tissue samples. Growing evidence shows that these genes should not be used for normalization of circulating miRNAs, compared to miRNAs, due to different biochemical characteristics and their significant variability in expression within individual blood samples [Citation61].
A widely used normalization strategy is synthetic non-human spike-in miRNAs, most commonly cel-miR-39, which are added in samples during RNA extraction and used as exogenous reference genes. It is critical to add the spike-in control only after the samples have been carefully mixed with lysis buffer to prevent degradation of the spike-in control. Spike-in oligonucleotides are a requisite for monitoring technical variation during RNA extraction and reverse transcription, but they do not correct for the variability in sampling and quality of samples [Citation61]. In addition, manual pipetting of spike-in can increase technical variation in results. Thus, various endogenous miRNAs have been proposed as optimal reference genes [Citation58,Citation60,Citation61]. However, the endogenous reference genes should not be selected based on other studies without critical evaluation. For example, miRNAs that are stable in some studies may change in other pathological conditions and are therefore unsuitable as reference genes [Citation60]. Systematic screening of a large set of potential endogenous reference genes may be required to find stably expressed reference genes in given pathological condition. Thus, finding suitable endogenous reference genes is more laborious compared to using exogenous reference genes. It has also been proposed that use of multiple reference genes increases the efficiency of normalization instead of using a single reference gene. Algorithms, such as Normfinder, geNorm, and BestKeeper can be applied to identify the most stable reference genes [Citation58–60,Citation62].
Data acquisition and statistical analysis
The analysis of raw data generated in qPCR requires careful considerations, mainly due to the intended use of miRNAs as biomarkers with clinical application.
What NOT to do
Use an insufficient sample size.
Inappropriately handle missing data.
Omit replicates.
Analyze low expressed miRNAs without caution.
Measure RNA biomarkers in clinical samples with undefined phenotypes.
Do NOT use an insufficient sample size
It is necessary to perform a power analysis to estimate the group size to be able to make a firm conclusion on the phenotype of interest [Citation63]. If the miRNA biomarker has large natural variation in levels between subjects, then a larger number of subjects must be analyzed in order to show a significant difference. Hence, prior to study initiation, reasonable estimates must be made to address population variability in order to calculate the minimum group size to obtain a power of at least 80% to detect a difference at the level of significance chosen (often α = 0.05). If multiple biomarkers are measured at the same time, then the level of significance should be decreased as multiple statistical tests will be performed.
Avoid inappropriate handling of missing data
Studies on circulating miRNAs show very low reproducibility, due to the fact that missing data occurs as an effect of the low expression levels often observed for circulating miRNAs [Citation64]. When trying to validate promising candidate biomarkers, by qPCR, challenges arise when working with target quantities near the detection limit (e.g. quantification cycle (Cq) = 35). This leads to missing data, which is handled and interpreted differently between studies, leading to irreproducible results. Here, we would like to address what to avoid when handling missing data.
Simply excluding all missing data should be disregarded. This approach can lead to smaller differences between groups, loss of power, and incorrect conclusions. On the other hand, when it is acknowledged that missing data cannot simply be discarded, researchers often make another obvious mistake by simply imputing all missing data. Although there is no loss of power, this can also lead to smaller differences between groups and wrong conclusions. If in a given disease, the target miRNA is only expressed in the disease state and not in controls, disregarding or imputing this missing data will render a false outcome.
One of the most common mistakes in data handling is that researchers do not acknowledge that missing data is due to diverse reasons and therefore should be handled accordingly. Missing data can be missing at random, due to a technical or random error, or due to the fact that your target miRNA is simply too low to be detected properly or is even not expressed at all. Recognizing that there are different types of missing data is crucial in conducting robust research [Citation65]. Therefore, missing data should be divided into two categories: “undetectable” values due to the fact that miRNA is non-expressed or expressed in low levels in the sample, and “invalid” values due to technical failure. The latter represents true missing values, termed “missing at random.”
After having distinguished true missing data from low or non-expressed data, common mistakes can be made due to the fact the researchers do not know how to handle these differences. Often researchers make the mistake of simply disregarding true missing data, which can lead to loss of power and negatively influence the outcome. Another common mistake is to impute missing data with an overall average expression of the target miRNA (i.e. the mean), without contemplating whether the target miRNA has a normal distribution, which is never the case. Alongside this, mistakes are typically made when imputing without taking other aspects of the sample population into account, thereby using single instead of multiple imputation [Citation66]. With multiple imputation, it has been shown that up to 80% of missing data can be imputed without influencing the results, as long as the missing data is missing at random [Citation67].
Do NOT omit replicates
Another important mistake to avoid when designing an experiment is economizing the amount of replication samples. One should always have a minimum of two replicate samples, and preferably three, for an optimal qPCR experiment. If a study only contains one sample, it is very difficult to tell the difference between a missing value due to a technical error (i.e. true missing) and a missing value due to low or non-expressed miRNA. By comparing the expression levels of replicate samples, one will be able to decide whether a true missing value or a low or non-expressed sample is present. Common mistakes to be aware of are simply disregarding replicates that have a different expression or assuming they are missing at random. Unfortunately, differences in Cq values will differ more between replicates of target miRNAs that have low expression levels [Citation65]. Therefore, if one simply disregards all replicates that have different outcomes, a differential error is introduced, by which only the low expressed miRNAs are disregarded. A rule of thumb on how to decide whether samples are truly discordant is needed, which has been described by de Ronde et al. [Citation65]. The same holds true for qPCR assays in which bad melting curves are produced. This indicates that a different product is amplified, and one should avoid using the obtained qPCR cycle number (i.e. outcome value) but instead handle the outcome as a technical error and therefore as true missing data.
Do NOT analyze low expressed microRNAs without caution
Another common mistake to avoid is simply not recognizing that a miRNA is low or non-expressed. Researchers often simply use the obtained qPCR outcome value, without realizing that a high Cq value suggests that the target miRNA measurement is close to the detection limit and are therefore not accurately measured. For all miRNAs with values close to the detection border, the same substitution method for all low expressed miRNAs should be applied, as explained by de Ronde et al. [Citation65,Citation68].
Do NOT measure RNA biomarkers in clinical samples with poorly defined phenotypes
If the phenotype of interest is poorly or only broadly defined, the probability of finding a true association or predictive value associated with the RNA biomarker decreases. The clinical value of markers associating with unspecific phenotypes is likely to be low.
Patient related factors such as age, sex, diet, physical activity, circadian rhythm, medication, smoking, alcohol, or comorbidities can cause significant variability in miRNA levels [Citation69–81]. Hence, a standardized study protocol is required to reduce inter-individual variability. The study protocol should specify the patient inclusion and exclusion criteria based on the aforementioned factors and outline pre-analytical requirements, for example, preparation for sample collection (fasting, avoiding intense physical activity) and sample collection time. For instance, fasting affects circulating miRNA profiles. The level of high-density lipoprotein particles, which bind miRNAs such as miR-223-3p [Citation82], varies after food intake. Another factor that is not routinely considered is the diurnal variation of circulating miRNA levels. Heegaard et al. [Citation83] identified 26 miRNAs that showed alterations in their plasma concentrations during a 24-h period. As such, consistency in the time of blood collection is fundamental. This information should also be provided in the publications.
Handling of RNA samples
Inappropriate handling of RNA samples could have a huge impact on circulating miRNA quantification, and therefore, it is mandatory to discuss this point.
What NOT to do
Work in a contaminated environment.
Do NOT work in contaminated environment
There are a few simple procedures that illustrate quite clearly what not to do when isolating and handling RNAs, regardless of their size. It is important to maintain a physical distance between the laboratory spaces for sample isolation and cDNA synthesis. The same is true for sample PCR setup and PCR thermocycling.
Adequate conditions must be used when working with RNA. The skin and residue therefrom contain RNAses and in order to maintain RNA integrity, it is necessary to create a workflow in which samples, before, during, and after RNA isolation, are always handled using gloves and never with ungloved fingers/hands [Citation84,Citation85]. Handling samples with gloves at all times will also minimize the risk of contamination of RNA-species from the skin. However, one must remember that gloves are only as clean as the surfaces they touch (e.g. telephone, the nose, instruments, door handles). As such, gloves should be changed regularly.
Besides skin RNase contamination, other procedures also increase the risk of contamination and/or degradation of samples with subsequent poor performance of later assays and should therefore be avoided: RNases from bacterial contaminants can be present in the water and buffers if made from the tap or demineralized water [Citation86]. Hence, use only RNase free water, derived from double-distilled water or made from reverse-osmosis followed by ultraviolet light exposure, with or without diethylpyrocarbonate (DEPC) treatment for inactivation of RNases [Citation87].
General good laboratory practice is also beneficial for RNA work: do not open a large bottle of double-distilled RNase-free water and let it stand for months. This will significantly increase the likelihood of contamination with RNases, and aliquoting RNase-free water into sterile one-time use polypropylene plastic ware is therefore a very good idea. Pipettes and bench surfaces are exposed to dust, of which a large proportion is made up of shedded human keratinocytes, containing significant amounts of RNases. Thus, dust is an important source of RNase, which makes cleaning an important strategy to keep RNases away from precious RNA samples. Cleaning can be done by wiping with a moist cloth/“Kimwipe” followed by wiping with 70% ethanol, and for further RNA decontamination, specific “RNAse away” products should be used.
In addition to RNAses, other factors can also negatively influence RNA stability. As RNA is labile to both low and high pH, the pH of buffers used for RNA work should preferably be neutral (6 < pH < 8). The rate of alkaline degradation is increased in the presence of Mg2+ and K+ ions, as well as by increasing temperatures (>70 °C) [Citation88]. For optimal RNA stability, it is recommended to not heat RNA samples under alkaline conditions in the presence of Mg2+ and K+ ions.
All pipette tips and microcentrifuge tubes used for RNA work should be clean, single-use, and sterile. Contamination of autoclaves with RNases has been reported, which is likely more of a problem if the autoclave is used both for autoclaving waste as well as for autoclaving clean vessels and plastic ware [Citation89]. Furthermore, many RNases are not fully inactivated with autoclaving alone. Certified RNase-free barrier pipette tips should be used.
Concluding remarks
The lack of reproducibility between findings provided by different laboratories constitutes the main limitation in the translation of circulating miRNAs as biomarkers with clinical application. A number of challenges have been raised in different steps of the quantification process, from specimen processing to data analysis. Some of these aspects constitute common pitfalls in different studies. So far, a consensus recommendation for circulating miRNA isolation and quantification is lacking. Here, we chose to use an alternative and complementary approach versus usual guidelines by highlighting the procedures that should NOT be done or should be avoided when evaluating circulating miRNAs as potential biomarkers. Importantly, we provide an easy-to-use checklist for investigators to facilitate the control of the entire process, from study design to sample preparation, miRNA quantification, analysis, and reporting of results (). This checklist is applicable to different standardized protocols.
Table 1. Practices to avoid when evaluating circulating miRNAs as clinical biomarkers.
These recommendations are mainly focused on RT-qPCR, the gold-standard technology for circulating miRNA quantification. Nevertheless, some points present a high overlap with other technologies, such as digital PCR (ddPCR), microarrays, sequencing, or multiplex assays. ddPCR, which is currently competing against RT-qPCR, exhibits several drawbacks in primer optimization, precision, false positives, automation, and cost-effectiveness [Citation90–92]. Similar efforts should be taken to improve the reproducibility of these techniques.
The pitfalls to avoid and recommendations described herein are proposed to assist researchers, both beginners and non-beginners in the miRNA field, in circulating miRNA-based biomarker studies. These recommendations describe the consensus obtained within the European CardioRNA consortium (EU-CardioRNA COST Action CA17129). We envisage reviewing these recommendations in two years based on technological developments and advances in the miRNA research field.
| Abbreviations | ||
| Cq | = | quantification cycle |
| DEPC | = | diethylpyrocarbonate |
| ddPCR | = | digital PCR |
| miRNA | = | microRNAs |
| NTC | = | no template control |
| PPP | = | platelet poor plasma |
| RIN | = | RNA integrity number |
| RNAses | = | ribonucleases |
Acknowledgments
We would like to thank all EU-CardioRNA COST Action members for insightful discussions that contributed to drafting the current paper.
Disclosure statement
DdGC and YD holds patents related to diagnostic and therapeutic applications of RNAs.
Additional information
Funding
References
- Raut JR, Schöttker B, Holleczek B, et al. A microRNA panel compared to environmental and polygenic scores for colorectal cancer risk prediction. Nat Commun. 2021;12(1):4811.
- Salamon I, Biagini E, Kunderfranco P, et al. Circulating miR-184 is a potential predictive biomarker of cardiac damage in Anderson-Fabry disease. Cell Death Dis. 2021;12(12):1150.
- Navas-Carrillo D, Rivera-Caravaca JM, Sampedro-Andrada A, et al. Novel biomarkers in Alzheimer’s disease using high resolution proteomics and metabolomics: miRNAS, proteins and metabolites. Crit Rev Clin Lab Sci. 2021;58(3):167–179.
- Pinilla L, Barbé F, de Gonzalo-Calvo D. MicroRNAs to guide medical decision-making in obstructive sleep apnea: a review. Sleep Med Rev. 2021;59:101458.
- Romani C, Salviato E, Paderno A, et al. Genome-wide study of salivary miRNAs identifies miR-423-5p as promising diagnostic and prognostic biomarker in oral squamous cell carcinoma. Theranostics. 2021;11(6):2987–2999.
- Mens MMJ, Heshmatollah A, Fani L, et al. Circulatory MicroRNAs as potential biomarkers for stroke risk: the rotterdam study. Stroke. 2021;52(3):945–953.
- de Gonzalo‐Calvo D, Pérez‐Boza J, Curado J, et al. Challenges of microRNA-based biomarkers in clinical application for cardiovascular diseases. Clin Transl Med. 2022;12(2):e585.
- Lippi G, Von Meyer A, Cadamuro J, et al. PREDICT: a checklist for preventing preanalytical diagnostic errors in clinical trials. Clin Chem Lab Med. 2020;58(4):518–526.
- Izraeli S, Pfleiderer C, Lion T. Detection of gene expression by PCR amplification of RNA derived from frozen heparinized whole blood. Nucleic Acids Res. 1991;19(21):6051.
- Chen C-C, Peng C-C, Fan P-C, et al. Practical procedures for improving detection of circulating miRNAs in cardiovascular diseases. J Cardiovasc Transl Res. 2020;13(6):977–987.
- Coelho-Lima J, Mohammed A, Cormack S, et al. Overcoming heparin-associated RT-qPCR inhibition and normalization issues for microRNA quantification in patients with acute myocardial infarction. Thromb Haemost. 2018;118(7):1257–1269.
- Wu CS, Lin FC, Chen SJ, et al. Optimized collection protocol for plasma MicroRNA measurement in patients with cardiovascular disease. Biomed Res Int. 2016;2016:1–12.
- Plieskatt JL, Feng Y, Rinaldi G, et al. Circumventing qPCR inhibition to amplify miRNAs in plasma. Biomark Res. 2014;2:13.
- Schulte C, Barwari T, Joshi A, et al. Comparative analysis of circulating noncoding RNAs versus protein biomarkers in the detection of myocardial injury. Circ Res. 2019;125(3):328–340.
- Kirschner MB, Edelman JJB, Kao SCH, et al. The impact of hemolysis on cell-free microRNA biomarkers. Front Genet. 2013;4:94.
- Lippi G, Blanckaert N, Bonini P, et al. Haemolysis: an overview of the leading cause of unsuitable specimens in clinical laboratories. Clin Chem Lab Med. 2008;46(6):764–772.
- Sowemimo-Coker SO. Red blood cell hemolysis during processing. Transfus Med Rev. 2002;16(1):46–60.
- Kirschner MB, Kao SC, Edelman JJ, et al. Haemolysis during sample preparation alters microRNA content of plasma. PLoS One. 2011;6(9):e24145.
- Blondal T, Jensby Nielsen S, Baker A, et al. Assessing sample and miRNA profile quality in serum and plasma or other biofluids. Methods. 2013;59(1):S1–S6.
- Yang C, Fan PC, Chen CC, et al. A circulating miRNA signature for early diagnosis of acute kidney injury following acute myocardial infarction. J Transl Med. 2019;17(1):139.
- Tiberio P, Callari M, Angeloni V, et al. Challenges in using circulating miRNAs as cancer biomarkers. Biomed Res Int. 2015;2015:731479.
- Wollowitz A, Bijur PE, Esses D, et al. Use of butterfly needles to draw blood is independently associated with marked reduction in hemolysis compared to intravenous catheter. Acad Emerg Med. 2013;20(11):1151–1155.
- Tuck MK, Chan DW, Chia D, et al. Standard operating procedures for serum and plasma collection: early detection research network consensus statement standard operating procedure integration working group. J Proteome Res. 2009;8(1):113–117.
- Wang K, Yuan Y, Cho JH, et al. Comparing the MicroRNA spectrum between serum and plasma. PLoS One. 2012;7(7):e41561.
- Kim DJ, Linnstaedt S, Palma J, et al. Plasma components affect accuracy of circulating cancer-related microRNA quantitation. J Mol Diagn. 2012;14(1):71–80.
- Fauth M, Hegewald AB, Schmitz L, et al. Validation of extracellular miRNA quantification in blood samples using RT-qPCR. FASEB Bioadv. 2019;1(8):481–492.
- Mussbacher M, Krammer TL, Heber S, et al. Impact of anticoagulation and sample processing on the quantification of human Blood-Derived microRNA signatures. Cells. 2020;9(8):1915.
- Mompeón A, Ortega-Paz L, Vidal-Gómez X, et al. Disparate miRNA expression in serum and plasma of patients with acute myocardial infarction: a systematic and paired comparative analysis. Sci Rep. 2020;10(1):1–11.
- McDonald JS, Milosevic D, Reddi H V, et al. Analysis of circulating microRNA: preanalytical and analytical challenges. Clin Chem. 2011;57(6):833–840.
- Cheng HH, Yi HS, Kim Y, et al. Plasma processing conditions substantially influence circulating microRNA biomarker levels. PLoS One. 2013;8(6):e64795.
- Binderup HG, Madsen JS, Helweg Heegaard NH, et al. Quantification of microRNA levels in plasma – impact of preanalytical and analytical conditions. PLoS One. 2018;13(7):e0201069.
- Mitchell AJ, Gray WD, Hayek SS, et al. Platelets confound the measurement of extracellular miRNA in archived plasma. Sci Rep. 2016;6:32651.
- Page K, Guttery DS, Zahra N, et al. Influence of plasma processing on recovery and analysis of circulating nucleic acids. PLoS One. 2013;8(10):e77963.
- Khan J, Lieberman JA, Lockwood CM. Variability in, variability out: best practice recommendations to standardize pre-analytical variables in the detection of circulating and tissue microRNAs. Clin Chem Lab Med. 2017;55:608–621.
- Calam RR, Bessman JD, Ernst DJ, et al. Procedures for the handling and processing of blood specimens; approved guideline – third edition. CLSI Doc. 2004;2004:24.
- Mitchell PS, Parkin RK, Kroh EM, et al. Circulating microRNAs as stable blood-based markers for cancer detection. Proc Natl Acad Sci USA. 2008;105(30):10513–10518.
- Sourvinou IS, Markou A, Lianidou ES. Quantification of circulating miRNAs in plasma: effect of preanalytical and analytical parameters on their isolation and stability. J Mol Diagn. 2013;15(6):827–834.
- Faraldi M, Sansoni V, Perego S, et al. Study of the preanalytical variables affecting the measurement of clinically relevant free-circulating microRNAs: focus on sample matrix, platelet depletion, and storage conditions. Biochem Med. 2020;2020:30.
- Grasedieck S, Schöler N, Bommer M, et al. Impact of serum storage conditions on microRNA stability. Leukemia. 2012;26(11):2414–2416.
- Glinge C, Clauss S, Boddum K, et al. Stability of circulating blood-based microRNAs-Pre-Analytic methodological considerations. PLoS One. 2017;12(2):e0167969.
- Escobar MD, Hunt JL. A cost-effective RNA extraction technique from animal cells and tissue using silica columns. J Biol Methods. 2017;4(2):e72.
- Chomczynski P, Sacchi N. Single-step method of RNA isolation by acid guanidinium thiocyanate-phenol-chloroform extraction. Anal Biochem. 1987;162(1):156–159.
- Kim YK, Yeo J, Kim B, et al. Short structured RNAs with low GC content are selectively lost during extraction from a small number of cells. Mol Cell. 2012;46(6):893–895.
- Chu CP, Nabity MB. Comparison of RNA isolation and library preparation methods for small RNA sequencing of canine biofluids. Vet Clin Pathol. 2019;48(2):310–319.
- Schroeder A, Mueller O, Stocker S, Salowsky R, Leiber M, Gassmann M, Lightfoot S, Menzel W, Granzow M, Ragg T. The RIN: an RNA integrity number for assigning integrity values to RNA measurements. BMC Mol Biol. 2006;7:3. DOI: 10.1186/1471-2199-7-3.
- Murillo OD, Thistlethwaite W, Rozowsky J, et al. exRNA atlas analysis reveals distinct extracellular RNA cargo types and their carriers present across human biofluids. Cell. 2019;177(2):463–477.e15.
- Keerthikumar S, Chisanga D, Ariyaratne D, et al. ExoCarta: a web-based compendium of exosomal cargo. J Mol Biol. 2016;428(4):688–692.
- Wright K, de Silva K, Purdie AC, et al. Comparison of methods for miRNA isolation and quantification from ovine plasma. Sci Rep. 2020;10(1):825.
- McAlexander MA, Phillips MJ, Witwer KW. Comparison of methods for miRNA extraction from plasma and quantitative recovery of RNA from cerebrospinal fluid. Front Genet. 2013;4:83.
- de Gonzalo-Calvo D, Marchese M, Hellemans J, et al. Consensus guidelines for the validation of qRT-PCR assays in clinical research by the CardioRNA consortium. Mol Ther Methods Clin Dev. 2022;24:171–180.
- Zampetaki A, Mayr M. Analytical challenges and technical limitations in assessing circulating miRNAs. Thromb Haemost. 2012;108(4):592–598.
- Becker C, Hammerle-Fickinger A, Riedmaier I, et al. mRNA and microRNA quality control for RT-qPCR analysis. Methods. 2010;50(4):237–243.
- Buzard GS, Baker D, Wolcott MJ, et al. Multi-platform comparison of ten commercial master mixes for probe-based real-time polymerase chain reaction detection of bioterrorism threat agents for surge preparedness. Forensic Sci Int. 2012;223(1–3):292–297.
- Svec D, Tichopad A, Novosadova V, et al. How good is a PCR efficiency estimate: recommendations for precise and robust qPCR efficiency assessments. Biomol Detect Quantif. 2015;3:9–16.
- Tan GW, Khoo ASB, Tan LP. Evaluation of extraction kits and RT-qPCR systems adapted to high-throughput platform for circulating miRNAs. Sci Rep. 2015;5:9430.
- Yang J, Kemps-Mols B, Spruyt-Gerritse M, et al. The source of SYBR green master mix determines outcome of nucleic acid amplification reactions. BMC Res Notes. 2016;9:292.
- Bustin SA, Benes V, Garson JA, et al. The MIQE guidelines: minimum information for publication of quantitative real-time PCR experiments. Clin Chem. 2009;55(4):611–622.
- Faraldi M, Gomarasca M, Sansoni V, et al. Normalization strategies differently affect circulating miRNA profile associated with the training status. Sci Rep. 2019;9(1):1584.
- Kok MGM, Halliani A, Moerland PD, et al. Normalization panels for the reliable quantification of circulating microRNAs by RT-qPCR. Faseb J. 2015;29(9):3853–3862.
- Donati S, Ciuffi S, Brandi ML. Human circulating miRNAs real-time qRT-PCR-based analysis: an overview of endogenous reference genes used for data normalization. Int J Mol Sci. 2019;20(18):4353.
- Schwarzenbach H, da Silva AM, Calin G, et al. Data normalization strategies for MicroRNA quantification. Clin Chem. 2015;61(11):1333–1342.
- de Spiegelaere W, Dern-Wieloch J, Weigel R, et al. Reference gene validation for RT-qPCR, a note on different available software packages. PLoS One. 2015;10(3):e0122515.
- Kok MGM, de Ronde MWJ, Moerland PD, et al. Small sample sizes in high-throughput miRNA screens: a common pitfall for the identification of miRNA biomarkers. Biomol Detect Quantif. 2018;15:1–5.
- Romaine SPR, Tomaszewski M, Condorelli G, et al. MicroRNAs in cardiovascular disease: an introduction for clinicians. Heart. 2015;101(12):921–928.
- de Ronde MWJ, Ruijter JM, Lanfear D, et al. Practical data handling pipeline improves performance of qPCR-based circulating miRNA measurements. RNA. 2017;23(5):811–821.
- Sinharay S, Stern HS, Russell D. The use of multiple imputation for the analysis of missing data. Psychol Methods. 2001;6(4):317–329.
- Souverein OW, Zwinderman AH, Tanck MWT. Multiple imputation of missing genotype data for unrelated individuals. Ann Hum Genet. 2006;70(Pt 3):372–381.
- de Ronde MWJ, Ruijter JM, Moerland PD, et al. Study design and qPCR data analysis guidelines for reliable circulating miRNA biomarker experiments: a review. Clin Chem. 2018;64(9):1308–1318.
- Daimiel L, Micó V, Díez-Ricote L, et al. Alcoholic and Non-Alcoholic beer modulate plasma and macrophage microRNAs differently in a pilot intervention in humans with cardiovascular risk. Nutrients. 2020;13(1):69.
- ten Berg PW, Shaffer J, Vliegenthart ADB, et al. Attending a social event and consuming alcohol is associated with changes in serum microRNA: a before and after study in healthy adults. Biomarkers. 2018;23(8):781–786.
- Flowers E, Won GY, Fukuoka Y. MicroRNAs associated with exercise and diet: a systematic review. Physiol Genomics. 2015;47(1):1–11.
- Ameling S, Kacprowski T, Chilukoti RK, et al. Associations of circulating plasma microRNAs with age, body mass index and sex in a population-based study. BMC Med Genomics. 2015;8(1):61.
- Max KEA, Bertram K, Akat KM, et al. Human plasma and serum extracellular small RNA reference profiles and their clinical utility. Proc Natl Acad Sci USA. 2018;115(23):E5334–E5343.
- Neal CS, Michael MZ, Pimlott LK, et al. Circulating microRNA expression is reduced in chronic kidney disease. Nephrol Dial Transplant. 2011;26(11):3794–3802.
- Rekker K, Saare M, Roost AM, et al. Circulating miR-200-family micro-RNAs have altered plasma levels in patients with endometriosis and vary with blood collection time. Fertil Steril. 2015;104(4):938–946.e2.
- Shende VR, Goldrick MM, Ramani S, et al. Expression and rhythmic modulation of circulating microRNAs targeting the clock gene Bmal1 in mice. PLoS One. 2011;6(7):e22586.
- Witwer KW. XenomiRs and miRNA homeostasis in health and disease: evidence that diet and dietary miRNAs directly and indirectly influence circulating miRNA profiles. RNA Biol. 2012;9(9):1147–1154.
- Ramos AE, Lo C, Estephan LE, et al. Specific circulating microRNAs display dose-dependent responses to variable intensity and duration of endurance exercise. Am J Physiol Heart Circ Physiol. 2018;315(2):H273–H283.
- Baggish AL, Hale A, Weiner RB, et al. Dynamic regulation of circulating microRNA during acute exhaustive exercise and sustained aerobic exercise training. J Physiol. 2011;589(Pt 16):3983–3994.
- Drummond MJ, McCarthy JJ, Fry CS, et al. Aging differentially affects human skeletal muscle microRNA expression at rest and after an anabolic stimulus of resistance exercise and essential amino acids. Am J Physiol Endocrinol Metab. 2008;295(6):E1333–E1340.
- Takahashi K, Yokota S i, Tatsumi N, et al. Cigarette smoking substantially alters plasma microRNA profiles in healthy subjects. Toxicol Appl Pharmacol. 2013;272(1):154–160.
- Vickers KC, Palmisano BT, Shoucri BM, et al. MicroRNAs are transported in plasma and delivered to recipient cells by high-density lipoproteins. Nat Cell Biol. 2011;13(4):423–33433.
- Heegaard NHH, Carlsen AL, Lilje B, et al. Diurnal variations of human circulating cell-free Micro-RNA. PLoS One. 2016;11(8):e0160577.
- Selvanayagam P, Lei G, Bell T, et al. Desquamin is an epidermal ribonuclease. J Cell Biochem. 1998;68(1):74–82.
- Harder J, Schröder JM. RNase 7, a novel innate immune defense antimicrobial protein of healthy human skin. J Biol Chem. 2002;277(48):46779–46784.
- Nabulsi R, Al-Abbadi MA. Review of the impact of water quality on reliable laboratory testing and correlation with purification techniques. Lab Med. 2014;45(4):e159–e165.
- Green MR, Sambrook J. Molecular cloning: a laboratory manual. Cold Spring Harbor: Cold Spring Harbor Laboratory Press; 2012.
- Li Y, Breaker RR. Kinetics of RNA degradation by specific base catalysis of transesterification involving the 2γ-hydroxyl group. J Am Chem Soc. 1999;121(23):5364–5372.
- Miyamoto T, Okano S, Kasai N. Irreversible thermoinactivation of ribonuclease-A by soft-hydrothermal processing. Biotechnol Prog. 2009;25(6):1678–1685.
- Kojabad AA, Farzanehpour M, Galeh HEG, et al. Droplet digital PCR of viral DNA/RNA, current progress, challenges, and future perspectives. J Med Virol. 2021;93(7):4182–4197.
- Dingle TC, Sedlak RH, Cook L, et al. Tolerance of droplet-digital PCR vs real-time quantitative PCR to inhibitory substances. Clin Chem. 2013;59(11):1670–1672.
- Ferracin M, Salamon I, Lupini L, et al. Circulating MicroRNA quantification using DNA-binding dye chemistry and droplet digital PCR. J Vis Exp. 2016;2016(112):54102.