
Abstract
Reference intervals (RIs) are the cornerstone for evaluation of test results in clinical practice and are invaluable in judging patient health and making clinical decisions. Establishing RIs based on clinical laboratory data is a branch of real-world data mining research. Compared to the traditional direct method, this indirect approach is highly practical, widely applicable, and low-cost. Improving the accuracy of RIs requires not only the collection of sufficient data and the use of correct statistical methods, but also proper stratification of heterogeneous subpopulations. This includes the establishment of age-specific RIs and taking into account other characteristics of reference individuals. Although there are many studies on establishing RIs by indirect methods, it is still very difficult for laboratories to select appropriate statistical methods due to the lack of formal guidelines. This review describes the application of real-world data and an approach for establishing indirect reference intervals (iRIs). We summarize the processes for establishing iRIs using real-world data and analyze the principle and applicable scope of the indirect method model in detail. Moreover, we compare different methods for constructing growth curves to establish age-specific RIs, in hopes of providing laboratories with a reference for establishing specific iRIs and giving new insight into clinical laboratory RI research. (201 words)
Introduction
Real-world data (RWD) and real-world evidence (RWE) have long been applied in medicine, such as in the discovery in the eighteenth century that citrus fruits can be used to treat scurvy. RWD include routine data collected from various sources related to patient health status or healthcare provision for patients, in addition to traditional clinical trials [Citation1]. Alongside medical data such as those derived from hospital information systems (HISs), laboratory information systems (LISs), and health information management systems for physical examination, health data derived from personal wearable devices and personal health applications are also valuable. In recent years, with the wide application and development of electronic medical records (EMRs), real-world research has again attracted attention. U.S. Food and Drug Administration statements have been successively published, and guidelines have been proposed around the use of RWD and RWE in review and regulatory processes, such as those of pharmaceutical and biological products [Citation2–4], bringing real-world research into focus.
The rapid development of medical information technology and big data in medicine has opened many possibilities for the application of RWD, such as the regulation of medical devices, the development of safe and effective treatments for drugs, delivery of patient care, research in healthcare systems, and establishment of disease diagnosis or prognostic models [Citation5,Citation6]. RWD can also be used in clinical laboratories to establish reference intervals (RIs), real-time quality monitoring systems [Citation7], and automatic audit systems for test results, thereby greatly improving the efficiency of clinical laboratory testing, diagnostics, and treatment.
RIs refer to intervals between the upper and lower reference limits [Citation8] and are usually taken as the reference value of healthy individuals in the middle 95% (i.e. between the 2.5% and 97.5% quantiles) of the reference range. RIs are useful for judging patient health status and making clinical decisions such as diagnosis and treatment [Citation9]. In routine work, most RIs used in laboratories are cited from documents such as industry guidelines, textbooks, and instrument or reagent manufacturers’ instructions. However, the large number of laboratories worldwide, wide variety of instruments and reagents used range of detection methods available, and application of international standards all highlight the need for validation of RIs [Citation10]. Due to differences in population, geography, lifestyle, and epidemiological manifestations of disease, biological RIs also vary significantly between individuals [Citation11], and RIs directly imported from documents may not be applicable to local populations. Therefore, for many test indicators, it is often necessary for different laboratories to establish specific RIs to partition patients based on sex, age, population, ethnicity, and so on.
A document titled “Defining, Establishing, and Verifying Reference Intervals in the Clinical Laboratory: Approved Guideline–Third Edition (EP28-A3c)” [Citation8] put forth by the Clinical Laboratory Standards Institute (CLSI) and the International Federation of Clinical Chemistry and Laboratory Medicine (IFCC) in 2010, and the guidelines issued by the Société Française de Biologie Clinique (SFBC) [Citation12], recommend the “direct method” as the gold standard for establishing RIs by recruiting healthy individuals of adequate sample size (n ≥ 120). Although RIs established via this traditional method are relatively reliable, most laboratories find it difficult to directly recruit a sufficient number of “healthy” reference individuals. In addition, it is difficult to judge the definition of “health” for specific groups such as newborns and the elderly, and there are ethical limitations that make it more difficult to recruit adequate samples from such populations [Citation13]. With the development of real-world research, many scholars have begun to use the method of data mining on RWD to establish indirect reference intervals (iRIs) [Citation14]. RWD, derived from real medical environments, reflect the actual health status of patients and is widely used in clinical laboratories. Data mining methods are economical and practical, fit realistic data, have strong extrapolation capabilities, and can help establish population-specific RIs for children, older adults, and pregnant women. However, there are also some problems with their application. Many factors affect data quality in clinical laboratories, such as preanalytical factors and analytical factors, and the stability of iRIs is difficult to guarantee. Limited access rights to EMRs and incomplete clinical information, such that exclusion criteria cannot be strictly enforced, may lead to non-negligible selection bias. In addition, it is difficult to guarantee the security of data and the privacy of patients when using LIS data [Citation15,Citation16]. Data analysis is also challenging for physicians in district and community hospitals, who are particularly strained on weekdays and may have limited time to learn complex statistical methods for establishing iRIs using RWD.
At this stage, the establishment of iRIs is characterized by problems such as non-uniformity in steps and the numerous algorithms of modern models without any official guidance on the selection of a suitable algorithm. Although a multitude of studies has been done on indirect methods for establishing RIs, the accuracy of their findings needs verification, owing to a lack of uniform standards. To resolve the aforementioned problems, this paper will summarize several general steps for establishing iRIs based on RWD: data extraction, data cleaning, describing data distributions, statistical processing, validation, and publication of iRIs. Furthermore, we provide a brief overview of various statistical methods and their advantages and disadvantages, outline the current state of research on establishing iRIs based on RWD, and provide a reference for laboratory workers on the subject as well.
Methods of establishing RIs
There are two methods for establishing RIs: (1) the conventional method of direct sampling and (2) the big data method of determining RIs based on RWD for retrospective analysis using appropriate statistical methods, also called the indirect sampling method.
There are both a priori and a posteriori processes for establishing RIs. The a priori approach aims at including reference individuals who meet the criteria after setting adequate inclusion criteria, which is suitable for tests that have mature detection procedures. The a posteriori approach aims at excluding group samples after they have been drawn, tested, and analyzed, and is appropriate for new tests or less-developed test procedures. The direct method is commonly used as an a priori approach, with steps generally including the collation of known sources of variation, the development of a questionnaire, the establishment of strict inclusion/exclusion criteria, assessment of the fitness levels of reference individuals, and screening a sufficient number of reference individuals that meet all the above criteria.
In general, direct methods have the advantages of accurate results and adequate representation of study subjects when the preanalytical, analytical, and post-analytical conditions are well controlled. However, because “health” is difficult to define and the selection of reference individuals is the most difficult aspect of the direct approach, the selected screening criteria and the presence of subclinical disease states will directly influence the values of the biological RIs obtained. In addition, recruitment of sufficient reference individuals is inherently difficult for general laboratories, owing to which the EP28-A3c document allows the establishment of iRIs.
Indirect methods can be divided into two categories. The first involves establishing iRIs by obtaining data that approximate the distribution of the community population, such as those derived from physical examination and blood donation centers. The second category involves establishing iRIs using “mixed distribution” data stored in the laboratory, which are statistically processed to isolate “normally distributed” data. Methods and processes for determining iRIs have been developed for more than 50 years, and medical big data analysis, with real and adequate data sources, is an important aspect of RWD research that provides convenience for RI research, as well as providing new schemes for various aspects such as laboratory process optimization and quality control [Citation17].
Studies of iRIs based on RWD have several advantages over traditional methods [Citation9,Citation18–21]. The most prominent advantage is the large volume of available data. The sample size of the database often remains adequate after excluding samples that do not meet the requirements, favoring the study of variant sources, enabling the comprehensive analysis of relevant stratification, and even establishing RIs for rare or expensive detection indicators. Second, the data stored in the laboratory are obtained from a mixed distribution of “healthy” individuals versus “non-healthy” individuals, rather than “apparently healthy” individuals specifically recruited after rigorous screening, which fits the population distribution and therefore strongly represents the population served by RIs in reality. Third, the indirect method requires no reference population recruitment, sample collection, and other related steps, which significantly reduces the workload of researchers, improves the efficiency of the study, and greatly reduces costs. Fourth, it is advantageous to mine and compare the same detection indicators from multiple laboratories, facilitating better coordination and comparison between laboratories and promoting the establishment of multicenter RIs within countries or regions [Citation22]. In addition, indirect methods have ethical advantages, avoiding invasive specimen collection for reference individuals, and also avoiding similar less ethically compliant events, particularly vulnerable groups such as infants.
Establishment of iRIs from real-world data
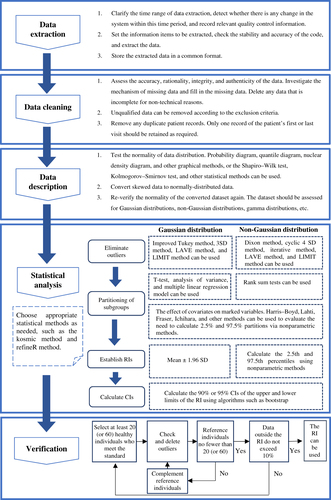
The general process of the indirect method has been summarized in several previous publications [Citation19,Citation23,Citation24]. It is typically divided into the following steps: data extraction, data cleaning, data distribution description, statistical processing, RI verification, and publication. The specificities of the process are shown in .
Figure 1. Flowchart for establishing reference intervals from real-world data. SD: Standard Deviation; LAVE: Latent abnormal values exclusion; LIMIT: Laboratory Information Mining for Individualized Thresholds; RIs: Reference intervals; Cis: Confidence intervals.
Sample size
The sample size for the direct method recommended by the CLSI Working Group guidelines is at least 120, which is not an optimal number for the indirect method. The sample size of RWD required can be affected by the skewed distributions of reference populations, the proportion of pathological data, and the degree of overlap between populations [Citation25]. Larger sample sizes are required to establish iRIs for partitioning with more variability [Citation26]. In recent years, some scholars have explored the topic of sample size needed via research and have proposed sample size procedures and calculation algorithms [Citation27–29]. Linnet [Citation30,Citation31] proposed methods for estimating sample size, and indicated how sample size is related to data distribution and whether a larger sample size is required when the distribution is clearly skewed. Ammer et al. also put forward the same opinion, using Z-score deviation to evaluate the accuracies of established iRIs when the sample sizes were 1000, 5000, 50,000, and 500,000, and authors stated that the sample size of over 5000 was required when there was large disease bias in RWD [Citation32].
Data preprocessing
Unlike direct methods, which have strict inclusion and exclusion criteria, the volume of data included in indirect methods can be huge, and the processing of the data is critical to the results of the iRIs, in addition to guaranteeing the quality of the data (controlling preanalytical and analytical factors). Theoretically, the results of routine tests in healthy individuals all exhibit a Gaussian or near-Gaussian distribution [Citation33], while skewed distributions arise mostly from both disease factors and physiological factors [Citation25,Citation32,Citation34], and improper transformation of skewed data can produce erroneous RIs. Therefore, adequate preparation is necessary before the establishment of iRIs. Based on the observation or review of relevant literature, the initial assessment can reveal relevant diseases and physiological factors such as sex, weight, and age that may affect the level of indicators, thereby preliminary exclusion of abnormal data is carried out by screening diagnostic, departmental, and other information for establishing iRIs. Subgroups with clear differences are partitioned, overlaps between data are removed, and then the difficulty of obtaining a “non-disease” distribution is resolved using a statistical approach for the classification of clinical information [Citation23]. In addition, data from patients with repeated measurements should also be screened, keeping data from only the first or last test, as patients with multiple laboratory tests are more likely to be in a diseased state [Citation35].
Data description
Preprocessed data distributions such as the near-Gaussian distribution are not satisfactory, and relatively suitable methods can also be applied to transform or describe the data with other distributions, such as the Bhattacharya method applied to Gamma distributions. Log transformation is the most commonly used method and works well to adjust data to a normal distribution when the skewedness of the analyte distribution is explained by available biological factors [Citation33]. The modified Box-Cox transformation [Citation36,Citation37] is also commonly used and is considered a more flexible transformation method [Citation38]. However, there is often a risk of incorporating prevalence data this way, leading to the inadvertent widening of RIs [Citation39,Citation40]. Other non-Gaussian transformation methods such as Manly transformation and Erlang distribution [Citation20] are also available, but care must be taken when performing data transformation to avoid over-transformation, which can cause the RI to lose specificity [Citation23]. Latent class distribution regression [Citation41] is the most effective method to use when a disease causes a large bias, for example, but applying it when a disease causes less bias may overestimate the reference limit.
Elimination of outliers
Removal of outliers is an important step in obtaining an “approximately healthy” distribution, and there have been a number of publications summarizing different ways to remove them [Citation8,Citation19,Citation20,Citation23,Citation38]. These include the Dixon method [Citation42] (for nonparametric methods), the Tukey robust method [Citation43], the Horn method [Citation36] (performing a Box-Cox transformation and then applying the Tukey robust method), the Laboratory Information Mining for Individualized Thresholds (LIMIT) method for identifying outlier-related diagnostic codes by unsupervised machine learning [Citation44], the Latent Abnormal Value Exclusion (LAVE) method [Citation38], and others. Some scholars have applied different outlier removal methods to run comparative analyses using cohorts of data [Citation45,Citation46]. Tan et al. [Citation45] found that the kosmic algorithm performed best by comparing eight methods for excluding outliers or identifying pathological distributions.
Partitioning of subgroups
Whether direct or indirect, laboratories should generally establish different RIs for the same test item based on populations with different characteristics [Citation9,Citation20,Citation47–49]. Many scholars have made suggestions on how to best partition subgroups when establishing RIs, and the EP28-A3c document discusses several possible partitioning criteria such as sex, ethnicity, age, gestational period, and race. In addition, differences in blood groups, genetic constitutions, menstrual cycles, lifestyle habits, economic statuses, geographical environments [Citation50,Citation51], diurnal variations, and climatic seasons [Citation52–54] may also contribute to different normal levels of various indicators [Citation34]. Statistical difference analysis is also needed to judge the necessity of dividing subgroups according to literature or expert recommendations. The main statistical methods for this are the Harris Boyd method [Citation55,Citation56], Lahti method [Citation57], Fraser method [Citation58], and Ichihara method based on a 3-level nested ANOVA [Citation51]. Ichihara et al. published a comprehensive summary of these approaches in a previous report [Citation38].
Age-based partitioning
To improve the sensitivity and specificity of RIs, different subclasses need to first be defined, based on the characteristics of the reference individual [Citation9,Citation34], with the most common partition criteria being sex and age, which most recent studies take into account [Citation59–64]. However, stratification by age is more difficult than stratification by sex. In infants, particularly newborns, existing RIs do not necessarily correctly account for health status, as seen in studies aimed at screening newborns for congenital hypothyroidism [Citation65,Citation66], which have increased false-positive rates as well as unnecessary follow-up due to the absence of an age-stratified thyrotropin RI. In addition, children and adolescents differ greatly from adults in terms of growth, development, and dietary habits [Citation13], and changes in some specific biomarkers are associated with normal physiological growth and development (e.g. creatinine and alkaline phosphatase) [Citation64,Citation67–69]. All of these factors highlight the need to establish age-specific RIs [Citation70]. Menopause is an important age when women progress to a new physiological state, where the gradual decline of ovarian function leads to changes in the levels of indicators such as hormones [Citation34,Citation71]. A few studies have established relevant RIs around menopause [Citation72–74], but it is clear this physiological stage has not received enough attention. In addition, relevant studies of RIs in the elderly are fewer and more challenging. The main difficulty surrounding them has to do with the selection of healthy individuals; many elderly people have chronic diseases and need to take various prescription medications. In addition, many elderly people use health products and Chinese patent medicines. These factors make it difficult to distinguish variation among laboratory values due to physiological ageing versus morbid states and drug effects. During the twenty-first century, the proportion of the global elderly population has been increasing year over year [Citation75], and more attention has been paid to the health statuses of the elderly [Citation76]. For example, studies conducted by Eggers et al. suggested that N-terminal pro-B-type natriuretic peptide (NT-proBNP) and troponin T levels change with age in the elderly subgroup [Citation77]. More relevant studies have aimed at establishing geriatric-specific RIs in recent years [Citation59,Citation60,Citation78–80]. However, the CLSI guideline Defining, Establishing, and Verifying Reference Intervals [Citation8] is not entirely applicable to the elderly population. Thus, more targeted and guided statistical methods based on the special characteristics of the elderly population are needed. Despite these difficulties, it is still necessary for laboratories to establish specific RIs for specific stages of life.
Ethnic and regional partitioning
In addition to well-known stratifications by sex and age, ethnicity and region are other potential factors for stratification [Citation50,Citation51,Citation81]. Many studies have shown the influence of racial factors on reference ranges [Citation82–87]; however, most RI studies do not stratify according to racial factors. Most countries are ethnically heterogeneous, and individuals of different ethnicity may exhibit differences in reference values of some indicators due to genetic factors, lifestyle habits, and others. Standard reference individuals for existing RIs are mostly European/American Caucasians, although other ethnic populations form the worldwide majority. For instance, the median creatine kinase activity of healthy Black men is approximately twice that of Caucasians [Citation88]; thus, RI studies must take ethnicity into account. In addition, different countries and regions often have varied geographical characteristics and different topographies can also affect RIs; for example, the average hemoglobin level of people living in high-altitude areas is higher than that of people in other areas. Therefore, the establishment of RIs must be tailored, and the use of RIs that do not match the characteristics of the local population may lead to misinterpretation of test results.
Gestational partitioning
Women experience their own characteristic physiological changes during and after pregnancy. The first trimester in particular is an important period for predicting pregnancy complications or adverse pregnancy outcomes, and it is important to closely monitor every indicator during this period [Citation89]. The majority of current RIs have been established based on non-pregnant healthy women as reference individuals, and whether they are suitable for use in pregnant women needs to be evaluated [Citation90]. For example, RIs of thyroid function indicators during pregnancy have attracted much attention from scholars worldwide [Citation91–93]. According to large epidemiological studies, thyroid disorders in pregnancy are associated with severe maternal, fetal, and neonatal complications. Therefore, it is crucial to accurately diagnose thyroid disease in pregnancy at an early stage, which implies the need to ensure the availability of precise RIs for thyroid function indicators specific to pregnant women.
With the continuous progress of laboratory RI research, subgroup partitioning should be taken into account in most studies when establishing RIs. However, it remains controversial whether these partitions are necessary as RIs become increasingly more refined with finer partitioning. How to determine whether the grouping criteria are correct remains a challenge. While some scholars have illustrated the importance of proper stratification [Citation11,Citation94], others have proposed new solutions [Citation95]. For example, health states can be more effectively assessed by longitudinally comparing personalized reference values for an individual patient and assessing changes over time. With the development of precision medicine and the maturation of big data-related technologies, this is perhaps the future trend of RIs [Citation21].
Validation of RIs
Newly established RIs need to be validated before use [Citation8,Citation9,Citation20,Citation96]. Briefly, validation can be performed by collecting a small number of homogeneous healthy reference individuals (n = 20 or 60) from a laboratory that fulfills the exclusion criteria and partitioning requirements, removing the outlier results, and replenishing the eligible reference individuals, then repeating these steps to obtain 20 or 60 results without outliers. If no more than 10% of the results fall outside the established RI, the RI can be used.
Validation is also necessary when laboratories are going to use literature-derived RIs, guideline-derived RIs, or RIs established by other laboratories. If all study conditions are met, validation of proposed RIs is performed by checking the consistency of the sample collection process, the analysis system, and the population characteristics of the subjects. After validation as per the above method, the proposed RIs can be put into use.
Selection of statistical methods
Statistical models for establishing iRIs
Statistical methods for the official establishment of RIs recommended by the EP28-A3c document [Citation8] include parametric, nonparametric, and robust methods. If the data conform to a normal distribution or are transformed to arrive at a normal distribution, a parametric method can be used to calculate confidence intervals (usually 95% confidence intervals, as the mean ± 2 SD) for normally distributed datasets as RIs. If the data are also transformed to arrive at a normal distribution and the sample size is ≥120 patients for each subgroup, a nonparametric approach is generally used, taking values between the 2.5th and 97.5th percentiles of the data distribution as the RI. An exception to this is special markers, such as cardiac troponin, for which the 99th percentile of the data distribution should be selected as the upper reference limit based on required guidelines [Citation97]. The parametric and non-parametric methods are also frequently used when establishing RIs via direct methods; applying them in indirect methods requires clear identification and handling of outliers. The robust method is an iterative algorithm for estimating RIs with small sample sizes and is applied in studies with sample sizes of <120 subjects. However, there is still a need to ensure that the data are symmetrically distributed. This method is also applicable to big data analysis and requires the use of bootstrap methods to calculate confidence intervals for RI bounds. A previous study [Citation98] contrasted these three methods, stating that appropriate methods should be selected based on sample size and data inclination, and the performances of the three methods are influenced only by these two factors.
In recent years, many scholars have proposed the need to establish new algorithms based on iRIs of mixed distribution data or created related computerized instructions, such as the reference value advisor instructions for small sample groups [Citation99]. In this vein, there are ongoing efforts to obtain distributed data that are “approximately healthy”. A summary of the indirect modeling methods are shown in Supplementary Table 1.
Hoffmann method
The Hoffmann method, proposed in 1963, is an algorithm for plotting scatterplots of cumulative frequencies on normal probability paper. In this graphical algorithm, data from mixed distributions are presented in different linear regions to identify “diseased individuals,” thereby using non-diseased datasets to establish iRIs. Several variants of the Hoffmann method subsequently emerged, among which was an improvement proposed by Katayev et al. [Citation100], which quickly came into question [Citation101–103]. Some researchers claimed that this variant went against the basic theory underlying the Hoffmann method and caused the established iRIs to be too narrow. Holmes et al. evaluated the method proposed by Katayev et al. along with the correct Hoffmann method, as well as the Bhattacharya method, and suggested alternative methods suitable for use in modern times [Citation102].
Bhattacharya method
The Bhattacharya method is a graphical method that appeared in the literature after the Hoffmann method and was subsequently applied in the field of medicine [Citation104]. At first, the method required that the obtained health distribution be normal and later resolved some technical shortcomings after several improvements. A further improvement of this method involves a description of the patient data as having a gamma distribution [Citation105], which can be done using software and computer programs [Citation106], as has been widely applied in many studies [Citation107]. However, many elements in the graphical approach of the Bhattacharya method require a subjective decision to be made by the researcher; thus, the results may not be objective enough.
The Hoffmann and Bhattacharya methods separate distributions using graphical methods, and although intuitive, do not perform well enough. Both methods contain visually identified steps that are prone to human error. In addition to the above two methods, the Pryce method [Citation19,Citation108], which assumes that the central components of the distribution represent observations of healthy individuals and follow a Gaussian distribution, requires clarity as to whether test results for a reference population in a mixed distribution are distributed at one or both ends. Since the method was popularized before computers became commonplace, it is not widely applied today. Nowadays, with the progressive maturation of computer algorithms and rapid advances in information technology, there is a gradual shift of focus to more sophisticated but effective modern methods of mixture model decomposition.
Expectation–maximization algorithm
The expectation–maximization (EM) algorithm [Citation31], an improved method based on the Bhattacharya method, can be applied to Gaussian mixture models. It is an iterative algorithm with two main steps: taking the expectation expression and maximizing the expectation. Its execution starts with an initial round of calculation, with each round of calculation repeating the aforementioned two steps until the various parameters converge and finally cluster into a dataset with different distribution parameters. A head distribution set and a tail distribution set are obtained, combined with the actual selection of the head or tail representative of a healthy distribution, and the separated normally distributed data are run to establish iRIs using a nonparametric method.
Truncated minimum chi-square
The truncated minimum chi-square (TMC) model [Citation109] is a mixture model of discrete data, which assumes that a majority of the dataset consists of “non-morbid” values. It has an emphasis on describing centrally distributed data, and only truncated datasets are used subsequently. This model does not explicitly require the type of morbid distribution, and the “non-diseased” distribution of the data needs to satisfy a power normal distribution. This method can also automate stratified analyses by sex and age and is available in the TMC script in R (a commonly used free open-source programming language for statistics and graphics) [Citation110].
Truncated maximum likelihood estimation model and kosmic model
The truncated maximum likelihood (TML) model was developed by Arzideh et al. [Citation111] and can estimate skewed distributions. This method estimates the so-called non-morbid distribution utilizing a truncated interval for the range of test results in the Box–Cox transformation of the input dataset and a power distribution estimated by the maximum likelihood method for the truncated data (μ, δ, and λ parameters). iRIs are calculated using a nonparametric method. Ahmed et al. [Citation112,Citation113] used the TML method to construct iRIs for alkaline phosphatase and creatinine levels among Pakistani children. Later, Zierk et al. made improvements to the TML method, called the kosmic [Citation114] model. The accuracy of the iRIs calculated via the kosmic model is assessed in the text using simulated datasets and patient samples, which show reliable results with increasing proportions of abnormal test results in <20% of cases with abnormal test results, even in challenging simulation scenarios. The kosmic algorithm has been used in the Next Generation Pediatric RIs project [Citation22]. However, the method requires two steps to establish a continuous RI, beginning by establishing iRIs for discrete age groups and then fuzing the data to derive continuous iRIs.
RefineR model
The refineR model was developed by Ammer et al. [Citation115] in 2021 and employs an inverse modeling approach to improve the quality of the repeat interval estimates as a refinement algorithm. Using simulated datasets based on conventional data and patient samples in the literature, Ammer et al. compared analyses with the kosmic algorithm and the direct method and eventually found that the refined model performed better than the kosmic algorithm for simulated distributions with a high proportion of non-morbid values (>20%), with even better values than the direct method published in simulation studies. Moosmann et al. [Citation116] used this method in 2022 to establish iRIs for neutrophil-to-lymphocyte ratios, platelet-to-lymphocyte ratios, and lymphocyte-to-monocyte ratios.
Self-organizing map model
Yan et al. [Citation117] proposed an application of the self-organizing map (SOM) model to the calculation of iRIs. In their report, iRIs established using the SOM model were compared to those established using the mixed Gaussian distribution model (EM algorithm). The iRIs estimated via the mixed Gaussian distribution model were considered to be consistent and stable but not for skewed distributions. While the SOM model is suitable for high-dimensional data and data that fit well within the set’s distribution, it is easily affected by sample size and outlier detection strategies.
The principles underlying this algorithmic model are also complex and, for non-specialists, difficult to operate and understand. However, some algorithmic models are implemented with fixed coding, and with the popularity of programming knowledge, most researchers in the future will likely be expected to use these improved new algorithms in combination with machine learning models to assist in the establishment of iRIs. Overall, the new algorithms detailed above are effective at correcting the data distributions of samples containing morbid states and stratifying RIs by clinically relevant covariates, which largely guarantees the accuracy of each study stage. However, there are still many aspects that need to be refined, such as the significant difficulty that lies in evaluating the efficacy of different indirect methods. Ammer et al. [Citation32] have recently developed the “RIbench” software (open-source R package) and proposed a significant novel approach for evaluating indirect methods. Using the absolute z-score deviation, they evaluated five indirect methods by comparing different sample sizes, locations of pathological distribution, degrees of overlap, and scores in the dataset of pathological data proportion. The “RIbench” software can objectively assess the robustness of different indirect methods and is an important tool for exploring more well-established indirect method sampling techniques [Citation25].
Methods of constructing growth curves for establishing age-specific RIs
Age is a continuous variable and does not have obvious cutoff points, making it difficult to divide age intervals for subgroups. For children and adolescents, in particular, the division of age reflects physiological conditions at different developmental periods, and discrete age groupings poorly reflect the dynamic changes in biomarkers with age. This problem is well addressed by plotting continuous growth charts that are currently widely used to establish age-specific RIs in the pediatric population [Citation118].
The easiest approaches to constructing growth curves are the deviation graph method and the percentile method; however, they yield suboptimal smoothness. A number of more advanced methods for fitting growth curves are now available, such as the method used by Mokhtar [Citation119], who applied the restricted cubic splines model to construct continuous RIs for thyrotropin levels. The fractional polynomial theory-based method proposed by Royston [Citation120] showed that relatively conventional polynomials are more flexible in fitting models and can accomplish model fitting with fewer terms. In addition to this, the lambda-median-sigma (LMS) method [Citation121] is an accepted standard approach to fitting growth curves among children and can be used to fit growth curves of height, weight, and body mass index [Citation122]. The generalized additive model for location, scale, and shape [Citation123] adds shape parameters based on the LMS model. It imposes no restrictions on the model distribution, can fit a smoother curve, is more stable and flexible relative to other methods, has become increasingly popular in recent years, and is also highly recommended by the World Health Organization [Citation124]. We summarized the advantages and disadvantages of the above methods for constructing growth curves in .
Table 1. Comparison of methods for fitting growth curves when establishing age-specific reference intervals.
Current challenges and prospects
Although indirect methods have substantial advantages in establishing biological RIs, many questions remain unanswered. Among the most important issues are statistical methods and computer technology. Data mining techniques can be unfamiliar and complex to most laboratory staff. There are more and more emerging statistical models for establishing iRIs, and the indirect model is not perfect at present. This makes it very difficult to ensure the accuracy of data analysis for iRIs establishment conducted by clinical laboratories. Moreover, the informatization of EMRs is a great challenge for laboratory personnel. Many laboratory personnel do not have sufficient access to EMRs, and even in laboratories where EMRs are accessible, issues with system compatibility between EMRs and LISs can lead to a series of failures in performing data analysis, such as missing information and formatting errors [Citation137]. Data mining, the foundation for establishing iRIs, relies on filtering access through existing health information to approximate healthy population distributions. Incomplete or inaccurate EMR data can therefore lead to inefficient data cleaning, stalling of studies, and erroneous results. Some researchers have proposed that data warehousing can solve the problem of data access [Citation138]; however, there are security and ethical issues to be considered in data sharing. Data security and privacy breaches, which are prevalent in medical big data research, have attracted much attention, and some studies have proposed effective solutions for this issue [Citation15,Citation16,Citation139]. As the standardization and regulations pertaining to big data improve, data security and privacy can also be better protected.
Data quality issues are also being highlighted lately. It is easy to ignore the influence of preanalytical and analytical factors using indirect methods. The review mechanism for missing criteria related to the extraction process of data, the large amount of data itself, and the improvement of data mining techniques cannot fully compensate for deficiencies in data quality, making it necessary to strictly specify all strategies to improve data quality. Data mining techniques can be strange and complex to most laboratory staff, making it very difficult to guarantee accurate data analysis, and building statistical models of iRIs in clinical laboratories requires advanced training. Information technology has developed rapidly in recent years, and the application of artificial intelligence and machine learning is expected to become key to solving these problems. If EMRs and LISs are upgraded, machines can automatically record and audit relevant variants during specimen collection, transportation, storage, and testing. While the laboratory is continuously monitored for quality using big data technology, the quality of data in the database can be effectively improved. Moreover, sophisticated statistical models can simplify the steps that require manual operation through machine learning, thus making it convenient for basic staff to also establish RIs at their own laboratories. With the realization of smarter laboratories, where all steps will be standardized, the comparability of results between different testing institutions will hopefully no longer be a problem that plagues physicians.
Existing research metadata and statistical methods used are mostly opaque, and the data used in a study may have a non-Gaussian distribution. The decision to process the data depends on the investigator, making it highly subjective. Although current guidelines for establishing RIs via RWD mining can cite the CLSI guidelines, the guidelines provide only limited recommendations and are in need of regular updates. Fortunately, many expert scholars have published instructive articles [Citation14,Citation19,Citation20], that detail relevant statistical techniques. The IFCC and CLSI encourage clinical laboratories to establish a consensus on indirect methods for the establishment of RIs, and future standardization will hopefully also improve transparency in RI research.
With the application of computer technology and artificial intelligence to RWD, real-world research is gradually maturing. Making systematic automatic recording and review of relevant variants during laboratory specimen processing a reality, improving the information acquisition module of EMRs, and enabling information sharing with various systems will lead to great improvements in the integrity, accuracy, traceability, and safety of laboratory data. Applying machine learning to build statistical models of iRIs will make the determination process of iRIs easier. With the construction of intelligent laboratories in which all links will be standardized, the mutual recognition of results between different laboratories will no longer be an issue. In addition, the privacy rights of patients will be paid more and more attention to, the relevant big data regulations will be gradually improved, and computer technology can be applied to upgrade database security systems to adequate levels.
Limitations
There are some noteworthy limitations to this review. We were not able to obtain all the articles of the relevant studies mentioned due to problems inherent to the retrieval strategy or to obtain permissions for the necessary literature databases. Moreover, most of the retrieved articles are in English, and RI research articles written in other languages are difficult to include, resulting in a bias against some non-English-speaking countries’ or regions’ findings. We hope to improve our retrieval strategy to solve these issues in the future.
Geolocation information
Shengjing Hospital of China Medical University, No.36 Sanhao Street, Heping District Shenyang, Liaoning Zip, China
| Abbreviations | ||
| ANOVA | = | Analysis of variance |
| CI | = | Confidence interval |
| CLSI | = | Clinical Laboratory Standards Institute |
| EM | = | Expectation–maximization |
| EMR | = | Electronic medical record |
| GAMLSS | = | Generalized additive models for location, scale, and shape |
| HIS | = | Hospital information system |
| IFCC | = | International Federation of Clinical Chemistry and Laboratory Medicine |
| Iri | = | Indirect reference interval |
| LAVE | = | Latent Abnormal Values Exclusion |
| LIMIT | = | Laboratory Information Mining for Individualized Thresholds |
| LIS | = | Laboratory information system |
| LMS | = | Lambda-median-sigma |
| NT-proBNP | = | N-terminal pro-B-type natriuretic peptide |
| RI | = | Reference interval |
| RWD | = | Real-world data |
| RWE | = | Real-world evidence |
| SD | = | Standard deviation |
| SFBC | = | Société Française de Biologie Clinique |
| SOM | = | Self-organizing map |
| TMC | = | Truncated minimum chi-square |
| TML | = | Truncated maximum likelihood |
Supplementary Table 1 20230129.docx
Download MS Word (173.3 KB)Disclosure statement
No potential conflicts of interest have been reported by the authors.
Data availability statement
No data, models, or code were generated or used during this study.
Correction Statement
This article has been corrected with minor changes. These changes do not impact the academic content of the article.
Additional information
Funding
References
- Sherman RE, Anderson SA, Dal Pan GJ, et al. Real-world evidence - what is it and what can it tell us? N Engl J Med. 2016; 375(23):2293–2297.
- FDA.gov [Internet]. CDER, CBER; 2019 [updated 2022 September 8; cited 2022 September 28]. Available from: https://www.fda.gov/media/124795/download
- FDA.gov [Internet]. FDA; 2018 [cited 2022 September 28]. Available from: https://www.fda.gov/media/120060/download
- FDA.gov [Internet]. CDRH; 2016 [updated 2018 September 17; cited 2022 September 28]. Available from: https://www.fda.gov/media/99447/download
- Tomašev N, Glorot X, Rae JW, et al. A clinically applicable approach to continuous prediction of future acute kidney injury. Nature. 2019; 572(7767):116–119.
- Borges do Nascimento IJ, Marcolino MS, Abdulazeem HM, et al. Impact of big data analytics on people’s health: overview of systematic reviews and recommendations for future studies. J Med Internet Res. 2021; 23(4):e27275.
- Badrick T, Bietenbeck A, Cervinski MA, et al. Patient-based real-time quality control: review and recommendations. Clin Chem. 2019; 65(8):962–971.
- Boyd JC. CLSI. Defining, establishing, and verifying reference intervals in the clinical laboratory; approved guidelines—Third Edition. CLSI document EP28-A3c. Wayne, PA: Clinical and Laboratory Standards Institute; 2008.
- Jones GRD, Haeckel R, Loh TP, et al. Indirect methods for reference interval determination - review and recommendations. Clin Chem Lab Med. 2018; c 1957(1):20–29.
- Friedberg RC, Souers R, Wagar EA, et al. The origin of reference intervals. Arch Pathol Lab Med. 2007; 131(3):348–357.
- Ozcurumez MK, Haeckel R. Biological variables influencing the estimation of reference limits. Scand J Clin Lab Invest. 2018; 78(5):337–345.
- Henny J, Arnaud J, Giroud C, et al. editors. Determination and verification of reference intervals. Annales de biologie clinique; 2010 Dec; 68 Spec No 1:305–313.
- Shaw JL, Binesh Marvasti T, Colantonio D, et al. Pediatric reference intervals: challenges and recent initiatives. Crit Rev Clin Lab Sci. 2013; 50(2):37–50.
- Manrai AK, Patel CJ, Ioannidis JPA. In the era of precision medicine and big data, who is normal? JAMA. 2018;319(19):1981–1982.
- Price WN, 2nd, Cohen IG. Privacy in the age of medical big data. Nat Med. 2019;25(1):37–43.
- Pika A, Wynn MT, Budiono S, et al. Privacy-preserving process mining in healthcare. Int J Environ Res Public Health. 2020; 17(5):1612.
- Tolan NV, Parnas ML, Baudhuin LM, et al. Big data" in laboratory medicine. Clin Chem. 2015; 61(12):1433–1440.
- Miller WG, Horowitz GL, Ceriotti F, et al. Reference intervals: strengths, weaknesses, and challenges. Clin Chem. 2016; 62(7):916–923.
- Farrell CL, Nguyen L. Indirect reference intervals: harnessing the power of stored laboratory data. Clin Biochem Rev. 2019;40(2):99–111.
- Haeckel R, Wosniok W, Streichert T, et al. Review of potentials and limitations of indirect approaches for estimating reference limits/intervals of quantitative procedures in laboratory medicine. J Lab Med. 2021;45(2):35–53.
- Obstfeld AE, Patel K, Boyd JC, et al. Data mining approaches to reference interval studies. Clin Chem. 2021; Sep 167(9):1175–1181.
- Zierk J, Baum H, Bertram A, et al. High-resolution pediatric reference intervals for 15 biochemical analytes described using fractional polynomials. Clin Chem Lab Med. 2021; 59(7):1267–1278.
- Sikaris KA. Separating disease and health for indirect reference intervals. J LabMed. 2021;45(2):55–68.
- Ma C, Wang X, Wu J, et al. Real-world big-data studies in laboratory medicine: current status, application, and future considerations. Clin Biochem. 2020; 84:21–30.
- Sikaris KA. The role of mimicry in defining statistical health. Clin Chem. 2022;68(11):1356–1357.
- Ma C, Wang X, Xia L, et al. Effect of sample size and the traditional parametric, nonparametric, and robust methods on the establishment of reference intervals: evidence from real world data. Clin Biochem. 2021; 92:67–70.
- Hawkins RC, Badrick T. Reference interval studies: what is the maximum number of samples recommended? Clin Chem Lab Med. 2013; 51(11):2161–2165.
- Wellek S, Lackner KJ, Jennen-Steinmetz C, et al. Determination of reference limits: statistical concepts and tools for sample size calculation. Clin Chem Lab Med. 2014; 52(12):1685–1694.
- Shieh G. Precise confidence intervals of regression-based reference limits: method comparisons and sample size requirements. Comput Biol Med. 2017; 191:191–197.
- Linnet K. Two-stage transformation systems for normalization of reference distributions evaluated. Clin Chem. 1987; 33(3):381–386.
- Concordet D, Geffre A, Braun JP, et al. A new approach for the determination of reference intervals from hospital-based data. Clin Chim Acta. 2009; 405(1-2):43–48.
- Ammer T, Schützenmeister A, Prokosch HU, et al. RIbench: a proposed benchmark for the standardized evaluation of indirect methods for reference interval estimation. Clin Chem. 2022;68(11):1410–1424.
- Hyltoft Petersen P, Blaabjerg O, Andersen M, et al. Graphical interpretation of confidence curves in rankit plots. Clin Chem Lab Med. 2004;42(7):715–724.
- Sikaris KA. Physiology and its importance for reference intervals. Clin Biochem Rev. 2014; 35(1):3–14.
- Sikaris KA. Weighing up our clinical confidence in reference limits. Clin Chem. 2020; 66(12):1475–1476.
- Solberg HE, Lahti A. Detection of outliers in reference distributions: performance of Horn’s algorithm. Clin Chem. 2005; 51(12):2326–2332.
- Ichihara K, Kawai T. Determination of reference intervals for 13 plasma proteins based on IFCC international reference preparation (CRM470) and NCCLS proposed guideline (C28-P,1992): trial to select reference individuals by results of screening tests and application of maximal likelihood method. J Clin Lab Anal. 1996;10(2):110–117.
- Ichihara K, Boyd JC,. An appraisal of statistical procedures used in the derivation of reference intervals. Clin Chem Lab Med. 2010; 48(11):1537–1551.
- Jones GR. Reference interval determination by Bhattacharya analysis on skewed distributions–problems and pitfalls. Clin Biochem Rev. 2006;27: s 34.
- Shine B. Use of routine clinical laboratory data to define reference intervals. Ann Clin Biochem. 2008; 45(Pt 5):467–475.
- Hepp T, Zierk J, Rauh M, et al. Latent class distributional regression for the estimation of non-linear reference limits from contaminated data sources. BMC Bioinform. 2020; 21(1):524.
- Dixon W. Processing data for outliers. Biometrics. 1953;9(1):74–89.
- Data MITC, Komorowski M, Marshall DC, et al. Exploratory data analysis. Secondary analysis of electronic health records. Cham (CH): Springer Copyright 2016, The Author(s). 2016. p. 185–203.
- Poole S, Schroeder LF, Shah N. An unsupervised learning method to identify reference intervals from a clinical database. J Biomed Inform. 2016; 59:276–284.
- Tan RZ, Markus C, Vasikaran S, et al. Comparison of 8 methods for univariate statistical exclusion of pathological subpopulations for indirect reference intervals and biological variation studies. Clin Biochem. 2022;103:16–24.
- Hickman PE, Koerbin G, Potter JM, et al. Choice of statistical tools for outlier removal causes substantial changes in analyte reference intervals in healthy populations. Clin Chem. 2020; 66(12):1558–1561.
- Ozarda Y, Sikaris K, Streichert T, et al. Distinguishing reference intervals and clinical decision limits -– a review by the IFCC committee on reference intervals and decision limits. Crit Rev Clin Lab Sci. 2018; 55(6):420–431.
- den Elzen WPJ, Brouwer N, Thelen MH, et al. NUMBER: standardized reference intervals in The Netherlands using a 'big data’ approach. Clin Chem Lab Med. 2018; 57(1):42–56.
- McPherson K, Healy MJ, Flynn FV, et al. The effect of age, sex and other factors on blood chemistry in health. Clin Chim Acta. 1978; 84(3):373–397.
- Ichihara K, Ozarda Y, Barth JH, et al. A global multicenter study on reference values: 1. Assessment of methods for derivation and comparison of reference intervals. Clin Chim Acta. 2017; 467:70–82.
- Ichihara K, Itoh Y, Lam CW, et al. Sources of variation of commonly measured serum analytes in 6 asian cities and consideration of common reference intervals. Clin Chem. 2008; 54(2):356–365.
- Tong WW, Tong GH, Yang MH, et al. Age and seasonal variation and establishment of reference intervals for water-soluble vitamins determined by liquid chromatography tandem mass spectrometry. Nutrition. 2022; 95:111490.
- Wang D, Cheng X, Yu S, et al. Data mining: seasonal and temperature fluctuations in thyroid-stimulating hormone. Clin Biochem. 2018; 60:59–63.
- Ma C, Li D, Yin Y, et al. Establishing thresholds and effects of gender, age, and season for thyroglobulin and thyroid peroxidase antibodies by mining real-world big data. Clin Biochem. 2019; 74:36–41.
- Harris EK, Boyd JC. On dividing reference data into subgroups to produce separate reference ranges. Clin Chem. 1990; 36(2):265–270.
- Harris EK, Boyd JC. Statistical bases of reference values in laboratory medicine. Dallas (TX): CRC Press, 1995.
- Lahti A, Hyltoft Petersen P, Boyd JC, et al. Objective criteria for partitioning gaussian-distributed reference values into subgroups. Clin Chem. 2002;48(2):338–352.
- Fraser CG. Inherent biological variation and reference values. Clin Chem Lab Med. 2004;42(7):758–764.
- Nah EH, Kim S, Cho S, et al. Complete blood count reference intervals and patterns of changes across pediatric, adult, and geriatric ages in Korea. Ann Lab Med. 2018; 38(6):503–511.
- Adeli K, Higgins V, Nieuwesteeg M, et al. Complex reference values for endocrine and special chemistry biomarkers across pediatric, adult, and geriatric ages: establishment of robust pediatric and adult reference intervals on the basis of the Canadian health measures survey. Clin Chem. 2015; 61(8):1063–1074.
- Lv Y, Feng G, Ni X, et al. The critical gap for pediatric reference intervals of complete blood count in China. Clin Chim Acta. 2017; 469:22–25.
- Li J, Zhang H, Chen H, et al. Establishing reference intervals of 20 biochemical markers for children in southwestern Fujian, China based on the UniCel DxC 800 system. Ann Clin Biochem. 2020; 57(6):435–443.
- Zierk J, Hirschmann J, Toddenroth D, et al. Next-generation reference intervals for pediatric hematology. Clin Chem Lab Med. 2019; 57(10):1595–1607.
- Hoq M, Canterford L, Matthews S, et al. Statistical methods used in the estimation of age-specific paediatric reference intervals for laboratory blood tests: a systematic review. Clin Biochem. 2020; 85:12–19.
- Lauffer P, van Trotsenburg ASP, Zwaveling-Soonawala N. Low free thyroxine and normal thyroid-stimulating hormone in infants and children: possible causes and diagnostic work-up. Eur J Pediatr. 2021; 180(7):2333–2338.
- Ogunkeye OO, Roluga AI, Khan FA. Resetting the detection level of cord blood thyroid stimulating hormone (TSH) for the diagnosis of congenital hypothyroidism. J Trop Pediatr. 2008; 54(1):74–77.
- Zierk J, Arzideh F, Rechenauer T, et al. Age- and Sex-Specific dynamics in 22 hematologic and biochemical analytes from birth to adolescence. Clin Chem. 2015;61(7):964–973.
- Hoq M, Matthews S, Karlaftis V, et al. Reference values for 30 common biochemistry analytes across 5 different analyzers in neonates and children 30 days to 18 years of age. Clin Chem. 2019;65(10):1317–1326.
- Asgari S, Higgins V, McCudden C, et al. Continuous reference intervals for 38 biochemical markers in healthy children and adolescents: comparisons to traditionally partitioned reference intervals. Clin Biochem. 2019; 73:82–89.
- Ozarda Y, Higgins V, Adeli K. Verification of reference intervals in routine clinical laboratories: practical challenges and recommendations. Clin Chem Lab Med. 2018; 57(1):30–37.
- Honour JW. Biochemistry of the menopause. Ann Clin Biochem. 2018; 55(1):18–33.
- Mezzullo M, Gambineri A, Di Dalmazi G, et al. Steroid reference intervals in women: influence of menopause, age and metabolism. Eur J Endocrinol. 2021; 184(3):395–407.
- Yang J, Sa M, Huang M, et al. The reference intervals for HE4, CA125 and ROMA in healthy female with electrochemiluminescence immunoassay. Clin Biochem. 2013; 46(16-17):1705–1708.
- Cheng HY, Zeng L, Ye X, et al. Age and menopausal status are important factors influencing the serum human epididymis secretory protein 4 level: a prospective cross-sectional study in healthy chinese people. Chinese Med J. 2020; 133(11):1285–1291.
- Desa U. United nations, department of economic and social affairs, population division. World urbanization prospects: the 2018 revision (ST/ESA/SER. A/420). New York: United Nations. 2019.
- Arseneau E, Balion CM. Statistical methods used in the calculation of geriatric reference intervals: a systematic review. Clin Chem Lab Med. 2016; 54(3):377–388.
- Wlazel RN, Szwabe K, Guligowska A, et al. Soluble urokinase plasminogen activator receptor level in individuals of advanced age. Sci Rep. 2020; 10(1):15462.
- Adeli K, Higgins V, Nieuwesteeg M, et al. Biochemical marker reference values across pediatric, adult, and geriatric ages: establishment of robust pediatric and adult reference intervals on the basis of the Canadian health measures survey. Clin Chem. 2015; 61(8):1049–1062.
- Wang D, Yu S, Ma C, et al. Reference intervals for thyroid-stimulating hormone, free thyroxine, and free triiodothyronine in elderly Chinese persons. Clin Chem Lab Med. 2019; 57(7):1044–1052.
- Ma C, Xia L, Chen X, et al. Establishment of variation source and age-related reference interval models for 22 common biochemical analytes in older people using real-world big data mining. Age Ageing. 2020; 49(6):1062–1070.
- Ichihara K, Itoh Y, Min WK, et al. Diagnostic and epidemiological implications of regional differences in serum concentrations of proteins observed in six Asian cities. Clin Chem Lab Med. 2004;42(7):800–809.
- Colantonio DA, Kyriakopoulou L, Chan MK, et al. Closing the gaps in pediatric laboratory reference intervals: a CALIPER database of 40 biochemical markers in a healthy and multiethnic population of children. Clin Chem. 2012 May;58(5):854–868.
- Lim E, Miyamura J, Chen JJ. Racial/Ethnic-Specific Reference Intervals for Common Laboratory Tests: a Comparison among Asians, Blacks, Hispanics, and White. Hawaii J Med Public Health. 2015;74(9):302–310.
- Yang-Chun F, Min F, Di Z, et al. Retrospective study to determine diagnostic utility of 6 commonly used lung cancer biomarkers among han and uygur population in Xinjiang Uygur autonomous region of people’s republic of China. Medicine (Baltimore). 2016; May95(18):e3568.
- Schini M, Nicklin P, Eastell R. Establishing race-, gender- and age-specific reference intervals for pyridoxal 5'-phosphate in the NHANES population to better identify adult hypophosphatasia. Bone. 2020; 141:115577.
- Mayr FX, Bertram A, Cario H, et al. Influence of turkish origin on hematology reference intervals in the German population. Sci Rep. 2021; 11(1):21074.
- Sasamoto N, Vitonis AF, Fichorova RN, et al. Racial/ethnic differences in average CA125 and CA15.3 values and its correlates among postmenopausal women in the USA. Cancer Causes Control. 2021; 32(3):299–309.
- Brewster LM, Coronel CM, Sluiter W, et al. Ethnic differences in tissue creatine kinase activity: an observational study. PLOS One. 2012;7(3):e32471.
- Hadlow N, Sikaris K. Aspects to consider in adopting pregnancy-specific reference intervals. Clin Biochem Rev. 2015; 36(4):127–132.
- Liu J, Yu X, Xia M, et al. Development of gestation-specific reference intervals for thyroid hormones in normal pregnant northeast Chinese women: what is the rational division of gestation stages for establishing reference intervals for pregnancy women? Clin Biochem. 2017; 50(6):309–317.
- Ho CKM, Tan ETH, Ng MJ, et al. Gestational age-specific reference intervals for serum thyroid hormone levels in a multi-ethnic population. Clin Chem Lab Med. 2017; 55(11):1777–1788.
- Ma C, Li X, Liu L, et al. Establishment of early pregnancy related thyroid hormone models and reference intervals for pregnant women in China based on real world data. Horm Metab Res. 2021; 53(4):272–279.
- Okosieme OE, Agrawal M, Usman D, et al. Method-dependent variation in TSH and FT4 reference intervals in pregnancy: a systematic review. Ann Clin Biochem. 2021; 58(5):537–546.
- Haeckel R, Wosniok W. The importance of correct stratifications when comparing directly and indirectly estimated reference intervals. Clin Chem Lab Med. 2021;59(10):1628–1633.
- Coskun A, Sandberg S, Unsal I, et al. Personalized reference intervals in laboratory medicine: a new model based on within-Subject biological variation. Clin Chem. 2021; 67(2):374–384.
- Tate JR, Yen T, Jones GR. Transference and validation of reference intervals. Clin Chem. 2015; 61(8):1012–1015.
- Thygesen K, Alpert JS, Jaffe AS, et al. Fourth universal definition of myocardial infarction (2018). Circulation. 2018; 138(20):e618–e651.
- Daly CH, Higgins V, Adeli K, et al. Reference interval estimation: methodological comparison using extensive simulations and empirical data. Clin Biochem. 2017; 50(18):1145–1158.
- Geffre A, Concordet D, Braun JP, et al. Reference value advisor: a new freeware set of macroinstructions to calculate reference intervals with microsoft excel. Vet Clin Pathol. 2011; Mar40(1):107–112.
- Katayev A, Fleming JK, Luo D, et al. Reference intervals data mining: no longer a probability paper method. Am J Clin Pathol. 2015; 143(1):134–142.
- Zhang Y, Ma W, Wang G, et al. Limitations of the Hoffmann method for establishing reference intervals using clinical laboratory data. Clin Biochem. 2019; 63:79–84.
- Holmes DT, Buhr KA. Widespread incorrect implementation of the Hoffmann method, the correct approach, and modern alternatives. Am J Clin Pathol. 2019; 151(3):328–336.
- Holmes DT. Correct implementation of the Hoffmann method. Clin Biochem. 2019; 70:49–50.
- Baadenhuijsen H, Smit JC. Indirect estimation of clinical chemical reference intervals from total hospital patient data: application of a modified Bhattacharya procedure. J Clin Chem Clin Biochem. 1985; 23(12):829–839.
- Hemel JB, Hindriks FR, van der Slik W. Critical discussion on a method for derivation of reference limits in clinical chemistry from a patient population. J Automatic Chem. 1985;7(1):20–30.
- Bellview: A tool to perform Bhattacharya analysis on laboratory data. Available from: https://sourceforge.net/p/bellview/wiki/Home/. (Accessed 7 Apirl 2022).
- Farrell CL, Nguyen L, Carter AC. Data mining for age-related TSH reference intervals in adulthood. Clin Chem Lab Med. 2017; 55(10):e213–e215.
- Becktel JM. Simplified estimation of normal ranges from routine laboratory data. Clin Chim Acta. 1970; 28(1):119–125.
- Wosniok W, Haeckel R. A new indirect estimation of reference intervals: truncated minimum chi-square (TMC) approach. Clin Chem Lab Med. 2019; 57(12):1933–1947.
- Team C. R: a language and environment for statistical computing.: Vienna, Austria: R Foundation for Statistical Computing; 2022. Available from: https://www.r-project.org/.
- Arzideh F, Brandhorst G, Gurr E, et al. An improved indirect approach for determining reference limits from intra-laboratory data bases exemplified by concentrations of electrolytes/ein verbesserter indirekter ansatz zur bestimmung von referenzgrenzen mittels intra-laboratorieller datensätze am beispiel von Elektrolyt-Konzentrationen. J Lab Med. 2009;33(2):52–66.
- Ahmed S, Zierk J, Khan AH. Establishment of reference intervals for alkaline phosphatase in pakistani children using a data mining approach. Lab Med. 2020; 51(5):484–490.
- Ahmed S, Zierk J, Siddiqui I, et al. Indirect determination of serum creatinine reference intervals in a Pakistani pediatric population using big data analytics. World J Clin Pediatr. 2021; 10(4):72–78.
- Zierk J, Arzideh F, Kapsner LA, et al. Reference interval estimation from mixed distributions using truncation points and the Kolmogorov–Smirnov distance (kosmic). Sci Rep. 2020; 10(1):1704.
- Ammer T, Schutzenmeister A, Prokosch HU, et al. refineR: a novel algorithm for reference interval estimation from Real-World data. Sci Rep. 2021; 11(1):16023.
- Moosmann J, Krusemark A, Dittrich S, et al. Age- and sex-specific pediatric reference intervals for neutrophil-to-lymphocyte ratio, lymphocyte-to-monocyte ratio, and platelet-to-lymphocyte ratio. Int J Lab Hematol. 2022; 44(2):296–301.
- Yan R, Li K, Lv Y, et al. Comparison of reference distributions acquired by direct and indirect sampling techniques: exemplified with the pediatric reference interval in China (PRINCE) study. BMC Med Res Methodol. 2022; 22(1):106.
- Zierk J, Metzler M, Rauh M. Data mining of pediatric reference intervals. J Lab Med. 2021;45(6):311–317.
- Mokhtar KM. TSH continuous reference intervals by indirect methods: a comparisons to partitioned reference intervals. Clin Biochem. 2020; 85:53–56.
- Royston P, Wright EM. A method for estimating age‐specific reference intervals (‘normal ranges’) based on fractional polynomials and exponential transformation. J Royal Stat Soc. 1998;161(1):79–101.
- Cole TJ, Green PJ. Smoothing reference centile curves: the LMS method and penalized likelihood. Stat Med. 1992; 11(10):1305–1319.
- Cole TJ, Stanojevic S, Stocks J, et al. Age- and size-related reference ranges: a case study of spirometry through childhood and adulthood. Stat Med. 2009; 28(5):880–898.
- Rigby RA, Stasinopoulos DM. Generalized additive models for location, scale and shape. Journal of the Royal Statistical Society, Series C Applied Statistics. 2005;54(Pt):507–554.
- Borghi E, de Onis M, Garza C, et al. Construction of the World Health Organization child growth standards: selection of methods for attained growth curves. Stat Med. 2006; 25(2):247–265.
- Griffiths JK, Iles TC, Koduah M, et al. Centile charts II: alternative nonparametric approach for establishing time-specific reference centiles and assessment of the sample size required. Clin Chem. 2004; 50(5):907–914.
- Koduah M, Iles TC, Nix BJ. Centile charts I: new method of assessment for univariate reference intervals. Clin Chem. 2004;50(5):901–906.
- Grajeda LM, Ivanescu A, Saito M, et al. Modelling subject-specific childhood growth using linear mixed-effect models with cubic regression splines. Emerg Themes Epidemiol. 2016;13(1):1–13.
- Nadaraya EA. On estimating regression. Theory Probab App. 1964;9(1):141–142.
- Watson GS. Smooth regression analysis. Sankhyā Ser; 1964. Series A, 26, p. 359–372.
- Gasser T, Müller H-G. Kernel estimation of regression functions. Smoothing techniques for curve estimation. Heidelberg: Springer; 1979. p. 23–68.
- Royston P. Constructing time-specific reference ranges. Stat Med. 1991; 10(5):675–690.
- Gannoun A, Girard S, Guinot C, et al. Reference curves based on non-parametric quantile regression. Stat Med. 2002; 21(20):3119–3135.
- Cleveland WS. Robust locally weighted regression and smoothing scatterplots. J Am Stat Assoc. 1979;74(368):829–836.
- Cleveland WS, Devlin SJ. Locally weighted regression: an approach to regression analysis by local fitting. J Am Stat Assoc. 1988;83(403):596–610.
- Wan X, Qu Y, Huang Y, et al. Nonparametric estimation of age-specific reference percentile curves with radial smoothing. Contemp Clin Trials. 2012; 33(1):13–22.
- Stasinopoulos DM, Rigby RA. Generalized additive models for location scale and shape (GAMLSS) in R. J Stat Soft. 2007; 23(7):1–46.
- Kruse CS, Goswamy R, Raval Y, et al. Challenges and opportunities of big data in health care: a systematic review. JMIR Med Inform. 2016; 4(4):e38.
- Jackups R. Jr. Answering unanswerable questions in the clinical laboratory with data warehouses. Clin Chem. 2019; 65(12):1471–1473.
- Wan Z, Vorobeychik Y, Xia W, et al. Using game theory to thwart multistage privacy intrusions when sharing data. Sci Adv. 2021; 7(50):eabe9986.