
Abstract
Carrageenan (CGN) is a common food additive that has been widely used for decades as a gelling, thickening and stabilizing agent. Carrageenan has been proven safe for human consumption; however, there has been significant confusion in the literature between CGN and the products of intentional acid-hydrolysis of CGN, which are degraded CGN (d-CGN) and poligeenan (PGN). In part, this confusion was due to the nomenclature used in early studies on CGN, where poligeenan was referred to as “degraded carrageenan” (d-CGN) and “degraded carrageenan” was simply referred to as carrageenan. Although this nomenclature has been corrected, confusion still exists resulting in misinterpretation of data and the subsequent dissemination of incorrect information regarding the safe dietary use of CGN. The lack of understanding of the molecular weight distribution of CGN has further exacerbated the issue. The significant differences in chemistry, manufacture, and protein reactivity of CGN versus d-CGN and PGN are reviewed, in addition to the in vivo toxicological profiles of CGN, d-CGN, and PGN. As CGN cannot be hydrolyzed to PGN in vivo, concerns over the use of CGN as a food additive are unfounded, particularly since current studies support the lack of oncogenic and tumorigenic activity of CGN in humans.
Introduction
Carrageenan (CGN) is a high molecular weight sulfated polygalactan molecule found in various species of red seaweeds of the class Rhodophyceae. CGN is a linear polymer with a backbone comprised of repeating galactose sugars with varying degrees of sulfate groups attached. There are three major forms of carrageenan; lambda- (λ), kappa- (κ) and iota- (ι), which vary in the conformation of the galactose linkages and the level and location of sulfate groups. For example, κ-CGN and ι-CGN are composed of alternating D-galactose and 3,6-anhydro-galactose units and differ in the location and number of sulfate groups; while λ-carrageenan is primarily D-galactose with alternating α-1,3 and β-1,4-glycosidic linkages and lacks 3,6-anhydro-galactose units () (Blakemore and Harpell Citation2010; Blakemore Citation2015). These ideal structures are the primary components of commercial CGN products. CGN comprises copolymers of these ideal structures. The anionic sulfate groups on CGN bind to positively charged groups on proteins in food, resulting in the thickening and stabilizing properties of CGN in food products (Blakemore and Harpell Citation2010). summarizes the characteristics of PGN, d-CGN, and CGN.
Figure 1. Ideal carrageenan structures. Figure from Jiao et al. (Citation2011), an open access article distributed under the Creative Commons Attribution License (CC BY 3.0).
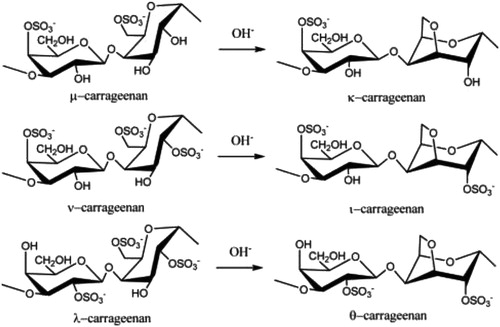
Table 1. Comparison of chemical / physical and toxicological properties of poligeenan and carrageenan.
Because of its properties, CGN has been widely used in the food and pharmaceutical industries for decades and is considered to be safe for human consumption. CGN is commonly found in dairy products, dairy substitutes (such as almond milk and soy milk), deli meats, nutritional supplements, beverages, and infant formula. In fact, JECFA (Citation1999) considers the three primary forms of CGN (λ, κ and ι) to show no major differences among them in terms of toxicological effects and human safety in foods. However, the minor differences in their chemistry impart different functional properties that are very useful to the food industry. For example, κ-CGN is known to provide a strong and brittle gel in the presence of potassium salts. Meanwhile, ι-CGN requires calcium to form an elastic gel with thixotropic behavior at low concentrations, while λ-CGN does not form gels, but can be used as a thickener. In the pharmaceutical industry, CGN is used as an excipient, and is included in the US FDA Database of Inactive Ingredients approved in drugs (US Food and Drug Administration Citation2018, Liang et al. Citation2014).
There has been significant confusion in the scientific literature and the public realm between the high molecular weight (Mw) food additive CGN (200,000 – 800,000 Da.) and the products of acid hydrolysis of CGN, which are d-CGN (20,000 to 40,000 Da.) and PGN (10,000-20,000 Da.). In early works PGN was often incorrectly called “degraded carrageenan” (d-CGN). In some instances, early studies referred to, d-CGN as CGN, furthering the confusion. However, in 1988, the United States Adopted Names Council (USAN Citation1988) assigned the name ‘‘poligeenan’’ to pharmaceutical aids and dispersing agents in the 10,000 – 20,000 Da. range. Unfortunately, the terms ‘‘poligeenan’’ and “degraded CGN” have not been used in the literature on a consistent basis. In fact, many studies published today still use the term CGN when describing the use of d-CGN, which continues to confuse both the scientific community and consumers. Over the past several years several groups have attempted to set the record straight regarding issues of size and nomenclature (Weiner, McKim, and Blakemore Citation2017; Weiner Citation2016; McKim Citation2014; Beattie et al. Citation2015). This confusion has resulted not only in some innocent, but incorrect conclusions in research papers and reviews (Weiner, McKim, and Blakemore Citation2017; Weiner Citation2016), but has also fueled misinterpretations of toxicological data by research groups (Tobacman Citation2001; Tobacman Citation2015) and by consumer groups (Cornucopia Institute Report Citation2013; Cornucopia Institute Report Citation2016). The basic research reported by these groups using cell models have since been proven to be non-reproducible (McKim Citation2014; McKim et al. Citation2016), and their assertions that CGN used as a food additive is harmful have been rejected by regulatory authorities (Department of Health and Human Services Citation2012; JEFCA Citation2015).
Some groups have postulated that PGN can be formed by hydrolysis of CGN in the acidic conditions found in animal and human stomachs. PGN is not produced biologically, it is produced in the laboratory or commercially by subjecting CGN to very low pH (0.9–1.3) and non-physiological temperatures (>80°C) for several hours. These harsh conditions do not exist in the stomach or intestinal tract of animals or humans. In rodents, the pH of the stomach is 3–5 and, as such, acid hydrolysis of CGN cannot occur (DeSesso and Jacobson Citation2001). In humans, gastric pH averages 2–3, but as food is taken in the pH rises rapidly to nearly 5 and then gradually goes back down to 2–3 as food leaves the stomach () (Kong and Singh Citation2008). Even with an average gastric emptying time in humans of 3–4 hours, there is insufficient time, temperature, and acid to cause CGN hydrolysis. Some studies have reported the formation of d-CGN using shorter times (1 hr) and lower temperatures (35oC) (Watt, McLean, and Marcus Citation1979). However, in the Watt, McLean, and Marcus (Citation1979) study, concentrated hydrochloric acid (HCl) (12 molar) was added to dry CGN powder. This concentration of acid is far more concentrated than the in the human stomach. At a pH of 1–2 the concentration of HCl in the human stomach is approximately 0.1 to 0.01 molar. Thus, the strong acidic concentration used by Watt, McLean, and Marcus (Citation1979) would not be found under normal physiologic conditions in the human stomach. In a study by Chen et al. (Citation2014), ʎ-CGN was purified, freeze-dried and resuspended with distilled water then adjusted to pH 1.9 with concentrated HCl. The incubation was incubated for 4 hr at 37oC. After neutralizing the mixture with NaOH it was subjected to ultracentrifugation through a membrane with a molecular weight cut off of 50,000 Da. Then it was subjected to a second filtration through a membrane with a molecular weight cutoff of 10,000 Da. This non-physiological preparation of d-CGN yielded some d-CGN, but the efficiency of the reaction model was not described (Chen et al. Citation2014). To date, the formation of PGN from CGN in the GI tract has not been demonstrated. This is an important point because the toxicological effects in the GI tract of animals have only been observed when using PGN (Mw 10,000 to 20,000 Da.) or degraded CGN (Mw 20,000-40,000 Da.). Both of these weight average molecular weight ranges are encompassed in the polydispersity molecular weight profile of PGN (). In dietary studies using food grade CGN (Mw 200,000 – 800,000) and conducted under Good Laboratory Practices (GLP) there were no intestinal lesions (Weiner 2007).
Figure 2. Changes in Gastric pH Before and After a Meal. Figure used with permission from Kong and Singh (Citation2008) and originally published in Malagelada et al. (Citation1976).
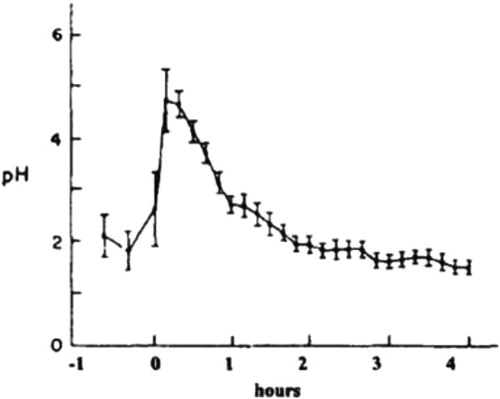
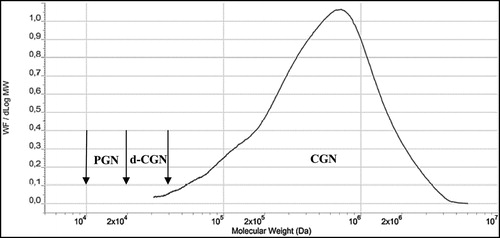
Figure 3. Molecular weight profiles of poligeenan and carrageenan, two distinct polydisperse
substances. Carrageenan is synthesized by red seaweed and displays the common characteristic of polydispersity, which is seen with many hydrocolloid molecules. Poligeenan can only be formed when carrageenan is subjected to harsh acid hydrolysis under laboratory conditions. In order to understand the molecular weight of a polymer it is subjected to size exclusion chromatography (SEC). The instrument compares the weight fraction per change in Log Mw (Y-axis) to the Log of the molecular weight of each fraction. Each molecular weight fraction produces a signal proportional to its concentration. The graph depicts the molecular weight (MW) profiles of both carrageenan and poligeenan. Both CGN and PGN profiles are made up of molecules of various sizes (polydispersity). Polydisperse molecules are often described by their weight average molecular weight (Mw). The vertical arrows show the accepted Mw range for poligeenan (PGN) (10,000 – 20,000 Da.), degraded carrageenan (d-CGN) (20,000 – 40,000 Da.), and CGN (200,000 – 800,000 Da.). Note that the Mw for poligeenan and d-CGN are both clearly part of the poligeenan molecular weight profile and both are formed by harsh acid hydrolysis in the laboratory, also known as the “poligeenan process.” In the example sample above the Mw for PGN is 19,000 Da. and the Mw for the CGN 707,000 Da. Mw requires that you know the fraction of the total weight represented by each individual molecular size. The total mass of each molecule in a sample is NiMi. To get the weight contribution as a fraction of the whole sample, each NiMi is divided by the SNiMi (the sum of all the NiMi values). This fraction is then multiplied by NiMi to yield WiMi. The weight average molecular weight (Mw) for the sample is then the sum of WiMi, where Ni is the number of molecules at any given weight, Mi is the molecular weight of each of those molecules, and Wi is the weight fraction of each type of molecule. See for an example of how to calculate Mn and Mw.
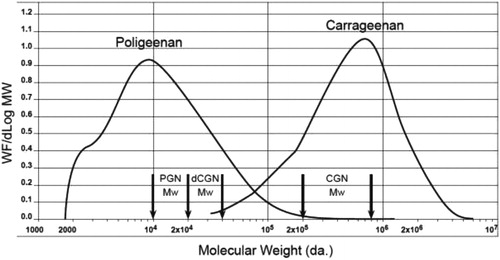
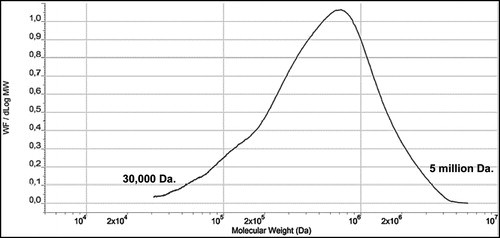
CGN has a low molecular weight fraction that is referred to as the “low molecular weight tail” or LMT. The average molecular weight (Mw) of the LMT is between 20,000 – 40,000 Da., typically with less than 10% of the entire fraction of CGN being lower than 50,000 Da. LMT cutoff (Weiner 2007; Weiner Citation2014). This LMT fraction is a product of the incomplete natural biological synthesis of CGN by seaweed during the normal life cycle prior to harvest. Approximately 90% of PGN, on the other hand, is <20,000 Da. (). A molecular weight profile for CGN used in infant formula is shown in . The CGN in this profile had a Mw of 707,000 Da.
Figure 4. Molecular Weight (Mw) Profile of Typical CGN used in Infant Formulations. (SEC/LS/RI Concentration versus Log Mw). Note the Mw for the CGN sample above is 707,000 Da. Figure used with permission from Blakemore et al. (Citation2014a) and modified.
PGN is not approved for use in food products, though it does have use in medical imaging, primarily in barium sulfate slurries used in X-ray studies of the mouth, throat, and esophagus during swallowing. PGN provides lubrication to aid in swallowing and the viscosity aids in maintenance of the suspension as well as prevention of barium sulfate aggregation and “caking” (Burges-Watson Citation2008).
Internationally, food grade CGN, is regulated and subject to designated specifications that include viscosity. The viscosity specification for carrageen is not less than 5 mPa (or cp) in 1.5% solution at 75°C. Viscosity is easily determined with solutions and it correlates very well with the molecular weight of CGNs, because viscosity increases exponentially with a greater molecular weight and/or greater concentration. Interest in establishing a specification of the LMT of CGN originated in a 2003 opinion expressed by the European Commission's Scientific Committee on Food (SCF) (European Commission Citation2003). The SCF evaluated a 2001 paper by Uno et al. (Citation2001b). This research team reported that they analyzed more than two dozen samples of CGN and measured the weight average molecular weight at greater than 450,000 Da. in each of these samples. Though they detected nothing at 20,000-30,000 Da., the researchers roughly estimated that PGN (a term which they used and defined as 20,000-30,000 Da.) could be present at levels up to 5% based on limits of detection at that time. Based on this speculative information, the SCF concluded that “… if feasible (emphasis added), a molecular weight limit of not >5% below 50 kDa. should be introduced into the specification, to ensure that the presence of any degraded carrageenan is kept to a minimum.” In 2004, the European Commission amended the European Purity Criteria for CGN to include the LMT specification without having established feasibility (Commission Directive Citation2004). The CGN industry has interpreted feasibility to mean development of a validated analytical method to accurately quantify molecular weight below 50,000 Da. (Marinalg Citation2015). While many analytical methods have been tried, all failed the robustness of validation. To put the LMT specification into perspective, CGN is used in foods typically at concentrations of 0.1 – 2% and the low Mw LMT fraction (20,000 – 40,000 Da. range) is a small fraction of the CGN intake (<5%). This is important to note since the harmful toxicological effects observed in vivo are in response to oral intake of PGN (or d-CGN) as unique test substances. Hence, animals were exposed to PGN or d-CGN at concentrations significantly higher than the typical small amount of ingested CGN-LMT ().
Table 2. Summary of the known gastrointestinal effects of poligeenan in various animal models.
Table 3. A Hypothetical example of how to calculate number average molecular weight (mn) and weight average molecular weight (mw).
The aim of this review is to summarize the chemistry, nomenclature, and toxicity of PGN, d-CGN, and CGN. In particular, the structure, composition, properties, molecular weight profiles and protein reactivity of PGN and d-CGN versus CGN will be addressed. In addition, the importance of molecular conformation and protein reactivity for the interpretation of feeding studies and observations will be described. Finally, the known effects of PGN, d-CGN and CGN on the GI tract will be discussed. An emphasis will be placed on the toxicological changes in the GI tract, effects on microflora, potential modulators of these effects, the role of the immune system, and cancer.
Chemistry
Carrageenan
It is not possible to discuss PGN without also discussing CGN because PGN is made in the laboratory or by commercial production plants, by acid hydrolysis of CGN at pH 0.9-1.3 and temperatures >80°C. CGN comprises copolymers of the ideal structures shown in . Commercial κ-CGN is a random copolymer of κ-CGN and mu (μ)-CGN in the approximate ratio of 95:5. In the harvested seaweed, this ratio is about 70:30, but commercial extraction of CGN under alkaline conditions converts this ratio to about 95:5. This ratio transition maximizes the primary functionality of commercial κ-CGN, namely water gel strength.
Commercial ι-CGNs are random copolymers of ι-CGN and nu (ν)-CGN, but there are multiple primary functionalities that require different ι:ν ratios, achieved by adjusting the alkali extraction treatment. In the harvested seaweed, the ratio of ι-CGN to ν-CGN is again about 70:30, but commercial extraction under separate alkaline conditions converts this ratio to about 85:15 to maximize rheological functionalities, or about 95:5 to maximize water gel strength. Commercial λ-CGN is a random copolymer of λ-CGN and theta (θ)-CGN in the ratio of about 90:10. In the seaweed, this ratio is about 95:5, but commercial extraction under very mild alkaline conditions increases the theta content to about 10%, and maximizes the molecular weight of the extract, its primary functionality being as a thickener.
One other primary commercial CGN type is κ-2, which occurs in several commercial seaweed species, mostly from Chile. κ-2-CGN is a copolymer of κ-CGN, μ-CGN, ι-CGN, and ν-CGN where the ratio of κ/μ: ι/ν is between about 70:30 and 50:50, and is not completely random. Again, various alkaline extraction conditions are used to maximize specific functionalities. The standard alkaline extraction of κ-2-CGN produces a commercial CGN with strong protein reactivity. The mild alkaline extraction of these κ-2 seaweeds produces a high molecular weight and extremely weak gelling or non-gelling commercial CGN which is often used to replace commercially pure λ-CGN, because it is extremely difficult and expensive to manufacture.
As stated previously, internationally, the viscosity specification for CGN is a “minimum of 5cps” (1.5%, 75ºC), which corresponds approximately to Mw of 100,000 – 175,000 Da. However, commercial CGNs are above this specification, with respect to both viscosity and Mw. In fact, the vast majority of food grade CGN viscosities are in the range of 10 – 700 cps, which correlates to a Mw in the range 200,000 – 800,000 Da. (Blakemore and Harpell Citation2010; Blakemore Citation2015; Food and Agriculture Organization of the United Nations Citation2007; Japan Food Additives Association Citation2009; Commission Regulation Citation2012; Food Chemicals Codex Citation2013).
There has been a great deal of confusion and misuse of the molecular weight data of CGN (Blakemore Citation2015). Like all natural hydrocolloids, including polysaccharides and proteins, CGN is polydisperse. This means that CGN extracts comprise a wide range of molecular weight fractions as detailed in . This profile was generated via size exclusion chromatography (SEC), to separate the fractions, coupled with light scattering (LS) to measure the molecular weight (MW) of the fractions, and refractive index (RI) to measure the concentration of the fractions (Blakemore et al. Citation2014a; Lecacheux et al. Citation1985). The weight average molecular weight (Mw) of the CGN sample analyzed in and is 707,000 Da. The sample's profile shows MW fractions ranging from about 30,000 Da to about 5,000,000 Da. This range demonstrates the polydispersity of CGN, which is also a property of other hydrocolloids, including PGN (PGN), other polysaccharides (e.g. alginate, pectin, xanthan), and food proteins (e.g. casein, and proteins in whey, soy, almond and pea). The key point of this profile is that the fraction at 30,000 Da. is CGN, not d-CGN. The fraction at 30,000 Da. is an integral component of the CGN product, as is the fraction at 5,000,000 Da., and all the fractions between these points. This polydispersity occurs naturally as part of the seaweed plant growth. The seaweed plant cannot and does not produce “instant” large molecules of single molecular weights, but generates molecules of different sizes depending on the growth needs of the living seaweed plants. The molecular weight profile represents a means of capturing a weight average molecular weight (Mw “snapshot”) of the CGN at the time of seaweed harvesting. Note that “CGN” does not contain “poligeenan” or “d-CGN,” even if there are partial minor molecular weight (or MW) profile overlaps with these products. This is a key point with respect to many misinterpretations of molecular weight data (Blakemore Citation2015).
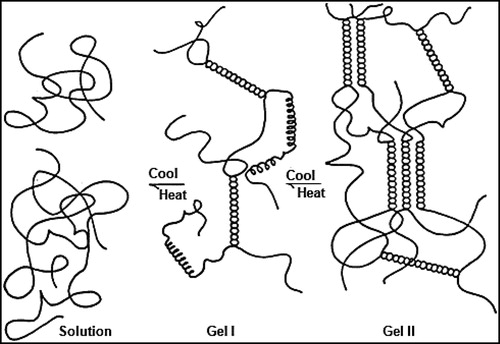
There are two primary functionalities for CGN: water gel strength and protein reactivity. Gelation of κ-CGN and ι-CGN involves a heat / cool cycle in the presence of specific cations, potassium for κ-CGN and calcium for ι-CGN. The gelation process is shown in and comprises the formation of double helices. In hot solution, CGN is in a random coil conformation. On cooling, the initial gel conformation is a 3-D network of double helices (Gel I). Gel I is the intermediate step for κ-CGN, but the final step for ι-CGN resulting in elastic gels with no syneresis (no shrinkage of gel volume from helical aggregation). On further cooling and standing, κ-CGN double helices aggregate (Gel II), resulting in strong brittle gels with syneresis, which is the release of water as the 3-D gel structure shrinks from helical aggregation (Blakemore and Harpell Citation2010; Blakemore Citation2015). It is important to note that when in the gel helical conformation, CGN has high acid stability, as demonstrated by CGN's application in ready-to-eat water gel desserts, where a long shelf life at pH 4 is required. Also, both κ-CGN and ι-CGN gels demonstrate hysteresis, where the melt temperature of the gels (about 55ºC) is about 15ºC higher than the setting temperature (about 40ºC). These functional gel properties of acid stability when in helical conformation and gel hysteresis support why CGN gels cannot breakdown in the GI tract and are excreted intact in feces (Dewar and Maddy Citation1970; Uno et al. Citation2001a).
Figure 5. Gelation mechanism of kappa-CGN and iota-CGN. Figure used with permission from Blakemore et al. (Citation2014a).
All CGNs react strongly with all proteins, with a combination of three cross-linking mechanisms to form stable 3-D structures at concentrations as low as 50 µg/mL (Blakemore and Harpell Citation2010; Blakemore Citation2015).
| · | Direct cross-linkages between positive sites on the protein and negative sites on CGN. | ||||
| · | Indirect cross-linkages between negative sites on the protein and negative sites on CGN via positive calcium divalent cations. | ||||
| · | CGN – CGN helical formation. | ||||
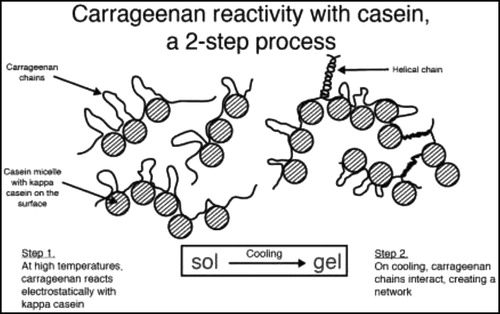
These stable 3-D structural combinations are shown in and using the reactivity between κ-CGN and casein. As the CGN concentration is increased, the finished CGN-protein structures progress from “stabilization” (e.g. canned evaporated milk, 50 µg/mL), to “stabilization + thickening” (e.g. chocolate milk, 300 µg/mL, and infant formulation, 300 µg/mL), to “stabilization + additional thickening (e.g. milk shakes, 750 µg/mL), to “stabilization + gelation” (e.g. flans and puddings, 2,000 µg/mL). The CGN concentrations required to achieve these levels of stabilization / thickening / gelation, as shown above with casein, depend on the type and quality of protein being used. For example, the CGN concentrations for fresh soy milk are similar to those detailed for casein. However, the CGN concentrations required when using soy isolates will be about 50% higher for the same effect; this being due to lower levels of direct cross-linkages, offset by higher levels of CGN-CGN helical interactions. Note that the strength and number of these CGN-protein interactions are strongly dependent on the pH of the application. As the pH of the application is lowered, the positive charge density on the protein increases, resulting in a stronger attraction to CGN. When approaching the isoelectric point (IEP) of the protein at about pH 4.5 (and below), the resulting CGN-protein structure with increased crosslinkages is so strong that the complex will precipitate. Full details on CGN gelation, protein reactivity, other functionalities, and complete lists of applications can be found in Blakemore and Harpell (Citation2010) and Blakemore (Citation2015).
Figure 6. Protein reactivity of kappa-CGN and casein. Figure used with permission from Blakemore et al. (Citation2014a).
As stated above, when CGN-protein foods are ingested, the very high Mw 3-D structure is precipitated in the acidic stomach (usually at or below the isoelectic point (IEP)) before being carried into the intestine. This means that the CGN remains bound to the protein until down into the lower GI tract. CGN is only released from the protein after the protein has been at least partially broken down by gut enzymes, which explains why such CGN released after protein digestion is excreted intact in feces (Dewar and Maddy Citation1970; Uno et al. Citation2001a). Also, since the ratio of protein:CGN is extremely high in foods (e.g. 3% protein with 0.03% CGN, protein digestion of food is not significantly impacted, which correlates to why animal feeding studies indicate no losses in body weight that were outside controls.
Poligeenan
PGN is manufactured by subjecting CGN to acid hydrolysis at a pH of 0.9–1.3 at non-physiological temperatures (>80°C) for several hours. The resulting liquor is neutralized to about pH 7.5 and the PGN isolated by roll-drying or spray drying. This degradation converts CGN with Mw = 200,000 – 800,000 Da. to PGN with Mw = 10,000 – 20,000 Da. (Blakemore and Harpell Citation2010; Blakemore Citation2015). The biological and toxicological activity of PGN is completely different from CGN. This is due to the lower Mw of PGN, which reduces the strength of protein binding and which may allow absorption from the gut and interaction with cell systems. In comparison, the high Mw of CGN, combined with its strong affinity for proteins means that it is not absorbed from the gut and does not interact with cellular processes of the intestinal mucosal surface. compares the MW profiles of food grade CGN and PGN. Molecular cleavage of the CGN during acid hydrolysis is random and the resulting MW profile is shown in . The CGN shown in is the same typical commercial product as per , and is used in infant formulations at about 300 µg/mL (). The Mw is 707,000 Da. and the profile comprises individual molecules from approximately 30,000 Da. to approximately 5,000,000 Da. This MW profile is typical of all CGN extracts and represents the range of CGN molecule sizes in the live growing seaweed at the time of harvesting. The percentage below 50,000 Da. of this CGN was calculated to be about 2.2% (Blakemore et al. Citation2014a).
The PGN Mw (weight-average molecular weight) profile shown in is a typical commercial product used in barium suspensions at about 10% for enhanced X-ray procedures and diagnostics. As expected from random acid hydrolysis, the PGN Mw profile has a similar shape to that of CGN, just moved to the left of CGN, because it contains fractions of lower MW () (note that the x-axis is logarithmic scale). The Mw of this PGN is 19,000 Da., and there is a skew towards the lower MW region at about 3,000 Da., which is typical of PGN products. The range of MW is from about 2,000 Da. to about 300,000 Da. The percentage below 50,000 Da. of this PGN was calculated to be about 96%, with about 48% below 10,000 Da. (Blakemore et al. Citation2014b). shows a profile overlap between these typical and individual CGN and PGN products, the Mw profiles crossing at about 70,000 Da. As explained in the prior section, this does not mean that the lower MW section of the CGN profile is PGN. These lower MW CGN components have not been produced by deliberate acid hydrolysis (PGN process); so they are not PGN. There is no PGN in CGN. Similarly, the higher MW components of the PGN profile are not CGN. These higher MW components of the PGN Mw profile are PGN. These higher MW fractions have been produced by deliberate acid hydrolysis (PGN process); they are PGN. There is no CGN in PGN, though both are polydisperse, containing a range of MW molecules or fractions. Again, this is a key point with respect to many misinterpretations of molecular weight data and toxicological conclusions.
PGN cannot form gels because the molecules are not long enough to form meaningful helical structures due to their lower Mw (Blakemore Citation2015). However, PGN has high protein reactivity, but only through direct cross-linkages with the protein. This means that PGN has no functionality in foods, whether stabilization, gelation, or thickening. CGN and PGN are two totally different commercial products, manufactured by two different processes to two different specifications, with two completely different regulatory positions, and with no overlapping applications (Blakemore Citation2015). CGN is used in food, pharmaceutical, and personal care applications. PGN is used solely as a clinical diagnostic tool for the suspension of barium sulfate. When used at about 10% (w/w) in this application, PGN has three primary clinical functionalities; short-term suspension of barium sulfate fine solids (thickening), ease of swallowing (lubricity), and prevention of barium sulfate particles “caking” on storage of liquid products (high charge density).
Degraded carrageenan
Another point of confusion is the term “d-CGN” which one might expect would include all products produced via the acid degradation of CGN, irrespective of the resulting molecular weight. In practice, the term “d-CGN” refers exclusively to the test material products used in the feeding study papers published in the literature from the mid-1950s through the mid-1970s.
By the mid-1950s and early 1960s, there were two sources of d-CGN available. The d-CGN product “Ebimar” was produced by Evans Medical Ltd., Liverpool, England from Irish Moss (species Chondrus crispus and Gigartina stellata) and could be used at concentrations above 5% without gelation. The molecular structure of Ebimar is comprised primarily of ideal k-CGN and ideal λ-CGN. The d-CGN product “C16” was produced by Laboratoires Glaxo, Paris, France from species Eucheuma spinosum, and comprised primarily ι-CGN. Both “Ebimar” and “C16” are referenced multiple times in scientific journals and patents of that time period (Burges-Watson Citation2008).
There is confusion in this early literature between Mw (weight-average molecular weight) and Mn (number-average molecular weight), and often neither “Mw” nor “Mn” are specified. However, these specific d-CGN test materials had a “weight average molecular weight” range of about 20,000 – 40,000 Da., slightly higher than ideal PGN (10,000 – 20,000 Da.), but still part of the PGN molecular weight profile (). Blakemore and Dewar (Citation1970) measured Mn of C16 at 16,000 Da. and 19,000 Da. by two difference chemical methods. The Polydispersity Index (PDI, a value calculated by dividing Mw/Mn) of single d-CGN extracts is typically about 1.75, which means that the Mw of C16 calculates to 28,000 Da. and 33,000 Da. respectively for the two methods used, both of these falling within the 20,000 – 40,000 Da. range quoted earlier.
The term “d-CGN” would also include PGN as this is can be made in the laboratory by the acid hydrolysis of CGN. On the other hand, it has been suggested that d-CGN products (i.e. C16 or Ebimar) are simply PGN (Burges-Watson Citation2008), while the SCF stated “degraded carrageenan, also called poligeenan, has a weight average molecular weight of 20–30 kDa. (Weiner Citation1991),” hence adding to the confusion. Although the Mw ranges of d-CGN and PGN as described above are clearly different, they are both part of the PGN molecular weight profile and thus can be considered PGN (). Based on the acid hydrolysis conditions published in these papers, the Mw profile of “d-CGN” would be similar to those shown in for PGN.
From the discussion above, the meaning of Mw should be clear with regard to describing PGN or CGN. Moreover, it should be apparent that PGN and d-CGN are both part of the PGN molecular weight profile and both are made artificially in the laboratory and not by seaweed plants. PGN and d-CGN are separate and distinct molecules, and are not part of the CGN molecular weight profile ().
Toxicology
The molecular conformations of CGN and PGN are of key importance for all feeding studies, particularly when water is used as the delivery vehicle (drinking water or oral gavage), and especially when drinking water is the only vehicle administered (Weiner Citation2016). At low concentration in water (e.g. 0.05%), CGN will be in the random coil conformation, with some steric exposure to other reactive molecules. At high concentration in water (e.g. 0.5%), CGN will be in the helical gel conformation, which is not only extremely stable in acid environments (e.g. gastric fluids), but with limited or no steric exposure to other reactive molecules. Between these concentrations, the conformation of CGN may be one or the other or both, depending on the type of CGN, the cations present (either inherent in the CGN or via added salts to the solution) and mode of solubilization (e.g. heat/cool cycle versus room temperature alone).
Drinking water studies investigating a range of concentrations of CGN are most likely to experience a change in molecular conformation of the CGN, which will significantly impact the experimental results and their interpretation. As the molecules in PGN are too short to form helices, PGN administered in drinking water will always be in the random coil conformation even at concentrations as high as 5%. These short PGN random coil molecules will have very high interaction with other reactive molecules as there are little or no steric restrictions. Thus, conformational awareness is of primary importance when interpreting the results of drinking water studies involving CGN and PGN, and comparisons of them.
Initial uses of poligeenan
Although the use of CGN dates back centuries, the use of the acid-hydrolyzed CGN derivative, PGN, is relatively recent. In the early-mid 1960s, it was found that CGN could reduce the pain associated with peptic ulcers (Piper and Fenton Citation1961, Anderson and Hargreaves Citation1965). However, the effective concentrations required for relief were too high and the resultant CGN solution formed a very viscous gel that was difficult or bothersome to swallow. It was known that hydrolyzing CGN by prolonged incubation at very low pH (0.9–1.3) and extreme temperatures (>80°C) would produce a sulfate polysaccharide (PGN) that could be prepared at very high concentrations in solution without the substantial viscosity problems. Therefore, researchers focused on PGN as a potential anti-peptic agent. Laboratoire Glaxo, Paris marketed C16 (comprised primarily of ideal ι-CGN from species Eucheuma spinosum) as an anti-peptic pharmaceutical while Evans Medical, UK marketed an anti-peptic pharmaceutical product called Ebimar based on κ- and λ-PGN.
It was thought that mechanistically, the palliative effect was due to sulfated polysaccharide inactivation of the pepsin enzyme. However, Anderson (Citation1961) showed in vitro that the interaction of PGN with the exposed proteins in the ulcerated areas protected these areas from the peptic enzyme, rather than causing a direct inhibition of the pepsin enzyme. This work was supported by evidence that a 30% solution of PGN administered by gastric intubation reduced the number and severity of Williams-Mann-induced ulcers in dogs (Mackie, MacVaugh III, and Patterson Citation1961). This effect was not species specific as a 5% solution of PGN in drinking water reduced histamine-induced gastric lesions both prior to and after histamine injections in Guinea pigs, though PGN intake prior to induction of the lesions provided better protection (Anderson and Soman Citation1965), suggesting that the stomach does not chemically alter PGN. Though PGN ingestion adheres to the mucin of the stomach and the duodenum, passage of PGN through the stomach is not required for the protective effects observed in the early anti-peptic studies (Anderson and Soman Citation1963; Anderson and Soman Citation1965), suggesting that the stomach doesn't chemically alter PGN.
This work was further supported by in vivo work in humans using CGN and PGN. Twenty-two patients with peptic ulcers (ages 26–69 years old) were administered either PGN in drinking water or PGN in drinking water along with anticholinergic and/or antacid preparations. Although half the patients experienced symptom relief, this was not related to inhibition of pepsin (Heinekin Citation1961). In fact, in a study that assessed both gastric and duodenal ulcerations, the progression of peptic ulcers in humans (aged 16–72 years old) was unaffected regardless of the extent of the relief garnered from either Ebimar (PGN) or aluminum hydroxide (Evans, Nowell, and Thomas Citation1965).
Given the chemical difference of the three major forms (κ, ι, λ) of CGN (and therefore three major forms of PGN prepared from them by acid hydrolysis), it is possible that the type of PGN/CGN influences the effectiveness of the anti-peptic treatment. For example, it is possible that λ-CGN or λ-PGN could provide better protective effect than ι-CGN/ι-PGN. To assess this possibility, Anderson and Soman (Citation1967) induced both gastric ulcers and duodenal ulcers in Guinea pigs by histamine injection, then assessed the different effects of κ-CGN, λ-CGN, κ-PGN and λ-PGN. The authors discovered no notable difference in protection between κ-CGN and λ-CGN in the anti-ulcer experiments; however, the anti-ulcerative effects of κ-CGN and λ-CGN were more pronounced than those of κ-PGN and λ-PGN.
Although numerous studies showed the anti-ulcerative effects of PGN, the limited knowledge of the causation of peptic ulcers meant that there was also a lack of knowledge on how PGN exerts the anti-ulcerative effects. Researchers set out to discern a mechanism for this effect and instead discovered that very high concentrations of both CGN and PGN in drinking water could induce ulcerations in the caecum of the Guinea pig, although the ulcerations were much more severe with PGN (Watt and Marcus Citation1969). In addition, the CGN concentrations used (up to 5% in diet) were orders of magnitude greater than some typical concentrations used as a food additive (0.03 – 2%). A viscosity specification of 5 cps (75°, 1.5% solution), which is representative of a Mw of 100,000 Da., has been adopted by various compendia to ensure the safety of carrageenan and to further differentiate it from poligeenan. Volumes of scientific studies support the safety of CGN (see McKim 2014, Weiner Citation2014 for reviews). PGN is no longer used as an anti-peptic and has never been used as a food additive. Today, its uses are limited to medical imaging procedures as previously described.
Poligeenan absorption and distribution
It has been well documented that increased intestinal permeability is significantly increased in patients with Crohn's disease (Pearson et al. Citation1982; Hollander et al. Citation1986); therefore, studies to assess the potential for PGN to increase intestinal permeability, as well as, to induce colitis have been conducted. The results of these studies support this hypothesis. In one study rats were exposed to 2% solutions of ι-PGN, κ-PGN and λ-PGN in their drinking water for 2 to 4 weeks. Urinary and fecal recoveries of orally-administered phenol red dye, as an indicator of intestinal permeability, were assessed (Shiau and Chang Citation1981). Analysis showed that the urinary recovery of the phenol red increased significantly in rats that were given ι-PGN. Rats given κ-PGN and λ-PGN also had increased phenol red in their urine compared to controls, but at lower levels than the rats provided with ι-PGN. This increase in intestinal permeability was also observed in rats and Guinea pigs exposed to 5% ι-PGN in drinking water for 5 months and 6 weeks, respectively (Delahunty, Recher, and Hollander Citation1987). The authors found that exposure to ι-PGN led to increased intestinal permeability of PEG-900 in Guinea pigs and also caused substantial ulceration of the caecum. Interestingly, the rats also showed increased intestinal permeability of PEG-900 in the absence of observable histological changes in the intestines. These data suggest that PGN may alter the absorption of macromolecules by disrupting the intestinal epithelium of the GI tract.
There are indications that even though the weight average molecular weight (Mw) of PGN is high (10,000 to 20,000 Da.) relative to small molecule drugs (400-600 Da.) or nutrient molecules, this material can be absorbed into the body through the intestinal epithelium. Guinea pigs were injected intravenously with increasing doses of PGN ranging from 2.5 mg/kg to 15 mg/kg, and exposed to 1% PGN in drinking water. Eighteen hours after exposure, the level of PGN in the urine increased with dose in drinking water, indicating no renal barrier to its excretion (compared to the intravenous data) and demonstrating intestinal absorption (Anderson and Soman Citation1966). In addition, a single dose administration of 3 g/kg of PGN into the stomachs of baboons resulted in 3–6 mg/kg being excreted in the urine over 24 hour period, again indicating intestinal absorption of PGN, albeit in very small quantities (Beattie et al. Citation1970). In another study in which Rhesus monkeys, rats and guinea pigs were administered either d-CGN (0.5, 1, 2 or 5% in drinking water) or 1% CGN in drinking water for 10–14 weeks it was clear that PGN, but not CGN was absorbed from the gut. In this study, the livers of all animals that ingested PGN showed enlarged and vacuolated reticuloendothelial cells engorged with PGN. In addition, Kupffer cells had fibrillary material located in cellular vesicles that exhibited altered functional characteristics, evidenced by the failure of lysosomes to take up horseradish peroxidase (Abraham and Golberg Citation1972). These Kupffer cell effects were also associated with hepatocellular damage in rats and Guinea pigs, however this finding was not observed in the Rhesus monkeys, suggesting that species differences are an important factor in PGN toxicity. Watt and Marcus (Citation1971) also observed similar effects on liver Kupffer cells in Guinea pigs that were administered 5% PGN in drinking water.
In contrast, Anderson and Soman (Citation1966) administered Guinea pigs 1% λ-CGN in their drinking water and found no detectable levels of λ-CGN in the urine, indicating that CGN is not absorbed across the intestinal epithelium. These results were confirmed in Rhesus monkeys, rats and Guinea pigs, with no intestinal absorption or retention of CGN observed after lengthy exposure in the diet (Abraham and Coulston Citation1979). In addition, Abraham and Golberg (Citation1972) saw no histological effects on hepatic reticuloendothelial cells or Kupffer cells in Rhesus monkeys, rats or Guinea pigs fed 1% CGN in diet, which is likely due to the much higher Mw of CGN compared to PGN. Further, in vitro studies using human pepsin and trypsin enzymes showed that in the presence of CGN, casein digestion by pepsin and trypsin enzymes is initially slowed, but overall the digestion is complete (Anderson and Baillie Citation1967; Stanley Citation1982).
Finally, humans with ulcerative colitis have increased fecal bile acid concentrations, and decreased concentrations of fecal bile acid metabolites, suggesting that bile acid metabolism may play a role in ulcerative colitis, or, at least, is a result of the disease. Rabbits fed 1% λ-PGN in their drinking water to induce GI lesions showed the same fecal increase in bile acids and decreases in fecal bile acid metabolites (Hiki Citation1996) suggesting that altered fecal bile acid metabolism may also be closely linked to ulcerative colitis. These results support the currently-held position that CGN is safe for human consumption; is not readily absorbed via the GI tract, and does not affect digestion, particularly at the low levels in diet (2% or less) used in the food industry.
Poligeenan Induces gastrointestinal lesions
Early work on the induction of GI inflammation, lesions and ulcers had historically been induced by using cholinergic and adrenergic drugs, histamine injections, and administration of lysozymes, among other methods (Kirsner Citation1961; Lambelin Citation1966). However, the work of Watt and Marcus in 1969 was the first to show that Guinea pigs given high doses of PGN developed caecal and large bowel ulcerations. This publication opened the door to decades of research into the induction of GI lesions by PGN (summarized in ). Watt and Marcus (Citation1971) furthered their earlier work by administering 5% PGN to guinea pigs in their drinking water for 20–45 days. Following the exposure period, they observed occult blood in the feces and ulcerative lesions in the caecum, colon, and rectum in 100% of the animals receiving PGN by day 30. The ulcerogenic effects of PGN were confirmed in Guinea pigs, monkeys, rats, and mice (Benitz et al. Citation1972; Fabian et al. Citation1973; Grasso et al. Citation1973; Abraham and Coulston Citation1979; Dworkin et al. Citation1982). In contrast to PGN administration, Abraham and Coulston (Citation1979) found that animals exposed to high concentrations CGN in the water and diet (1-5%, respectively) long term exhibited no adverse effects on growth or behavior, and an evaluation of the GI tracts showed no differences from control animals. These results were also reported in other species including monkeys (concentration and route of administration not provided), rats (5% CGN in diet) and Guinea pigs (1% CGN in drinking water).
The ulcerogenic potential of PGN is dose-, and time-sensitive. Guinea pigs exposed to 2–3% PGN in their water had more severe and extensive ulceration than animals given 1% (Marcus et al. Citation1989; Anver and Cohen Citation1976). By utilizing a dose-response and a time-course approach, Marcus et al. (Citation1989) showed that the sequence of ulceration along the large bowel begins in the caecum and extends into the ascending colon, transverse colon, distal colon, and finally, to the rectum. These results supported earlier work that showed that the primary location of ulceration observed in PGN-induced colitis is the caecum; however, the effects could be readily observed in the colon when the caecum was surgically bypassed (Olsen, Kirkegaard, and Poulsen Citation1983). This dose-relationship was further supported by Grasso et al. (Citation1975) who provided rats with drinking water that contained low levels of PGN (0.25% and 0.5%). They noticed that GI lesions did not occur when the exposure period was limited to 3–12 weeks. However, when the exposure time was significantly lengthened to 6 months, 0.5% PGN in drinking water of rats resulted in observable lesions in the distal colon (Fabian et al. Citation1973). Additionally, a study of rabbits conducted by Watt and Marcus (Citation1970) showed that 100% of rabbits orally administered 1% PGN for 3 months developed lesions, while only 50% of the rabbits orally administered 0.1% PGN for 3 months developed lesions. These results suggest that prolonged contact with or exposure to PGN at adequate concentrations is required for the ulcerogenic effects to occur. However, removal of PGN from the drinking water of Guinea pigs resulted in complete recovery 8 weeks after treatment (Grasso et al. Citation1975). The differences in severity of effects and recovery between these studies indicate a species-specific effect, as well as, a dose- and time-sensitive relationship.
Analysis of the early events of PGN-induced colitis to discern precisely how these lesions develop has not resulted in definitive conclusions. As shown above, PGN exposure can result in lesions in the GI epithelia and mucous layers. These lesions were not located solely within the epithelia. Eisenach, Conklin, and Christensen (Citation1988) exposed Guinea pigs to 2% PGN in their drinking water while eating an ascorbate-depleted diet for six weeks to produce GI lesions. Predictably, the lesions were readily apparent after the completion of 6 weeks. The authors noticed morphological changes in the plexus submucosus extremus (PSE), a plexus of neurites that branch from the myenteric plexus and perforate smooth muscle fibers of the GI wall, combined with interstitial cells of Cajal (ICCs), which act as pacemakers. The PSE has a primary role in the generation of colonic slow waves, affecting motility. Eisenach, Conklin, and Christensen (Citation1988) discovered that PGN not only induced lesions in Guinea pigs, but also caused degeneration of the ICCs in the PSE. These results suggest that the effects of PGN on the GI tract are much more hazardous and widespread than the induction of epithelial cell lesions.
On a smaller scale, rabbits provided 1% PGN in drinking water for up to nine weeks showed substantial increases in mucosal ulcers that increased in number and severity with increasing exposure times. Histological examination of the caecum and colon showed a reduction in mucin and a substantial reduction in the proportion of O-acylated sialic acids, compared to control animals, as well as a loss of the normal patterning (Al Suhail et al. Citation1979, Al Suhail et al. Citation1984a). O-acylated sialic acids are an important component of the mucous layer that provide lubrication and protection to the GI epithelium, the loss of which is known to occur in ulcerative colitis in humans (Reid et al. Citation1984). In addition to the reduction of O-acylated sialic acids and loss of patterning in the caecum and colon, Al Suhail et al. (Citation1979, Citation1984a) found the cells at the margins of the ulcers had no analyzable O-acylated sialic acids present and the percentage of O-acylated sialic acids present in the caecum was decreased. The authors theorized that since the glycoproteins present in the protective mucous layer are degraded by certain bacteria; under normal conditions there is a steady state of glycoprotein secretion and degradation, and that interference with the synthesis of O-acylated sialic acids alters the steady state making the mucous more susceptible to bacterial degradation, and elimination of the protective mucous barrier. Upon cessation of PGN exposure in the diet, GI healing occurred along with the increase in O-acylated sialic acids (Al Suhail et al. Citation1984b), though this phase did not last long and the ulcers worsened while O-acylated sialic acid levels decreased again. This could have been due to a number of factors, such as the role of gut bacteria preventing the return to the steady state; the induction of the immunological processes; or other cellular factors, such as organelle injury in the epithelia cells observed in PGN-induced lesions (Moyana and Lalonde Citation1991a), which could prevent efficient cellular division and affect the healing processes. The apparent importance of sialic acids in the prevention of ulcerative lesions in the gut has been corroborated. Jensen et al. (Citation1983) showed that the drug salazosulphapyrimidine (a constituent of sulphapyridine and 5-aminosalicylic acid) had a protective effect against PGN-induced lesions in Guinea pigs, though a slow release of 5-aminosalicylic acid alone did not. Similar prophylactic results were obtained with 5-aminosalicylic acid treatments when conjugated to bile acids or aryl aldehydes in order to prevent the absorption of 5-aminosalicylic acid in the small intestine, allowing it to be released in the caecum/large intestine, improving its pharmacological profile (Goto et al. Citation2001; Jaysekhar, Rao, and Santhakumari Citation2004).
The protective effects of 5-aminosalicylic acids on PGN-induced lesions appear partially due to the reduction of free radical formation. Free radicals have been shown to play a role in inflammatory gut injury (Itoh and Guth Citation1985; Grisham and Granger Citation1988). Interestingly, the addition of the free radical scavengers allopurinol (an inhibitor of xanthine oxidase, an enzyme known to generate superoxide radicals), superoxide dismutase and dimethyl sulfoxide (a hydroxy radical scavenger) resulted in a significant reduction of PGN-induced lesions in rats (Moyana and Lalonde Citation1990b; Moyana and Lalonde Citation1991b). This relationship with the inflammatory process and the production of free radicals in inducing PGN-mediated ulcerative colitis was further supported when steroids (prednisone) and superoxide dismutase both reduced inflammation and lesions in rats administered 1.5% PGN in their drinking water. Prednisone was less efficacious than the superoxide dismutase, suggesting that free radical formation and the inflammatory processes both play a role, albeit differing roles, in PGN-induced ulcerative colitis.
Immune response in poligeenan-induced lesions
The GI system plays a key role in immunoregulation and homeostasis. In fact, approximately 70% of the entire immune system is located in the GI tract and the lamina propria contains ∼80% of the cells responsible for IgA antibody production (Weiner Citation2000; Faria and Weiner Citation2005). Because ulcerative colitis in humans is an inflammatory disease, and PGN ingestion in animal models creates a similar inflammatory syndrome to that observed in humans, it makes sense that the immune system plays a key role in the pathogenesis of PGN-induced lesions. Shortly after the discovery that PGN could induce GI lesions, histopathological analysis was performed on PGN-induced colitis to assess the role of the immune system. One of the very first studies showed that Rhesus monkeys, rats, and Guinea pigs fed 0.5%, 1% or 2% PGN in their diets for 7–14 weeks developed mucosal ulcerations with infiltration of macrophages and polymorphonuclear cells (PMNs) into the lamina propria; whereas animals fed CGN showed none of these physiological changes (Benitz et al. Citation1972). Other studies in Guinea pigs, rabbits, and mice showed a distinct role of the immune system in the formation of PGN-induced ulcers, in particular, the infiltration of PMNs into the site of the lesions and the uptake of PGN by macrophages, resulting in a release of lysosomal enzymes, further damaging the surrounding tissue (Grasso et al. Citation1973; Abraham and Mankes Citation1975; Kitano Citation1979; Olsen and Poulsen Citation1980). Interestingly, intraperitoneal injections of 0.5mg/day hydrocortisone inhibited lesion development in Guinea pigs exposed to 10% PGN in their drinking water for 10 days (Fath et al. Citation1984). The authors suggested the anti-inflammatory properties of hydrocortisone could stabilize the macrophage lysosomes, though it is possible hydrocortisone is abrogating the inflammatory response by its typical mechanisms: namely, reducing upregulation of inflammatory genes by reversing histone acetylation of those genes through binding of glucocorticoid receptors to coactivators and recruitment of histone deacetylase-2 to the activated transcription complex. Whitehill et al. (Citation1980) assessed the ulcerogenic potential of PGN in Guinea pigs that were either T-lymphocyte depleted via anti-thymocyte serum, subsequent to neonatal thymectomy, or B-lymphocyte depleted via cyclophosphamide. The results showed that when Guinea pigs with depleted T-lymphocytes ingested PGN (the method of ingestion was not provided), there was no change in the course of ulcer development. Contrary to this, when the Guinea pigs with depleted B – lymphocytes were fed PGN, there was a marked acceleration of ulcer formation in the caecum and small intestine. Taken together, these results indicate a definite role of the immune system in the pathogenesis of PGN-induced lesions.
Pre-sensitization of rats with subcutaneous injections of PGN resulted in more severe and increased incidence of lesions after exposure to orally-administered PGN (Moyana and Lalonde Citation1990a) also suggesting PGN effects on the immune response. Further evidence for the role of the immune system was identified by the increase in biomarkers of the inflammatory process in response to PGN. Guinea pigs exposed to 3% PGN in their drinking water for up to 28 days not only displayed the typical histopathological lesions in the caecum and macrophage infiltration in the lamina propria, but also significantly elevated levels of prostaglandin E2 at 2, 4 and 28 days, and elevated levels of leukotriene B4 at day 28 (Marcus et al. Citation1990). These results suggest that prostaglandin E2 is directly involved in the initiation of inflammation in response to PGN, and leukotriene B4 is involved in maintaining the inflammatory response. Song, Kim, and Kim (Citation1992) came to similar conclusions with prostaglandin E2 in Guinea pigs administered 1.5% PGN for 40 days in their drinking water. Interestingly, they also assessed 1.5% CGN in drinking water in Guinea pigs for 40 days and found no GI lesions, no increase in prostaglandin E2, and a decrease in leukotriene B4. In addition, ingestion of 25 – 50 mg/kg of D-002 (a mixture of aliphatic primary alcohols with known anti-inflammatory, and anti-ulcer properties), reduced neutrophil and macrophage infiltration in the pre-ulcerative phase of Guinea pigs fed 3% PGN for 3 days in their drinking water (Noa and Mas Citation1998), demonstrating that D-002 is a very potent inhibitor of ulceration in this model.
Macrophage infiltration is not the only immune response to PGN. Rats were administered either 5% PGN (10,000 Da.) in their drinking water or 5% d-CGN (PGN 40,000 Da.) in their drinking water for 55 days. The results showed both the higher and lower Mw compounds resulted in substantial lesions and an increase in myeloperoxidase, and infiltration of neutrophils (Benard et al. Citation2010). Benard et al. (Citation2010) also assessed the effects of PGN on inflammatory signaling of peripheral blood monocytes (PBMs) in vitro. The authors exposed THP1 (human peripheral blood monocyte) cells to various concentrations, up to 1.0 mg/mL of either 10,000 Da. PGN or 40,000 Da. d-CGN (PGN) for 72 hours. The results showed a significant dose-dependent increase in TNFα released (between a 60- and a 250-fold increase versus control) with both forms of PGN, as well as increases in Intercellular Adhesion Molecule 1 (ICAM1) and induction of IκB degradation, resulting in an increase in the pro-inflammatory molecule NFκB. These data suggest that PGN can induce inflammation resulting in macrophage and neutrophil infiltration, and can also directly activate monocytes, furthering the inflammatory process.
Early work with PGN and CGN suggested that PGN and, potentially CGN, possessed the ability to suppress delayed hypersensitivity. Researchers attempted to identify a molecular mechanism for this immunosuppression. CGN was selectively cytotoxic to macrophages in vitro (Allison, Harrington, and Birbeck Citation1966; Cantazaro, Schwartz, and Graham Citation1971), but had no effect on the viability of lymphocytes (Cantazaro, Schwartz, and Graham Citation1971). It was thought that selective cytotoxicity of macrophages could lead to the immunosuppressive effects of CGN. Guinea pigs and rats that were administered CGN via intraperitoneal injections (100 or 300 mg in Guinea pigs and 0.5 mg in rats) showed selective macrophage cytotoxicity (Sawicki and Cantazaro Citation1975; Thomson et al. Citation1976), supporting this hypothesis. In rats, intraperitoneal injection of 2.5 mg CGN every 2 days for a week, followed by intraperitoneal injection of antigens (lipopolysaccharide [LPS] or sheep red blood cells [SRBC]) resulted in decreased immune response to LPS (∼90% inhibited) and SRBC (∼20% inhibited) as assessed by anti-LPS and anti-SRBC plaque forming cells in the spleen (Janezic, Mostarcia-Stojkovic, and Lukic Citation1979).
While these studies showed an immunosuppressant effect of CGN, they were conducted using intraperitoneal injections, which are not relevant to oral exposure of the high Mw CGN in food. In order to assess the potential immunosuppressive effects of CGN via oral ingestion, rats were provided either distilled water or CGN at 0.1 mg/mL or 1.0 mg/mL for 61–85 days. The animals were sacrificed and cells harvested from the spleen, peripheral lymph node and mesenteric lymph node. These cells were assessed for their responses to the T-cell mitogen phytohaemagglutinin (PHA). The low doses of CGN inhibited T-cell proliferation in both the lymph node and splenic cultures, in the presence of PHA more so than the high doses of CGN. However, the suppression was mitigated in splenic cultures by removal of the macrophages prior to mitogen stimulation (Bash and Vago Citation1980). This work was supported by Cochran and Baxter (Citation1984) who showed that in rats, orally ingested CGN suppresses the T lymphocyte proliferation in the spleen cultures of sacrificed rats in response to phytohaemagglutinin (PHA) and concanavalin A (Con A). It is interesting to note that this immunosuppressive effect was greatest at the lower doses in both studies. Cochran and Baxter (Citation1984) postulate that this biphasic response is due to low doses of CGN stimulating a population of suppressor macrophages that actively suppress T lymphocyte proliferation, while higher doses abolish suppressor activity via cytotoxicity. These claims by the authors have not been confirmed to our knowledge.
Similar results have also been shown in studies that point to a potential role of nitric oxide (Madhère et al. Citation1994; Pricolo et al. Citation1996). Both publications state that CGN was used; however, they both cite the publication by Moyana and Lelonde (Citation1990a) for CGN preparation in their Materials and Methods. Interestingly, Moyana and Lelonde (Citation1990a) used PGN (technically “degraded carrageenan”), so it must be assumed that both Madhère et al. (Citation1994) and Pricolo et al. (Citation1996) also used PGN in their studies and not CGN. This further illustrates the confusion in the literature over the use of the term, PGN vs actual CGN and brings into question the results described by Bash and Vago (Citation1980) and Cochran and Baxter (Citation1984). These studies with CGN were primarily performed with CGN prepared in drinking water, which is not directly applicable to dietary exposure where CGN is tightly bound to food protein. According to the available studies, PGN appears to produce immunotoxicity and/or immunosuppression while there is no experimental evidence that dietary exposure to CGN can produce any adverse effects on the immune system.
Poligeenan and carcinogenesis
In addition to the ulcerogenic potential of PGN, numerous studies have identified a potential carcinogenic effect as well. This line or research is not entirely surprising given that patients with colitis/Crohn's disease have a much higher rate of colon or bowel cancer (Blackstone Citation1981) and that PGN can induce GI lesions very similar to those observed in patients with colitis/Crohn's disease. Watt and Marcus (Citation1970) were the first to identify intestinal hyperplasia in response to PGN. The authors divided rabbits into a control group that received normal drinking water; a group that received 0.1% PGN in drinking water, and a third group that received 1% PGN in drinking water. After 3 months, all of the rabbits that received 1% PGN in drinking water had the typical ulcerative colitis response (mucosal lesions, fecal blood occult) and half of those also showed evidence of mucosal hyperplasia. The hyperplasia presented as thickening of the mucosal layer along with two types of polypoidal formations: pseudopolyps located mostly at the margins of the lesions, and glandular polyps. The epithelia at the glandular polyps were multilayered and exhibited a 2- to 3-fold increase in mitotic activity, compared to the rabbits receiving normal drinking water. These mucosal effects were not observed with the rabbits that ingested 0.1% PGN, though small pseudopolyps were observed on the margins of some lesions. These data suggest that ingestion of 1% PGN in drinking water is sufficient to induce mucosal lesions and mucosal hyperplasia in rabbits. These results were confirmed in rabbits that were initially sensitized with PGN by subcutaneous injection, followed by oral administration of 1% PGN in drinking water for 12 or 28 months (Kitano et al. Citation1986). After 12 months, there were severe epithelial lesions in the large intestine and the mucosa was atrophied (Kitano et al. Citation1986). After 28 months, there was significant epithelia dysplasia accompanying the color-rectal lesions, and there were atypical glandular ducts resembling carcinomas in some animals. Both the Watt and Marcus (Citation1970) and Kitano et al. (Citation1986) studies suggest inflammatory cell infiltration and prolonged mucosal inflammation as an underlying cause.
In addition to inducing epithelia hyperplasia in rabbits, PGN has been shown to induce colorectal tumors in rats. Wakabayashi et al. (Citation1979) showed that prolonged consumption of PGN in food or drinking water for up to 24 months can induce metastatic colorectal tumors. The authors posit that the effects of PGN exposure are first formation of ulcerative mucosal lesions, followed by squamous metaplasia, and finally tumors. This disease progression model is supported in studies done by Ishioka and Kuwabara (Citation1986). The tumorigenic capability of PGN was also demonstrated by Oohashi et al. (Citation1981). In this study, rats administered PGN for a short-period in diet or drinking water, followed by a period of no exposure to PGN, still developed colorectal tumors.
In a study designed to assess whether PGN is a tumor promoter, mice were first given azoxymethane (10 mg/kg injected intraperitoneally), a genotoxic colonic carcinogen that gives rise to colon adenomas or carcinomas, and then PGN (2% in drinking water). This regimen did not lead to an increase in tumor formation in mice that received both treatments compared to mice that received azoxymethane alone. These data would indicate that, PGN is not a tumor promoter in mice (Hata et al. Citation2006). However, it must be noted that the PGN administration in drinking water was only for 2 weeks. These studies suggest that PGN is not necessarily a tumor promoter, even though tumors appear to result from long term exposure.
In contrast, CGN has been shown to inhibit the growth of syngeneic adenocarcinomas tumors in C3H mice (Thomson and Fowler Citation1977). CGN has also been shown to induce apoptotic cell death in human colon cancer cells in vitro (Raman and Doble Citation2015). Additionally, CGN has been shown to lack carcinogenic potential in chronic feeding studies in rats and hamsters (Rustia, Shubik, and Patil Citation1980). Although it remains unclear why PGN is tumorigenic, CGN is clearly not carcinogenic/tumorigenic in animal oncogenicity studies (IARC Citation1983) and not a tumor promoter (Weiner Citation2014); these data further strengthen the FDAs findings of the safety of carrageenan in humans.
Role of gut bacteria in carrageenan/poligeenan induced lesions
The gut microflora plays a very important role in the digestion of and breakdown of dietary polysaccharides and certain regions of the large intestine harbor extremely dense bacterial communities; however, only a few species, including various species in the Bacteroides genus, are capable of breaking down insoluble substrates (reviewed by Flint et al. Citation2008). Researchers sought to determine the role of the gut microflora in the formation of PGN-induced lesions. Early studies by Onderdonk and Bartlett (Citation1979) found that germ-free Guinea pigs drinking water with 5% PGN exhibited a lack of colonic inflammation, though the exposure was only for 14 days, while the normal Guinea pigs developed typical lesions after PGN dosed the same way. It was later discovered that one species of Bacteroides, B. vulgatus, found in Guinea pigs, was capable of contributing to GI ulcerations in the absence of other microflora when the Guinea pigs were fed 5% PGN in drinking water (Onderdonk, Franklin, and Cisneros Citation1981). Further study on B. vulgatus showed that Guinea pigs that were immunized with dead bacteria, then fed both PGN and viable bacteria for 30 days sustained more inflammation in the GI tract and suffered more severe lesions in the caecum and large intestine than the non-immunized Guinea pigs, and that the severity of the disease was influenced by the duration of the immunization (Onderdonk, Cisneros and Bronson Citation1983; Oestreicher et al. Citation1986). Additionally, it was determined that certain bacterial membrane antigens (lipopolysaccharide) of B. vulgatus were responsible for the increased colitis induced by PGN (Breeling et al. Citation1988). Based on this evidence, it was thought that the gut microflora play a critical role in PGN-induced ulcerative lesions and, potentially, in human ulcerative colitis.
Contradictory to this hypothesis, Axelsson and Midtvedt (Citation1997) showed that 2.5% PGN in drinking water was sufficient to induce inflammation and lesions in the GI tract of germ-free mice, these results are seemingly contradictory to the work by Onderdonk and Bartlett (Citation1979), however; it is possible that the microflora do not play an important role in PGN-induced ulcerogenesis, or that there are distinct species-specific differences in ulcerogenesis (Guinea pigs versus mice).
Calarini de Bustos et al. (Citation1987) showed that 5% PGN in drinking water induces lesions in Guinea pigs, whereas 5% CGN co-administered with either bovine colostrum or Lactobacillus acidophilus in drinking water do not produce lesions in the Guinea pig GI tract. The authors suggested a number of potential reasons for their results: an optimized ecological condition due to colostrum or Lactobacillus treatment; an improvement in the mucosal barrier due to colostrum or Lactobacillus treatment; or a modulation of the inflammatory reactivity due to colostrum or Lactobacillus treatment. The authors never discussed the possibility that PGN complexed with the added proteins to effectively reduce the active concentration of the PGN, or the fact that PGN and CGN are two different molecules, by molecular weight and physiochemical properties, and that those properties could have played a role in the differences observed. These results with CGN were also observed in earlier studies where Corpet (Citation1984) observed that CGN decreased gut microflora and bacterial enzymatic activities, without producing lesions; whereas PGN exposure caused lesions with increased intestinal bacteria and enzymatic activities, evidenced by increased fecal metabolites of PGN. This effect of CGN on gut bacteria was supported by Mallet et al. (Citation1985) who also showed CGN decreased bacterial numbers and lowered enzyme activities. Regardless of their effects on gut microflora, these studies confirm that PGN can induce GI lesions, while CGN does not.
Effects of other sulfonated molecules similar to poligeenan
Effects similar to those described here for PGN have been observed with other sulfated polysaccharides, primarily dextran sodium sulfate (DSS). DSS is a heparin-like polysaccharide consisting of anhydro-D-glucose (α-1,6-glucosidic link) that is ∼17% sulfated (Ricketts Citation1952). The weight average molecular weight (Mw) for DSS is 20,000 – 50,000 Da. Okayasu et al. (Citation1990) discovered that DSS induced lesions in a manner similar to human ulcerative colitis after 6–10 days of ingestion of 3–10% DSS in drinking water in mice. Similar to chronic PGN ingestion, the intestinal microflora was increased and DSS appeared to be phagocytized by macrophages in the colonic mucosa. Administration of DSS in drinking water also resulted in the induction of a reproducible pro-inflammatory response, limited to the colon and characterized by lesions, loss of crypts, and infiltration of granulocytes, similar to PGN administration (Okayasu et al. Citation1990; Cooper et al. Citation1993). In addition, mice administered a single dose of azoxymethane, followed by induction of ulcerative lesions by DSS, exhibit elevated incidences of colorectal cancer (Tanaka et al. Citation2003). These results appear to be in response only to low molecular weight (≤50,000 Da.) sulfated polysaccharides with a high percentage of sulfate groups (Hirono et al. Citation1983; Axelsson et al. Citation1996; Axelsson and Midtvedt Citation1997). In the studies by Hirono et al. (Citation1983) and Axelsson and Midtvedt (Citation1997), the inflammatory activity and lesions produced in the colon were augmented with increasing molecular weights of DSS (at 54,000 Da. and 520,000 Da. in Hirono et al. (Citation1983); and molecular weights of 3,700, 11,300, 25,600, 177,000 and 500,000 Da. in Axelsson and Midtvedt (Citation1997). Axelsson and Midtvedt (Citation1997) also showed that a high degree of sulfation (>16.6%) was crucial for DSS- and PGN-induced colitis in mice, since PGN with a lower sulfate content (10.5%) did not induce lesions.
DSS and PGN are not the only low molecular weight (≤50,000 Da.) sulfated polysaccharides that result in similar toxicological effects. In fact, similar observations have been made with amylopectin sulfate, a branched polysaccharide with α-1,6 and α-1,4-glucosidic links, which has been shown to induce lesions, but not induce tumor formation, in rats (Ishioka and Kuwabara Citation1986). It is interesting that the authors noted that amylopectin sulfate was larger in Mw (specific details not provided) than the PGN and DSS used in the study, considering all three induced lesions, but only DSS and PGN ingestion resulted in squamous cell carcinomas and adenocarcinomas. These data indicate that the effects described in this review are not unique to PGN, but are more likely common effects observed with regular ingestion of high concentrations of low molecular weight (≤50,000 Da.) sulfated polysaccharides.
It is important to emphasize that PGN is not CGN and that PGN is not formed in the intestinal tract of animals or humans ().
Figure 7. Molecular Weight (Mw) Profile of CGN, poligeenan (PGN) and d-CGN Mw definitions included (Concentration versus Log Mw). The graph above depicts the molecular weight profile of a sample of food grade carrageenan (CGN). Note that poligeenan (PGN) and degraded CGN are not part of the CGN profile. Figure used with permission from Blakemore et al. (Citation2014a) and modified.
Conclusion
PGN is a low molecular weight sulfated polygalactan (Mw = 10,000 – 20,000 Da.) produced by extreme, non-physiological acid hydrolysis (pH of 0.9–1.3) and non-physiological temperatures >80°C for several hours) of the food additive CGN. PGN is not used as a food additive in any way. In fact, though it was once used decades ago as an anti-peptic pharmaceutical agent, its use today is limited to medical imaging. Food grade CGN is a high molecular weight polymer (Mw = 200,000 – 800,000 Da.) that has been found to be safe for human consumption. Due to confusion in the nomenclature, PGN has often been referred to as “degraded carrageenan,” “carrageenan” or “carrageenan gum” (Munyaka et al. Citation2016) in the literature. This has led to confusion and misidentification of PGN as CGN. This difference in Mw between PGN and CGN is crucial for understanding the differences in functional properties and toxicological profiles, as well as, clearing up the confusion in nomenclature. Additionally, other low molecular weight sulfated polysaccharides, such as amylopectin sulfate and DSS, have been shown to have similar toxicological effects as PGN.
PGN has been shown to induce GI lesions, and tumors, and to induce a severe inflammatory response in the GI tract of most laboratory animals. In addition, PGN has been shown to be absorbed through the GI wall, reaching cells in the liver and being excreted in the urine of animals after prolonged administration. CGN, on the other hand, is not absorbed orally and does not cause GI lesions. CGN has never been shown to be converted to PGN in the GI tract (or anywhere) in vivo. CGN is not carcinogenic, tumorigenic, genotoxic, or a tumor promoter or initiator, or a reproductive toxicant, and has no adverse effects on the immune system. In fact, very preliminary research suggests that there may be some health benefits to consuming CGN. These studies suggest that there may be a link between consumption of CGN and decreased cholesterol and low-density lipoproteins (LDL, the “bad” cholesterol), as well as, increased immune status parameters and a decrease in inflammation biomarkers in human volunteers (Shiau and Huang Citation1998; Panlasigui et al. Citation2003; Sokolova et al. Citation2014). Collectively, these data support the regulatory agencies’ decision that CGN is safe for human consumption. This review will help resolve much of the confusion and misinformation around CGN, showcasing the significant differences between CGN and PGN (i.e. “degraded carrageenan”) that have been propagated in the literature by research groups, organizations and institutions.
Disclosure
Financial support for the preparation of this review was provided by FMC Corporation.
| Abbreviations | ||
| CGN | = | carrageenan is a high molecular weight polydisperse polysaccharide synthesized by certain species of red seaweed and made up of repeating galactose and 3,6-anhydrogalactose units with variable ester sulfate content by degree and location. |
| PGN | = | poligeenan is a low molecular weight polydisperse polysaccharide comprised of repeating galactose and sulfated 3,6-anhydrogalactose units that is produced using CGN as a starting material and subjecting it to extreme pH and heat conditions. |
| d-CGN | = | degraded carrageenan describes low molecular weight molecules derived from chemical degradation of CGN in the laboratory. |
| GI tract | = | Gastrointestinal tract |
| LMT | = | is nomenclature used by the European regulatory authorities to describe the portion of the carrageenan molecular weight profile that is less than 50,000 Da. It is also referred to as Low Molecular Weight Tail. |
| Polydispersity | = | term used to describe molecules, such as PGN or CGN in which the molecule comprises several units of varying size. |
| Mn | = | Number average molecular weight is the total weight of the sample divided by the number of molecules in the sample. Mn is a way of describing the size of a polydisperse molecule. |
| Mw | = | Weight average molecular weight is an average molecular weight value that takes into account polydispersity of a molecule, such as CGN or PGN. |
| MW | = | The molecular weight of a single molecule of a polydisperse sample expressed in Daltons (Da.) |
Acknowledgments
The authors would like to acknowledge Eunice Cuirle, Manager of Global Regulatory Affairs FMC Health and Nutrition business unit of FMC Corporation, for her valuable comments and support.
Additional information
Funding
Related Research Data
References
- Abraham, R., and F. Coulston. 1979. Ulcerative lesions due to carrageenan. Zeitschrift Fur Gastroenterologie 17:S154–58.
- Abraham, R., R. J. Fabian, L. Golberg, and F. Coulston. 1974. Role of lysosomes in carrageenan-induced cecal ulceration. Gastroenterology 67:1169–1181.
- Abraham, R., L. Golberg, and F. Coulston. 1972. Uptake and storage of degraded carrageenan in lysosomes of reticuloendothelial cells of the Rhesus monkey, Macaca Mulatta. Experimental and Molecular Pathology 17:77–93.
- Abraham, R., and L. Golberg. 1972. The Kupffer-cell response to degraded carrageenan. Toxicology and Applied Pharmacology 22:282.
- Abraham, R., and R. Mankes. 1975. Dietary factors influencing carrageenan-induced cecal ulceration in the Guinea pig. Toxicology and Applied Pharmacology 33:148.
- Allison, A. C., J. S. Harrington, and M. Birbeck. 1966. An examination of the cytotoxic effects of silica on macrophages. Journal of Experimental Medicine 124:141–53. doi:10.1084/jem.124.2.141.
- Al-Suhail, A. A., P. E. Reid, C. F. A. Culling, W. L. Dunn, and M. G. Clay. 1984a. Studies of the degraded carrageenan-induced colitis of rabbits. I. Changes in the epithelial glycoprotein O-acetylated sialic acids associated with ulceration. Histochemical Journal 16:543–53. doi:10.1007/BF01041354.
- Al-Suhail, A. A., P. E. Reid, C. F. A. Culling, W. L. Dunn, and M. G. Clay. 1984b. Studies of the degraded carrageenan-induced colitis of rabbits. II. Changes in the epithelial glycoprotein O-acetylated sialic acids associated with the induction and healing phase. Histochemical Journal 16:555–64. doi:10.1007/BF01041355.
- Al-Suhail, A., C. F. A. Culling, P. E. Reid, W. L. Dunn, and M. G. Clay. 1979. Changes in epithelial glycoprotein O-acetylated sialic acids associated with the degraded carrageenan induced colitis of rabbits. Can. Fed. Biol. Sci. 22:56.
- Anderson, W. 1961. The antipeptic activity of sulphated polysaccharides. Journal of Pharmacy and Pharmacology 13:139–47. doi:10.1111/j.2042-7158.1961.tb11804.x.
- Anderson, W., and A. J. Baillie. 1967. Carrageenans and the proteolytic activity of human gastric secretion. Journal of Pharmacy and Pharmacology 19: 720–28.
- Anderson, W., and G. C. Hargreaves. 1965. Gastro-intestinal therapeutic. US Patent 3,175,942, filed March 13, 1962 and issued March 30, 1965.
- Anderson, W., and P. D. Soman. 1967. Degraded and undegraded carrageenans and experimental gastric and duodenal ulceration. Journal of Pharmacy and Pharmacology 19:520–26. doi:10.1111/j.2042-7158.1967.tb09581.x.
- Anderson, W., and P. D. Soman. 1963. Degraded carrageenan and experimental acute gastric ulceration in the Guinea pig. Nature 199:389. doi:10.1038/199389a0.
- Anderson, W., and P. D. Soman. 1965. Degraded carrageenan and duodenal ulceration in Guinea-pig. Nature 206:101–102. doi:10.1038/206101a0.
- Anderson, W., and P. D. Soman. 1966. The absorption of carrageenans. Journal of Pharmacy and Pharmacology 18:825–27. doi:10.1111/j.2042-7158.1966.tb07819.x.
- Anver, M. R., and J. Cohen. 1976. Ulcerative Colitis Induced in Guinea pigs with degraded carrageenan. American Journal of Pathology 84:431–34.
- Axelsson, L. G., and T. Midtvedt. 1997. Sulfation and Mw-optimized carrageenan induces colon inflammation in germfree mice. Gastroenterology 112 (4SUPPL):A925.
- Axelsson, L. G., E. Landström, C. Lundberg, and A. C. Bylund-Fellenius. 1996. The degree of sulfate content and the molecular weight of dextran sulfate and carrageenan are important for the induction of colitis in mice. Gastroenterology 110:A858.
- Bash, J. A., and J. R. Vago. 1980. Carrageenan-induced suppression of T lymphocyte proliferation in the Rat: In vivo suppression induced by oral administration. Journal of the Reticuloendothelial Society 28:213–20.
- Beattie, I. A., W. R. Blakemore, E. T. Dewar, and M. H. Warwick. 1970. A study of orally-administered degraded carrageenan in the baboon. Food and Cosmetics Toxicology 8:257–66. doi:10.1016/S0015-6264(70)80001-3.
- Beattie, I. A., W. R. Blakemore, E. T. Dewar, and M. H. Warwick. 2015. Corrigendum to “A study of orally-administered degraded carrageenan in the baboon”. [ Food Cosmet. Toxicol. 8 (1970) 257-266]. Food and Chemical Toxicology 75:189. doi:10.1016/j.fct.2014.10.012.
- Benard, C., A. Cultrone, C. Michel, C. Rosales, J. P. Segain, M. Lahaye, J. P. Galmiche, C. Cherbut, and H. M. Blottière. 2010. Degraded carrageenan causing colitis in rats induces TNF secretion and ICAM-1 upregulation in monocytes through NF-kB activation. Plos One 5:e8666. doi:10.1371/journal.pone.0008666.
- Benitz, K. F., R. Abraham, L. Golberg, and F. Couldston. 1972. Carrageenan: An ulcerative agent? Toxicology and Applied Pharmacology 22:282.
- Benitz, K. F., L. Golberg, and F. Coulston. 1973. Intestinal effects of carrageenans in the Rhesus monkey. Food and Cosmetics Toxicology 11:565–75.
- Blackstone, M. O. 1981. Dysplasia-associated lesion or mass (DALM) detected by colonoscopy in long standing ulcerative colitis, and indication for colectomy. Gastroenterology 80:366–74.
- Blakemore, W. R. 2015. Polysaccharide Ingredients: Carrageenan. Reference module in food sciences. Elsevier, 1–8. doi:10.1016/B978-0-08-100596-5.03251-0.
- Blakemore, W. R., A. F. Brant, J. G. Bissland, and N. D. Bissland. 2014b. Carrageenan analysis. Part 3: Quantification in swine plasma. Food Additives & Contaminants: Part A: Chemistry, Analysis, Control, Exposure & Risk Assessment 31:1673–77. doi:10.1080/19440049.2014.955538.
- Blakemore, W. R., and A. R. Harpell. 2010. Carrageenan. In Food stabilisers, thickeners and gelling agent, ed. A. Imeson, 73–94. Wiley-Blackwell, Blackwell Publishing Ltd. Published Online.
- Blakemore, W. R., and E. T. Dewar. 1970. Number-average molecular weight of degraded iota-carrageenan. Macromolecular Chemistry and Physics 137:51–59. doi:10.1002/macp.1970.021370107.
- Blakemore, W. R., S. R. Davis, M. M. Hroncich, and M. Vurma. 2014a. Carrageenan analysis. Part 1: Characterisation of the carrageenan test material and stability in swine-adapted infant formula. Food Additives & Contaminants: Part A: Chemistry, Analysis, Control, Exposure & Risk Assessment 31:1673–77. doi:10.1080/19440049.2014.955538.
- Bonfils, S. 1970. Carrageenan and the human gut. Lancet 2:414.
- Breeling, J. L., A. B. Onderdonk, R. L. Cisneros, and D. L. Kasper. 1988. Bacteroides vulgatus outer membrane antigens associated with carrageenan-induced colitis in Guinea pigs. Infection and Immunity 56:1754–1759l.
- Burges-Watson, D. 2008. Public health and carrageenan regulation: a review and analysis. Journal of Applied Phycology 5:503–13.
- Caldarini de Bustos, M. I., E. J. Schiffrin, K. Ogawa de Furuya, D. V. Caccamo, M. I. Ledesma de Paolo, D. Celener, and L. Bustos-Fernández. 1987. Prevention of carrageenan-induced ulcerative colitis in the Guinea pig by serum of bovine colostrum. Medicina (Buenos Aires). 47:273–77.
- Cantazaro, P. J., H. J. Schwartz, and R. C. Graham. 1971. Spectrum and possible mechanisms of carrageenan cytotoxicity. American Journal of Pathology 64:387–99.
- Chen, H., F. Wang, H. Mao, and X. Yan. 2014. Degraded ʎ-carrageenan activates NF-kB and AP-1 pathways in macrophages and enhances LPS-induced TNF-α secretion through AP-1. Biochimica Et Biophysica Acta 1814, 2162–70 doi:10.1016/j.bbagen.2014.03.011.
- Cochran, F. R., and C. S. Baxter. 1984. Macrophage-mediated suppression of T lymphocyte proiliferation induced by oral carrageenan administration. Immunology 53:291–97.
- Commission Directive. 2004. 2004/45/EC of 16 April 2004 amending Directive 96/77/EC laying down specific purity criteria on food additives other than colours and sweeteners. Official Journal of the European Union 47:20 April 2004, L113/19-L113/21.
- Commission Regulation. 2012. 2031/2012 of 9 March, 2012. Official Journal of the European Union 55: L 83/140-141.
- Cooper, H. S., S. N. Murthy, R. S. Shah, and D. J. Sedergran. 1993. Clinicopathologic study of dextran sulfate sodium experimental murine colitis. Laboratory Investigation; A Journal of Technical Methods and Pathology 69:238–49.
- Cornucopia Institute. 2013. Carrageenan: How a “natural” food additive is making US sick. A report by the Cornucopia Institute. March, 2013. www.cornucopia.org.
- Cornucopia Institute. 2016. Carrageenan: New studies reinforce link to inflammation, cancer, and diabetes. Updated report by the Cornucopia Institute. April, 2016. www.cornucopia.org.
- Corpet, D. E. 1984. Toxicological evaluation of carrageenans. 5 – Dietary carrageenans and intestinal microflora. Sciences des Aliments 4:367–74.
- Delahunty, T., L. Recher, and D. Hollander. 1987. Intestinal permeability changes in rodents: A possible mechanism for degraded carrageenan-induced colitis. Food and Chemical Toxicology 25:113–18. doi:10.1016/0278-6915(87)90143-8.
- Department of Health and Human Services. 2012. Citizen petition, food and drug administration, Docket No. FDA-2008-P-0347.
- DeSesso, J. M., and C. F. Jacobson. 2001. Anatomical and physiological parameters affecting gastrointestinal absorption in humans and rats. Food and Chemical Toxicology 39:209–28. doi:10.1016/S0278-6915(00)00136-8.
- Dewar, E. T., and M. L. Maddy. 1970. Faecal excretion of degraded and native carrageenan by the young rat. Journal of Pharmacy and Pharmacology 22:791–93. doi:10.1111/j.2042-7158.1970.tb08437.x.
- Dworkin, B. M., E. E. Deschner, R. B. Fath Jr., and S. J. Winawer. 1982. Degraded carrageenan as a model for acute right-sided colitis in mice. Gastroenterology 82:1048.
- Eisenach, J. B., J. Conklin, and J. Christensen. 1988. Damage to interstitial cells of cajal in carrageenan-induced colitis in Guinea pig. Gastroenterology 94 (5 Part 2):A111.
- European Commission. 2003. Health and Consumer Protection Directorate-General, Opinion of the Scientific Committee on food on Carrageenan, SCF/CS/ADD/EMU/199 Final.
- Evans, P. R. C., S. Nowell, and I. A. P. Thomas. 1965. Blind trial of a degraded carrageenan and aluminum hydroxide gel in the treatment peptic ulceration. Postgraduate Medical Journal 41:48–25. doi:10.1136/pgmj.41.471.48.
- Fabian, R. J., R. Abraham, F. Coulston, and L. Goldberg. 1973. Carrageenan-induced squamous metaplasia of the rectal mucosa in the rat. Gastroenterology 65:264–76.
- Faria, A. M., and H. L. Weiner. 2005. Oral tolerance. Immunological Reviews 206:232–59. doi:10.1111/j.0105-2896.2005.00280.x.
- Fath Jr., R. B., E. E. Deschner, S. J. Winawer, and B. M. Dworkin. 1984. Degraded carrageenan-induced colitis in CF1 mice. A clinical, histopathological and kinetic analysis. Digestion 29:197–203. doi:10.1159/000199033.
- Flint, H. J., E. A. Bayer, M. T. Rincon, R. Lamed, and B. A. White. 2008. Polysaccharide utilization by gut bacteria: Potential for new insights from genomic analysis. Nature Reviews 6:121–31.
- Food and Agriculture Organization of the United Nations. 2007. Combined Compendium of Food Additive Specifications; CGN – 68th session of JECFA, 2007.
- Food Chemicals Codex. 2013. FCC monographs, 8th ed., 219–28. Washington, D.C. : National Academy Press.
- Goto, M., Y. Okamoto, M. Yamamoto, and H. Aki. 2001. Anti-inflammatory effects of 5-aminosalicylic acid conjugates with chenodeoxycholic acid and ursodeoxycholic acid on carrageenan-induced colitis in Guinea pigs. Journal of Pharmacy and Pharmacology 53:1711–20. doi:10.1211/0022357011778115.
- Grasso, P., M. Sharratt, F. M. B. Carpanini, and S. D. Gangolli. 1973. Studies on carrageenan and large-bowel ulceration in mammals. Food and Cosmetics Toxicology 11:555–64. doi:10.1016/S0015-6264(73)80326-8.
- Grasso, P., S. D. Gangolli, K. R. Butterworth, and M. G. Wright. 1975. Studies on degraded carrageenan in rats and Guinea pigs. Food and Cosmetics Toxicology 13:195–201. doi:10.1016/S0015-6264(75)80004-6.
- Grisham, M. B., and D. N. Granger. 1988. Neutrophil-mediated mucosal injury. Role of reactive oxygen metabolites. Digestive Diseases and Sciences (suppl). 33:6–15. doi:10.1007/BF01538126.
- Hata, K., T. Tanaka, H. Kohno, R. Suzuki, S. H. Qiang, T. Kuno, Y. Hirose, A. Hara, and H. Mori. 2006. Lack of enhancing effects of degraded λ-carrageenan on the development of β-catenin-accumulated crypts in male DBA/2J mice initiated with azoxymethane. Cancer Letters 238:69–75. doi:10.1016/j.canlet.2005.06.016.
- Heineken, T. S. 1961. Carrageenan in the management of peptic ulcer. A preliminary report. The American Journal of Gastroenterology 35:619–21.
- Hiki, M. 1996. Fecal bile acid metabolites in patients with ulcerative colitis and in rabbits with carrageenan-induced experimental colitis. Journal of the Osaka City Medical Center 45:167–85.
- Hirono, I., Y. Sumi, K. Kuhara, and M. Miyakawa. 1981. Effect of degraded carrageenan on the intestine in germfree rats. Toxicology Letters 8:207–212.
- Hirono, I., K. Kuhara, T. Yamaji, S. Hosaka, and L. Golberg. 1983. Carcinogenicity of dextran sulfate sodium in relation to its molecular weight. Cancer Letters 18:29–34. doi:10.1016/0304-3835(83)90114-3.
- Hollander, D., C. M. Vadheim, E. Brettholz, G. M. Petersen, T. Delahunty, and J. I. Rotter. 1986. Increased intestinal permeability in patients with Crohn's Disease and their relatives: A possible etiologic factor. Annals of Internal Medicine 105:883–85. doi:10.7326/0003-4819-105-6-883.
- IARC: International Agency for Research on Cancer. 1983. IARC Monographs on the evaluation of the carcinogenic risk of chemicals to humans. Some food additives, feed additives and naturally occurring substances. IARC Monographs 31:79–94.
- Ishioka, T., and N. Kuwabara. 1986. Induction of colorectal tumors in rats by sulfated polysaccharide (degraded carrageenan and amylopectin sulfate). In UICC (Union Internationale Contre Le Cancer), 14th International Cancer Congress, Budapest, Hungary, ISBN: 9783805544344.
- Ishioka, T., N. Kuwabara, Y. Oohashi, and K. Wakabayashi. 1986. Induction of colorectal tumors in rats by sulfated polysaccharides. Critical Reviews in Toxicology 17:215–244.
- Itoh, M., and P. H. Guth. 1985. Role of oxygen-derived free radicals in hemorrhagic shock-induced gastric lesions in the rat. Gastroenterology 88:1162–67. doi:10.1016/S0016-5085(85)80075-5.
- Janezic, A., M. Mostarcia-Stojkovic, and M. L. Lukic. 1979. Effects of carrageenan on the immune response to LPS in rats. Periodicum Biologorum 81:133–35.
- Japan Food Additives Association. 2009. Japan's specifications for food additives, 8th ed., The Ministry of Health and Welfare, 344.
- Jaysekhar, P., S. B. Rao, and G. Santhakumari. 2004. Effect of 5-substituted benzylideneaminosalicylic acid on carrageenan-induced ulcerative colitis. Bollettino Chimico Farmaceutico 143:309–13.
- JECFA: Joint FAO/WHO Expert Committee on Food Additives. 1999. Toxicological evaluation of certain food additives, including anticaking agents, antimicrobials, antioxidants, emulsifiers and thickening agents. WHO Food Addi. Ser. 42:147–69.
- JECFA: Joint FAO/WHO Expert Committee on Food Additives. 2015. Safety evaluation of certain food additives, WHO Food Additives Series 70. In: Prepared by the Seventy-ninth Meeting of the JECFA. http://apps.who.int/iris/bitstream/10665/171781/3/9789240693982_eng.pdf?ua1/41.
- Jensen, B. H., J. O. Andersen, S. S. Poulen, P. Skov-Olsen, S. Nørby-Rasmussen, S. H. Hansen, and E. F. Hvidberg. 1983. The prophylactic effect of 5-aminosalicylic acid and salazosulphapyridine on degraded-carrageenan-induced colitis in Guinea pigs. Scandinavian Journal of Gastroenterology 19:299–303. doi:10.1080/00365521.1984.12005725.
- Jiao, G., G. Yu, J. Zhang, and H. S. Ewart. 2011. Chemical structures and bioactivities of sulfated polysaccharides from marine algae. Marine Drugs 9 (2):196–223. doi:10.3390/md9020196.
- Kirsner, J. B. 1961. Experimental ‘colitis’ with particular reference to hypersensitivity reactions in the colon. Gastroenterology 40:307–12.
- Kitano, A. 1979. Study of experimental ulcerative colitis induced by administration of carrageenan into rabbits. The Japanese Journal of Gastroenterology 28:537–55.
- Kitano, A., K. Kobayashi, H. Oshiumi, K. Ookawa, S. Oka, Y. Tanaka, S. Kuwajuma, and T. Ono. 1981. Studies of experimental ulcerative colitis induced by carrageenan in rabbits. The Japanese Journal of Gastroenterology 78:2104–2111.
- Kitano, A., T. Matsumoto, M. Hiki, H. Hashimura, K. Yoshiyasu, K. Okawa, S. Kuwajima, and K. Kobayashi. 1986. Epithelial dysplasia of the rabbit colon induced by degraded carrageenan. Cancer Research 46:1374–76.
- Kong, F., and R. P. Singh. 2008. Disintegration of solid foods in human stomach. Journal of Food Science 73 R67–80. doi:10.1111/j.1750-3841.2008.00766.x.
- Lambelin, P. G. 1966. Study on the association of carrageenan with anticholinergics in the treatment of experimental gastric ulcers in the rat. Medicina Et Pharmacologia Experimentalis. International Journal of Experimental Medicine 14:136–44.
- Lecacheux, D., R. Panaras, G. Brigand, and G. Martin. 1985. Molecular weight distribution of carrageenan by size exclusion chromatography and low angle laser light scattering. Carbohydrate Polymers 5:423–40. doi:10.1016/0144-8617(85)90003-7.
- Liang, L., N. Rui, Y. Shao, and S. Mao. 2014. Carrageenan and its applications in drug delivery. Carbohydrate Polymers 103:1–11. doi:10.1016/j.carbpol.2013.12.008.
- Mackie, J. A., H. MacVaugh III, and L. T. Patterson. 1961. Effect of carrageenan on Mann-Williamson ulcer in dogs. Surgical Forum 12:294–96.
- Madhère, S. M., J. Reichner, S. Finklestein, and V. E. Pricolo. 1994. Histologic and Immunologic changes in lambda-carrageenan induced inflammatory bowel disease. Gastroenterology 106:A1036.
- Malagelada, J. R., G. F. Longstreth, W. H. J. Summerskill, and V. L. W. Go. 1976. Measurement of gastric functions during digestion of ordinary solid meals in man. Gastroenterology 70:203–10.
- Mallett, A. K., I. R. Rowland, C. A. Bearne, and S. Nichlin. 1985. Influence of dietary carrageenans on microbial biotransformation activities in the caecum of rodents and on gastrointestinal immune status in the rat. Toxicology and Applied Pharmacology 78:377–85. doi:10.1016/0041-008X(85)90243-1.
- Marcus, R. and J. Watt. 1971. Colonic ulceration in young rats fed degraded carrageenan. Lancet 2:765–766.
- Marcus, A. J., S. N. Marcus, R. Marcus, and J. Watt. 1989. Rapid production of ulcerative disease of the colon in newly-weaned Guinea pigs by degraded carrageenan. Journal of Pharmacy and Pharmacology 14:423–26. doi:10.1111/j.2042-7158.1989.tb06493.x.
- Marcus, S. N., T. J. Kline, H. Pothoulakis, J. C. O'Keane, L. Shiff, M. J. O'Brien, and A. J. Marcus. 1990. Role of inflammatory mediators in the pre-ulcerative phase of carrageenan-induced ulcerative disease of the colon (CIUDC). Gastroenterology 98:A461.
- Marinalg International. 2015. Status report on the work of Marinalg International to measure the molecular weight distribution of Carrageenan and Processed Eucheuma Seaweed in order to meet the EU specification: less than 5% below 50,000 Daltons. ( Unpublished report).
- McKim, J. M. 2014. Food additive carrageenan: Part I: A critical review of carrageenan in vitro studies, potential pitfalls, and implications for human health and safety. Critical Reviews in Toxicology 44:211–43.
- McKim Jr., J. M., H. Baas, G. P. Rice, J. A. Willoughby Sr., M. L. Weiner, and W. R. Blakemore. 2016. Effects of carrageenan on cell permeability, cytotoxicity, and cytokine gene expression in human intestinal and hepatic cell lines. Food and Chemical Toxicology 96:1–10. doi:10.1016/j.fct.2016.07.006.
- Michel, C. and G. T. MacFarlane. 1996. Digestive fates of soluble polysaccharides from marine macroalgae: involvement of the colonic microflora and physiological consequences for the host. Journal of Applied Bacteriology 80:349–69. doi:10.1111/j.1365-2672.1996.tb03230.x.
- Moyana, T. and J. M. Lalonde. 1990a. Carrageenan-induced intestinal injury in the rat – A model for inflammatory bowel disease. Annals of Clinical and Laboratory Science 20:420–26.
- Moyana, T. and J. M. Lalonde. 1990b. Carrageenan-induced ileitis in the rat: Role of oxyradicals. Annals of Clinical and Laboratory Science 20:294.
- Moyana, T. and J. M. Lalonde. 1991a. Carrageenan-induced intestinal injury: A scanning and transmission electronic study. Laboratory Investigation 64:39A.
- Moyana, T. and J. M. Lalonde. 1991b. Carrageenan-induced intestinal injury: Possible role of free radicals. Annals of Clinical and Laboratory Science 21:258–63.
- Munyaka, P. M., S. Sepehri, J. E. Ghia, and E. Khafipour. 2016. Carrageenan gum and adherent invasive Escherichia coli in a piglet model of inflammatory bowel disease: Impact on intestinal mucosa-associated microbiota. Frontiers in Microbiology 7:462–83. doi:10.3389/fmicb.2016.00462.
- Noa, M., and R. Mas. 1998. Effect of D-002 on the pre-ulcerative phases of carrageenan-induced colonic ulceration in the Guinea pig. Journal of Pharmacy and Pharmacology 50:549–53. doi:10.1111/j.2042-7158.1998.tb06197.x.
- Norris, A. A., A. J. Lewis, and I. J. Zeitlin. 1981. Inability of degraded carrageenan fractions to induce inflammatory bowel ulceration in the guinea-pig. Journal of Pharmacy and Pharmacology 33: 612–13.
- Oestreicher, P., T. G. Hodge, J. L. Speth, and S. T. Nielsen. 1986. Modulation of carrageenan-induced colitis in Guinea pigs by immunization with Bacteroides vulgatus. Federation Proceedings 45:953.
- Okayasu, I., S. Hatakeyama, M. Yamada, T. Ohkusa, Y. Inagaki, and R. Nakaya. 1990. A novel method in the induction of reliable experimental acute and chronic ulcerative colitis in mice. Gastroenterology 98:694–702. doi:10.1016/0016-5085(90)90290-H.
- Olsen, P. S., and S. S. Poulsen. 1980. Stereomicroscpoic and histologic changes in the colon of Guinea pigs fed degraded carrageenan. Acta Pathologica Et Microbiologica Scandinavica. Section A 88:135–41.
- Olsen, P. S., P. Kirkegaard, and S. S. Poulsen. 1983. The effect of ileotransversostomy on carrageenan-induced colitis in Guinea pigs. Scandinavian Journal of Gastroenterology 18:407–10. doi:10.3109/00365528309181615.
- Onderdonk, A. B., and M. D. Bartlett. 1979. Bacteriological studies of experiment ulcerative colitis. American Journal of Clinical Nutrition 32:258–65. doi:10.1093/ajcn/32.1.258.
- Onderdonk, A. B., M. L. Franklin, and R. L. Cisneros. 1981. Pro-induction of experimental ulcerative colitis in gnotobiotic Guinea pigs with simplified microflora. Infection and Immunity 32:225–31.
- Onderdonk, A. B., R. L. Cisneros, and R. T. Bronson. 1983. Enhancement of experimental ulcerative colitis by immunization with Bacteroides vulgatus. Infection and Immunity 42:783–88.
- Oohashi, Y., T. Ishioka, K. Wakabayashi, and N. Kuwabara. 1981. A study of carcinogenesis induced by degraded carrageenan arising from squamous metaplasia of the rat colorectum. Cancer Letters 14:267–72. doi:10.1016/0304-3835(81)90153-1.
- Panlasigui, L. N., O. Q. Baello, J. M. Dimatangal, and B. D. Dumelod. 2003. Blood cholesterol and lipid-lowering effects of carrageenan on human volunteers. Asia Pacific Journal of Clinical Nutrition 12:209–14.
- Pearson, A. D., E. J. Eastham, M. F. Laker, A. W. Craft, and R. Nelson. 1982. Intestinal permeability in children with Crohn's disease and coeliac disease. British Medical Journal (Clinical Research Ed.) 285:20–21. doi:10.1136/bmj.285.6334.20.
- Piper, D., and B. Fenton. 1961. Effect of a sulfated polysaccharide on peptic digestion. A study in vitro of carrageenan (Ebimar). Gastroenterology 40:638–43.
- Pricolo, V. E., S. M. Madhère, S. D. Finklestein, and J. S. Reicher. 1996. Effects of lambda-carrageenan induced experimental enterocolitis on splenocyte function and nitric oxide production. Journal of Surgical Research 66:6–11. doi:10.1006/jsre.1996.0364.
- Raman, M., and M. Doble. 2015. κ-carrageenan from marine red algae, Kappaphycus alvarezii – A functional food to prevent colon carcinogenesis. Journal of Functional Foods 15:354–64. doi:10.1016/j.jff.2015.03.037.
- Reid, P. E., C. F. A. Culling, W. L. Dunn, C. W. Ramey, and M. G. Clay. 1984. Chemical and histochemical studies of normal and diseased human gastrointestinal tract: A comparison between histologically normal colon, colonic tumors, ulcerative colitis and diverticular disease of the colon. Histochemical Journal 16:235–52. doi:10.1007/BF01003608.
- Ricketts, C. R. 1952. Dextran sulphate-α synthetic analogue of heparin. Biochemical Journal 51:129–33. doi:10.1042/bj0510129.
- Rustia, M., P. Shubik, and K. Patil. 1980. Lifespan carcinogenicity tests with native carrageenan in rats and hamsters. Cancer Letters 11 (1):1–10. doi:10.1016/0304-3835(80)90122-6.
- Sawicki, J. E., and P. J. Catanzaro. 1975. Selective macrophage cytotoxicity of carrageenan in vivo. International Archives of Allergy and Applied Immunology 49:709–14. doi:10.1159/000231451.
- Shiau, S. Y., and G. W. Chang. 1981. Degraded carrageenan increases permeability of phenol red in the rat intestine. Federation Proceedings 43:1065.
- Shiau, S. Y., and P. L. Huang. 1998. Effects of different levels of carrageenan on colonic mucin degradation and serum cholesterol levels in rats. Frontiers of Gastrointestinal Research 14:158–64. doi:10.1159/000414757.
- Sokolova, E. V., L. N. Bogdanovich, T. B. Ivanova, A. O. Byankina, S. P. Kryzhanovsky, and L. M. Yermak. 2014. Effect of carrageenan food supplement on patients with cardiovascular disease results in normalization of lipid profile and moderate modulation of immunity system markers. Pharma Nutrition 2:33–37. doi:10.1016/j.phanu.2014.02.001.
- Song, I. S., N. Y. Kim, and C. Y. Kim. 1992. Ulcerative colitis induced by carrageenan in Guinea pig. Gastroenterology 102:A699.
- Stanley, N. F. 1982. The effects of carrageenan on peptic and tryptic digestion of casein. Progress in Food &Amp; Nutrition Science 6:161–70.
- Tanaka, T., H. Kohno, R. Suzuki, Y. Yamada, S. Sugie, and H. Mori. 2003. A novel inflammation-related mouse colon carcinogenesis model induced by azoxymethane and dextran sodium sulfate. Cancer Science 94:965–73. doi:10.1111/j.1349-7006.2003.tb01386.x.
- Thomson, A. W., and E. F. Fowler. 1977. Effect of carrageenan on growth of a syngeneic adenocarcinoma. Scottish Medical Journal 22:241.
- Thomson, A. W., A. R. Wilson, W. J. Cruickshank, and A. H. Jeffries. 1976. Evidence for a selective cytotoxic effect of carrageenan on cells if the immune system in vivo and in vitro. Experentia 32:525–26. doi:10.1007/BF01920837.
- Tobacman, J. K. 2001. Review of harmful gastrointestinal effects of carrageenan in animal experiments. Environmental Health Perspectives 109:983–94. doi:10.1289/ehp.01109983.
- Tobacman, J. K. 2015. The common food additive carrageenan and the alpha-gal epitope. Journal of Allergy and Clinical Immunology 136:1708–1709. doi:10.1016/j.jaci.2015.08.048.
- United Stated Adopted Names Council (USAN). 1988. List no. 297 new names, poligeenan. Clinical Pharmacology and Therapeutics 44:246–48. doi:10.1038/clpt.1988.145.
- Uno, Y., T. Omoto, Y. Goto, I. Asai, M. Nakamura, and T. Maitani. 2001a. Molecular weight and fecal excreted quantity of carrageenan administered to rats in blended feed. Japanese Journal of Food Chemistry 8:83–93.
- Uno, Y., T. Omoto, Y. Goto, I. Asai, M. Nakamura, and T. Maitani. 2001b. Molecular weight distribution of carrageenan studies by a combined gel permeation/inductively coupled plasma (GPC/ICP) method. Food Additives & Contaminants 18:763–72. doi:10.1080/02652030117235.
- US Food and Drug Administration. 2018. Database of inactive ingredients in approved drugs: Carrageenan. Accessed April 04, 2018. https://www.accessdata.fda.gov/scripts/cder/iig/getiigWEB.cfm.
- Van der Waaij, D., B. J. Cohen, and M. R. Anver. 1974. Mitigation of experimental inflammatory bowel disease in guinea pigs by selective elimination of the aerobic gram-negative intestinal microflora. Gastroenterology 67:460–72.
- Wakabayashi, K., Y. Fujimoto, Y. Oohashi, N. Kuwabara, and Y. Fukuda. 1979. Induction of colorectal tumors and its early lesions by degraded carrageenan in rats. In Naturally occurring carcinogens, mutagens and modulators of carcinogenesis, E.C. Miller et al., Eds., 127–38. Baltimore: University Park Press.
- Watt, J., and A. J. Marcus. 1969. Ulcerative colitis in the guinea pig caused by seaweed extract. Journal of Pharmaceutical and Pharmacology 21:187S–8S. doi:10.1111/j.2042-7158.1969.tb08372.x.
- Watt, J., and A. J. Marcus. 1971. Carrageenan-induced ulceration of the large intestine in the Guinea pig. Gut 12:164–71. doi:10.1136/gut.12.2.164.
- Watt, J., and R. Marcus. 1970. Hyperplastic mucosal changes in the rabbit colon produced by degraded carrageenan. Gastroenterology 59:760–68.
- Watt, J., and A. J. Marcus. 1978. Comparison of the effects of carrageenins and Danish agar on the colon of guinea-pigs. Proceedings of the Nutrition Society 37:39A.
- Watt, J., C. McLean, and R. Marcus 1979. Degradation of carrageenan for the experimental production of ulcers in the colon. Communications Journal of Pharmacy and Pharmacology 31:645. doi:10.1111/j.2042-7158.1979.tb13614.x.
- Weiner, H. L. 2000. Oral tolerance, an active immunologic process mediated by multiple mechanisms. Journal of Clinical Investigation 106:935–37. doi:10.1172/JCI11348.
- Weiner, M. L. 1991. Toxicological properties of carrageenan. Agents Actions 32:46–51. doi:10.1007/BF01983307.
- Weiner, M. L. 2014. Food additive carrageenan: Part II: A critical review of carrageenan in vivo safety studies. Critical Reviews in Toxicology 44:244–69. doi:10.3109/10408444.2013.861798.
- Weiner, M. L. 2016. Parameters and pitfalls to consider in the conduct of food additive research, carrageenan as a case study. Food and Chemical Toxicology 87:31–44. doi:10.1016/j.fct.2015.11.014.
- Weiner, M. L., J. M. McKim, and W. Blakemore. 2017. Addendum to Weiner, M.L. 2016. Parameters and pitfalls to consider in the conduct of food additive research, carrageenan as a case study. Food Chemical Toxicology 87, 31–44. Food and Chemical Toxicology 107 (Pt A):208–14 doi:10.1016/j.fct.2017.06.022.
- Whitehill, I., J. Evans, K. Hiller, and H. E. Amos. 1980. Immunological mechanisms in the pathogenesis of carrageenan induced ulceration. Toxicology Letters 6:184.