
Abstract
This paper reviews and analyses the importance of maize as staple food in Eastern and Southern Africa (E&SA) and contributes in understanding the nexus between maize nutritional composition and prevalence of micronutrient deficiencies (MNDs) in these regions. MNDs remain a major public health concern particularly for women and children, with calcium, iodine, iron, selenium, zinc, folate and vitamin A deficiencies being the most common. Estimates of their prevalence are among the highest in E&SA: iron-deficient anemia affected 26 to 31% of women of reproductive age, and deficiencies up to 53%, 36%, 66%, 75% and 62% for vitamin A, iodine, zinc, calcium and selenium, respectively, were measured in populations of these regions. Besides, these two regions show the highest worldwide maize per capita consumption (g/person/day) as main staple, with 157 in Eastern Africa and 267 in Southern Africa, including up to 444 in Lesotho. The analysis of food composition tables from these regions showed that 100 g of maize foods consumed by these populations could to some extent, contribute in satisfying dietary reference intakes (DRIs) of children and women in energy, proteins, carbohydrates, magnesium, zinc, vitamins B1 and B6. However, it provides very low supply of fats, calcium, sodium, selenium, vitamins C, A and E. The high occurrence of MNDs and considerable nutritional potential of maize consumed in E&SA can be explained by loss of nutrients due to processing practices, low food diversification and reduced nutrients bioavailability. Success cases of the main strategies to tackle the issue of MNDs in these regions by improving maize nutritional quality are discussed in this paper. Maize fortification was shown to improve nutrition and health outcomes of population. Increasing dietary diversity by complementing maize with other foods has improved nutrition through integration of micronutrient-rich foods in the diet. Mostly, biofortification has successfully contributed in reducing vitamin A and zinc deficiencies in rural communities more than nutrient supplementation, fortification and dietary diversity.
1. Introduction
Micronutrient deficiencies (MNDs) have been identified as major public health problems affecting a large part of the world’s population (Manjeru, Van Biljon, and Labuschagne Citation2017). They are widespread globally, with pregnant women and their children under 5 years at the highest risk (Bailey, West, and Black Citation2015). More than 800 million people are undernourished in the world, while between 1.5 to 2 billion people have one or more chronic MNDs, notably deficiencies in the minerals calcium, iodine, iron, selenium, zinc, and vitamins such as folate and vitamin A (Bailey, West, and Black Citation2015; Beal et al. Citation2017; FAO Citation2020; Kumssa et al. Citation2015; WHO and UNICEF Citation2017). Approximately 90% of those at risk of calcium and zinc deficiency in 2011 lived in Africa and Asia (Kumssa et al. Citation2015). Micronutrients play important roles in human health and MNDs can retard growth and cognitive development, impair immunological functioning and increase the risk of non-communicable diseases including skeletal, cardiovascular and metabolic disorders (Fairweather-Tait et al. Citation2011; WHO/FAO Citation2003). They contribute to intellectual impairments, perinatal complications, and increased risk of morbidity and mortality (Bailey, West, and Black Citation2015). Micronutrient deficiencies occur when intake and absorption of vitamins and minerals are too low to sustain good health and development (Bouis and Saltzman Citation2017). According to FAO, ‘’food security exists when all people, at all times, have physical, social and economic access to sufficient safe and nutritious food that meets their dietary needs and food preferences for an active and healthy life’’(FAO Citation1996). Therefore, macro and micronutrient components of the diet must be considered when evaluating food security.
Maize or corn (Zea mays L.) is the mostly produced food worldwide, and in term of consumption, the third most important cereal crop of the world after wheat and rice (FAO Citation2020). More than 1 billion tonnes were produced worldwide in 2016, the highest amount (51.6%) was produced in the Americas, followed by Asia and Europe, while Africa’s harvest represented only 6.7% of the world production (FAO Citation2020). By 2050, maize production must double to meet the growing demands of human and animal consumption, and biofuel production, particularly in developing countries (Ray et al. Citation2013). Maize kernels can vary in color, depending on environmental, cultural, and genetic parameters; they can be white, yellow, orange, red, or black (FAO Citation1992). These kernels, like other seeds, are storage organs that contain essential components for plant growth and reproduction. Many of these kernel constituents, including starch, protein, and some micronutrients, are required for human health. Maize has become highly integrated into global agriculture, human diet and cultural traditions (Nuss and Tanumihardjo Citation2010). It is a source of nutrients as well as phytochemical compounds such as carotenoids, phenolic compounds and phytosterols which play an important role in preventing chronic diseases (Demeke Citation2018; Shah, Prasad, and Kumar Citation2016).
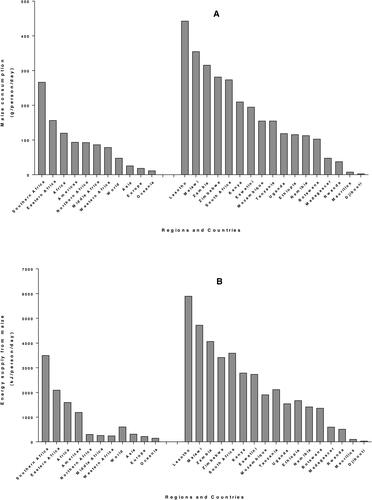
Maize is the main staple food crop of more than 300 million Africans (Mathenge, Smale, and Olwande Citation2014; VIB Citation2017). In sub-Saharan Africa (SSA), maize is a key staple and it plays a significant role in reducing poverty and improving the food security status for poor families (Zuma, Kolanisi, and Modi Citation2018). Contrary to developed countries where maize is mostly used for profit making from feed, fuel and other raw materials for industry, in SSA, maize is mostly used for human consumption (Hu, Burucs, and Schmidhalter Citation2008). Seventy seven percent of maize produced in SSA (except South Africa) is used as human food and only 12% serves as animal feed (Grant, Wolfaardt, and Louw Citation2012). Data from 4-year average (2010–2013) FAOSTAT Food Supply records (FAO Citation2020) show that the highest average maize consumption for adults (expressed in g/person/day) is obtained in Southern Africa (267) followed by Eastern Africa (157), which is greater than the African average (120) and far above the world average (48). Among the countries of E&SA, Lesotho shows the highest consumption (444), followed by Malawi (356) and Zambia (316) while consumption in Madagascar and Rwanda is below 100 and Mauritius and Djibouti are more lower, below 10. (). A similar tendency is observed for energy supply from maize () where maize provides 3502 kJ/capita/day in Southern Africa and 2098 kJ/capita/day in Eastern Africa, the Africa and world averages being 1601 and 607 kJ/capita/day, respectively. Protein supply from maize () and fat supply () also follow a similar trend as consumption, with highest values in Southern and Eastern Africa.
Figure 1. Per capita supply from maize worldwide and in countries of Eastern and Southern Africa from 4-year average (2010–2013) FAOSTAT data, for consumption (A), energy (B), protein (C) and fat (D).
In most of these E&SA countries, maize plays a key role in the diet of infants. Complementary foods are given to infants and children when the breastmilk is no longer enough to meet the nutritional requirements. Gruel or porridge typically made from a starchy staple (e.g., maize, rice, or wheat) are the most widely consumed and cost-effective products in most of the developing countries (Alamu et al. Citation2018). Porridge made with maize meal is frequently consumed by infants and young children in South Africa, the consumption pattern varying across study populations: daily consumption was between 81.0% and 97.6% for rural children, and 31.3% to 59.7% for children in urban areas (Faber et al. Citation2015). In Zambia, complementary food is usually introduced between age 4 and 6 months, and maize is the common ingredient used to prepare a semisolid meal locally called “maize porridge” or a solid porridge called “Nshima” (Alamu et al. Citation2018). In Malawi, maize is the principal complementary food, it is usually first served as a thin porridge and later in infancy, the thin porridge is substituted by a thicker porridge and complemented with soups of vegetables and fish (Mangani et al. Citation2015; Vaahtera et al. Citation2001).
Low nutritional value of complementary foods is associated with high incidence of children stunting in low-income countries (Mangani et al. Citation2015). Maize is the most important staple crop for food security and livelihood of smallholder farmers in many parts of SSA, but it alone cannot ensure food security (Rajendran et al. Citation2017; Zuma, Kolanisi, and Modi Citation2018), nor provide sufficient nutrients to meet the DRI. For instance, in South Africa unbalanced diets were observed in most rural communities where people consume starchy staple diets made from maize, with limited or no diversification (Govender Citation2014). It is obvious that maize occupies a central role in diet of populations, mainly children, in E&SA where prevalence of MNDs is high. Therefore, an insight of composition of maize meals consumed in these regions and their contribution to people’s nutrients intake is necessary to better apprehend the problem. Different strategies that have been developed to enhance maize quality and complement maize-based diets in order to balance the nutrition requirements are also analyzed in this review.
2. Women and children malnutrition in Eastern and Southern Africa
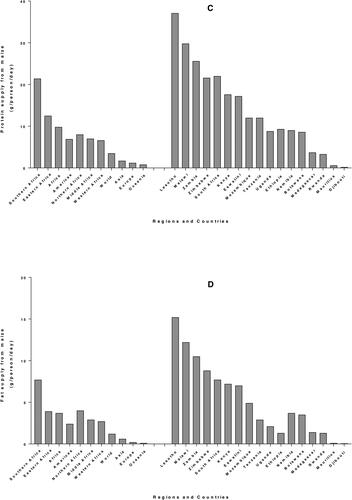
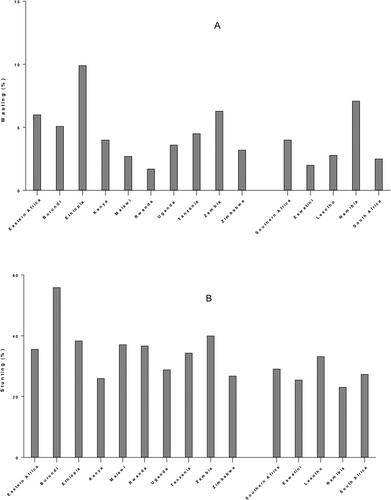
After a prolonged decline in the last decade, world hunger appears to be on the rise again. The estimated number of undernourished people increased to 821 million (10.9%) in 2017, up from 784 million (10.6%) in 2015. In 2017 worldwide, stunting affected 151 million children (22.2%) and 51 million children under five (7.5%) suffered from wasting. Malnutrition is more prevalent in low-, lower-middle and middle-income countries and is concentrated among the poor. Sub-Saharan Africa has one of the highest levels of child malnutrition globally. The distribution of prevalence of malnutrition indicators (stunting, wasting and underweight) in SSA showed that countries in East Africa and West Africa presented the worst scores. Among children under 5 years, 6.0% in Eastern Africa and 4.0% in Southern Africa suffered from wasting, the most affected country in Eastern Africa was Ethiopia (9.9%), and in Southern Africa, it was Namibia (7.1%) (). Stunting affected 35.6% and 29.1% of children in Eastern Africa and Southern Africa respectively: Burundi (55.9%) showed the highest rate in Eastern Africa, while Lesotho (33.2%) was the highest in Southern Africa (). A meta-analysis of demographic and health surveys from 2006 to 2016 shows that underweight affected 14.4% children in Eastern African, with the highest prevalence in Burundi (28.8%); prevalence in Southern Africa was 10.7% with the highest value (13.4%) recorded in Namibia () (Akombi et al. Citation2017; FAO Citation2018).
Figure 2. Prevalence of wasting (A), stunting (B) and underweight (C) for children under 5 years in Eastern and Southern Africa. Data from (Akombi et al. Citation2017; FAO Citation2018).
Despite considerable efforts to reduce malnutrition, MNDs also known as hidden hunger is still widespread. Single MNDs rarely happen in isolation; more often, multiple MNDs are occurring simultaneously (Bailey, West, and Black Citation2015). In Malawi for example, more than 50% of the households were estimated to be at risk of Ca, Zn and/or Se deficiencies (Joy et al. Citation2015). Globally, one of the most common nutritional disorder worldwide remains iron deficiency; one‐third of school age children and a similar share of the global population suffer from insufficient iodine intake, and are therefore at risk of iodine deficiency disorder (IDD); 21% of children under five years are affected by vitamin A deficiency; one third of the global population suffers from zinc deficiency (Barrett and Bevis Citation2015).
2.1. Iron deficiency
Iron deficiency is the most common MND worldwide. It corresponds to blood ferritin level below 12 μg/L for children under 5 years, or below 15 μg/L for those 5 years and above. Iron deficiency leads to iron deficiency anemia-IDA as well as impaired immune and endocrine function (Bailey, West, and Black Citation2015). IDA can cause a decrease in oxygen carrying capacity and is one of the most common pregnancy-related complications (Sifakis and Pharmakides Citation2000). Anemia is defined as hemoglobin levels below 11 g/dL in children 6–50 months, and below 11.5 g/dL in children aged over 5 years (WHO Citation2018, Citation2011). It was estimated that about half of all anemia is attributable to iron deficiency depending on the geographic and disease environment (Darnton-Hill and Mkparu Citation2015), but recent studies show that the prevalence of iron deficiency is underestimated in African children, and is much lower than that of anemia (Lemoine and Tounian Citation2020; Muriuki et al. Citation2020). In fact, ferritin is a good indicator of the body's iron stores, but it is not a specific reflection, with both inflammation and infection causing an increase: the use of transferrin saturation may provide a more accurate approach (Muriuki et al. Citation2020). Accurate epidemiological data on the prevalence of iron deficiency are difficult to obtain due to the many compounding factors, especially infections and general inflammation (Lemoine and Tounian Citation2020).
At the global level, one in three women of reproductive age suffers from anemia. In E&SA, the prevalence is similar, except extreme cases in Mozambique and Tanzania ( and ). In 2016, anemia affected 31.2% of women of reproductive age (15–49 years old) in East Africa, with the highest prevalence (44.4%) in Somalia. In Southern Africa, the prevalence was 26.0%, with the highest record (30.2%) in Botswana (FAO Citation2018). The 2010 Tanzania Demographic and Health Survey (TDHS) revealed that 24% of children have IDA and around one-third (35%) of Tanzanian children were iron deficient. Among women aged 15–49, anemia prevalence was 41% (of which 35% was due to iron deficiency) and 30% were iron deficient (Tanzania Bureau of Statistics and ICF Macro Citation2011). More recently, it was found that prevalence rate of anemia among under-fives in Arusha District was 84.6%, and low birth weight and dietary factors like low or non-consumption of iron-rich foods were predicting factors (Kejo et al. Citation2018). The 2015–16 Malawi Micronutrient Survey reports that anemia was found in 28% of preschool children (PSC), 21% of school-aged children (SAC), and 21% of non-pregnant women of reproductive age (WRA). Iron deficiency affected 22% of PSC, 5% of SAC, and 15% of non-pregnant WRA (National Statistical Office et al. Citation2017). The prevalence of iron deficiency hemoglobin in children aged 7–15 years in the rural community of Qwa-Qwa in the Free State province of South Africa was 3.9% (Egal and Oldewage-Theron Citation2018). Cereals, such as maize can provide 50% of the Fe absorbed from foods consumed by poor people. Therefore, Fe total uptake may be enhanced significantly by increasing Fe contents in cereal food crops (Kumar et al. Citation2015).
Table 1. Summary of prevalence of children micronutrient deficiencies in Eastern and Southern Africa.
Table 2. Summary of prevalence of Women micronutrient deficiencies in Eastern and Southern Africa.
2.2. Vitamin A deficiency
Vitamin A plays a vital role for human body functioning in supporting immune function, vision, ocular health, and reproduction (Awobusuyi et al. Citation2016). Vitamin A deficiency (VAD) is the leading cause of blindness worldwide and also impairs immune function and cell differentiation (Bailey et al. Citation2015). Iron, zinc, and protein deficiencies, in addition to infections, can further impair vitamin A metabolism and status (Tanumihardjo Citation2004). Major sources of vitamin A are provitamin carotenoids such as β-carotene found in foods, mainly in green, orange and yellow crop tissues like fruits and vegetables. Unfortunately, these food sources are usually seasonal and/or costly, thus inaccessible to low-income communities in South Africa (Zuma et al. Citation2018). Similarly, many people in the drier parts of Zimbabwe do not have access to fresh vegetables and fruits throughout the year (Gadaga et al. Citation2009). In consequence, Vitamin A deficiency (VAD) remains one of the major MNDs in E&SA, and globally a challenge beyond the Millennium Developmental Goals (Bouis and Saltzman Citation2017).
In Zambia, VAD affected 53% of children 6–59 months old, far above the 20% WHO threshold. Among non-pregnant women of childbearing age (15–49 years), VAD was found to be 13.4%. The authors also noted that these most recent available data are 17 years old, so there is considerable uncertainty about the current situation (MOST Citation2003). In Malawi on the other hand, VAD was found extremely low: approximately 4% of PSC, 1% of SAC, and less than 1% of non-pregnant WRA were affected (National Statistical Office et al. 2017). Likewise, a prevalence of 1.4% was found in children of a rural community of South Africa (Egal and Oldewage-Theron Citation2018) ( and ).
Unfortunately, many populations chronically suffer from VAD but still maintain cultural preferences for consumption of white maize varieties, which are rather poor in vitamin D (FAO/CIMMYT Citation1997). In 2007, 90% of Africa’s total maize production was white maize, whereas 90% of the world’s production was yellow maize (Harashima Citation2007). Maize consumed in E&SA countries is mostly white-grained, and the consumption of yellow grains is minor (Smale et al. Citation2015).
2.3. Iodine deficiency
Iodine’s primary role is in the synthesis of thyroid hormone, which is necessary for regulation of human growth and development. Approximately 60% of the total body pool of iodine is stored in the thyroid gland. Iodine deficiency disorder is quite widespread and results in goiter, mental retardation, or reduced cognitive function. Globally, almost 2 billion peoples are estimated to have inadequate iodine status, the group of highest concern being pregnant women. Insufficient iodine intakes were recorded in approximately 30% (241 million) of the world’s school-aged children (Bailey et al. Citation2015). The TDHS showed that urinary iodine average among Tanzanian women aged 15–49 years was 160 μg/L: 36% had their urinary iodine concentrations below the recommended level (Tanzania Bureau of Statistics and ICF Macro Citation2011) ( and ). The most practical strategy to reduce iodine deficiency globally is universal salt iodization (Bailey et al. Citation2015).
2.4. Folic acid deficiency
Folate is a generic term for multiple forms of the essential B9 vitamin. Folate is essential for DNA synthesis and repair, and deficiency results in macrocytic anemia. Folate deficiency in pregnancy has been associated with low birth weight, preterm delivery, and fetal growth retardation. Folic acid taken in early pregnancy can prevent neural tube defects. Globally, only about 30% of women take folic acid supplements prior to conception. But no good estimates of global folate deficiency exist for those considered to be of highest risk: women of reproductive age, pregnant females, and young children (Bailey et al. Citation2015).
2.5. Zinc deficiency
In humans, Zn is mostly present in bones and skeletal muscles, it is responsible for efficient functioning of more than 300 enzymes and acts as a stabilizer and protects membrane structure and cell components (Babu et al. Citation2013; Kumar et al. Citation2015). Adequate zinc is necessary for optimal immune function, its deficiency is associated with an increased incidence of diarrhea and acute respiratory infections, and is a major causes of death in children under 5 years (Bailey et al. Citation2015). The main sources of Zn in low-income populations include cereals, tubers, legumes, and starchy roots. However, current Zn from these sources is either low in quantity or has low bioavailability. Increasing Zn contents of food crops could result in significant enhancement of total uptake (Kumar et al. Citation2015). The mean Zn deficiency risk in 2011 was 25% for Africa and was the highest among the Americas (7%), Asia (17%), Europe (3%) and Oceania (2%) (Kumssa et al. Citation2015). In Malawi, the 2015–16 micronutrient survey revealed that Zn deficiency was common in all subgroups, ranging from 60% in PSC and ASC to 63% in non-pregnant WRA (National Statistical Office et al. 2017). In a rural South African community, 25.0% of children aged 7–15 years was found zinc deficient (Egal and Oldewage-Theron Citation2018) ( and ).
2.6. Calcium deficiency
Calcium, the most abundant mineral in the body, is an essential nutrient necessary for many functions in human health. Almost 99% of body’s calcium is found in teeth and bone, and only 1% is found in serum. Adequate calcium intake can reduce the risk of fractures, osteoporosis, and diabetes in some populations (Beto Citation2015). During pregnancy, calcium supplementation is important for preventing gestational hypertensive disorders, and reduces the incidence of gestational hypertension, pre-eclampsia and pre-term births (Phillips et al. Citation2014). Compared with the Americas (29%), Asia (57%), Europe (11%) and Oceania (11%), the highest mean Ca deficiency risk in 2011 (80%) was recorded in Africa (Kumssa et al. Citation2015). Approximately 75% of children at ages 12 and 18 months in a cohort in a peri-urban community in North West province of South Africa had low calcium intakes (Swanepoel et al. Citation2019) ( and ).
2.7. Selenium deficiency
Selenium (Se) is an essential element for humans, its defficiency results in decreased expression and activity of several essential selenoproteins and this can lead to reduced immune function, thyroid function and cognitive development, and increased risks from non-communicable diseases (Fairweather-Tait et al. Citation2011; Rayman Citation2012). Body Se is derived primarily from dietary sources (Fairweather-Tait et al. Citation2011) and Se deficiency is typically due to inadequate dietary Se intake (Phiri et al. Citation2019).
The prevalence of Se deficiency is unknown in many countries, especially in SSA ( and ). Among WRA in Malawi, prevalence of plasma Se concentrations found below the thresholds for the optimal activity of the selenoproteins glutathione peroxidase 3 and iodothyronine deiodinase were 62.5% and 29.6%, respectively (Phiri et al. Citation2019). Due to low levels of plant-available Se in most soils and narrow food choices, suboptimal dietary Se intake is widespread in Malawi (Chilimba et al. Citation2012, Citation2011; Phiri et al. Citation2019).Nationally representative household-level food consumption data in Malawi estimated that 70% of the population consumed inadequate Se (Joy et al. Citation2015). Cereals contributed 52% of Se supply throughout Africa (Joy et al. Citation2014).
3. Maize nutritional composition
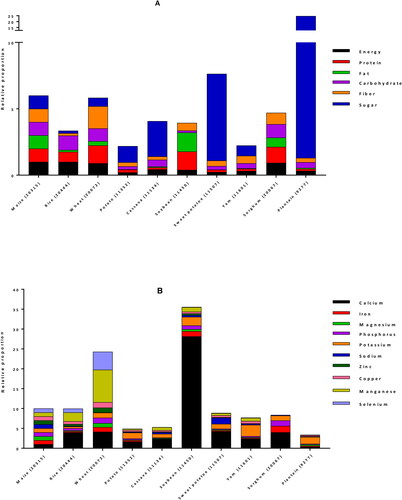
For human consumption, maize kernel or caryopses is the edible and nutritive part of the plant. Each kernel has 3 distinct compartments: the endosperm, the embryo (germ) and the pericarp (seed coat) which represent approximately 83%, 11%, and 6% of the kernel, respectively (Earle et al. Citation1946). The composition of maize kernels is influenced by many factors, including genetic background, variety, environmental conditions, plant age, and geographic location. It is mainly composed of carbohydrates, proteins, fats, fibers and minerals. A comparison of maize nutritional composition with other staple plant foods (rice, wheat, potatoes, cassava, soybeans, sweet potatoes, yams, sorghum, plantain) based on United States Department of Agriculture (USDA) National Nutrient Database (USDA Citation2020) is shown in . (The USDA nutrient database number (NDB number) of each food is indicated in brackets on the figure). It reveals that as compared to other staples, maize has similar average energy, protein, carbohydrates, fiber, manganese, and most of the vitamins; higher content of fat, magnesium, phosphorus, sodium, zinc and selenium; but lower sugar, vitamin K1, vitamin C, calcium and potassium. Maize fats contains high proportion of saturated, mono- and poly-unsaturated fatty acids, and comes second after soybean.
Figure 3. Comparison of nutrients per 100 g portion of maize with other major staple foods for energy and proximate (A), minerals (B), vitamins (C) and fats (D). For each nutrient, values from USDA database (USDA Citation2020) were normalized with maize value to obtain the relative proportion of nutrient in each staple as compared to maize. *: vitamin C values were divided by 10 for a better fit in the chart.
3.1. Macronutrients
Starch is the main type of carbohydrates found in maize, making up the highest proportion (generally up to 80%) of the dry weight. Maize also contains small amounts (1–3%) of sugar, of which sucrose is the most abundant, maltose, glucose, fructose, and raffinose being in minor amounts. In sweet corn, the sugar content is higher (18%) while the starch content is reduced (28%) (USDA Citation2020). Almost all the free sugars are located in the germ with only 25% present in the endosperm, while virtually all starch is located in the endosperm (Nuss and Tanumihardjo Citation2010). Maize content of carbohydrates compares with rice and wheat, and is higher than the other staples. Free sugar in the other hands, is lower than content in plantain, sweet potato, cassava and potato, but is the highest among the cereals and legumes ().
Maize is a good source of proteins, which typically range between 10 and 15% (USDA Citation2020). Maize proteins are mostly distributed between the endosperm and germ. Crude maize protein consists of a mixture of prolamins, glutelins, albumins, and globulins. Prolamin is the major fraction, providing about half of total kernel nitrogen, followed by glutelins (35% total protein), both of which are endosperm‐specific proteins. Albumins contribute about 7% nitrogen, globulins 5%, and non-proteins 6%, which collectively account for about 18% of total kernel nitrogen (Nuss and Tanumihardjo Citation2010). The most abundant prolamins are zeins, accounting for 44–79% of the maize total protein content (Guo et al. Citation2013; Lawton Citation2002). As compared to the other staples, maize comes 4th after soybean, wheat and sorghum in term of protein content (). However, the quality of typical maize proteins is poor because they are lacking some essential amino acids, mainly lysine and tryptophan (Prasanna et al. Citation2001). A nutritionally superior maize cultivar named quality protein maize (QPM) having twice the amount of lysine and tryptophan than traditional maize types was developed in the nineties, to assist in closing the protein inadequacy gap. To maintain adequacy of lysine, the most limiting amino acid, nearly 100 g and 500 g QPM are required for children and for adults, respectively. This represents a 40% reduction in maize intake relative to common maize to meet protein requirements (Nuss and Tanumihardjo Citation2011).
The fiber content of different maize varieties is generally around 4–7%. Insoluble fibers such as hemicellulose (67%), cellulose (23%), and lignin (0.1%) are the predominant types of fiber in maize. The fiber is the main constituent (87%) of the seat coat, but smaller amounts are also found in the endosperm and germ walls. Therefore, fiber content of processed, dehulled kernels is drastically lower than that of whole‐grains (Nuss and Tanumihardjo Citation2010; USDA Citation2020). Except wheat, maize contains more fiber than all the other main staple foods ().
Whole kernel maize is relatively low-fat food, with 4–6% fat content (USDA Citation2020), which is higher compared to the fat content of other main foods, coming second after soybean (). Most of the fat (nearly 85% of the total kernel oil) is located in the germ, which contains about 45–50% of oil that is obtained from wet milling process (Orthoefer et al. Citation2003). Oil content can therefore be increased by germ size. Some mutants, such as floury‐2, sugary‐2, and opaque‐2, have higher oil percentages (6%) due to increased germ‐to‐endosperm ratios. Maize oil contains 14% saturated fatty acids (SAFAs), 30% monounsaturated fatty acids (MUFAs), and 56% polyunsaturated fatty acids (PUFAs). The refined maize oil contains 54–60% linoleic acid, 25–31% oleic acid, 11–13% palmitic acid, 2–3% stearic acid and 1% linolenic acid (CRA Citation2006). Even though total maize kernel fat level is relatively low, its high linoleic acid content makes maize oil marketable as a superior product because it is both essential and good for heart’s health (Krauss et al. Citation2000). Maize oil also aids in the absorption of other dietary fats and fat‐soluble vitamins. With almost twice the amount of the fat that rice and wheat have combined, populations who consume maize as a primary food source are recommended to eat whole‐kernel products in order to take advantage of the germ's oil contributions to health (Nuss and Tanumihardjo Citation2010; USDA Citation2020).
3.2. Micronutrients
3.2.1. Minerals
Maize germ contains nearly 80% of the kernel's minerals and the endosperm has less than 1%. Potassium, phosphorus (in the form of phytate), and magnesium are the most prevalent minerals found in maize, making up nearly 85% of kernel mineral content. The fourth most abundant element is sulfur, mostly present in an organic form as a constituent of methionine and cystine. Zinc levels are around 20 μg/g, 30% of which resides in the kernel endosperm. Calcium approximates 7 μg/g and iron 20 μg/g, but the concentrated germ phytate levels retard the bioavailability of these minerals (Nuss and Tanumihardjo Citation2010; USDA Citation2020). Among the main world’s staples, wheat and soybean are richer in minerals than maize ().
3.2.2. Vitamins
Typical maize contains vitamins E, K, B1 (thiamin), B2 (niacin), B3 (riboflavin), B5 (pantothenic acid), B6 (pyridoxine) and B9 (folic acid) (Kumar and Jhariya Citation2013). Yellow maize usually contains many important vitamins, predominantly two fat‐soluble vitamins, vitamin A, as provitamin A carotenoids, and vitamin E, as tocopherols. White maize has low levels of total carotenoids and does not have provitamin A carotenoids, common yellow maize has up to 66 µg/g of total carotenoids and typically has less than 2 µg/g of provitamin A carotenoids, while the first generation of biofortified orange maize varieties contain 6–9 µg/g provitamin A carotenoids (Pixley et al. Citation2013). Recently developed red and orange maize varieties have β-carotene levels between 15 µg/g (HarvestPlus Citation2007) and 25 µg/g (USDA Citation2007). The two main forms of vitamin E present in our diet are alpha (α) and gamma (γ) tocopherols. Maize oil is among the rich sources of these tocopherols, especially γ-tocopherol and their reported concentration was 21.3 and 94.1 mg/100 g, respectively (Sen et al. Citation2006). About 94% of total maize tocopherols are found almost exclusively in germ oil, their content is positively correlated with oil content, and therefore, refined corn oil contains high concentrations of vitamin E (14.8 mg/100 g) (Nuss and Tanumihardjo Citation2010). Water‐soluble vitamins are found in the endosperm and germ, although the highest concentrations are in the aleurone layer. Kernel endosperm contains 80% of the niacin, followed by 4% in the seed coat, and 2% in the germ. Compared with wheat grains, maize contains marginally less thiamin, and about half as much pantothenic acid, folic acid, and choline. Ascorbic acid levels are scanty and vitamin B‐12 is absent from kernels (Nuss and Tanumihardjo Citation2010).
3.3. Phytochemical compounds
Phytochemicals are bioactive chemical compounds naturally present in plants that provide human health benefits and have the potential for reducing the risk of major chronic diseases (Liu Citation2004). Maize is an essential source of various major phytochemicals such as carotenoids, phenolic compounds, and phytosterols (Lopez-Martinez et al. Citation2009).
Carotenoids belong to a family of red, orange, and yellow pigments, categorized into two groups; carotenes (eg. β-carotene, α-carotene) and xanthophylls (eg. β-cryptoxanthin, lutein, zeaxanthin). β-carotene, α-carotene and β-cryptoxanthin are important precursors of vitamin A in humans (Demeke Citation2018). Maize grain carotenoid concentrations are among the highest in cereals (Howitt and Pogson Citation2006). Yellow maize grains contain a large quantity of carotenoid pigments (0.57 to 2.20 mg/100g (Shah et al. Citation2016); 11.43 to 27.62 μg/g (Demeke Citation2018), especially in horny and floury endosperm (Liu Citation2007). But there is a considerable variation among different varieties: α-carotene, β-carotene and β-cryptoxanthin are the main provitamin A carotenoids in yellow maize endosperm, but their concentrations are generally low, ranging from 0 to 1.3, 0.13 to 2.7 and 0.13 to 1.9 nmol/g, respectively (Demeke Citation2018; Kurilich and Juvik Citation1999). One of the best advantages of plant-based carotenoids is that there are safer limits to the amount that can be safely consumed, in contrast to the toxicity that can be caused by excessive intake of preformed vitamin A (Tanumihardjo Citation2008).
Phenolic compounds include phenolic acids, flavonoids, stilbenes, coumarins and tannins, and are abundantly present in maize, especially in the bran. The major phenolic compounds from maize are ferulic acid (174 mg/100g) and anthocyanins (141.7 mg/100g). Maize kernels content other flavonoid compounds, major pigment‐determining molecules known as anthocyanins. They vary from red to blue in color, giving some maize varieties an almost black or red appearance. Flavonoids are not considered essential nutrients, but are strongly recommended for optimal health due to their potent antioxidant properties (Gropper et al. Citation2005).
Phytosterols also called as plant sterols are the essential components of plant cell walls and membranes. The most commonly found phytosterols from maize oil are sitosterol (9.91 mg/100g), stigmasterol (1.52 mg/100g), and campesterol (3.40 mg/100g). Their distribution varies in different fractions of maize kernel such as endosperm, pericarp, and germ (Harrabi et al. Citation2008). Except vitamin E, corn oil also contains significant amounts of ubiquinone (Q10) and phytosterols, increasing its shelf life and making it effective for lowering cholesterol levels (Dupont et al. Citation1990; Maki et al. Citation2015).
3.4. Contribution to human nutrient requirements
The popularity of maize as a crop is largely due to its diverse functionality as a food source for both humans and animals. Kernels can be consumed off the cob, parched, boiled, fried, roasted, ground, and fermented for use in breads, porridges, gruels, cakes, and alcoholic beverages (Nuss and Tanumihardjo Citation2010). It is reported that maize delivers almost 30% of the daily calories for >4.5 billion individuals in 94 low-income countries (Nyaligwa et al. Citation2017; Oyewo Citation2011). The estimated amount of provitamin A that needs be consumed to result in 1 μg of active vitamin A (retinol) is 12 μg for β‐carotene (12:1 retinol activity equivalency ratio) and 24 μg for α‐carotene and β‐cryptoxanthin (24:1 retinol activity equivalency ratio) (Institute of Medicine Citation2001). A tablespoon of maize oil satisfies the requirements for essential fatty acids for a healthy child or adult (CRA Citation2006). A moderate dietary intake of 5 to 15 g of maize oil per day meets the essential fatty acid requirement for most people (1% to 3% dietary calories) and one tablespoon supplies 15% of the daily vitamin E requirement. The fiber content in maize represents 42 and 64% of the adequate daily intake for men and women, respectively (Nuss and Tanumihardjo Citation2010). However, there is no information on how much does maize foods consumed in E&SA contributes to nutrient requirements of these populations.
4. Contribution of maize to daily nutrient requirements of Eastern and Southern Africans
To understand more precisely the contribution of maize in nutrition of women and children in E&SA, we compiled nutritional composition data of 59 maize-based foods from 8 available food composition tables. Only the foods made from maize solely, without adding any mixed or complement food, and ready-to-eat meals or food products were selected (). It is worth noting that there is a considerable gap in the food composition tables of countries in E&SA. Out of the 17 countries in the regions, only 8 have food composition tables; some of them are freely available online, while full access to the South African table must be purchased. Moreover, last update dates of the available tables greatly varies among the countries, from 2018 for Kenya to 1998 for Ethiopia. Likewise, the number of maize foods in the available tables varies from 1 in Mozambique, to 16 in Uganda. Also, the food components that are analyzed are not the same in all the tables. For instance, Lesotho table is complete, with 31 entries, while Uganda table misses sugars, most of the minerals and the fatty acids; Zambia table shows only the contain of calcium and iron among the 10 reported minerals, and 3 among the 11 reported vitamins. As stated by (De Bruyn et al. Citation2016), there are current limitations of food composition data in resource-poor countries, and opportunities to improve existing resources need to be more actively explored and supported. There is a critical need to establish or update the table for many countries, diversify the foods that are analyzed, harmonize the components that are tested and reported, and make the data more accessible.
Table 3. Maize-based foods from food composition tables from Eastern and Southern Africa.
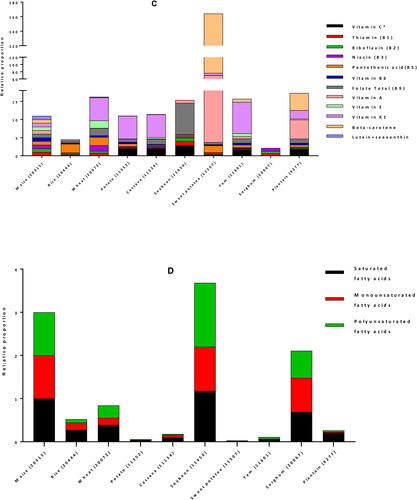
We then used the Dietary Reference Intakes (DRIs) for children (1–3 years) and women (19–50 years) (Institute of Medicine Citation2006) to calculate the percent contribution of 100 g edible portion maize-based foods to the daily nutrient requirement of individuals of vulnerable groups: women and children. The DRI values for energy were 3969 and 8100 kJ/day, for children and women, respectively (Kruger et al. Citation2015). In average, a 100 g portion maize food in E&SA can provide 20% of the energy requirement of a child, 40% of its protein needs, more than half (53%) of its magnesium demand, and between 25 to 50% of its needs in carbohydrates, zinc, vitamin B1 and vitamin B6. It can supply between 10 to 25% of DRI of fiber, iron, phosphorous, potassium, copper, manganese, and vitamins B2, B3, B5 and B9. The contributions in fat, calcium, sodium, selenium, and vitamins C, A and E are less than 10% low (). Similarly, for an adult woman, 34% of carbohydrates requirements and between 10 to 25% of DRI of energy, proteins, fiber, magnesium, phosphorus, zinc, and vitamins B1 and B6 can be provided by 100 g of maize. The supply of all the other nutrients, including fats (total fat and the individual fatty acids: SAFAs, MUFAs and PUFAs) is less the 10% of the DRI ().
Figure 4. Contribution of 100 g edible portion maize-based foods to dietary reference intakes of energy and nutrients for children (A) and women (B) in Eastern and Southern Africa. Nutritional composition data of 59 maize-based foods were obtained from food composition tables of 8 countries and Dietary Reference Intakes (DRIs) for children (1–3 years) and women (19–50 years) from (Institute of Medicine Citation2006) were used to calculate their percentage of contribution to daily nutrient intake requirement.
Considering that the per capita consumption of maize in these regions is generally very high (), these calculated values nearly reflect the reality in Botswana (maize consumption is 103 g/person/day) but they can be multiplied by 1.1 times (Namibia) to 4.4 times (Lesotho), except for Madagascar and Rwanda, where consumption is less than 100 g/person/day. Besides, although there is no recent official data of per capita maize consumption for children in these regions, available reports show that children daily consumption is above 100 g. In Zambia for instance, the quantity of maize meals consumed daily was 172 g for children 2–5 years in Mkushi and Nyimba provinces (Hotz et al. Citation2011), 118 to 130 g for children aged 1–5 years in rural areas of Chongwe District (Chomba et al. Citation2015), and 200 g for children aged 4–8 years in Mkushi District (Palmer et al. Citation2016). In South Africa, maize porridge daily consumption was 264 and 437 g for urban and rural children, respectively (Steyn et al. Citation2008). These data suggest that the values we obtained for 100 g maize can be multiplied up to more than 4 times, to reflect the actual contribution of maize to daily nutrient intake requirement of children. Hence, taking into account the lowest maize per capita consumption in Zambia (316 g for adults and 120 g for children), and in South Africa (275 g for adults and 264 g for children), with the food composition table of each of these country, case studies of maize contribution in energy and nutrient requirements were computed and presented below in for Zambia and for South Africa.
Figure 5. Contribution of maize-based foods to dietary reference intakes of energy and nutrients for children (A) and women (B) in Zambia. Nutritional composition data of 4 maize-based foods were obtained from Zambia Food Composition Tables (National Food and Nutrition Commission Citation2009), then food consumption data from literature and Dietary Reference Intakes (DRIs) for children (1–3 years) and women (19–50 years) from (Institute of Medicine Citation2006) were used to calculate their percentage of contribution to daily nutrient intake requirement.
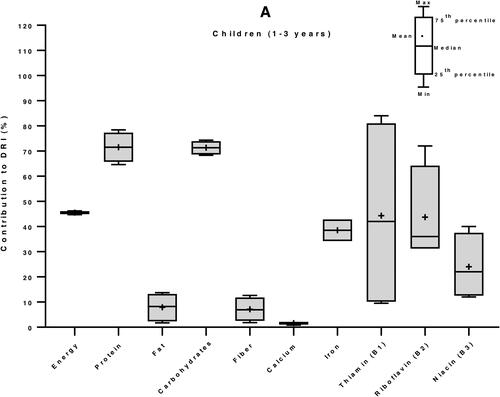
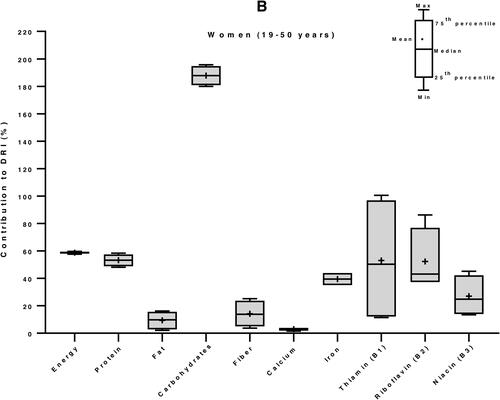
Figure 6. Contribution of maize-based foods to dietary reference intakes of energy and nutrients for children (A) and women (B) in South Africa. Nutritional composition data of 7 maize-based foods were obtained from South Africa Food Composition Tables (SAFOODS Citation2017), then food consumption data from literature and Dietary Reference Intakes (DRIs) for children (1–3 years) and women (19–50 years) from (Institute of Medicine Citation2006) were used to calculate their percentage of contribution to daily nutrient intake requirement.
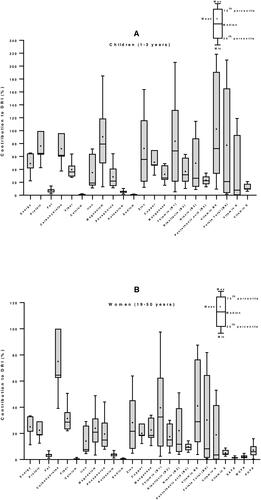
The results show that in Zambia, maize meals can provide 25 to 75% of dietary needs of energy, protein, iron and vitamins B1, B2 and B3, in both children and women. Surprisingly, it is observed that maize meals can supply as high as 187% of the carbohydrates requirement of and adult Zambian woman and 71% of a child (). In South Africa, the highest contribution of maize meals to nutrients in children were 102% for vitamin B6, 90% for magnesium, and 83% for vitamin B1. Maize could supply between 10 to 75% of the other nutrients, except total fat, calcium, potassium, sodium and the fatty acids, where it was less than 10%. A similar trend was observed with adult women, but with lesser contribution: 75% of carbohydrates, between 10 to 40% of the other nutrients, and less than 10% of fat, calcium, potassium, sodium, vitamin B5, vitamin E, and the fatty acids ().
Although maize kernels can supply appreciable amount of many macro‐ and micronutrients necessary for human metabolic needs, the amounts of some essential nutrients are imbalanced or inadequate for consumers whose major food source is maize (Nuss and Tanumihardjo Citation2010). Our analysis shows that in some cases like in South African children calcium deficiency (75%), this high prevalence corroborates the very low supply of calcium by maize meals consumed by the children (1%). On the contrary, zinc deficiency in children (25%) does not agree with the 72% contribution of maize meals alone to zinc requirements ( and ). It appears that malnutrition remains a major public health problem in E&SA where maize is the dietary staple while its nutritional composition demonstrates that it has a great potential in satisfying the dietary requirement of some keys nutrients. This contradictory situation can be explained by nutrients loss due to processing practices and reduced nutrients bioavailability.
Primary processing operations like dehulling, degerming, milling, refining, polishing, etc., and cooking, alter the nutritional composition of resultant product and the food, to varying degrees (Oghbaei and Prakash Citation2016; Suri and Tanumihardjo Citation2016). Not only a loss of nutrients occur during these processing operations, but they could also influence the nutrient availability in vivo, by modifying the matrices in which nutrients are embedded in a grain (Oghbaei and Prakash Citation2016). In SSA, dehulling of maize grain before grinding is a common food processing practice (Ekpa et al. Citation2019). This milling technique that removes the outer layers or pericarp of grain by abrasion is useful for improving texture and digestibility (Oghbaei and Prakash Citation2016). It also helps in reducing aflatoxins contamination, as the removed layers are the most susceptible regions to fungal growth and aflatoxins accumulation (Siwela et al. Citation2005). Moreover, the process of dehulling maize also involves breaking the maize grain into smaller parts, with loss of some germ, leading to an unwanted degerming effect (Kikafunda et al. Citation2006). However, maize pericarp and the germ are rich in important nutrients which are loss during dehulling and degerming: 80% of the kernel's minerals and almost 94% of maize tocopherols are found in the germ, and fibers make up 87% of the pericarp (Nuss and Tanumihardjo Citation2010). In general, the majority of B vitamins are lost during storage, milling, soaking and cooking, while bioavailability of riboflavin and niacin can increase after fermentation and nixtamalization (soaking in alkaline solution). Degerming increase the concentration of carotenoids, found mainly in the kernel endosperm, while other vitamins and minerals, found mainly in the germ, are reduced (Suri and Tanumihardjo Citation2016). Accurate and specific data on nutrient loss during processing of maize in E&SA are needed for a more refined analysis. Additionally, processing methods that improve mineral bioavailability such as soaking, fermenting, cooking, and nixtamalization can also reduce anti-nutritional factors like phytic acid (Suri and Tanumihardjo Citation2016). Therefore, adequate processing methods can contribute in preserving the nutrients in the final meal, while reducing the amounts of anti-nutritional factors.
In fact, anti-nutritional factors contained in maize, can reduce availability of maize nutrients for human consumption. Anti-nutritional factors may act by binding essential nutrients leading to nutrients not being fully accessible or digested, or by inhibiting certain enzymes needed for normal functioning or the absorption of minerals and vitamins by humans (Mabhaudhi and Modi Citation2013). Phytic acid in the germ of the maize kernel (O’Dell et al. Citation1972) is the main iron absorption inhibitors due to the complexing action of phytate on divalent and trivalent metal cations (Makower Citation1970). Also, calcium from lime used to treat maize flour in some forms of the nixtamalization process inhibit absorption iron and other minerals like zinc, manganese and copper by competing for absorption in the intestine (Lönnerdal Citation2010). Moreover, iron absorption, particularly the non-heme iron present in maize, can be inhibited by some components or foods in the diet, such as oxalates in vegetables and tea, polyphenols in coffee, phosvitin in eggs, and calcium in milk (Nuss and Tanumihardjo Citation2010). The content and activity of anti-nutritional factors in the foods could contribute in the existence of hidden hunger in countries where maize is the exclusive staple food. Consequently, there is a need for such populations, to consume maize with improved nutritional quality and different strategies have been developed to improve maize-rich diet and health of populations in E&SA.
5. Strategies to improve maize diet for reducing micronutrient deficiencies
Lack of access to a balanced diet and variety of foods, plant-based foods with low mineral bioavailability and unawareness of good nutritional practices are among the factors responsible for MNDs (Welch and Graham Citation2004). Efforts have been made to reduce MNDs in human populations by improving the nutritional quality of food crops at different levels of food chain using different approaches like biofortification of seed, pre-planting mineral amendments to soils and water, post-harvest preservation of vitamins, preservation of minerals in processing, fortification of food with essential minerals during processing, consumer education and subsidies or taxes to change relative prices among food groups (Barrett and Bevis Citation2015). For improving maize diet quality, complementation with other foods has been recommended, as well as nutrients supplementation through complementary tablets and capsules has been used in public health programmes of many African countries.
5.1. Fortification
Fortification, a process of adding micronutrients to food, has been shown to improve considerably the nutrient intake across many areas in SSA. With the aim to improve micronutrient intake of the South African population, mandatory fortification of both maize meal and wheat flour (used to make bread) was implemented in 2003 as part of the National Food Fortification Programme (Department of Health South Africa Citation2003). As result, significant increase by about 10% in 1‐ to 9‐year‐old children intake of vitamin A, thiamin, niacin, vitamin B6, folic acid and iron was observed, particularly important in rural areas (12.4% increase) where children have the lowest mean dietary micronutrient intake (Steyn et al. Citation2008). Likewise, it was observed that in a cohort of children of 12 months age, 51.4% of consumers of fortified maize and wheat staples had adequate intakes for all eight fortificant nutrients (calcium, iron, zinc, vitamin A, thiamin, niacin, vitamin B6 and folate), while only 25.0% of non-consumers were adequate (Swanepoel et al. Citation2019).
However, despite fortification, nutrient gaps remain, especially low calcium intakes with 6‐ to 24‐month‐old children in South Africa (Swanepoel et al. Citation2019). The authors recommended that targeted fortification of staple foods for infants and young children in combination with dietary diversification and use of fortified complementary should be included in strategies to improve nutrient content of the complementary diet. But none of these approaches has been very successful in low-income countries (Stein Citation2010) because of lack of stable government policies and suitable infrastructure to distribute fortified food and supplements, and funding (Misra et al. Citation2004). Therefore, breeding for mineral-rich cereal crops such as maize by biofortification maybe a sustainable and cost-effective approach to lower MNDs (Akhtar et al. Citation2018).
5.2. Biofortification
Biofortification is a process of increasing the density of vitamins and minerals in a crop through plant breeding, transgenic techniques, or agronomic practices. It is a feasible and cost-effective means of delivering micronutrients to populations that may have limited access to diverse diets and other micronutrient interventions. Through biofortification, breeding targets of micronutrients were achieved with an increase of provitamin A in maize from zero to the required content of 15 ppm (Bouis and Saltzman Citation2017). As much as $17 of benefits may be gained for every dollar invested in biofortification (Hoddinott et al. Citation2012). Biofortified staple crops, when consumed regularly, will generate measureable improvements in human health and nutrition (Bouis and Saltzman Citation2017). Biofortification interventions have the potential to combat malnutrition and maize has been identified as one of the key staple crops for biofortification to reduce hidden hunger in Africa (Zuma et al. Citation2018). Interventions with maize foods biofortified with vitamin A, selenium and zinc have shown benefits in different countries of E&SA, especially in Zambia.
With the aim of alleviating hidden hunger in developing countries, biofortification of plants food to improve vitamin A content in staple crops such as maize, sweet potatoes and wheat was introduced by HarvestPlus (Egesel et al. Citation2003). HarvestPlus is a global consortium co-led by the International Food Policy Research Institute and the International Center for Tropical Agriculture that has promoted and released provitamin A maize (PVAM) in many SSA countries. PVAM is an orange maize product of breeding maize with a high provitamin A content and is one of the successfully introduced product to combat VAD in Africa. Studies have shown that provitamin A from biofortified crops is highly bioavailable and has the capacity to improve vitamin A status of vulnerable groups, especially women and children (Manjeru et al. Citation2017). In Zambia, it was demonstrated that after 3 months of consumption of biofortified orange maize, the total body reserves of vitamin A (measured by the paired 13C-retinol isotope dilution test) in 5–7-year-old children increased significantly compared with those in the control group. Improvement of total body vitamin A stores due to consumption of orange maize was as effective as vitamin A supplementation (Gannon et al. Citation2014), and a significant improvement of visual function in marginally vitamin A deficient children was also demonstrated (Palmer et al. Citation2016). Biofortification could therefore avoid the potential for hypervitaminosis A that was observed with the use of preformed vitamin A from supplementation and fortification (Gannon et al. Citation2014).
Lack of Se-rich soil being the main cause of poor Se content in food, agronomic biofortification of maize using Se-enriched fertilizers has been proposed as a cost-effective strategy to alleviate Se deficiency in Malawi (Chilimba et al. Citation2012; Phiri et al. Citation2019). Agronomic biofortification strategy could reduce the prevalence of inadequate dietary Se supplies from 82 to 14% of households living in areas with low-pH soils, and from 95 to 21% for the poorest subset of those households (Joy et al. Citation2015). Based on response of maize to Se-enriched fertilizers and national maize consumption patterns, it was estimated that an application of 5 g Se/ha to maize crops in Malawi would increase dietary Se intake by 26 to 37 μg Se/person/day (Chilimba et al. Citation2012). Enriching currently used fertilizer in Malawi with Se will reduce the prevalence of inadequate Se supplies from 82 to 57%, and the cost per alleviated case of dietary Se deficiency will be approximately USD 0.36 per year (Joy et al. Citation2015).
Total daily zinc intake of rural Zambian children aged around 29 months was significantly higher for the biofortified maize (5.0 mg/day) than the control maize (2.3 mg/day) but did not significantly differ from the fortified maize (6.3 mg/day), which was as well higher than the control maize. Biofortification was also shown to improve mineral absorption: total daily absorption of zinc (measured by a dual isotope ratio technique) from the biofortified maize (1.1 mg/day) did not significantly differ from the fortified maize (1.2 mg/day), but both were higher than for the control maize (0.6 mg/day). These demonstrated that feeding biofortified maize to vulnerable populations can meet their zinc requirements and provide an effective dietary alternative to regular maize (Chomba et al. Citation2015).
Biofortified crops have received considerable acceptance by most communities. In rural Zambia for example, negative perceptions associated with yellow maize do not affect orange maize, which is well liked (Manjeru et al. Citation2017). However, it was observed that in South Africa, the failure of most nutrition interventions in reducing hunger is due to exclusion of rural communities, who mainly rely on agriculture. Therefore, inclusive strategy, based on smallholder farming systems could be more promising (Zuma et al. Citation2018). More than 20 million people in farm households in developing countries are now growing and consuming biofortified crops (Bouis and Saltzman Citation2017). On the other hand, biofortification of a given crop usually focuses on a single nutrient and therefore cannot address multiple MNDs. Diet diversity in this case appears as good paired solution.
5.3. Complementation with other foods (diet diversification)
Many evidences support that vegetables in general, and traditional vegetables in particular, are rich in micronutrients and other health-promoting phytochemicals and therefore, can complement staple foods and improve nutritional quality of diets in Africa (Hughes and Keatinge Citation2013; Keatinge et al. Citation2015; Ojiewo et al. Citation2013; Weinberger and Swai Citation2006; Yang et al. Citation2013). Integrating micronutrient-rich foods such as vegetables, fruits and some animal products into diets has been found to be one of the most practical and sustainable ways to alleviate micronutrient deficiency, through increased dietary diversity (Ali Citation2015). Consumption of diverse vegetables either alone or in combination with other foods, significantly improves nutrition by providing diverse minerals, micronutrients and vitamins (Hounsome et al. Citation2008; Uusiku et al. Citation2010).
In a study in 300 farm households in 10 villages located in 3 districts of Tanzania, it was observed that diversifying diets through increased crop diversification positively influence household dietary diversity, particularly with smallholders who receive crop income less than the average crop income threshold. The authors recommended that crop diversification should be encouraged within maize-based farming systems of the study location, through integration of micronutrient-rich foods such as vegetables (Rajendran et al. Citation2017). Similarly in South Africa, the amount of bioaccessible iron and zinc increased in the maize porridge composite meals, made of combining maize porridge with South African green leave vegetables (Kruger et al. Citation2015).
Consuming only maize as staple food might provide sufficient energy, but will not improve nutritional outcomes if not consumed in conjunction with other micronutrient-rich foods (Johns and Eyzaguirre Citation2007; Kennedy et al. Citation2007). The conjunction of nutrients is required not only for optimal absorption, but also for synergistic functionality of the nutrients in the organism. For example, calcium absorption and metabolism involves other nutrients including protein, vitamin D, and phosphorus (Beto Citation2015). Ascorbic acid enhances iron absorption (Hurrell Citation2002). However, accessibility to expensive vegetable-rich diet is not always guarantee, especially for poor rural communities and this constitutes an obstacle for dietary diversity approach.
5.4. Challenges and risks of excessive intake
Many strategies are being implemented to prevent or alleviate MNDs among children under-five in LMICs. Besides biofortification and diversification of diet, there are also single and multiple micronutrient (MMN) supplementation, lipid-based nutrient supplementation (LNS), targeted and large-scale fortification, and point-of-use-fortification with micronutrient powders (MNPs). There are evidences of importance and efficiency of all these intervention strategies. However, when selecting one or more appropriate interventions, population and context should be taken into account: cost, feasibility of implementation, strategies for monitoring and evaluation, and population-specific factors including gender-related barriers to uptake and prevalence of deficiencies at a sub-national level (which are often masked by national-level estimates) (Tam et al. Citation2020).
There is a necessity of coordination between the different intervention programmes, in order to avoid overlapping, which may lead to nutrients over-supplementation. For instance, in a sample of 133 Zambian children, 59% were diagnosed with hypervitaminosis A and 16% had biomarkers of intoxication. Similarly, 72.5% among 40 South African children who frequently consumed liver had high level of intoxication biomarkers resulting from hypervitaminosis A. These were due to mandatory fortified foods coupled to high percentage of targeted supplementation in preschool children, implemented in these countries (Tanumihardjo et al. Citation2019).
There is also a potential risk when nutrient supplementation occurs in the context of high levels of pathogen infection. Iron supplementation can lead to enhanced pathogen growth from increased availability of iron in blood and unabsorbed iron in the gut. This can result in increased infectious risk in the absence of monitoring and treatment programs, especially when infants and children are involved. Therefore, interventions to improve iron intake should be targeted to strictly iron-deficient subjects (Mwangi et al. Citation2017). This emphasizes the necessity of precise measurement of iron deficiency in children (Muriuki et al. Citation2020).
6. Conclusion
A staple food crop like maize in a region with high prevalence of MNDs remains a key component of any programme or strategy for reducing the burden of deficiencies. Despite considerable progress that have been achieved, a number of challenges remain. Consuming only maize as staple food might provide sufficient energy, but will not improve nutritional outcomes if not consumed in conjunction with other micronutrient-rich foods. Currently, maize foods consumed in E&SA can meet only one third of carbohydrates needs of adult women, and less than a quarter of their requirements for the other nutrients. For children the nutrients provision from maize meals can satisfy half of their demands of magnesium, a fifth of their energy requirement, and between 25 to 50% of their needs in proteins, carbohydrates, zinc, vitamin B1 and vitamin B6. But, maize cannot meet the children daily requirement for total fats and fatty acids, calcium, sodium, selenium, and vitamin C, A and E. With proper policy frameworks, full commercialization and efforts toward more social adoption, the problem of vitamin A deficiencies among these populations can possibly be addressed by shifting consumption from white maize to provitamin A-rich orange maize. For the other nutrients, agricultural and food diversification, fortification and biofortification will continue improve dietary quality and health outcome of populations. Improvement of processing methods and promotion of consumption of whole-grain maize products instead of degermed and refined products are needed for mitigating losses of micronutrients during processing as well as controlling anti-nutritional factors in meals. For all these strategies to be efficiently measured and monitored, food composition tables for many countries of E&SA must be established or updated, enriched with analyses of various foods, and consistency in data reporting and accessibility must be ensured. The effects of different processing methods on nutrient loss, reduction of anti-nutritional factors and bioavailability of nutrients of maize in E&SA need to be deeply understood. Successfully eradicating MNDs in E&SA will require multiple approaches including diet diversification, bio and other forms of fortification and targeted supplementation must be considered, which must be carefully coordinated and monitored to avoid excess nutrient intake. Furthermore, the approaches must take into consideration biological, pathological and dietary factors that will influence intake, compliance and biological effects.
Additional information
Funding
References
- Akhtar, S., G. Osthoff, K. Mashingaidze, and M. Labuschagne. 2018. Iron and zinc in maize in the developing world: Deficiency, availability, and breeding. Crop Science 58 (6):2200–14. doi: 10.2135/cropsci2018.02.0133.
- Akombi, B. J., K. E. Agho, D. Merom, A. M. Renzaho, and J. J. Hall. 2017. Child malnutrition in sub-Saharan Africa: A meta-analysis of demographic and health surveys (2006–2016). PLoS One 12 (5):e0177338. doi: 10.1371/journal.pone.0177338.
- Alamu, E. O., T. Gondwe, J. Akello, N. Sakala, G. Munthali, M. Mukanga, and B. Maziya-Dixon. 2018. Nutrient and aflatoxin contents of traditional complementary foods consumed by children of 6–24 months. Food Science & Nutrition 6 (4):834–42. doi: 10.1002/fsn3.621.
- Ali, J. 2015. Adoption of diversification for risk management in vegetable cultivation. International Journal of Vegetable Science 21 (1):9–20. doi: 10.1080/19315260.2013.813891.
- Awobusuyi, T. D., M. Siwela, U. Kolanisi, and E. O. Amonsou. 2016. Provitamin A retention and sensory acceptability of amahewu, a non-alcoholic cereal-based beverage made with provitamin A-biofortified maize. Journal of the Science of Food and Agriculture 96 (4):1356–61. doi: 10.1002/jsfa.7230.
- Babu, R., N. Palacios, and B. Prasanna. 2013. Biofortified maize - A genetic avenue for nutritional security. In Translational genomics for crop breeding, 161–76. Chichester, UK: Wiley. 10.1002/9781118728482.ch10.
- Bailey, R. L., K. P. West, and R. E. Black. 2015. The epidemiology of global micronutrient deficiencies. Annals of Nutrition and Metabolism 66 (Suppl. 2):22–33. doi: 10.1159/000371618.
- Barrett, C. B., and L. E. M. Bevis. 2015. The micronutrient deficiencies challenge in African Food systems. In The Fight Against Hunger and Malnutrition, ed. D. E. Sahn, 61–88. Oxford: Oxford University Press. doi: 10.1093/acprof:oso/9780198733201.003.0004.
- Beal, T., E. Massiot, J. E. Arsenault, M. R. Smith, and R. J. Hijmans. 2017. Global trends in dietary micronutrient supplies and estimated prevalence of inadequate intakes. PLoS One 12 (4):e0175554. doi: 10.1371/journal.pone.0175554.
- Beto, J. A. 2015. The role of calcium in human aging. Clinical Nutrition Research 4 (1):1–8. doi: 10.7762/cnr.2015.4.1.1.
- Bouis, H. E., and A. Saltzman. 2017. Improving nutrition through biofortification: A review of evidence from HarvestPlus, 2003 through 2016. Global Food Security 12:49–58. doi: 10.1016/j.gfs.2017.01.009.
- Chilimba, A. D. C., S. D. Young, C. R. Black, M. C. Meacham, J. Lammel, and M. R. Broadley. 2012. Agronomic biofortification of maize with selenium (Se) in Malawi. Field Crops Research 125:118–28. doi: 10.1016/j.fcr.2011.08.014.
- Chilimba, A. D. C., S. D. Young, C. R. Black, K. B. Rogerson, E. L. Ander, M. J. Watts, J. Lammel, and M. R. Broadley. 2011. Maize grain and soil surveys reveal suboptimal dietary selenium intake is widespread in Malawi. Scientific Reports 1:72. doi: 10.1038/srep00072.
- Chomba, E., C. M. Westcott, J. E. Westcott, E. M. Mpabalwani, N. F. Krebs, Z. W. Patinkin, N. Palacios, and K. M. Hambidge. 2015. Zinc absorption from biofortified maize meets the requirements of young rural Zambian children. The Journal of Nutrition 145 (3):514–9. doi: 10.3945/jn.114.204933.
- CRA. 2006. Corn oil. 5th ed. Washington, DC: CRA.
- Darnton-Hill, I., and U. C. Mkparu. 2015. Micronutrients in pregnancy in low- and middle-income countries. Nutrients 7 (3):1744–68. doi: 10.3390/nu7031744.
- De Bruyn, J., E. Ferguson, M. Allman-Farinelli, I. Darnton-Hill, W. Maulaga, J. Msuya, and R. Alders. 2016. Food composition tables in resource-poor settings: Exploring current limitations and opportunities, with a focus on animal-source foods in sub-Saharan Africa. British Journal of Nutrition 116 (10):1709–19. doi: 10.1017/S0007114516003706.
- Demeke, K. H. 2018. Nutritional quality evaluation of seven maize varieties grown in Ethiopia. Biochemistry & Molecular Biology 3:45–8. doi: 10.11648/j.bmb.20180302.11.
- Department of Health South Africa. 2003. Regulations relating to the fortification of certain foodstuffs (Government notice no. R504). Government Gazette, 2475. Accessed April 7, 2003. http://faolex.fao.org.
- Dupont, J., P. J. White, M. P. Carpenter, E. J. Schaefer, S. N. Meydani, C. E. Elson, M. Woods, and S. L. Gorbach. 1990. Food uses and health effects of corn oil. Journal of the American College of Nutrition 9 (5):438–70. doi: 10.1080/07315724.1990.10720403.
- Earle, F. R., J. J. Curtis, and J. E. Hubbard. 1946. Composition of the component parts of the corn kernel. Cereal Chemistry 23:504–11.
- Egal, A., and W. Oldewage-Theron. 2018. Association of micronutrients and child growth in children aged 7–15 years from Qwa-Qwa. South African Journal of Clinical Nutrition 31 (3):62–6. doi: 10.1080/16070658.2017.1392743.
- Egesel, C. O., J. C. Wong, R. J. Lambert, and T. R. Rocheford. 2003. Gene dosage effects on carotenoid concentration in maize grain. Maydica 48:183–90.
- EHNRI. 1998. Food composition table for use in Ethiopia part IV. Addis Ababa, Ethiopia: Ethiopian Health and Nutrition Research Institute.
- Ekpa, O., N. Palacios-Rojas, G. Kruseman, V. Fogliano, and A. R. Linnemann. 2019. Sub-saharan African maize-based foods - Processing practices, challenges and opportunities. Food Reviews International 35 (7):609–39. doi: 10.1080/87559129.2019.1588290.
- Faber, M., P. J. van Jaarsveld, E. Kunneke, H. S. Kruger, S. E. Schoeman, and M. E. van Stuijvenberg. 2015. Vitamin A and anthropometric status of South African preschool children from four areas with known distinct eating patterns. Nutrition 31 (1):64–71. doi: 10.1016/j.nut.2014.04.024.
- Fairweather-Tait, S. J., Y. Bao, M. R. Broadley, R. Collings, D. Ford, J. E. Hesketh, and R. Hurst. 2011. Selenium in human health and disease. Antioxidants & Redox Signaling 14 (7):1337–83. doi: 10.1089/ars.2010.3275.
- FAO/CIMMYT. 1997. White maize: A traditional food grain in developing countries. Food and Agriculture Organization of the United Nations and International Maize and Wheat Improvement Center. Accessed September 2009. http://www.fao.org/docrep/W2698E/W2698E00.htm.
- FAO. 2020. Food and Agriculture Organization of the United Nations. Rome, Italy: FAOSTAT database. Accessed May 15, 2020. http://www.fao.org/faostat/en/#home.
- FAO. 2018. The state of food security and nutrition in the world 2017. Building resilience for peace and food security. Rome: FAO, IFAD, UNICEF, WFP and WHO.
- FAO. 1996. Rome declaration on world food security. Accessed February 26, 2019. http://www.fao.org/wfs/index_en.htm.
- FAO. 1992. Maize in human nutrition. Rome: Food & Agriculture Organization of the United Nations.
- FAO & Government of Kenya. 2018. Kenya food composition tables. Nairobi: FAO & Government of Kenya.
- Gadaga, T., R. Madzima, and N. Nembaware. 2009. Status of micronutrient nutrition in Zimbabwe: A review. African Journal of Food, Agriculture, Nutrition and Development 9:502–22. doi: 10.4314/ajfand.v9i1.19209.
- Gannon, B., C. Kaliwile, S. A. Arscott, S. Schmaelzle, J. Chileshe, M. Mosonda, K. Pixley, C. Masi, S. A. Tanumihardjo, N. Kalungwana, et al. 2014. Biofortified orange maize is as efficacious as a vitamin A supplement in Zambian children even in the presence of high liver reserves of vitamin. The American Journal of Clinical Nutrition 100 (6):1541–50. doi: 10.3945/ajcn.114.087379.Ensuring.
- Govender, L. 2014. Nutritional composition and acceptance of a complementary food made with provitamin A-biofortified maize. Ph.D. Thesis., University of KwaZulu-Natal, Pietermaritzburg, South Africa.
- Grant, W., A. Wolfaardt, and A. Louw. 2012. Maize value chain in the SADC region. Technical Report, AECOM International Development and USAID, Southern Africa.
- Gropper, S. S., J. L. Smith, and J. L. Groff. 2005. Perspective: Phytochemicals and herbal supplements in health and disease. In Advanced nutrition and human metabolism, ed. E. Howe, E. Feldman, S. Harkrader and M. Roybal, 4th ed., 123–7. Belmont, California: Thomson Wadsworth.
- Guo, X., L. Yuan, H. Chen, S. J. Sato, T. E. Clemente, and D. R. Holding. 2013. Nonredundant Function of Zeins and Their Correct Stoichiometric Ratio Drive Protein Body Formation in Maize Endosperm. Plant Physiology 162 (3):1359–69. doi: 10.1104/pp.113.218941.
- Harashima, A. 2007. Maize and Grace: Africa’s encounter with a new world crop, 1500–2000 - By James C. McCann. The Developing Economies 45 (2):242–5. doi: 10.1111/j.1746-1049.2007.00041_2.x.
- Harrabi, S., A. St-Amand, F. Sakouhi, K. Sebei, H. Kallel, P. M. Mayer, and S. Boukhchina. 2008. Phytostanols and phytosterols distributions in corn kernel. Food Chemistry 111 (1):115–20. doi: 10.1016/j.foodchem.2008.03.044.
- HarvestPlus. 2007. The biofortification challenge programme. Annual report, HarvestPlus program, Washington DC.
- Hoddinott, J. F., M. W. Rosegrant, and M. Torero. 2012. Investments to reduce hunger and undernutrition. Challenge Paper on hunger and malnutrition. Lowell, MA, USA.
- Hotz, C., A. Lubowa, C. Sison, M. Moursi, and C. Loechl. 2012. A food composition table for Central and Eastern Uganda. Washington, DC: Harvest Plus.
- Hotz, C., U. Palaniappan, J. Chileshe, E. Kafwembe, and W. Siamusantu. 2011. Nutrition survey in Central and Eastern Provinces, Zambia 2009: Focus on Vitamin A and maize intakes, and Vitamin A status among women and children. Lusaka and Washington, D.C.
- Hounsome, N., B. Hounsome, D. Tomos, and G. Edwards-Jones. 2008. Plant metabolites and nutritional quality of vegetables. Journal of Food Science 73:48–65. doi: 10.1111/j.1750-3841.2008.00716.x.
- Howitt, C. A., and B. J. Pogson. 2006. Carotenoid accumulation and function in seeds and non-green tissues. Plant, Cell & Environment 29 (3):435–45. doi: 10.1111/j.1365-3040.2005.01492.x.
- Hu, Y., Z. Burucs, and U. Schmidhalter. 2008. Effect of foliar fertilization application on the growth and mineral nutrient content of maize seedlings under drought and salinity. Soil Science & Plant Nutrition 54 (1):133–41. doi: 10.1111/j.1747-0765.2007.00224.x.
- Hughes, J. A., and J. D. H. Keatinge. 2013. The nourished millennium: How vegetables put global goals for healthy, balanced diets within reach. In ASEAN Regional Symposium on High Value Vegetables in Southeast Asia: Production, supply and demand, ed. R. J. Holmer, G. Linwattana, P. Nath, J. D. H. Keatinge, 11–26. Shanhua, Taiwan: AVRDC.
- Hurrell, R. F. 2002. Fortification: Overcoming technical and practical barriers. Health Promotion 1:806–12.
- Institute of Medicine. 2006. Dietary reference intakes: The essential guide to nutrient requirements. Washington, DC: The National Academies Press. doi: 10.17226/11537.
- Institute of Medicine. 2001. Dietary reference intakes for vitamin A; vitamin K; arsenic; boron; chromium; copper; iodine; molybdenum; nickel; silicon; vanadium; and zinc. Washington, D.C.: National Academy Press.
- Johns, T., and P. B. Eyzaguirre. 2007. Biofortification, biodiversity and diet: A search for complementary applications against poverty and malnutrition. Food Policy 32 (1):1–24. doi: 10.1016/j.foodpol.2006.03.014.
- Joy, E. J. M., E. L. Ander, S. D. Young, C. R. Black, M. J. Watts, A. D. C. Chilimba, B. Chilima, E. W. P. Siyame, A. A. Kalimbira, R. Hurst, et al. 2014. Dietary mineral supplies in Africa. Physiologia Plantarum 151 (3):208–29. doi: 10.1111/ppl.12144.
- Joy, E. J. M., D. B. Kumssa, M. R. Broadley, M. J. Watts, S. D. Young, A. D. C. Chilimba, and E. L. Ander. 2015. Dietary mineral supplies in Malawi: Spatial and socioeconomic assessment. BMC Nutrition 1 (1):42. doi: 10.1186/s40795-015-0036-4.
- Keatinge, J. D. H., J.-F. Wang, F. F. Dinssa, A. W. Ebert, J. d Hughes, T. Stoilova, N. Nenguwo, N. P. S. Dhillon, W. J. Easdown, R. Mavlyanova, et al. 2015. Indigenous vegetables worldwide: Their importance and future development. Acta Horticulturae 1102 (1102):1–20. doi: 10.17660/ActaHortic.2015.1102.1.
- Kejo, D., P. Petrucka, H. Martin, M. Kimanya, and T. Mosha. 2018. Prevalence and predictors of anemia among children under 5 years of age in Arusha District, Tanzania. Pediatric Health, Medicine and Therapeutics 9:9–15. doi: 10.2147/PHMT.S148515.
- Kennedy, G. L., M. R. Pedro, C. Seghieri, G. Nantel, and I. Brouwer. 2007. Dietary diversity score is a useful indicator of micronutrient intake in non-breast-feeding filipino children. The Journal of Nutrition 137 (2):472–7. doi: 10.1093/jn/137.2.472.
- Kikafunda, J. K., L. Abenakyo, and F. B. Lukwago. 2006. Nutritional and sensory properties of high energy/nutrient dense composite flour porridges from germinated maize and roasted beans for child-weaning in developing countries: A case for Uganda. Ecology of Food and Nutrition 45 (4):279–94. doi: 10.1080/03670240600846344.
- Korkalo, L., H. Hauta-Alus, and M. Mutanen. 2011. Food composition tables for Mozambique. Helsinki, Finland: University of Helsinki.
- Krauss, R. M., R. H. Eckel, B. Howard, L. J. Appel, S. R. Daniels, R. J. Deckelbaum, J. Erdman, P. Kris-Etherton, I. J. Goldberg, T. A. Kotchen, et al. 2000. AHA dietary guidelines: Revision 2000: A statement for healthcare professionals from the Nutrition Committee of the American Heart Association. Circulation 102 (18):2284–99., . doi: 10.1161/01.cir.102.18.2284.
- Kruger, J., T. Mongwaketse, M. Faber, M. van der Hoeven, and C. M. Smuts. 2015. Potential contribution of African green leafy vegetables and maize porridge composite meals to iron and zinc nutrition. Nutrition (Burbank, Los Angeles County, Calif.) 31 (9):1117–23. doi: 10.1016/j.nut.2015.04.010.
- Kumar, D., and A. N. Jhariya. 2013. Nutritional, medicinal and economical importance of corn: A mini review. Research Journal of Pharmaceutical Sciences 2:7–8.
- Kumar, S., N. Thirunavukkarasu, G. Singh, R. Sharma, and K. S. Kulkarni. 2015. Biofortifcation for selecting and developing crop cultivars denser in iron and zinc. In Nutrient use efficiency: From basics to advances, ed. A. Rakshit, 237–53. New Delhi: Springer.
- Kumssa, D. B., E. J. M. Joy, E. L. Ander, M. J. Watts, S. D. Young, S. Walker, and M. R. Broadley. 2015. Dietary calcium and zinc deficiency risks are decreasing but remain prevalent. Scientific Reports 5:1–11. doi: 10.1038/srep10974.
- Kurilich, A. C., and J. A. Juvik. 1999. Quantification of carotenoid and tocopherol antioxidants in Zea mays. Journal of Agricultural and Food Chemistry 47 (5):1948–55. doi: 10.1021/jf981029d.
- Lawton, J. W. 2002. Zein: A history of processing and use. Cereal Chemistry 79 (1):1–18. doi: 10.1094/CCHEM.2002.79.1.1.
- Lemoine, A., and P. Tounian. 2020. Childhood anemia and iron deficiency in sub-Saharan Africa – risk factors and prevention: A review. In Archives de Pédiatrie. Amsterdam: Elsevier. 10.1016/j.arcped.2020.08.004.
- Lephole, M., M. Khaketla, and M. Monoto. 2006. Lesotho food composition table. Maseru: Department of Agricultural Research.
- Liu, R. H. 2007. Whole grain phytochemicals and health. Journal of Cereal Science 46 (3):207–19. doi: 10.1016/j.jcs.2007.06.010.
- Liu, R. H. 2004. Potential synergy of phytochemicals in cancer prevention: Mechanism of action. The Journal of Nutrition 134 (12 Suppl):3479S–85S. doi: 10.1093/jn/134.12.3479S.
- Lönnerdal, B. 2010. Calcium and iron absorption-mechanisms and public health relevance. International Journal for Vitamin and Nutrition Research. Internationale Zeitschrift Fur Vitamin- Und Ernahrungsforschung. Journal International de Vitaminologie et de Nutrition 80 (4–5):293–9. doi: 10.1024/0300-9831/a000036.
- Lopez-Martinez, L. X., R. M. Oliart-Ros, G. Valerio-Alfaro, C.-H. Lee, K. L. Parkin, and H. S. Garcia. 2009. Antioxidant activity, phenolic compounds and anthocyanins content of eighteen strains of Mexican maize. LWT - Food Science and Technology 42 (6):1187–92. doi: 10.1016/j.lwt.2008.10.010.
- Lukmanji, Z., E. Hertzmark, N. Mlingi, and V. Assey. 2008. Tanzania food composition tables. Dar es Salaam: MUHAS-TFNC, HSPH. 641.309678.
- Mabhaudhi, T., and A. T. Modi. 2013. Growth, phenological and yield responses of a bambara groundnut (Vigna subterranea (L.) Verdc.) landrace to imposed water stress under field conditions. South African Journal of Plant and Soil 30 (2):69–79. doi: 10.1080/02571862.2013.790492.
- Maki, K. C., A. L. Lawless, K. M. Kelley, V. N. Kaden, C. J. Geiger, and M. R. Dicklin. 2015. Corn oil improves the plasma lipoprotein lipid profile compared with extra-virgin olive oil consumption in men and women with elevated cholesterol: Results from a randomized controlled feeding trial. Journal of Clinical Lipidology 9 (1):49–57. doi: 10.1016/j.jacl.2014.10.006.
- Makower, R. U. 1970. Extraction and determination of phytic acid in beans. Cereal Chemistry 47:288–95.
- Mangani, C., K. Maleta, J. Phuka, Y. B. Cheung, C. Thakwalakwa, K. Dewey, M. Manary, T. Puumalainen, and P. Ashorn. 2015. Effect of complementary feeding with lipid-based nutrient supplements and corn-soy blend on the incidence of stunting and linear growth among 6- to 18-month-old infants and children in rural Malawi. Maternal & Child Nutrition 11:132–43. doi: 10.1111/mcn.12068.
- Manjeru, P., A. Van Biljon, and M. Labuschagne. 2017. The development and release of maize fortified with provitamin A carotenoids in developing countries. Critical Reviews in Food Science and Nutrition 59 (8):1284–1293. 10.1080/10408398.2017.1402751.
- Mathenge, M. K., M. Smale, and J. Olwande. 2014. The impacts of hybrid maize seed on the welfare of farming households in Kenya. Food Policy 44:262–71. doi: 10.1016/j.foodpol.2013.09.013.
- Misra, B. K., R. K. Sharma, and S. Nagarajan. 2004. Plant breeding: A component of public health strategy. Current Science 86:1210–5.
- MOST. 2003. Report of the national survery to evaluate the impact of vitamin A interventions in Zambia, July and November 2003. Atlanta: UNICEF, Centers for Disease Control and Prevention.
- Muriuki, J. M., A. J. Mentzer, E. L. Webb, A. Morovat, W. Kimita, F. M. Ndungu, A. W. Macharia, R. J. Crane, J. A. Berkley, S. A. Lule, et al. 2020. Estimating the burden of iron deficiency among African children. BMC Medicine 18 (1):31. doi: 10.1186/s12916-020-1502-7.
- Mwangi, M. N., K. S. Phiri, A. Abkari, M. Gbané, R. Bourdet-Sicard, V. A. Braesco, M. B. Zimmermann, and A. M. Prentice. 2017. Iron for Africa-report of an expert workshop. Nutrients 9 (6):576–15. doi: 10.3390/nu9060576.
- National Food and Nutrition Commission. 2009. Zambia food composition tables. 4th ed. Lusaka: National Food and Nutrition Commission.
- National Statistical Office, Community Health Sciences Unit, Centers for Disease Control and Prevention, Emory University. 2017. Malawi micronutrient survey 2015–16: Key indicators report. Atlanta: National Statistical Office and ICF Macro.
- Nuss, E. T., and S. A. Tanumihardjo. 2011. Quality protein maize for Africa: Closing the protein inadequacy gap in vulnerable populations. Advances in Nutrition (Bethesda, MD.) 2 (3):217–24. doi: 10.3945/an.110.000182.
- Nuss, E. T., and S. A. Tanumihardjo. 2010. Maize: A paramount staple crop in the context of global nutrition. Comprehensive Reviews in Food Science and Food Safety 9 (4):417–36. 10.1111/j.1541-4337.2010.00117.x.
- Nyaligwa, L., S. Hussein, M. Laing, H. Ghebrehiwot, and B. A. Amelework. 2017. Key maize production constraints and farmers’ preferred traits in the mid-altitude maize agroecologies of northern Tanzania. South African Journal of Plant and Soil 34 (1):47–53. doi: 10.1080/02571862.2016.1151957.
- O’Dell, B. L., A. R. De Boland, and S. R. Koirtyohann. 1972. Distribution of phytate and nutritionally important elements among the morphological components of cereal grains. Journal of Agricultural and Food Chemistry 20 (3):718–23. doi: 10.1021/jf60181a021.
- Oghbaei, M., and J. Prakash. 2016. Effect of primary processing of cereals and legumes on its nutritional quality: A comprehensive review. Cogent Food & Agriculture 2:1–14. doi: 10.1080/23311932.2015.1136015.
- Ojiewo, C., A. Tenkouano, J. Hughes, and J. D. H. Keatinge. 2013. Diversifying diets: Using indigenous vegetables to improve profitability, nutrition and health in Africa. In Diversifying food and diets: Using agricultural biodiversity to improve nutrition and health, ed. J. Fanzo, D. Hunter, T. Borelli and F. M. Earthscan, 291–302. Abingdon: Routledge.
- Orthoefer, F., J. Eastman, and G. List. 2003. Corn oil: Composition, processing and utilization. In Corn: Chemistry and technology, ed. P. J. White and L. A. Johnson, 2nd ed., 671–93. St. Paul, MN: American Association of Cereal Chemists.
- Oyewo, I. O. 2011. Technical efficiency of maize production in Oyo state. Journal of Economics and International finance 3:211–6.
- Palmer, A. C., K. Healy, M. A. Barffour, W. Siamusantu, J. Chileshe, K. J. Schulze, K. P. West, and A. B. Labrique. 2016. Provitamin A carotenoid–biofortified maize consumption increases pupillary responsiveness among Zambian children in a randomized controlled trial. The Journal of Nutrition 146 (12):2551–8. doi: 10.3945/jn.116.239202.
- Phillips, A. A. M., S. H. Zlotkin, J.-A. B. Baxter, F. Martinuzzi, T. Kadria, and D. E. Roth. 2014. Design and development of a combined Calcium—Iron—Folic Acid prenatal supplement to support implementation of the New World Health Organization recommendations for calcium supplementation during pregnancy. Food and Nutrition Bulletin 35 (2):221–9. doi: 10.1177/156482651403500209.
- Phiri, F. P., E. L. Ander, E. H. Bailey, B. Chilima, A. D. C. Chilimba, J. Gondwe, E. J. M. Joy, A. A. Kalimbira, D. B. Kumssa, R. M. Lark, et al. 2019. The risk of selenium deficiency in Malawi is large and varies over multiple spatial scales. Scientific Reports 9:6566. doi: 10.1038/s41598-019-43013-z.
- Pixley, K., N. P. Rojas, R. Babu, R. Mutale, R. Surles, and E. Simpungwe. 2013. Biofortification of Maize with Provitamin A Carotenoids. In Carotenoids and human health, ed. S.A. Tanumihardjo, 271–92. Totowa, NJ: Humana Press. doi: 10.1007/978-1-62703-203-2_17.
- Prasanna, B. M., S. K. Vasal, B. Kassahun, and N. N. Singh. 2001. Quality protein maize. Current Science 81:1308–18.
- Rajendran, S., V. Afari-Sefa, A. Shee, T. Bocher, M. Bekunda, I. Dominick, and P. J. Lukumay. 2017. Does crop diversity contribute to dietary diversity? Evidence from integration of vegetables into maize-based farming systems. Agriculture & Food Security 6:1–13. doi: 10.1186/s40066-017-0127-3.
- Ray, D. K., N. D. Mueller, P. C. West, and J. A. Foley. 2013. Yield trends are insufficient to double global crop production by 2050. PLoS One 8 (6):e66428. doi: 10.1371/journal.pone.0066428.
- Rayman, M. P. 2012. Selenium and human health. Lancet (London, England) 379 (9822):1256–68. https://doi.org/10.1016/S0140-6736.61452-9 doi: 10.1016/S0140-6736(11)61452-9.
- SAFOODS. 2017. SAMRC Food composition tables for South Africa. Cape Town: SAFOODS.
- Sen, C. K., S. Khanna, and S. Roy. 2006. Tocotrienols: Vitamin E beyond tocopherols. Life Sci 78 (18):2088–98. doi: 10.1016/j.lfs.2005.12.001.
- Shah, R. T., K. Prasad, and P. Kumar. 2016. Maize-A potential source of human nutrition and health: A review. Cogent Food & Agriculture 2:1–9. doi: 10.1080/23311932.2016.1166995.
- Sifakis, S., and G. Pharmakides. 2000. Anemia in pregnancy. Annals of the New York Academy of Sciences 900:125–36. doi: 10.1111/j.1749-6632.2000.tb06223.x.
- Siwela, A. H., M. Siwela, G. Matindi, S. Dube, and N. Nziramasanga. 2005. Decontamination of aflatoxin-contaminated maize by dehulling. Journal of the Science of Food and Agriculture 85 (15):2535–8. doi: 10.1002/jsfa.2288.
- Smale, M., E. Simpungwe, E. Birol, G. T. Kassie, H. de Groote, and R. Mutale. 2015. The changing structure of the maize seed industry in Zambia: Prospects for orange maize. Agribusiness 31 (1):132–46. doi: 10.1002/agr.21384.
- Stein, A. J. 2010. Global impacts of human mineral malnutrition. Plant and Soil 335 (1–2):133–54. doi: 10.1007/s11104-009-0228-2.
- Steyn, N. P., J. Nel, and D. Labadarios. 2008. Will fortification of staple foods make a difference to the dietary intake of South African children? South African Journal of Clinical Nutrition 21 (1):22–6. doi: 10.1080/16070658.2008.11734147.
- Suri, D. J., and S. A. Tanumihardjo. 2016. Effects of different processing methods on the micronutrient and phytochemical contents of maize: From A to Z. Comprehensive Reviews in Food Science and Food Safety 15 (5):912–26. doi: 10.1111/1541-4337.12216.
- Swanepoel, E., L. Havemann-Nel, M. Rothman, R. Laubscher, T. M. Matsungo, C. M. Smuts, and M. Faber. 2019. Contribution of commercial infant products and fortified staple foods to nutrient intake at ages 6, 12, and 18 months in a cohort of children from a low socio-economic community in South Africa. Maternal & Child Nutrition 15 (2):e12674. doi: 10.1111/mcn.12674.
- Tam, E., E. C. Keats, F. Rind, J. K. Das, and Z. A. Bhutta. 2020. Micronutrient supplementation and fortification interventions on health and development outcomes among children under-five in low-and middleincome countries: A systematic review and meta-analysis. Nutrients 12 (2):289. doi: 10.3390/nu12020289.
- Tanumihardjo, S. A. 2008. Food-based approaches for ensuring adequate vitamin a nutrition. Comprehensive Reviews in Food Science and Food Safety 7:373–81. doi: 10.1111/j.1541-4337.2008.00049.x.
- Tanumihardjo, S. A. 2004. Assessing vitamin A status: Past, present and future. The Journal of Nutrition 134 (1):290S–3S. doi: 10.1093/jn/134.1.290S.
- Tanumihardjo, S. A., C. Kaliwile, E. Boy, M. A. Dhansay, and M. E. van Stuijvenberg. 2019. Overlapping vitamin A interventions in the United States, Guatemala, Zambia, and South Africa: Case studies. Annals of the New York Academy of Sciences 1446 (1):102–16. doi: 10.1111/nyas.13965.
- Tanzania Bureau of Statistics and ICF Macro. 2011. Micronutrients: Results of the 2010 Tanzania Demographic and Health survey. Dar es Salaam & Calverton. 10.1007/SpringerReference_187125
- USDA. 2020. United States Department of Agriculture (USDA). National nutrient database for standard reference. Accessed November 5, 2020. https://fdc.nal.usda.gov/.
- USDA. 2007. US Department of Agriculture (USDA). USDA table of nutrient retention factors. Release 6. Beltsville, Maryland, USA: United States Department of Agriculture, Agricultural Research Service.
- Uusiku, N. P., A. Oelofse, K. G. Duodu, M. J. Bester, M. Faber, N. P. Uusiku, K. G. Duodu, and M. J. Bester. 2010. Nutritional value of leafy vegetables of sub-Saharan Africa and their potential contribution to human health: A review. Journal of Food Composition and Analysis 23 (6):499–509. doi: 10.1016/j.jfca.2010.05.002.
- Vaahtera, M., T. Kulmala, A. Hietanen, M. Ndekha, T. Cullinan, M.-L. Salin, and P. Ashorn. 2001. Breastfeeding and complementary feeding practices in rural Malawi. Acta Paediatrica (Oslo, Norway: 1992) 90 (3):328–32. doi: 10.1111/j.1651-2227.2001.tb00313.x.
- VIB. 2017. Maize in Africa. Fact series. Ghent, Belgium: VIB International Plant Biotechnology Outreach.
- Weinberger, K., and I. Swai. 2006. Consumption of traditional vegetables in Central and Northeastern Tanzania. Ecology of Food and Nutrition 45 (2):87–103. doi: 10.1080/03670240500530626.
- Welch, R. M., and R. D. Graham. 2004. Breeding for micronutrients in staple food crops from a human nutrition perspective. Journal of Experimental Botany 55 (396):353–64. doi: 10.1093/jxb/erh064.
- WHO/FAO. 2003. Diet, nutrition and the prevention of chronic diseases: Report of a joint WHO/FAO expert consultation. WHO Technical Report Series 916, Geneva.
- WHO. 2018. World Malaria Report. WHO, Geneva, Switzerland.
- WHO. 2011. Haemoglobin concentrations for the diagnosis of anaemia and assessment of severity. Vitamin and Mineral Nutrition Information System, Geneva, Switzerland.
- WHO and UNICEF. 2017. Report of the Fourth Meeting of the WHO-UNICEF Technical Expert Advisory group on nutrition Monitoring (TEAM), Geneva, Switzerland.
- Yang, R.-Y., S. Fischer, P. M. Hanson, and J. D. H. Keatinge. 2013. Mapping nutritional values of indigenous vegetables in Africa. In African natural plant products II: Discoveries and challenges in chemistry, health and nutrition, ed. H.R. Juliani, J. Simon, and C.T. Ho, vol. II, 231–54. Washington D.C: American Chemical Society.
- Zuma, M. K., U. Kolanisi, and A. T. Modi. 2018. The potential of integrating provitamin A-biofortified maize in smallholder farming systems to reduce malnourishment in South Africa. International Journal of Environmental Research and Public Health 15 (4):805–12. doi: 10.3390/ijerph15040805.