
Abstract
A priori dietary indices provide a standardized, reproducible way to evaluate adherence to dietary recommendations across different populations. Existing nutrient-based indices were developed to reflect food/beverage intake; however, given the high prevalence of dietary supplement (DS) use and its potentially large contribution to nutrient intakes for those that use them, exposure classification without accounting for DS is incomplete. The purpose of this article is to review existing nutrient-based indices and describe the development of the Total Nutrient Index (TNI), an index developed to capture usual intakes from all sources of under-consumed micronutrients among the U.S. population. The TNI assesses U.S. adults’ total nutrient intakes relative to recommended nutrient standards for eight under-consumed micronutrients identified by the Dietary Guidelines for Americans: calcium, magnesium, potassium, choline, and vitamins A, C, D, E. The TNI is scored from 0 to 100 (truncated at 100). The mean TNI score of U.S. adults (≥19 y; n = 9,954) based on dietary data from NHANES 2011-2014, was 75.4; the mean score for the index ignoring DS contributions was only 69.0 (t-test; p < 0.001). The TNI extends existing measures of diet quality by including nutrient intakes from all sources and was developed for research, monitoring, and policy purposes.
Supplemental data for this article is available online at https://doi.org/10.1080/10408398.2021.1967872.
Introduction
The field of nutrition science utilizes a wide variety of methodologies to examine relationships between diet and health. Originally, most research assessing the relationship between diet and health outcomes has focused on the effects of single foods, nutrients, or their metabolites in isolation (e.g., the role of calcium in bone health). While this approach has provided many valuable insights, examining single dietary components in isolation does not adequately capture the complexity of nutrient exposures and how these may relate to health. Dietary patterns research characterizes the diet broadly, permitting understanding of the totality of foods and beverages consumed (Nutrition Evidence Library Citation2014). In particular, indices compare dietary exposures to predefined criteria, such as food-based Dietary Guidelines, Dietary Reference Intakes (DRI) for nutrients, or other recommended patterns (e.g. Dietary Approaches to Stop Hypertension Diet (Appel et al. Citation1997)). Depending on the predefined criteria, indices may evaluate foods or food groups only, nutrients only, or a combination of nutrients and foods (Kant Citation1996). Because the intent of these indices is to compare intakes to pre-defined criteria, they may be considered dietary quality indices, i.e., they describe the degree to which diets conform to a standard, generally one intended to be met over time. Therefore, estimates of dietary intake should reflect long-term or “usual” intakes. Depending upon the available dietary data, making inferences about usual intakes may be challenging and require statistical modeling techniques, as reviewed in (Dodd et al. Citation2006; Bailey et al. Citation2019).
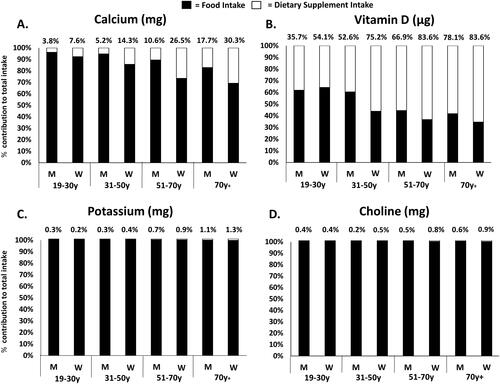
In addition, any approaches that are utilized to assess adequacy of nutrient intake should reflect exposures from all sources (i.e. foods, beverages, and dietary supplements (DS)). Based on national survey data of U.S. adults, it is estimated that DS contribute over half of total intake for vitamins C (52%) and D (71%) whereas for other nutrients like potassium and choline nearly all intake originates from foods and beverages alone (). Moreover, major sources and patterns of micronutrient intake vary by life stage group; for example, DS contribute about 80% of vitamin D among older adult women but much less in adult men (19-30 y; ∼36%). Thus, indices that ignore DS may underestimate some nutrient exposures for the half (52% in NHANES 2011-2014) of U.S. adults who use nutrient-containing DS (Cowan et al. Citation2018; Bailey, Gahche, et al. Citation2011; Bailey, Gahche, Miller, et al. Citation2013; Bailey, Gahche, Miller, et al. Citation2013), and may differentially underestimate exposures for particular life-stage groups. The development of a micronutrient-based diet quality index that captures nutrient exposures from all sources (including DS) can strengthen exposure assessment and improve the accuracy of nutrient intake estimation.
Figure 1. Relative contributions of foods/beverages and DS to total usual micronutrient intakes among U.S. adults by sex and age, NHANES 2011-20141,2.
Abbreviations: M, Men; W, Women.
1The analytic sample includes individuals’ ≥19 years old that were not pregnant or lactating with complete information for day 1 and 2, 24-hour dietary recalls.
2The panels reflect the relative contribution of foods/beverages and dietary supplements to total usual micronutrient intake of calcium (A), vitamin D (B), potassium (C), and choline (D). Percentages above each bar represent the relative contribution from dietary supplements.
The purposes of this work are 1) to review the foundational nutrient-based indices as a context for the development of a new index, the Total Nutrient Index (TNI); 2) describe the development of the TNI; and, 3) provide an example of the application of the TNI.
Current status of the knowledge: Existing nutrient-based diet quality indices and scores
All peer-reviewed literature published in the English language from 1972 to the present that used ‘a priori’ index-based methods to assess micronutrient exposures and dietary quality were identified using PubMed, Google Scholar, and ProQuest. Search terms included all of the following: index, nutrient, micronutrient, diet, quality, score, indicator, dietary guideline, dietary pattern, quality index, adequacy, dietary guidance, nutrient intake, or a variation of these terms. Relevant reference lists within publications were also searched further. The search was limited to studies that used a theoretically derived index or score. All indices and scores that did not reflect micronutrient-based constructs only and were not limited to those evaluating nutrient adequacy of the entire diet were considered beyond the scope of this review, and thus excluded.
We summarized the currently available nutrient-based indices in . Note that the scoring algorithm for an index is distinct from the particular dietary assessment tool used to collect intake data as well as methods used to analyze such data. Accordingly, we first discuss the scoring algorithm for currently available nutrient-based indices. These indices were developed for various purposes, such as evaluating diet-health relationships, surveillance, or monitoring the impact of policy changes.
Table 1. Key characteristics of existing nutrient-based diet quality indices and scores.
Madden and Yoder proposed one of the first (1972) nutrient-based index methods, the Mean Adequacy Ratio (MAR), to measure the effectiveness of food-assistance programs on nutrient adequacy for 10 nutrients (Madden and Yoder Citation1972). The MAR is the average of individual nutrient adequacy ratios (NAR), expressed as self-reported, daily nutrient intake relative to the Recommended Dietary Allowance (RDA). NAR values range from 0 to 1.0, with higher scores indicating diets that are more aligned with nutrient benchmarks. To reduce the effects of higher or “over” consumption, NAR values are truncated at 1.0. The nutrients chosen for inclusion in the original MAR were based on nutrients with an RDA at the time, including protein, calcium, phosphorus, iron, vitamin A, thiamin, riboflavin, niacin, vitamin C, and energy. The MAR was later applied by Guthrie and Scheer (Guthrie and Scheer, Citation1981; Guthrie and Scheer, Citation1981) to examine program effectiveness using a set of 10 nutrients to assess dietary adequacy and to evaluate food group intakes. The MAR has since been used in various settings (Eldridge et al. Citation2019; Bailey et al. Citation2009; Kachurak et al. Citation2018; Marshall et al. Citation2005; Hatløy, Torheim, and Oshaug Citation1998; Kuczmarski et al. Citation2017; Maillot et al. Citation2007; Aggarwal et al. Citation2014; Beydoun et al. Citation2015; Darmon et al. Citation2016; Jun et al. Citation2019; Kachurak et al. Citation2019; Kim, Yang, and Park Citation2018; O’Neil et al. Citation2009; Perignon et al. Citation2016; Vieux, Privet, and Masset Citation2018) with applications predicated on mean daily intake from foods and beverages (Eldridge et al. Citation2019; Bailey et al. Citation2009; Kachurak et al. Citation2018; Marshall et al. Citation2005; Hatløy, Torheim, and Oshaug Citation1998; Maillot et al. Citation2007; Aggarwal et al. Citation2014; Beydoun et al. Citation2015; Darmon et al. Citation2016; Kachurak et al. Citation2019; Kim, Yang, and Park Citation2018; O’Neil et al. Citation2009; Perignon et al. Citation2016; Vieux, Privet, and Masset Citation2018) as well as those inclusive of DS (Bailey et al. Citation2009; Kuczmarski et al. Citation2017; Jun et al. Citation2019).
Murphy et al. (Citation1996) developed a nutrient-based diet quality score to assess dietary quality of eight essential nutrients and risk of mortality in the U.S. adult population (Murphy et al. Citation1996). Similar to the MAR, Murphy et al. used the RDA as the nutrient standard of adequacy. The number of nutrients identified with less than two-thirds of the respective RDA were summed for each participant. “Poor” diet quality was defined as a diet where five or more nutrients of the eight nutrients examined were below 67% (i.e., two-thirds) of the RDA, as opposed to “not poor” diet quality for the remaining individuals who had fewer than five nutrients below 67% of the RDA. These nutrients included protein, iron, calcium, thiamin, riboflavin, preformed niacin, and vitamins A and C.
Fitzgerald, Dewar, and Veugelers (Citation2002) adopted an approach of aggregating nutrients into an overall summary measure called the Diet Quality Score (DQS) (Fitzgerald, Dewar, and Veugelers Citation2002). The DQS was designed to assess compliance with the DRI for 17 nutrients that had available DRIs. A value of “1.0” was assigned for nutrient recommendations (i.e., primarily the Estimated Average Requirement (EAR), and Adequate Intake (AI) if the EAR was unavailable) that were met, and a value of “0” was assigned for nutrient recommendations that were not met. The total number of values assigned to each of the nutrient recommendations were then summed to produce a total compliance score, ranging from 0 to 17. The 17 nutrients evaluated include: carbohydrate, fat, saturated fat, protein, thiamin, riboflavin, niacin, phosphorous, magnesium, iron, zinc, selenium, and vitamins A, B6, B12, C, and E (Fitzgerald, Dewar, and Veugelers Citation2002).
Arimond et al. (Citation2010) constructed a nutrient-based diet quality index with a structure similar to the MAR, known as the Mean Probability of Adequacy (MPA), to calculate the mean probability of adequacy for 11 micronutrients with known public health relevance (e.g., effects on pregnancy outcomes and breast milk content) using data from 5 existing data sets (Arimond et al. Citation2010). The probability of adequacy for a specific nutrient is equivalent to the prevalence of nutrient adequacy at the group level, and the average of the 11 probabilities of adequacy yields the summary variable, known as the MPA score (on a scale of 0 to 1.0). Nutrients assessed in the MPA score were thiamin, riboflavin, niacin, folate, calcium, iron, zinc, and vitamins A, B6, B12, and C. Adequacy standards included both the World Health Organization, Food and Agriculture Organization (Joint World Health Organization and Food and Agriculture Organization of the United Nations Expert Consultation on Human Nutrition and Mineral Requirements Citation2004) and the Food and Nutrition Board (Institute of Medicine Citation2006).
In 2015, the Committee to Review WIC Food Packages (Rasmussen, Latulippe, and Yaktine 2016) developed the Nutrient-Based Diet Quality Index (NBDQ), an index designed to examine the mean probability of dietary adequacy. The intent of the Committee was to develop a tool that could be used to evaluate the effectiveness of policy changes in the Special Supplemental Nutrition Program for Women, Infants, and Children (WIC) food packages (Rasmussen, Latulippe, and Yaktine 2016). Because WIC packages provide foods and beverages, an index representing nutrient adequacy was needed to address whether the WIC food package policy changes increased the nutrient adequacy of WIC participants. Individuals were classified into categories of nutrient adequacy according to the ratio of nutrient intake to the EAR or AI, multiplied by 100 and truncated at 100%. The average of the nutrient adequacy categories was estimated to reflect the overall percentage of nutrient adequacy on a scale of 0 to 100. Nine under consumed nutrients identified by the 2015-2020 Dietary Guidelines Advisory Committee were assessed: potassium, dietary fiber, calcium, iron, vitamin C, folate, vitamin A, vitamin E, and magnesium. Additional nutrients were also considered among certain population subgroups (i.e., 0-24 mo. and 2-5 yrs.), such as zinc.
Summary of review and research needs
While these indices differ in their construction, all compared nutrient intakes relative to a nutrient standard of adequacy. Furthermore, the initial applications of the five nutrient-based indices evaluated nutrients from food and beverage sources alone, ignoring the potential contributions from DS, which are substantial for some nutrients (Bailey, Gahche, et al. Citation2011; Bailey et al. Citation2012). These five existing indices also share another similarity: they were initially applied to data sets where dietary intake was assessed via the 24-hour dietary recall (24HR) method (). The data sets initially considered for the first two nutrient-based diet quality indices examined (Madden and Yoder Citation1972; Murphy et al. Citation1996) comprised only a single 24HR per respondent, whereas the data for the other three indices (Fitzgerald, Dewar, and Veugelers Citation2002; Arimond et al. Citation2010; Rasmussen, Latulippe, and Yaktine 2016) comprised up to two or three 24HRs per respondent. Although 24HRs provide rich details about dietary intake on a given day, clearly, intake on a single day, even if measured perfectly, does not represent usual intake, nor does the mean of a small number of days for most nutrients (Kipnis et al. Citation2003; Subar et al. Citation2003; Park et al. Citation2018). The measurement error that pervades self-report dietary assessment instruments, including the 24HR, is both random and systematic and affects estimation of usual intake at the individual level and at the group level. The effects of systematic measurement error cannot generally be ameliorated, nor can the effects of random error on estimates of individual usual intake without considerable investment in monitoring individual intake over time. However, the effects of random error on group-level characteristics, such as the mean or distribution of usual intake, are well understood and can be accounted for using statistical modeling techniques that adjust for random error. These modeling techniques can be applied to data sets with small numbers of repeat 24HRs per person to make inferences about the distribution of long-term within-person average 24HR intake, under the strong assumption that such averages approximate true individual usual intakes (Dodd et al. Citation2006; Bailey et al. Citation2019). None of the five indices originally considered nutrients from DS, and few employed statistical modeling techniques for the 24HR data. Thus, a need exists for a nutrient-based index that reflects usual intake from foods, beverages, and DS that is amenable to statistical modeling techniques and the restricted inference that they impose.
Development of the total nutrient index (TNI)
Guiding principles
The TNI was developed by a team of nutrition scientists, nutritional epidemiologists, and biostatisticians with expertise in dietary assessment of foods, beverages, nutrients, and DS and previous experience in the development and validation of dietary indices. Several guiding principles () were used to develop the TNI. First, the team informed the inclusion of only micronutrients in this index given that most existing indices largely focus on foods or nutrients to limit such as sodium, or include a combination of macronutrients and micronutrients, and macronutrients are reflected in existing indices quite well. Second, the specific focus on under consumed micronutrients among the U.S. population was driven by the concept that these nutrients are of public health relevance (Bailey et al. Citation2021) and that many individuals are consuming less amounts than recommended, suggesting that incorporation of these nutrients allows the TNI to capture variability in total nutrient intake at the population level. Furthermore, inclusion of other nutrients that are adequate or at risk of overconsumption may dilute resultant findings. Third, we chose to use the DRI standards as a benchmark, which are agnostic to energy intake and relatively stable overtime, and therefore, more suited for micronutrient intake assessment. The RDA or AI was chosen as the DRI standard for inclusion in the index. This decision was made based on the concept that the RDA is a sufficient level to meet the nutrient requirements of nearly all healthy individuals and can be used to assess individuals’ intakes; usual intake at or above this level has a low probability of inadequacy. The AI is set based on nutrient intake estimates of an apparently healthy population (Institute of Medicine Standing Committee on the Scientific Evaluation of Dietary Reference Intakes. DRI Dietary Reference Intakes: Applications in Dietary Assessment Citation2000), and is assumed to be adequate when the RDA cannot be determined, but the AI cannot be used to assess adequacy in the same way an RDA can, which is a considerable limitation. Finally, reference standards, like a DRI, should be compared to usual intakes. While the concept is simple, the application is challenging given the measurement error inherent in dietary data and the extensive statistical programming knowledge required to address the effects in whole or in part. Nevertheless, accounting for random measurement error, manifested as within-person variation in self-reported intake, is of utmost importance to avoid biasing resultant findings and/or overestimating or underestimating the proportion of the population at risk for micronutrient inadequacy or excess. Practical application of the TNI should recognize the possibility of measurement error in assessment of intakes from all sources, including DS assessment tools, and the statistical method used to summarize nutrient intakes should be carefully considered when applying the index.
Table 2. Guiding principles for the development of the TNI.
Description of the TNI
The TNI evaluates usual micronutrient intakes from foods, beverages, and DS relative to the RDA or AI for eight under consumed micronutrients previously identified in the the most recent iteration of the Dietary Guidelines for Americans at the time of index construction: calcium, magnesium, potassium, choline, and vitamins A, C, D, and E (2015–2020 Dietary Guidelines for Americans, Citation2015). For each micronutrient, usual total intakes are expressed as a percentage of the RDA (if available) or AI with higher scores reflecting intakes closely aligned with DRI recommendations. The percentage of each micronutrient relative to the RDA or AI was truncated at 100% to reduce the potential for very high intakes exerting undue influence on the overall TNI score and with each micronutrient weighted equally. The TNI overall score (ranging from 0 to 100) is the average of the component scores.
Application of the TNI to population-based data: NHANES 2011-2014
Methods
TNI scores for the U.S. adult population were estimated utilizing data from the National Health and Nutrition Examination Survey (NHANES). The NHANES is a nationally representative, continuous, cross-sectional survey of noninstitutionalized, civilian residents of the United States. The NHANES utilizes a complex, stratified, multistage probability cluster sampling design (Zipf, Chiappa, and Porter Citation2013), and all data included in this analysis was collected by the National Center for Health Statistics. In NHANES, information on foods, beverages, and DS is obtained via up to 2 24HRS; DS use for the previous 30 days was also assessed with the Dietary Supplement and Prescription Medicine Questionnaire (DSMQ). Complete details of the NHANES methodology can be found in the Supplemental Data, Section 1. A NHANES 2011-2014 sample of 9,954 adults (≥ 19 y) with at least one 24HR and the DSMQ, excluding pregnant and lactating women, was used for the application of the TNI.
In the present analysis, reported DS intake were calculated using the total number of reported days of DS use over the past 30 days, multiplied by the amount the participant reported taking per day if DS intakes were reported on the DSMQ in-home inventory. If DS intakes were not reported on the DSMQ, but were reported on ≥1 24HR recall, then the mean nutrient intake from supplemental sources reported on the Day 1 and Day 2 24HR recalls was used, consistent with previous work (Nicastro, Bailey, and Dodd Citation2015; Cowan et al. Citation2020).
We used the multivariate extension of the National Cancer Institute (NCI) Method, that uses a Markov Chain Monte Carlo (MCMC) approach to jointly model intakes from foods and beverages (Zhang et al. Citation2011). This method accounts for skewness in observed intake distributions, covariate and nuisance (i.e., interview sequence, weekend/weekday) effects on intake, and random measurement error, as well as modeling correlation among intakes of different dietary components. This method was previously used to estimate Healthy Eating Index (HEI) scores from foods and beverages from NHANES data (Reedy et al. Citation2018). To estimate the distribution of usual intakes, the NCI method utilizes a distribution of “pseudo-individuals” that are generated based on the estimated model parameters and the distribution of covariates (age, sex, and DS use) as the original sample. To incorporate the assessment of DS, we extended the multivariate MCMC method by adding an additional step after the pseudo-population is generated. Specifically, for each pseudo-person, the reported daily DS amount was added to the generated usual intake from foods and beverages to obtain the total usual intake for the pseudo-person. Next, the TNI scoring algorithm was applied to the set of total usual intakes for each pseudo-person to obtain component and total TNI scores. Means and percentiles of TNI scores were then derived for the pseudo-population, as explained in .
Table 3. Steps used to estimate distributions of total usual intake and calculate TNI scores.Table Footnote 1
All statistical analyses were performed using SAS software (version 9.4; SAS Institute Inc., Cary, NC, USA) accounting for the NHANES complex survey design and sampling weights to adjust for differential non-response and non-coverage, and oversampling and post-stratification. Standard errors (SE) for all statistics of interest were approximated using Fay’s modified balanced repeated replication technique (Burt and Cohen Citation1984; Shao and Rao Citation1999). Due to extreme values in the tails of some of the distributions of estimated mean nutrient intakes from DS, the total usual intake estimates used to calculate the overall TNI score reflect a Winsorized distribution (which increases the stability of the estimates), where intakes above the 98th percentile or below the 2nd percentile were Winsorized to the next highest (98th percentile) or lowest (2nd percentile) value, respectively. To elucidate the differences in scores between micronutrient intakes from foods and beverages when compared with those inclusive of DS, the same index from foods and beverages alone, named the Food Nutrient Index (FNI) was also scored. Differences between FNI and TNI total scores were compared using paired t-tests; a p-value of <0.05 was considered statistically significant.
Results
The average TNI score was estimated to be 75.4 out of 100; whereas the average score for the FNI was 69.0 (p < 0.001) (). This differential pattern in adequacy between micronutrient intakes from foods and beverages when compared with those inclusive of DS was largely driven by low intakes of vitamins D and E, as compared to higher intake of calcium, magnesium, and vitamin C. Most notably, the TNI vitamin D component score from dietary sources (30.3) was 25.9 points lower than the TNI vitamin D component score from all sources (56.2). Additionally, when evaluating TNI component scores stratified between DS users and non-DS users, considerable differences in intake were noted for several micronutrients, with the largest differences observed for micronutrients commonly found in DS (i.e., vitamins A, C, D, E, and calcium and magnesium) when compared to other micronutrients not commonly found in DS (i.e., potassium and choline) ().
Figure 2. Estimated TNI component scores among U.S. adults (≥19 y), overall and by DS use, NHANES 2011-2014.
Abbreviations: TNI, Total Nutrient Index; DS, Dietary Supplement; NHANES, National Health and Nutrition Examination Survey.
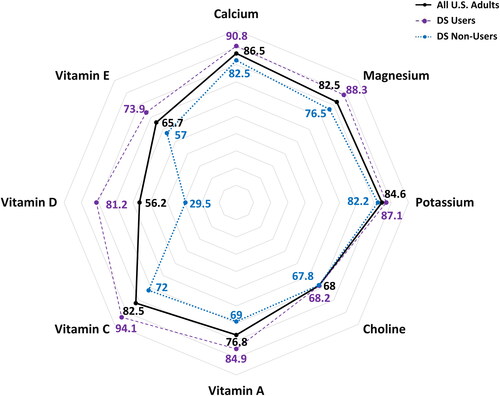
Table 4. Estimated means and percentiles of TNI and FNI overall and component scores among all U.S. adults (≥19 y); 2011-2014 NHANES.
Discussion
The TNI extends previously developed methods to include nutrient exposures from DS. Like other nutrient-based indices, we used 24HR data to demonstrate the use of the TNI; however, we utilized a new procedure to make inferences about total usual dietary intakes from foods, beverages, and DS. TNI scores, reflective of nutrient exposure from all sources, were significantly higher than FNI scores reflective of foods and beverages alone, illustrating the importance of capturing nutrients obtained from supplemental sources. Notable differences in FNI and TNI component scores were apparent for most micronutrients that are commonly consumed in the form of DS, such as vitamin D. Our selection of micronutrients for inclusion in the first iteration of the TNI align with the micronutrients identified as under consumed in the most recent iteration of the DGA at the time of index construction; for some of these nutrients (e.g., vitamins D and E), differential estimates of inadequacy are obtained when compared with biochemical markers of status or exposure (Pfeiffer et al. Citation2013; Traber Citation2014). Thus, the inclusion of different nutrients in the TNI may be of interest when evaluating different population subgroups, or yield differential patterns in scores in different population subgroups. Similar to our findings, when users and non-users of DS were stratified for analysis, Kuczmarski et al. (Kuczmarski et al. Citation2017) observed a differential pattern in scores between the MAR from foods alone (MAR: 75) when compared with the MAR from all sources (MAR: 86).
The TNI is intended to provide complementary information to food-based indices, such as the HEI, an index designed to evaluate how closely dietary patterns (i.e., food and beverage intake) align with the most recent iteration of the Dietary Guidelines for Americans () (Reedy et al. Citation2018; Krebs-Smith et al. Citation2018). The HEI primarily focuses on food groups (e.g., total dairy, total fruit, and seafood and plant proteins) but does include specific food components such as sodium and fatty acids; it does not include intake from DS. A micronutrient exposure metric in tandem with another food-based metric may provide a more holistic understanding of the source of dietary intake and where gaps in intake may exist. For example, if a population subgroup scores low on the total dairy HEI component score and low on the FNI, but high on the TNI calcium and vitamin D component score, it may indicate that the group is able to meet nutrient needs through supplementation, but this information is not apparent when only evaluating intake from foods and beverages alone. The HEI incorporates constructs of both dietary adequacy and excess (e.g., sodium and saturated fats). Future iterations of the TNI may explore strategies to score the system to represent potentially excessive nutrient exposures from DS. The TNI framework can easily be updated to reflect different reference values if the DRI values are updated, as was the case with potassium in 2019. Other future applications of the TNI may also include evaluating the TNI in relation to health outcomes, such as, all-cause mortality, cardiovascular disease, and cancer.
The extension of the NCI Method allows for the estimation of the distribution of total usual intake by incorporating nutrients from DS using a “shrink then add” approach that recognizes the statistical assumptions required by modeling techniques that adjust for random error in 24HRs. In particular, the distributions of nutrient intake amounts from a 24HR, while skewed, are generally continuous and can be transformed to approximate normality, a requirement for most software intended for these purposes. In contrast, distributions of supplement intakes are more likely to be highly skewed with discrete spikes or values corresponding to doses found in commonly used products (Bailey et al. Citation2019). The amounts of nutrients in DS can be quite large relative to those found in food sources, so simply adding usual DS amounts to each 24HR (i.e. “add then shrink”) are likely to produce multimodal distributions that are not amenable to normality transformations. Further justification for using the shrink then add method are given elsewhere (Bailey et al. Citation2019).
As with any analysis, the strengths and limitations of the present study should be noted. Indices provide a standardized a priori rubric to assess and compare diet quality or adequacy in a consistent manner (Burggraf et al. Citation2018; Waijers, Feskens, and Ocké Citation2007). The TNI conceptually represents total usual nutrient exposures and was applied using extensions of existing methods. The TNI can be used to complement information garnered from food-based diet quality indices, such as the HEI (Kirkpatrick et al. Citation2018). However, self-reported dietary intake data is prone to other types of measurement error (i.e., systematic error), which cannot be accounted for in this index or any other type of analysis. Furthermore, little is known about the measurement error structure of DS reporting (Bailey et al. Citation2019). Future work investigating the TNI with other dietary assessment methods (e.g., a food frequency questionnaire or diet record), in different populations, with different nutrients of interest, and with different statistical modeling approaches is warranted. Finally, more work is needed to establish the validity of TNI scores.
Supplemental Material
Download MS Word (28.3 KB)Acknowledgements
All authors have read and approved the final manuscript.
Disclosure statement
AEC, SJ, JAT, KWD, JJG, HEM, PMG, NP, AB, and RJC have no conflicts of interest. Unrelated to this submission, RLB has served as a consultant in the past to the NIH Office of Dietary Supplements, Nestlé, the General Mills Bell Institute, RTI International, and Nutrition Impact; and is a trustee of the International Food Information Council and a former board member of International Life Sciences Institute-North America. RLB has received travel support to present her research on dietary supplements from Council of Responsible Nutrition, American Society of Nutrition, and the New York Academy of Sciences. RLB is a member of the Journal’s Editorial Board. JTD has served an advisory board from McCormick Spice, the Mushroom Council, Bay State Milling, ConAgra Foods (until December 2018), and Nestlé (until 2020), received an honorarium for a single consultation at Motif FoodWorks in 2019, receives editorial fees from Lippincott, Williams, and Wilkins/Wolters Kluwer Publishers, and holds stock in several food and drug companies. The funders had no role in the design of the study; in the collection, analyses, or interpretation of data; in the writing of the manuscript; or in the decision to publish the results.
Additional information
Funding
References
- 2015–2020 Dietary Guidelines for Americans. December 2015. U.S. Department of Health and Human Services and U.S. Department of Agriculture. 8 ed. Available at: https://health.gov/our-work/food-nutrition/previous-dietary-guidelines/2015
- Aggarwal, A., P. Monsivais, A. J. Cook, and A. Drewnowski. 2014. Positive attitude toward healthy eating predicts higher diet quality at all cost levels of supermarkets. Journal of the Academy of Nutrition and Dietetics 114 (2):266–72. doi: 10.1016/j.jand.2013.06.006.
- Appel, L. J., T. J. Moore, E. Obarzanek, W. M. Vollmer, L. P. Svetkey, F. M. Sacks, G. A. Bray, T. M. Vogt, J. A. Cutler, M. M. Windhauser, et al. 1997. A clinical trial of the effects of dietary patterns on blood pressure. DASH Collaborative Research Group. New England Journal of Medicine 336 (16):1117–24. doi: 10.1056/NEJM199704173361601.
- Arimond, M., D. Wiesmann, E. Becquey, A. Carriquiry, M. C. Daniels, M. Deitchler, N. Fanou-Fogny, M. L. Joseph, G. Kennedy, Y. Martin-Prevel, et al. 2010. Simple food group diversity indicators predict micronutrient adequacy of women’s diets in 5 diverse, resource-poor settings. The Journal of Nutrition 140 (11):2059S–69S. doi: 10.3945/jn.110.123414.
- Bailey, R. L., J. D. Ard, T. A. Davis, et al. 2021. A proposed framework for identifying nutrients and food components of public health relevance in the dietary guidelines for Americans. Journal of Nutrition 151 (5):1197–204. doi: 10.1093/jn/nxaa459.
- Bailey, R. L., J. J. Gahche, C. V. Lentino, J. T. Dwyer, J. S. Engel, P. R. Thomas, J. M. Betz, C. T. Sempos, and M. F. Picciano. 2011. Dietary supplement use in the United States, 2003-2006. The Journal of Nutrition 141 (2):261–6. doi: 10.3945/jn.110.133025.
- Bailey, R. L., J. J. Gahche, P. E. Miller, P. R. Thomas, and J. T. Dwyer. 2013. Why US adults use dietary supplements. JAMA Internal Medicine 173 (5):355–61. doi: 10.1001/jamainternmed.2013.2299.
- Bailey, R. L., J. J. Gahche, P. R. Thomas, and J. T. Dwyer. 2013. Why US children use dietary supplements. Pediatric Research 74 (6):737–41. doi: 10.1038/pr.2013.160.
- Bailey, R. L., K. W. Dodd, J. J. Gahche, J. T. Dwyer, A. E. Cowan, S. Jun, H. A. Eicher-Miller, P. M. Guenther, A. Bhadra, P. R. Thomas, et al. 2019. Best practices for dietary supplement assessment and estimation of total usual nutrient intakes in population-level research and monitoring. The Journal of Nutrition 149 (2):181–97. doi: 10.1093/jn/nxy264.
- Bailey, R. L., P. E. Miller, D. C. Mitchell, T. J. Hartman, F. R. Lawrence, C. T. Sempos, and H. Smiciklas-Wright. 2009. Dietary screening tool identifies nutritional risk in older adults. The American Journal of Clinical Nutrition 90 (1):177–83. doi: 10.3945/ajcn.2008.27268.
- Bailey, R. L., V. L. Fulgoni, D. R. Keast, and J. T. Dwyer. 2011. Dietary supplement use is associated with higher intakes of minerals from food sources. The American Journal of Clinical Nutrition 94 (5):1376–81. doi: 10.3945/ajcn.111.020289.
- Bailey, R. L., V. L. Fulgoni, D. R. Keast, and J. T. Dwyer. 2012. Examination of vitamin intakes among US adults by dietary supplement use. Journal of the Academy of Nutrition and Dietetics 112 (5):657–63. doi: 10.1016/j.jand.2012.01.026.
- Beydoun, M. A., M. T. Fanelli-Kuczmarski, A. Allen, H. A. Beydoun, B. M. Popkin, M. K. Evans, and A. B. Zonderman. 2015. Monetary value of diet is associated with dietary quality and nutrient adequacy among urban adults, differentially by sex, race and poverty status. PLoS One 10 (11):e0140905. doi: 10.1371/journal.pone.0140905.
- Burggraf, C., R. Teuber, S. Brosig, and T. Meier. 2018. Review of a priori dietary quality indices in relation to their construction criteria. Nutrition Reviews 76 (10):747–64. doi: 10.1093/nutrit/nuy027.
- Burt, V. L., and S. B. Cohen. 1984. A comparison of methods to approximate standard errors for complex survey data. Review of Public Data Use 12 (3):159–68.
- Council, N. R. 1986. Nutrient adequacy: Assessment using food consumption surveys. Washington, DC: The National Academies Press; English.
- Cowan, A. E., S. Jun, J. A. Tooze, K. W. Dodd, J. J. Gahche, H. A. Eicher-Miller, P. M. Guenther, J. T. Dwyer, A. J. Moshfegh, D. G. Rhodes, et al. 2020. Comparison of 4 methods to assess the prevalence of use and estimates of nutrient intakes from dietary supplements among US Adults. The Journal of Nutrition 150 (4):884–93. doi: 10.1093/jn/nxz306.
- Cowan, A., S. Jun, J. Gahche, J. Tooze, J. Dwyer, H. Eicher-Miller, A. Bhadra, P. Guenther, N. Potischman, K. Dodd, et al. 2018. Dietary supplement use differs by socioeconomic and health-related characteristics among U.S. Adults, NHANES 2011(-)2014. Nutrients 10 (8):1114. doi: 10.3390/nu10081114.
- Darmon, N., A. Lacroix, L. Muller, and B. Ruffieux. 2016. Food price policies may improve diet but increase socioeconomic inequalities in nutrition. World Review of Nutrition and Dietetics 115:36–45. doi: 10.1159/000442069.
- Dodd, K. W., P. M. Guenther, L. S. Freedman, A. F. Subar, V. Kipnis, D. Midthune, J. A. Tooze, and S. M. Krebs-Smith. 2006. Statistical methods for estimating usual intake of nutrients and foods: A review of the theory. Journal of the American Dietetic Association 106 (10):1640–50. doi: 10.1016/j.jada.2006.07.011.
- Eldridge, A. L., D. J. Catellier, J. C. Hampton, J. T. Dwyer, and R. L. Bailey. 2019. Trends in mean nutrient intakes of US infants, toddlers, and young children from 3 Feeding Infants and Toddlers Studies (FITS). The Journal of Nutrition 149 (7):1230–7. doi: 10.1093/jn/nxz054.
- Fitzgerald, A. L., R. A. Dewar, and P. J. Veugelers. 2002. Diet quality and cancer incidence in Nova Scotia, Canada. Nutrition and Cancer 43 (2):127–32. doi: 10.1207/S15327914NC432_2.
- Garriguet, D. 2010. Combining nutrient intake from food/beverages and vitamin/mineral supplements. Health Reports 21 (4):71–84.
- Guthrie, H. A., and J. C. Scheer. 1981. Nutritional adequacy of self-selected diets that satisfy the four food groups guide. Journal of Nutrition Education 13 (2):46–9. doi: 10.1016/S0022-3182(81)80090-8.
- Guthrie, H. A., and J. C. Scheer. 1981. Validity of a dietary score for assessing nutrient adequacy. Journal of the American Dietetic Association 78 (3):240–5.
- Hatløy, A., L. E. Torheim, and A. Oshaug. 1998. Food variety–a good indicator of nutritional adequacy of the diet? A case study from an urban area in Mali, West Africa. European Journal of Clinical Nutrition 52 (12):891–8. doi: 10.1038/sj.ejcn.1600662.
- Institute of Medicine Standing Committee on the Scientific Evaluation of Dietary Reference Intakes. DRI Dietary Reference Intakes: Applications in Dietary Assessment. 2000. DRI dietary reference intakes: Applications in dietary assessment. Washington, DC: National Academies Press.
- Institute of Medicine. 2006. Dietary reference intakes: The essential guide to nutrient requirements. Washington, DC: The National Academies Press; English. (Otten JJ, Hellwig JP, Meyers LD, editors.).
- Joint World Health Organization and Food and Agriculture Organization of the United Nations Expert Consultation on Human Nutrition and Mineral Requirements. 2004. Vitamin and mineral requirements in human nutrition. World Health Organization and Food and Agriculture Organization of the United Nations 2004.
- Joseph, M. L., and A. Carriquiry. 2010. A measurement error approach to assess the association between dietary diversity, nutrient intake, and mean probability of adequacy. The Journal of Nutrition 140 (11):2094S–101S. doi: 10.3945/jn.110.123588.
- Jun, S., M. J. Zeh, H. A. Eicher-Miller, and R. L. Bailey. 2019. Children’s dietary quality and micronutrient adequacy by food security in the household and among household children. Nutrients 11 (5):965. doi: 10.3390/nu11050965.
- Kachurak, A., A. Davey, R. L. Bailey, and J. O. Fisher. 2018. Daily snacking occasions and weight status among US Children Aged 1 to 5 Years. Obesity (Silver Spring) 26 (6):1034–42. doi: 10.1002/oby.22172.
- Kachurak, A., R. L. Bailey, A. Davey, L. Dabritz, and J. O. Fisher. 2019. Daily snacking occasions, snack size, and snack energy density as predictors of diet quality among US children aged 2 to 5 years. Nutrients 11 (7):1440. doi: 10.3390/nu11071440.
- Kant, A. K. 1996. Indexes of overall diet quality: A review. Journal of the American Dietetic Association 96 (8):785–91. doi: 10.1016/S0002-8223(96)00217-9.
- Kim, S., J. H. Yang, and G. H. Park. 2018. Eating frequency is inversely associated with BMI, waist circumference and the proportion of body fat in Korean adults when diet quality is high, but not when it is low: Analysis of the Fourth Korea National Health and Nutrition Examination Survey (KNHANES IV). British Journal of Nutrition 119 (8):918–27.
- Kipnis, V., A. F. Subar, D. Midthune, L. S. Freedman, R. Ballard-Barbash, R. P. Troiano, S. Bingham, D. A. Schoeller, A. Schatzkin, R. J. Carroll, et al. 2003. Structure of dietary measurement error: Results of the OPEN biomarker study. American Journal of Epidemiology 158 (1):14–21. doi: 10.1093/aje/kwg091.
- Kirkpatrick, S. I., J. Reedy, S. M. Krebs-Smith, T. E. Pannucci, A. F. Subar, M. M. Wilson, J. L. Lerman, and J. A. Tooze. 2018. Applications of the healthy eating index for surveillance, epidemiology, and intervention research: Considerations and caveats. Journal of the Academy of Nutrition and Dietetics 118 (9):1603–21. doi: 10.1016/j.jand.2018.05.020.
- Krebs-Smith, S. M., T. E. Pannucci, A. F. Subar, S. I. Kirkpatrick, J. L. Lerman, J. A. Tooze, M. M. Wilson, and J. Reedy. 2018. Update of the healthy eating index: HEI-2015. Journal of the Academy of Nutrition and Dietetics 118 (9):1591–602. doi: 10.1016/j.jand.2018.05.021.
- Kuczmarski, M. F., M. A. Beydoun, E. Stave Shupe, R. T. Pohlig, A. B. Zonderman, and M. K. Evans. 2017. Use of dietary supplements improved diet quality but not cardiovascular and nutritional biomarkers in socioeconomically diverse African American and White adults. Journal of Nutrition in Gerontology and Geriatrics 36 (2-3):92–110. doi: 10.1080/21551197.2017.1299659.
- Madden, J., and M. Yoder. 1972. Program evaluation: food stamps and commodity distribution in rural areas of central Pennsylvania. Department of Agricultural Economics and Rural Sociology, The Pennsylvania State University, College of Agriculture (Madden J, editor.).
- Maillot, M., N. Darmon, F. Vieux, and A. Drewnowski. 2007. Low energy density and high nutritional quality are each associated with higher diet costs in French adults. The American Journal of Clinical Nutrition 86 (3):690–6. doi: 10.1093/ajcn/86.3.690.
- Marshall, T. A., J. M. Eichenberger Gilmore, B. Broffitt, P. J. Stumbo, and S. M. Levy. 2005. Diet quality in young children is influenced by beverage consumption. Journal of the American College of Nutrition 24 (1):65–75. doi: 10.1080/07315724.2005.10719445.
- Murphy, S. P., M. A. Davis, J. M. Neuhaus, and D. Lein. 1996. Dietary quality and survival among middle-aged and older adults in the NHANES I epidemiologic follow-up study. Nutrition Research 16 (10):1641–50. doi: 10.1016/0271-5317(96)00183-2.
- National Institutes of Health, National Cancer Institute. 2020. Multivariate Markov Chain Monte Carlo (MCMC) Method. Available from: https://epi.grants.cancer.gov/hei/multivariate-mcmc-method.html
- Neuhaus, J. M., S. P. Murphy, and M. A. Davis. 1991. Age and sex differences in variation of nutrient intakes among U.S. adults. Epidemiology (Cambridge) 2 (6):447–50.
- Nicastro, H. L., R. L. Bailey, and K. W. Dodd. 2015. Using 2 assessment methods may better describe dietary supplement intakes in the United States. The Journal of Nutrition 145 (7):1630–4. doi: 10.3945/jn.115.211466.
- Nutrition Evidence Library. March 2014. A series of systematic reviews on the relationship between dietary patterns and health outcomes. Alexandria, Virginia: U.S. Department of Agriculture, Center for Nutrition Policy and Promotion. Available from: http://www.nel.gov/vault/2440/web/files/DietaryPatterns/DPRptFullFinal.pdf
- Nusser, S. M., A. L. Carriquiry, K. W. Dodd, and W. A. Fuller. 1996. A semiparametric transformation approach to estimating usual daily intake distributions. Journal of the American Statistical Association 91 (436):1440–9. doi: 10.1080/01621459.1996.10476712.
- Nusser, S. M., W. A. Fuller, P. M. Guenther, et al. 1997. Estimating usual dietary intake distributions: Adjusting for measurement error and nonnormality in 24-hour food intake data. In Survey measurement and process quality, ed. L. Lyberg, P. Biemer, and M. Collins. New York: Wiley and Sons.
- O’Neil, C. E., T. A. Nicklas, Y. Liu, and F. A. Franklin. 2009. Impact of dairy and sweetened beverage consumption on diet and weight of a multiethnic population of head start mothers. Journal of the American Dietetic Association 109 (5):874–82. doi: 10.1016/j.jada.2009.02.012.
- Park, Y., K. W. Dodd, V. Kipnis, F. E. Thompson, N. Potischman, D. A. Schoeller, D. J. Baer, D. Midthune, R. P. Troiano, H. Bowles, et al. 2018. Comparison of self-reported dietary intakes from the Automated Self-Administered 24-h recall, 4-d food records, and food-frequency questionnaires against recovery biomarkers. The American Journal of Clinical Nutrition 107 (1):80–93. doi: 10.1093/ajcn/nqx002.
- Perignon, M., G. Masset, G. Ferrari, T. Barré, F. Vieux, M. Maillot, M.-J. Amiot, and N. Darmon. 2016. How low can dietary greenhouse gas emissions be reduced without impairing nutritional adequacy, affordability and acceptability of the diet? A modelling study to guide sustainable food choices. Public Health Nutrition 19 (14):2662–74. doi: 10.1017/S1368980016000653.
- Pfeiffer, C. M., M. R. Sternberg, R. L. Schleicher, B. M. H. Haynes, M. E. Rybak, and J. L. Pirkle. 2013. The CDC’s Second National Report on biochemical indicators of diet and nutrition in the U.S. population is a valuable tool for researchers and policy makers. The Journal of Nutrition 143 (6):938S–47S. doi: 10.3945/jn.112.172858.
- Rasmussen KM, Latulippe ME, Yaktine AL, eds. Food and Nutrition Board. 2016. Review of WIC food packages: Proposed framework for revisions: Interim report. Washington (DC): National Academies Press (US) Copyright 2016 by the National Academy of Sciences. All rights reserved.
- Reedy, J., J. L. Lerman, S. M. Krebs-Smith, S. I. Kirkpatrick, T. E. Pannucci, M. M. Wilson, A. F. Subar, L. L. Kahle, and J. A. Tooze. 2018. Evaluation of the healthy eating index-2015. Journal of the Academy of Nutrition and Dietetics 118 (9):1622–33. doi: 10.1016/j.jand.2018.05.019.
- Shao, J., and J. Rao. 1999. Modified balanced repeated replication for complex survey data. Biometrika 86 (2):403–15. doi: 10.1093/biomet/86.2.403.
- Souverein, O. W., A. L. Dekkers, A. Geelen, J. Haubrock, J. H. de Vries, M. C. Ocké, U. Harttig, H. Boeing, and P. van ‘t Veer, EFCOVAL Consortium. 2011. Comparing four methods to estimate usual intake distributions. European Journal of Clinical Nutrition 65 Suppl 1 (Suppl 1):S92–S101. doi: 10.1038/ejcn.2011.93.
- Subar, A. F., V. Kipnis, R. P. Troiano, et al. 2003. Using intake biomarkers to evaluate the extent of dietary misreporting in a large sample of adults: The OPEN study. American Journal of Epidemiology 158 (1):1–13. doi: 10.1093/aje/kwg092.
- Tooze, J. A., D. Midthune, K. W. Dodd, L. S. Freedman, S. M. Krebs-Smith, A. F. Subar, P. M. Guenther, R. J. Carroll, and V. Kipnis. 2006. A new statistical method for estimating the usual intake of episodically consumed foods with application to their distribution. Journal of the American Dietetic Association 106 (10):1575–87. Octdoi: 10.1016/j.jada.2006.07.003.
- Tooze, J. A., V. Kipnis, D. W. Buckman, R. J. Carroll, L. S. Freedman, P. M. Guenther, S. M. Krebs-Smith, A. F. Subar, and K. W. Dodd. 2010. A mixed-effects model approach for estimating the distribution of usual intake of nutrients: The NCI method. Statistics in Medicine 29 (27):2857–68. doi: 10.1002/sim.4063.
- Traber, M. G. 2014. Vitamin E inadequacy in humans: Causes and consequences. Advances in Nutrition 5 (5):503–14. doi: 10.3945/an.114.006254.
- Vieux, F., L. Privet, and G. Masset. 2018. Food- and diet-based validations of a Nestlé Nutrient Profiling System for reformulation in two nationally representative surveys. The British Journal of Nutrition 120 (9):1056–64. doi: 10.1017/S0007114518002490.
- Waijers, P. M., E. J. Feskens, and M. C. Ocké. 2007. A critical review of predefined diet quality scores. The British Journal of Nutrition 97 (2):219–31. doi: 10.1017/S0007114507250421.
- Zhang, S., D. Midthune, P. M. Guenther, et al. 2011. A new multivariate measurement error model with zero-inflated dietary data, and its application to dietary assessment. The Annals of Applied Statistics 5 (2b):1456–87.
- Zipf, G., M. Chiappa, and K. S. Porter. 2013. National health and nutrition examination survey: Plan and operations, 1999–2010. National Center for Health Statistics. Vital Health Statistics 1 (56).