
Abstract
Biofilms are widespread in nature and constitute an important strategy implemented by microorganisms to survive in sometimes harsh environmental conditions. They can be beneficial or have a negative impact particularly when formed in industrial settings or on medical devices. As such, research into the formation and elimination of biofilms is important for many disciplines. Several new methodologies have been recently developed for, or adapted to, biofilm studies that have contributed to deeper knowledge on biofilm physiology, structure and composition. In this review, traditional and cutting-edge methods to study biofilm biomass, viability, structure, composition and physiology are addressed. Moreover, as there is a lack of consensus among the diversity of techniques used to grow and study biofilms. This review intends to remedy this, by giving a critical perspective, highlighting the advantages and limitations of several methods. Accordingly, this review aims at helping scientists in finding the most appropriate and up-to-date methods to study their biofilms.
Introduction
Microbial biofilms are commonly defined as sessile microbial consortia established in a three-dimensional structure and consist of multicellular communities composed of prokaryotic and/or eukaryotic cells embedded in a matrix composed, at least partially, of material synthesized by the microbial community (Costerton et al., Citation1999). Biofilm formation is a multistage process that starts with microbial adhesion with a subsequent production and accumulation of an extracellular matrix composed by one or more polymeric substances such as proteins, polysaccharides, humic substances, extracellular DNA and sometimes other molecules such as those involved in cell-to-cell communication (Flemming & Wingender, Citation2010).
Biofilm science and technology has been an active field of study since the late seventies when the first definition of biofilms was brought to public attention by Bill Costerton and coworkers in 1978 (Costerton et al., Citation1978). Today, it is well established that the majority of microbes found in nature exist attached to surfaces within a structured biofilm ecosystem and not as free-floating organisms. The perception of biofilms has changed considerably during the last four decades as a consequence of the technology development and adaptation to biofilm science, including new imaging technologies, biochemical methods and molecular ecosystem biology tools. It is now possible to get an overall view of the 3-D biofilm structure and a more detailed knowledge of the structure down to the nano-scale level (Neu & Lawrence, Citation2015).
Simultaneously, it is also now conceivable to obtain a deeper understanding of the physiology of the biofilm cells, the genotypic and phenotypic variation among the biofilm community, as well as the biofilm metabolome, proteome and transcriptome (Raes & Bork, Citation2008). The same way, biofilm technology also evolved towards the development of biofilm devices that better mimic real environmental conditions.
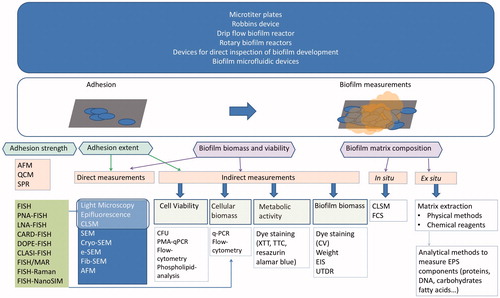
A deeper knowledge of the biofilm as a whole and at a single cell level and how it interplays with the surrounding environment will aid the development of efficient methods to control deleterious biofilms (clinical biofilms, food contaminants, biofouling on industrial equipment and on ship hulls) or to enhance and modulate beneficial ones (for waste-water treatment, bioremediation, production of electricity and bio-filtration). This requires a multidisciplinary approach assisted by adequate methods. This article comprises a comprehensive and critical review on several biofilm methods (summarized in ), aiming at guiding scientists into the most appropriate and cutting edge techniques for a better understanding of biofilms.
Figure 1. Overview of methods to grow and characterize biofilms, which includes different biofilm devices, methods to assess adhesion extent and strength, and techniques to measure biofilm biomass, viability and matrix composition. © Joana Azeredo.
Biofilm formation devices
Choosing the experimental platform for biofilm experiments determines what kind of data can be extracted, and care must be taken to ensure that the selected platform will fulfill the requirements of the experiments. All platforms have advantages and limitations, which will be highlighted here and summarized in .
Table 1. Biofilm cultivation devices.
Microtiter plates
Biofilm formation in microtiter plates is certainly the most commonly used method (). Originally developed by Madilyn Fletcher to investigate bacteria attachment (Fletcher, Citation1977), it further proved to be compatible with the study of sessile development (O'Toole & Kolter, Citation1998). In the classical procedure, bacterial cells are grown in the wells of a polystyrene microtiter plate (Djordjevic et al., Citation2002). At different time points, the wells are emptied and washed to remove planktonic cells before staining the biomass attached to the surface of the wells. Biofilm biomass can alternatively be quantified by detachment and subsequent plating.
Figure 2. The microtiter plate (MTP) system and the calgary biofilm device (CBD). © Claus Sternberg.
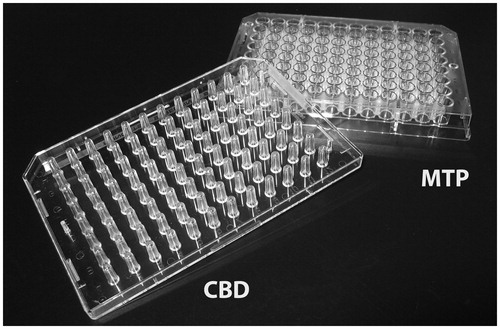
In the microtiter plate assay, the biofilm biomass is assessed by measuring all attached biomass. However, parts of the biomass may stem from cells sedimented to the bottom of the wells, and subsequently embedded by extracellular polymeric substances (EPS). This biomass is thus not solely formed as the result of a biofilm forming process. To overcome this artifact, the Calgary biofilm device was developed (Ceri et al., Citation1999). In the Calgary biofilm device, biofilm formation is assayed at the coverlid, composed of pegs that fit into the wells of the microtiter plate containing the growth medium and bacteria (). The biofilm formed on the pegs does not result from cell sedimentation but only from sessile development. In this system, biomass quantitation generally involves bacterial cell recovery from the pegs by sonication, which has some limitations. First, only a fraction of the sessile community can be suspended by sonication, typically between 5% and 90% of the community (Edmonds et al., Citation2009; Muller et al., Citation2011). Second, the physiological properties of the detached population may not reflect the physiology of sessile cells, as different populations could exhibit different adhesive and detachment properties on the material (Grand et al., Citation2011).
In both microtiter tray based assays, the pegs or wells can further be coated with different molecules to investigate or promote biofilm formation to different biotic and abiotic supports. However, none allows biofilm formation to be easily followed by direct observation with microscopy.
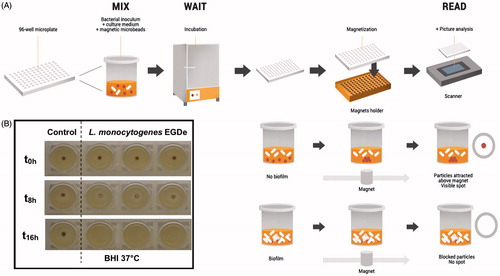
A method devised specifically for investigating early stages of biofilm development is the Biofilm Ring Test (Chavant et al., Citation2007), based on the capacity of bacteria to immobilize microbeads when forming a biofilm at the surface. A bacterial suspension is mixed with paramagnetic microbeads before being loaded into the wells of a microtiter plate. The microtiter plate is then incubated and direct measurements can be performed at different time points, without any staining and washing steps. The basis of the assay is the blockage of the beads by developing biofilm matrix – the more biofilm, the less the beads can move when a magnetic field is applied ().
Figure 3. The Biofilm Ring Test protocol. The Biofilm Ring Test is based on the capacity of bacteria to immobilize microbeads when forming a biofilm at the surface. (A) A bacterial suspension is mixed with paramagnetic microbeads before being loaded into the wells of a microtiter plates. The microtiter plates is then incubated and direct measurements can be performed at different time points, without any staining and washing steps. First, the wells are covered with a contrast liquid, an inert opaque oil, allowing to read the microtiter plate with a plate reader specifically designed for the Biofilm Ring Test. Then, the microtiter plate is placed for 1 min on a block consisting of individual magnets centered under the bottom of each well. Free (unblocked) paramagnetic microbeads are concentrated in the center of the bottom of the wells after magnet contact, forming a black ring, whereas those blocked by sessile cells remain in place. (B) Kinetic of biofilm formation on polystyrene microplates by Listeria monocytogenes EGDe with the Biofilm Ring Test after different incubation times. Control with only BHI medium and contrast liquid and assays after magnetization (second scan). Schematic in panel A courtesy of Thierry Bernardi, BioFilm Control SAS, Saint-Bauzire, France. © Thierry Bernardi. Reuse not permitted.
The Biofilm Ring Test requires no intervention on the mixture initially inoculated, such as fixation or staining procedures, avoiding all steps that typically generate some significant bias in the results between persons or laboratories. Like the Calgary biofilm device it was originally developed to rapidly screen antibiotics or biocides against sessile bacteria and thus determine the minimum biofilm eradication concentration (Olson et al., Citation2002), but just in a couple of hours. The Biofilm Ring Test was further developed to test the sensitivity to antibiotics of clinical isolates in biofilm as “the antibiofilmogram”, which provides complementary and sometimes more relevant information compared to a classical antibiogram. The Biofilm Ring Test has also been extended to study the contribution of different molecular determinants to the mechanisms of biofilm formation by different bacterial species (Badel et al., Citation2008, Citation2011). Like the microtiter plate, the Biofilm Ring Test is sensitive to sedimentation due to gravity. However, since the Biofilm Ring Test is intended for use primarily in the early stages of biofilm formation, this problem may be of less importance.
Each of the different static devices described above present some advantages and disadvantages, which must be considered before using them together or separately. Compared to microtiter plates or the Calgary biofilm device, the Biofilm Ring Test is faster in providing data (generally within a couple of hours). The Biofilm Ring Test actually measures the blockage of microbeads at the early stage of biofilm formation (Nagant et al., Citation2010), but like the two other techniques, it does not provide information about structure or thickness of the mature biofilms. In that sense, the Biofilm Ring Test is mainly a technique to measure biofilm formation, whereas microtiter plates and the Calgary biofilm device are much more appropriate to provide information at later stages of biofilm formation and maturation (Renier et al., Citation2014). Using specialized microtiter plates it is possible to follow biofilm development using an inverted microscope, whereas this is not possible using standard microtiter plates. Microtiter plates can be used to follow biofilm formed at the air–liquid interface by assaying the biomass ring left on the wells but neither the Calgary biofilm device nor the Biofilm Ring Test are appropriate for such analyses. The microtiter tray based techniques are all batch experiments prone to exhaustion of nutrients unless special actions are taken to replenish. While this may be appropriate for (large scale) screening purposes, other investigations may require specific hydrodynamic conditions, substratum composition or large quantity of biomass material that the microtiter tray based methods cannot provide. The choice of the device depends on the scientific question and a complete characterization of biofilm formation ability for a strain generally requires combining different approaches (Puig et al., Citation2014; Renier et al., Citation2014).
Robbins device
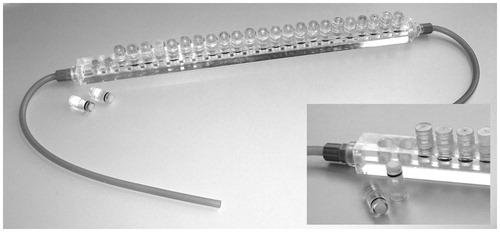
The Robbins device is based on the design of Jim Robbins and Bill McCoy, and later patented in a revised version by the Shell Oil Company (Salanitro & Hokanson, Citation1990). It consists of a pipe with several threaded holes where coupons are mounted on the end of screws placed into the liquid stream (McCoy et al., Citation1981). The coupons are aligned parallel to the fluid flow and can be removed independently. The original Robbins device was used to monitor biofilm formation under different fluid velocities in a simulated drinking water facility (McCoy et al., Citation1981). This has subsequently been adapted for use in smaller scale laboratory experiments and has become an established model system for studying various aspects of biofilm formation under controlled conditions (Nickel et al., Citation1985). The modified Robbins device consisted of a square channel pipe with equally-spaced sampling ports attached to sampling plugs aligned with the inner surface, without disturbing the flow characteristics (), a considerable advance over the original device. This device can operate under different hydrodynamic conditions, from laminar to turbulent flow conditions (Linton et al., Citation1999). The applications of the modified Robbins device are vast, from biomedical to industrial scenarios. Since the device is not designed to allow direct observation of the biofilm development, coupons must be removed for examination. This can introduce artifacts due to the handling of the samples. Additionally, the user must have prior knowledge of the flow dynamics inside the device in order to make sure that the flow is completely developed in the area where the coupons are located. Entry effects are common on these devices and therefore a stabilization length is required to allow direct comparison of the biofilm obtained in different coupons (Teodosio et al., Citation2013b). However, the versions of the Robbins device have the advantage that they can sustain continued biofilm growth for several weeks or more without interruption (Manz et al., Citation1993; Teodosio et al., Citation2011, Citation2012).
Figure 4. The Modified Robbins Device. In the Modified Robbins Device (MRD) sample, coupons are inserted into the liquid stream. The coupons are mounted on small pistons that can be removed for inspection (see inset). The samples distal to the inlet will experience different nutritional environment than those proximal to the inlet, due to consumption. The Modified Robbins Device and the Robbins Device were originally designed for low nutrient (drinking water), high flow rate systems where this effect has less significance. © Claus Sternberg.
Drip flow biofilm reactor
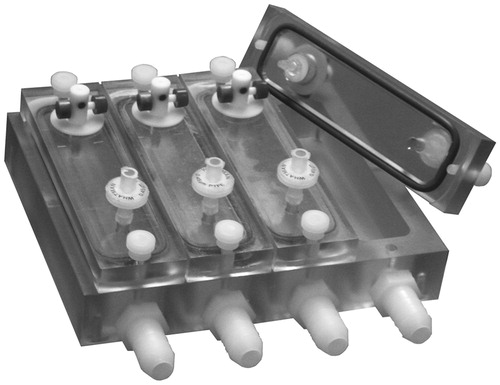
The drip flow biofilm reactor was developed by Darla Goeres and colleagues from the Center for Biofilm Engineering, Montana State University (Goeres et al., Citation2009). The current drip flow biofilm reactor consists in a device with four parallel chambers with vented lids (). Each chamber contains a coupon (e.g. a standard microscope slide) where the biofilm can form. The microbial growth medium or cell suspension enters in each chamber through a gauge needle inserted through the lid septum. During operation, the reactor tilts 10° from horizontal and the fluid passes through the length of coupons (Agostinho et al., Citation2011; Buckingham-Meyer et al., Citation2007; Stewart et al., Citation2001). The drip flow biofilm reactor has several advantages: small space needed, easy operation, simultaneous use of different surface materials and possibility to analyze samples noninvasively. Therefore, this reactor has been extensively used for different assays, e.g. to assess the effect of disinfection strategies and nanocomposites on biofilm control under low shear stress (Buckingham-Meyer et al., Citation2007; Sawant et al., Citation2013; Stewart et al., Citation2001), to mimic indwelling medical devices and evaluate antimicrobial properties (Ammons et al., Citation2011; Carlson et al., Citation2008). Limitations of this device include biofilm heterogeneity on the coupons associated with the device hydrodynamic and the low shear stress, low similarity with industrial conditions and the limited number of samples.
Figure 5. The Drip Flow Biofilm Reactor. Commercial version of the drip flow biofilm reactor, with four chambers each accommodating a microscope slide. © Bryan Warwood. Reuse not permitted.
Rotary biofilm reactors
There are three main types of rotary biofilm reactors including the rotary annular reactor, the rotary disk reactor and the concentric cylinder reactor.
The development of the rotary annular reactor is attributed to Kornegay and Andrews in 1968 and this reactor can also be called the rototorque or the annular reactor (Kornegay & Andrews, Citation1968; Pavarina et al., Citation2011). The reactor is composed by a stationary outer cylinder and a rotating inner cylinder. A variable speed motor controls the rotation frequency of the internal cylinder so that a well-mixed liquid phase, turbulent flow and constant shear stress fields may be obtained (Lawrence et al., Citation2000). These reactors use retrievable coupon surfaces where the biofilms grow and enable a vast array of chemical and biochemical analyses as well as microscopy observation of the biofilms (Teodosio et al., Citation2013a). In the rototorque reactor, coupons are fixed onto the static external cylinder whereas in most Annular Reactors, coupons are mounted onto the rotating inner cylinder. Coupons can be made from a variety of materials and during operation they are subjected to identical hydrodynamic conditions (Teodosio et al., Citation2013a).
The annular reactor has been successfully used to simulate biofilms that occur in drinking water systems, river ecosystems, hulls of ships and also to assess the effect of nutrient concentration, surface properties or the efficiency of antimicrobial agents in biofilm eradication (Pavarina et al., Citation2011). The rototorque reactor has been used for instance to study gene expression, enzymatic activity and also to develop biofilm control strategies (Pavarina et al., Citation2011).
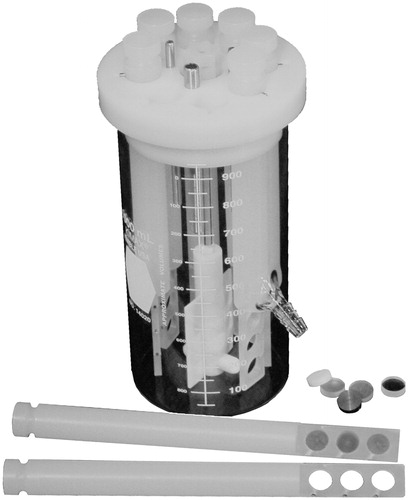
The rotary disk reactor contains a disk, which is designed to hold several coupons. This disk is attached to a magnet that provides adjustable rotational speed when the reactor is placed on top of a magnetic stirrer (Coenye & Nelis, Citation2010). The disk rotation creates a liquid surface shear across the coupons and as they are placed at the same radial distance they will experience a similar shear stress field. Thus, different shear stresses can be tested simultaneously by placing the coupons at different radial orbits. This reactor has been used to study biofilm resistance, to develop biofilm control strategies or to evaluate interspecies interactions in multispecies biofilms (Coenye & Nelis, Citation2010). It is also used in the ASTM standard methods E2196-12 and E2562-12 for quantification of Pseudomonas aeruginosa biofilms, in the version also known as the “CDC rotary biofilm reactor” (), named after the Center for Disease Control in the USA (ASTM, Citation2012a, b).
Figure 6. The Center for Disease Control (CDC) biofilm reactor. The CDC Biofilm Reactor consists of eight (8) polypropylene coupon holders suspended from a UHMW-polyethylene ported lid. The coupon holders can accommodate three 1/2 inch (12.7 mm) diameter coupons each. The lid with coupon holders and coupons is mounted in a 1 L glass vessel with side-arm discharge port. A liquid growth media is circulated through the vessel while mixing and shear is generated by a magnetic stir bar rotated by a magnetic stir plate. Image and description text courtesy of Bryan Warwood, BioSurface Technologies Corp, Bozeman, MT. © Bryan Warwood. Reuse not permitted.
The concentric cylinder reactor is composed of four cylindrical sections that can be rotated at variable speeds within four concentric chambers. This configuration allows for simultaneous testing of different shear stresses, which are dependent on the surface radius (Willcock et al., Citation2000). The reactor enables testing of the same bacterial suspension in different hydrodynamic conditions but it can also be used to test different suspensions as each chamber of the concentric cylinder reactor contains independent feeding and sampling ports. Major limitations of this reactor are that only one surface can be tested per experiment and that the sampling process is difficult. This reactor has been used to study the effects of shear stress on biofilm formation by freshwater bacteria (Peterson et al., Citation2011).
The major advantages of these reactors are that the biofilms are formed in relatively constant shear stress fields and in the case of the rotary annular reactor and the rotary disk reactor different surfaces can be tested simultaneously. Thus, coupons can be made from different materials like PVC, steel, plastics, or can be coated with biologically relevant substrates or materials that are used in implants. Another important advantage is that the rotation frequency of the cylinders or the disk in the rotary disk reactor can be set independently of the feed flow rate. Thus, the dilution rate becomes independent of the shear stress and therefore both parameters can be adjusted separately (Teodosio et al., Citation2013a). The major weakness of these reactors is that the number of individual strains that can be analyzed simultaneously is low as only one per experiment in the rotary annular reactor and rotary disk reactor and up to four can be used in the concentric cylinder reactor. Another weakness it that due to the semi-open design, contamination problems are common, and these may be difficult to sort out. Thus, high-throughput analysis of large numbers of strains is not possible with these systems.
Devices for direct inspection of biofilm development
The Robbins device, the modified Robbins device and the drip flow reactors all have a common disadvantage: there is little opportunity to follow biofilm development on line and in real time. To record temporal changes in biofilm development, several devices have been designed to allow direct inspection of living biofilms, which may be divided into two general types, an open type and a closed type. In the first, the biofilm can be inspected by placing the sampling probe (e.g. microscope lens or microelectrode) directly in the liquid surrounding the biomass. In the other, the biofilm is encapsulated in a reactor (flow) chamber with an inspection glass or plastic window onto which the biofilm can develop. Then, the microscope lens can record images from the substratum side of the biofilm. In particular, the use of fluorescent gene fusions in combination with confocal microscopy makes flow chambers useful for in situ gene expression studies in live biofilms (Haagensen et al., Citation2007; Moller et al., Citation1998; Sternberg et al., Citation1999).
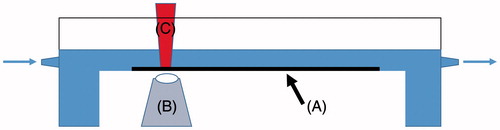
The open channel flat plate reactor represents the first type (Lewandowski et al., Citation2004). It consists of two liquid chambers connected by a beam (). The liquid flows from one chamber, across the substratum and is collected in the other chamber. Fresh medium is added continuously and typically recycled several times before a fraction is purged. This system is quite versatile but allows only single experiments to be carried out at one time, and requires a large volume of medium. It has the clear advantage of allowing direct access to the biofilm for manipulation or sampling. At the same time this design potentially allows easy contamination of the system (Lewandowski & Beyenal, Citation2014; Lewandowski et al., Citation2004).
Figure 7. Open Flat Channel Flow Chamber. The substratum (A) is placed at the bottom of the chamber where it is irrigated with media (which can be recirculated). The development can be followed using a microscope camera from the bottom (B). Samples can be taken from the biofilm from the top (C) Adapted from Lewandowski et al. (Citation2004). © Claus Stern.
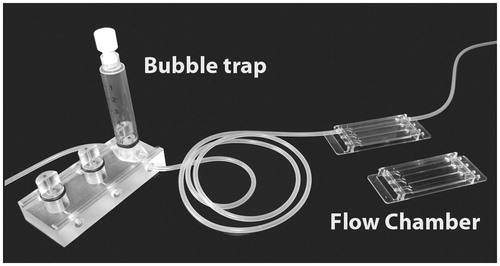
To allow for many parallel biofilm flow chambers a closed miniature design was created by Wolfaardt et al. (Citation1994). Here a Plexiglas slab is milled with several 1 mm deep channels, with connecting bores in each end. The flow chamber is sealed with a microscope cover glass, which is glued to the flow cell with silicone or similar glue. Media flows through the channels while microscopic examination can be performed on-line. Variations of this reactor are now available commercially (e.g. Ibidi GmbH, Martinsried, Germany) or on a nonprofit basis from academic sources () (Bakker et al., Citation2003; Tolker-Nielsen & Sternberg, Citation2011; Zhao et al., Citation2014).
Figure 8. Flow chamber system. The setup consists of a bubble trap to capture small air bubbles in the medium and the flow chamber. In this example the flow chambers are molded in poly-ethylene. On top of the flow chambers, a microscope coverslip is attached using silicone glue. Only one channel is mounted with silicone tubing. For details see Tolker-Nielsen & Sternberg (Citation2014). © Claus Sternberg.
The flow chamber biofilm systems require considering of the flow conditions inside the channels. Depending on the geometry of the flow chamber and the flow rate, the flow may be laminar or turbulent, influencing the distribution of nutrients and dismissal of waste products, and ultimately biofilm structure (Lewandowski & Beyenal, Citation2014; Skolimowski et al., Citation2010; Stoodley et al., Citation1998).
Biofilms in closed flow channels are vulnerable to the passage of air bubbles, which might cause detachment of biofilm portions (Gomez-Suarez et al., Citation2001). Therefore systems to remove stray bubbles have been developed, such as bubble traps () (Christensen et al., Citation1999; Tolker-Nielsen & Sternberg, Citation2011) and a simple approach consisting on placing the supply bottle above the chambers and passively draw medium in instead of pumping it (Crusz et al., Citation2012). In general, flow chamber systems have the advantage over the microtiter plate based systems that they easily allow on-line monitoring of dynamic, evolving systems. For most of these systems sampling of cells from the running systems is difficult if not impossible, except for the open channel flat plate type reactors.
Biofilm microfluidic devices
Microfluidic devices present a promising platform for bacterial biofilm studies. They provide a closed system where bacterial biofilms can interact with hydrodynamic environments, and allow developing mathematical models that account for influences of these interactions and reveal the effects of hydrodynamic conditions on biofilm development (Janakiraman et al., Citation2009). Microfluidic channels may be designed to elucidate the combined effects of several influencing factors on biofilm formation (Lee et al., Citation2008). Stable flow conditions in microfluidic devices facilitate the generation of flow-free, steady gradients of arbitrary shape, allowing the study of bacterial chemotaxis (Long & Ford, Citation2009; Mao et al., Citation2003). Microfluidic devices can be fabricated from a range of materials using different methods, such as photolithography and wet etching methods (Madou, Citation2011). Fabrication typically consists of forming channels on the surface of a solid substrate, drilling or punching access holes into the substrate, and finally bonding it to another plate to seal the channels. Tubing or reservoirs can then be connected to the access holes, allowing solutions to be introduced. Currently, microfluidic devices are fabricated from glass (Iliescu et al., Citation2012), duroplastic or thermoplastic materials (Becker & Gartner, Citation2008), and from the flexible elastomer poly-dimethylsiloxane (PDMS) (McDonald et al., Citation2000). Due to its suitability to rapid prototyping, PDMS is one of the most commonly used materials for microfluidic systems. It is sometimes required that microchannel surfaces be modified to exhibit certain properties or functional groups, which can be achieved by techniques, such as organosilanes deposition (Glass et al., Citation2011; Pallandre et al., Citation2006). Several methods are also available for pumping solutions through microfluidic channels, but the most common are hydrodynamic and electro-osmotic flow (EOF)-based pumping (Au et al., Citation2011).
Many detection methods have been developed for microfluidic devices. Off-chip detection with conventional methods is feasible if a suitable volume of sample can be collected. However, on-chip detection is normally desired to get a fully integrated device or to observe in situ and real time effects. Optical detection methods are often employed (Meyer et al., Citation2011; Zhu et al., Citation2013) in particular fluorescence (Johnson & Landers, Citation2004). Many studies have applied microfluidic technology due to its remarkable potentials: small liquid volume control, confining cells and molecules in a spatial geometry, temperature control and precise gradient generation, enabling low cost, rapid and precise analysis.
Microfluidic devices (except for the above described flow chambers) are still not frequently employed. Currently only few commercial suppliers offer microfluidic biofilm devices, the most prominent being the BioFlux by Fluxion Systems (South San Francisco, CA). In this system, biofilm formation can be followed by light microscopy in microfluidic wells (Benoit et al., Citation2010). The Bioflux provides controlled conditions and the ability of including up to 24 replicates. In addition, applied media volumes are small (ca. 1 mL), making this system highly applicable for screening of biofilm inhibitory agents, antibodies or other compounds. A major drawback of the Bioflux system is the high running cost – one microtiter plate cost about 250 EUR at the time of writing (2016).
Custom-made microfluidic devices using PDMS techniques for manufacturing have been employed by several groups, e. g. systems where compartments are separated by a semi-diffusible membrane to allow the study of nutrient or signal molecules (Kim et al., Citation2012; Skolimowski et al., Citation2010, Citation2012), a system employing a micro-structured surface to study filamentous biofilm (steamer) formation (Hassanpourfard et al., Citation2014), a simple device for easy microscopic investigations of biofilms using reflection confocal microscopy (Yawata et al., Citation2010), a system to study the influence of shear stress due to changes in flow conditions (Salta et al., Citation2013), a system to allow the assessment of the effects of antibiotics in an on-line mixing system (Terry & Neethirajan, Citation2014), and a system to online study the development of biomass (biofilm thickness) (Meyer et al., Citation2011). The general usability of microfluidic techniques is, however, still limited by the difficulty of the methodology and the skills needed for successful employment.
Measurement of biofilms
Biofilm biomass and viability
Biofilm biomass and viability can be assessed by different methods that rely on microbiological and molecular methods, or on physical or chemical properties of the biofilm. Microscopy methods are also important tools for assessing biofilm biomass properties as they allow describing biofilm spatial organization, their heterogeneities and links with the community functions in a more direct way. summarizes the methods described below with their applications, advantages and limitations.
Table 2. Biofilm biomass, viability and EPS measurements.
Microbiological and molecular methods
The most widely used technique to estimate biofilm cell viability is the determination of colony forming units (CFU) on agar media. Based on the universal dilution series approach used to quantify cells, this technique is available in every microbiological laboratory. However, this method presents serious drawbacks and limitations (Li et al., Citation2014): (i) the fraction of detached live cells may not be representative of the initial biofilm population and (ii) a subpopulation of biofilm cells can be viable but non-culturable (VBNC) and would not be detected by the CFU approach. Alternatively, flow cytometry, coupled with a few possible fluorophores, has been used to quickly and accurately determine biofilms cell viability (Cerca et al., Citation2011; Oliveira et al., Citation2015). While definitively more expensive, flow cytometry resolves both limitations of CFU counting by allowing differentiating between total, dead and VBNC.
Quantification of biofilm viable organisms by quantitative polymerase chain reaction (qPCR) has been proposed as an alternative to culture. However, this approach can overestimate the number of viable cells due to the presence of free extracellular DNA (eDNA) (Klein et al., Citation2012) and DNA derived from dead cells. To avoid quantification of DNA not derived from living cells, samples can be treated with propidium monoazide (PMA) prior to DNA extraction (Alvarez et al., Citation2013; Kruger et al., Citation2014; Yasunaga et al., Citation2013). This molecule enters only membrane-compromised cells, intercalating between bases, and also interacts with eDNA (Nocker et al., Citation2007; Waring, Citation1965). The sample is then exposed to strong visible light, leading to a stable covalent bond of PMA with DNA. This modified DNA is lost during DNA extraction and will not be amplified during qPCR (Nocker et al., Citation2009). PMA-qPCR has been used to enumerate viable cells in biofilms (Chen & Chang, Citation2010; Pan & Breidt, Citation2007) and to quantify individual members in mixed-species biofilms. However, the technique has some drawbacks: (i) discrimination between viable and dead cells is only based on membrane integrity, so the effect of antimicrobials not affecting membrane integrity cannot be monitored (Nocker & Camper, Citation2009; Tavernier & Coenye, Citation2015); (ii) viable cells with only a slightly damaged cell membrane may not be accounted for (Strauber & Muller, Citation2010); (iii) the presence of a high number of dead cells can affect viable cell quantification (Fittipaldi et al., Citation2012) and (iv) the presence of PMA-binding compounds in the sample can prevent efficient PMA–DNA binding (Taylor et al., Citation2014).
Physical methods
Total biofilm biomass can be obtained from dry or wet weight measurements. Trulear and Characklis calculated biofilm biomass as a weight difference between the dried slide with biofilm and the cleaned dried slide before biofilm formation (Trulear & Characklis, Citation1982). The authors also calculated the volumetric biofilm density as a unit of dry biofilm mass per unit of wet volume. Using another approach to assess biofilm biomass, test surfaces with attached cells were vortexed and the released biofilm components were then filtered (Jackson et al., Citation2014). Biofilm biomass was expressed as a weight of a dried filter containing biofilm components against the weight of the sterile control filter. The latter method, however, can underestimate biofilm biomass because it does not remove the whole biofilm from the test surface, and small molecules can pass through the filter. This method presents several limitations related to time consumption and lack of sensitivity when detecting small changes in biofilm production.
Electrochemical impedance spectroscopy (ECIS) has been extensively used to study microbial electrochemical systems and can be used to indirectly assess biofilm biomass (Dominguez-Benetton et al., Citation2012). The principal of ECIS lies in the detection of changes in the diffusion coefficient of a redox solute, which is recorded as an electrochemical reaction measured on the electrode. The reaction of a redox solute (tracer) on the electrode depends on the local mass transfer coefficient, and tracer current reduces gradually with increasing biofilm thickness. ECIS has been improved by direct biofilm observation through the electrode using a digital camera (Cachet et al., Citation2001).
A physical method extensively used to measure biofilm thickness is based on ultrasonic time-domain reflectometry (Sim et al., Citation2013). Biofilm thickness is obtained from the difference between acoustic impedance measured on each side of the biofilm interface. Other physical techniques, such as X-ray computed tomography, nuclear magnetic resonance (NMR) imaging and small-angle X-ray/neutron scattering, can be used to study biofilm structures (Chen et al., Citation2004), providing information about size, shape and orientation of some components rather than biofilm thickness per se.
Biofilm thickness can also be indirectly estimated by evaluating the effect of biofilm on fluid transport properties. Biofilm formation increases fluid frictional and heat transfer resistance (Trulear & Characklis, Citation1982). Using a two-component laser Doppler velocimeter, Schultz and Swain measured profiles of the mean and turbulence velocity components in a boundary layer flow and reported dependence between biofilm thickness and skin friction coefficient (Schultz & Swain, Citation1999). Another method, the Combined Monitor for Direct and Indirect Measurement of Biofouling (CMDIMB), monitored fluid transport properties in a heat exchanger unit (Eguia et al., Citation2008). This enabled biofilm characterization by mathematical calculation of frictional resistance and heat transfer resistance, i.e. the variables that indirectly defined biofouling (mass and thickness) deposited in the unit.
Chemical methods
Chemical methods make use of dyes or fluorochromes that are able to bind to or adsorb onto biofilm components. They are indirect methods and can be used to measure specific biofilm components, such as those comprising EPS. Crystal Violet (CV) staining for biofilm quantification remains the most frequently used quantification technique in microtiter plate assays (Christensen et al., Citation1985; Fletcher, Citation1977). These assays stain both live and dead cells as well as some components present in the biofilm matrix, thereby being well suited to quantify total biofilm biomass (Pitts et al., Citation2003). It can be adapted for various biofilm formation assays but some modifications can influence results. The washing steps aim at removing the unattached cells and the unbound dye, but their stringency can result in detachment and removal of some sessile bacterial cells. The extent of cell detachment upon a passage of an air-bubble is highly dependent on the microbial surfaces, conditioning film and the velocity of air-bubble passage. Rinsing and dipping implicate the contact with a moving air–liquid interface, which leads to the detachment of an unpredictable number of adhering microorganisms (Gomez-Suarez et al., Citation2001). Therefore, removing or adding the solutions by hand or automatic/robot pipetting is far different from tapping the microtiter plate to discard the liquid or by running tap water to wash the wells. The washing procedure is thus not trivial but must consider the type of biofilm, strength of adherence and bacterial species. Stains other than CV, e.g. safranin, can be used to stain bacterial biomass (Christensen et al., Citation1982). Regarding release of the bound dye, concentrated ethanol is generally applied but, practically, acetic acid solution (33%) proved to be much quicker and efficient for this purpose (Stepanović et al., Citation2000). To limit extensive detachment of the sessile biomass, it is recommended to add a fixation step with absolute ethanol, methanol or heat fixation at 60 °C for 1 h which can be applied just before the dye staining step (Stepanovic et al., Citation2007). The fixation step will also enhance reproducibility of the assay. While being an indirect method for the estimation of the adhered biomass, the microtiter plate dye-staining method offers three main advantages: (i) versatility, since it can be used with a broad range of different bacterial species, as well as eukaryotic cells such as yeasts or fungi (Reynolds & Fink, Citation2001); (ii) microorganisms do not need to be detached from the support as required for plate counts, avoiding biased estimate of the number of cells in the biofilm due to the VBNC state; and (iii) the high-throughput capability of the method, allowing testing of many different conditions simultaneously. Limitations include (i) bias of the estimate of sessile development capability of microorganisms forming loose biofilms, due to the washing steps; (ii) the assay correlates with any attached bacterial biomass, which under batch conditions can result both from sessile bacteria development at the surface and from sedimentation/adhesion of planktonic cells due to e.g. gravitation. Appropriate washing steps can remove sedimented non-attached cells limiting or eliminating this problem; (iii) lack of reproducibility (Arnold, Citation2008; Peeters et al., Citation2008); (iv) nonspecific nature of CV that does not allow species differentiation in poly-microbial communities; (v) absence of a standardized protocol, despite its widespread use, resulting in a broad variety of staining protocols (Stepanovic et al., Citation2007) that make comparison of results between studies difficult.
Colorimetric methods have also been used to assess cellular physiology in biofilms. The basic principle is the conversion by cellular metabolic activity of specific substrate into a colored product measurable with a spectrophotometer. Koban and coworkers reported the use of XTT (2,3-bis-(2-methoxy-4-nitro-5-sulfophenyl)-2H-tetrazolium-5-carboxanilide inner salt), a tetrazolium salt, that is cleaved by dehydrogenase enzymes of metabolic active cells in biofilms into strongly colored formazan (Koban et al., Citation2012; Ramage, Citation2016; Ramage et al., Citation2001). Sabaeifard et al. recently optimized another tetrazolium salt, TTC (2,3,5-triphenyl-2H-tetrazolium chloride) to quantify metabolic activity in biofilms (Sabaeifard et al., Citation2014).
Resazurin, also known as Alamar Blue, is a stable redox indicator that is reduced to resorufin by metabolically active cells (O'Brien et al., Citation2000; Pettit et al., Citation2005). This dye is being increasingly used to study microbial biofilms (Peeters et al., Citation2008; Tote et al., Citation2009; Van den Driessche et al., Citation2014), offering multiple advantages compared to the tetrazolium salt assays: (i) conversion of the blue non-fluorescent resazurin to the pink and highly fluorescent resorufin can be monitored visually, by spectrophotometry or spectrofluorometry (for increased sensitivity); (ii) is less time-consuming (Peeters et al., Citation2008); (iii) resazurin is not toxic to eukaryotic and prokaryotic cells; and (iv) is inexpensive (O'Brien et al., Citation2000). Overall there is a good correlation between results obtained with resazurin-based quantification and CFU counts (Pettit et al., Citation2009; Sandberg et al., Citation2009; Van den Driessche et al., Citation2014) although relations should be established using calibration curves based on data obtained with biofilm (not planktonic) cells (Sandberg et al., Citation2009). One of the drawbacks of the method as originally described is the high lower limit of quantification (more than 106 to 107 CFU/biofilm to detect a signal higher than the background) (Sandberg et al., Citation2009). Recently, an alternative approach was proposed, in which fresh growth medium is added to the biofilm together with the resazurin (Van den Driessche et al., Citation2014), decreasing the lower limit of quantification to 103 CFU/biofilm; with this alternative approach the effect of anti-biofilm treatments can be quantified more accurately (Van den Driessche et al., Citation2014). A second drawback is that different microorganisms metabolize resazurin at a different rate, requiring different incubation times for biofilms formed by different species and making it difficult to apply this method to poly-microbial consortia (Peeters et al., Citation2008; Sandberg et al., Citation2009; Van den Driessche et al., Citation2014).
Colorimetric methods that quantify exopolysaccharides, total proteins and carbohydrates have been applied to quantify biofilm biomass (Dall & Herndon, Citation1989; Storey & Ashbolt, Citation2002; Wirtanen & Mattila-Sandholm, Citation1993). However, amounts of particular EPS components do not necessarily correlate with biofilm biomass. To avoid this, Pinkart and coworkers suggested the measurement of phospholipids, which are cellular components, as these are universally distributed and expressed at a relatively constant level among the microbial community and through the growth cycle (Pinkart et al., Citation2002). Nevertheless, phospholipids determination is limited by their recovery rate, the amount of background lipid contamination and the sensitivity of analytical equipment (Pinkart et al., Citation2002).
Microscopy methods
Several imaging modalities have been used to detect biofilm biomass and cell viability. Here, we discuss several microscopy approaches, highlighting their advantages and disadvantages ().
Table 3. Microscopy techniques applied to the study of biofilms.
Light microscopy remains a useful base-line technique to provide a visual identification of biofilm formation (). Hematoxylin and eosin (H&E), periodic acid-Schiff (PAS), and Brown and Brenn Gram staining have been recently proposed as practical, cheap and reliable methods for detection of bacterial biofilms in different infection foci (Akiyama et al., Citation2003; Bulut et al., Citation2014; Davis et al., Citation2008; Hochstim et al., Citation2010; Oates et al., Citation2014; Toth et al., Citation2011; Winther et al., Citation2009; Zhang et al., Citation2009). The detection of biofilm by these practical and cost-effective staining methods has been used for a quantitative assessment of biofilm biomass (Bakke et al., Citation2001; Bulut et al., Citation2014; de Carvalho & da Fonseca, Citation2007) and could have a significant prognostic value (Hong et al., Citation2014).
Figure 9. Imaging methods for biofilms – Gram stain. Gram-stained section of wound tissue debridement samples collected from patients with chronic diabetic foot wounds. Presumptive bacterial microcolonies and biofilm matrix have been indicated by arrows (Oates et al., Citation2014). © Andrew McBain. Reuse not permitted.
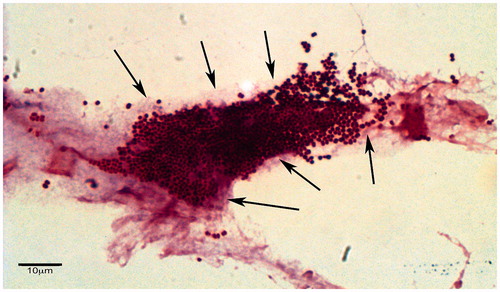
Light absorption by biofilms was found to correlate with biofilm cell mass and total biofilm mass. In a method described by de Carvalho and da Fonseca, the structure and the volume of biofilms were studied using an optical microscope, overcoming the need for expensive microscopes (de Carvalho & da Fonseca, Citation2007). This method is based on the linear relation between the intensity of a pixel in biofilm images grabbed on the x–y plane and the corresponding number of cells in the z direction, which allows the calculation of the biofilm thickness. Light microscopy is advantageous because it requires simple sample preparation, and is cheap and easy to perform. However, it has some inherent limitations: (i) the level of magnification and resolution necessary to determine inter-cellular and cellular-abiotic relationships; (ii) the saturation of pixel intensity, i.e. after achieving the maximum detectable intensity it will become impossible to discern any further difference in thickness; (iii) morphotypic differentiation is relatively gross and lacks discriminatory detail, especially in thicker specimens. On the other hand, because of its relatively low magnification, light microscopy enables the imaging of larger parts of a sample, compared to electron microscopy. For these reasons, correlative studies using light microscopy and Transmission Electron Microscopy (TEM) or Scanning Electron Microscopy (SEM) provided the best combination (Bulut et al., Citation2014; Richardson et al., Citation2009).
Confocal Laser Scanning Microscopy (CLSM) has emerged in the early 90s as the most versatile powerful microscopic technique to decipher biofilm spatial structure and associated functions (Lawrence et al., Citation1991; Neu & Lawrence, Citation2014b). In CLSM, out of focus fluorescent signals are eliminated, and the focal plane is collected with a resolution compatible with single cell visualization (Daddi Oubekka et al., Citation2012). Multi-acquisitions of such planes at different depths in the sample, combined with dedicated image analysis, make it possible to represent the 3-D architecture of the sample and to extract quantitative structural parameters such as the biofilm bio-volume, thickness and roughness (Bridier et al., Citation2010). It has been applied successfully in a wide range of biofilms (Guilbaud et al., Citation2015; Sun et al., Citation2015; Villacorte et al., Citation2015). Biofilm CLSM imaging can be performed with a range of fluorescent probes with unique specificities. The stains most widely used to label microbial cells in the biofilm are cell permeant nucleic acid dyes, e.g. SYTO-9 and SYBR-Green (Neu & Lawrence, Citation2014a, Citationb). Specific microorganisms within a complex community can be localized using specific oligonucleotides employing fluorescent in situ hybridization (FISH) approaches or derived methods (see section below). With laboratory strains, it is also possible to genetically modify organisms to render them auto-fluorescent, for example through the expression of the Green Fluorescent Protein (GFP) or a multicolor variant () (Klausen et al., Citation2003b; Sanchez-Vizuete et al., Citation2015; Tolker-Nielsen & Sternberg, Citation2014). Although the genetic construction of the strains can be difficult and time consuming, this approach has the unique advantage to be compatible with real-time 4-D (x–y–z-time) biofilm imaging (Klausen et al., Citation2003a). In the context of multispecies biofilms, this has allowed the analysis of interspecies competition and interference in-between species (Bridier et al., Citation2014), and identifying key molecular determinants involved in biofilm formation (Klausen et al., Citation2003a; Sanchez-Vizuete et al., Citation2015). Limitations of biofilm analysis by CLSM include: (i) interference of local physico-chemical properties of the biofilm with fluorescence probes and (ii) natural auto-fluorescence of the sample hiding the signal of interest.
Figure 10. Imaging methods for biofilms – confocal microscopy. (A) P. aeruginosa biofilm treated with the antibiotic colistin. The cells express green fluorescent protein (Gfp) and are stained with propidium iodide which gives cells with a destroyed membrane potential red color. In this case, the red cells are corresponding to cells being killed by the antibiotic, whereas the green cells are alive. Bar: 30 μm. For details see Haagensen et al. (Citation2007). © Janus Haagensen. Reuse not permitted. (B) Confocal microscopy combined with image processing. P. aeruginosa PAO1 wild type cells (labeled yellow with YFP) are inoculated in a flow chamber together with an isogenic strain with a pilA mutation (blue BFP labeled). After several days of growth, mushroom structures are formed where the blue non-motile forms the stalks and the yellow wild type cells move to the top of the mushroom structures. The confocal image is treated in Imaris® software with surface rendering. Mushrooms are 80–100 μm high. For details see Klausen et al. (Citation2003b). © Mikkel Klausen. (C) Three-dimensional biofilm matrix structure of C. jejuni at 48 h using fluorescence lectin binding analysis (FLBA) and confocal laser scanning microscopy (CLSM) observations. Biofilm was stained simultaneously with fluorescent probes: Syto9 in green for cell detection and two fluorescently labeled lectins Concanavaline-A (ConA) in blue to detect α-d-mannosyl and α-d-glucosyl residues and wheat-germ agglutinin lectin (WGA) in red to detect N-acetylglucosamine (GlcNAc) residues. For details see Turonova et al. (Citation2016) (see also video S1) © Hana Turoňová. Reuse not permitted.
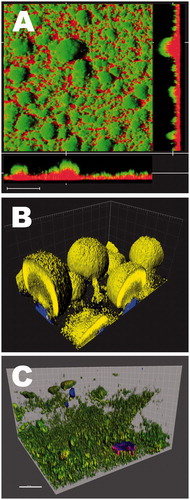
Another possibility offered by CLSM is the analysis of cellular death in a biofilm. Several fluorescent dyes are used in CLSM imaging, the live/dead mixture being one of the most popular. This procedure couples green SYTO-9 (cell permeant) and red propidium iodide (cell impermeant) so that bacteria with a compromised membrane appear yellow or red, while the live viable cells appear green. This labeling can be used for example to analyze the spatial distribution of viable bacteria (Hope et al., Citation2002), observe the existence of localized cell death in biofilms and their regulation (Asally et al., Citation2012; Ghosh et al., Citation2013; Guilbaud et al., Citation2015; Webb et al., Citation2003), and to assess the effect of several antimicrobials on cell viability (Bridier et al., Citation2012; Doroshenko et al., Citation2014; Marchal et al., Citation2011; Verma et al., Citation2010). However, CLSM imagining with live/dead staining should be carefully analyzed since differentiation between the red or green channels is often biased by the intensity of the lasers used. Of utmost importance, alive and dead control samples should be used in every experiment. Also, care should be taken when comparing different biofilms, since the laser penetration on biofilms with different depth can also result in misinterpretation of live/dead data. To decipher the mechanisms of biocide tolerance associated with biofilm architecture, procedures compatible with real-time observation of their action on cell viability were developed (Bridier et al., Citation2011a, b; Corbin et al., Citation2011; Davison et al., Citation2010). Davison and his collaborators proposed an indirect labeling procedure to visualize the spatial and temporal patterns of biocide action against biofilms (Davison et al., Citation2010). This was however limited to Gram-positive bacteria, so Bridier et al. extended the procedure to Gram-negative bacteria using the Chemchrom V6 bioassay (Bridier et al., Citation2011a, b). Despite intrinsic limitations associated with the need to use fluorophores, CLSM still remains a method of choice for biofilm visualization and quantification.
Scanning electron microscopy is based on surface scattering and absorption of electrons. SEM micrographs have a large depth of field yielding a 3-D appearance, useful for understanding the surface structure of the sample, although lacking vertical resolution (Kotra et al., Citation2000). Accordingly, SEM has been a preferred method for visualizing biofilms () since it provides information about the spatial structure and detects the presence of EPS (Hung et al., Citation2013; Rodrigues et al., Citation2013). It is an extremely useful tool for comparative analysis in biofilm research, especially when evaluating the anti-biofilm effects of a compound/treatment. SEM imaging has been generally performed to qualitatively support findings from other quantification methods showing a high correlation (Di Bonaventura et al., Citation2003, Citation2006; Hasan et al., Citation2015; Li et al., Citation2015; Orsinger-Jacobsen et al., Citation2013; Samaranayake et al., Citation2013; Van Laar et al., Citation2015). A quantitative SEM approach for both bacterial and fungal biofilms has been proposed by several authors (Bressan et al., Citation2014; Ceresa et al., Citation2015; Garcez et al., Citation2013; Li et al., Citation2015; Nishitani et al., Citation2015) where high resolution digital SEM images are acquired for a region-of-interest (ROI) analysis, and the biofilm area measured by dedicated imaging software. SEM has many advantages: (i) higher resolution of visualization (from 50 to 100 nm) and depth of field, compared to other imaging techniques (ii) measure and quantification of data in 3-D; and (iii) wide range of magnifications for the analysis of the biofilm sample (20× to 30,000×). SEM downsides arise from the tedious and time-consuming sample preparation process, involving fixation, dehydration and coating with a conductive material, which can destroy the structure of samples or cause artifacts (Hannig et al., Citation2010). Drying causes shrinkage of the biofilm due to the collapse of EPS (Alhede et al., Citation2012). Critical-point drying is the most frequently used method of drying biofilms for SEM, although resulting in a significant loss of EPS (Timp & Matsudaira, Citation2008). The use of sample lyophilization or hexamethyldisilazane is preferable because it is more conservative (Araujo et al., Citation2003; Di Bonaventura et al., Citation2008; Karcz et al., Citation2012). Finally, since SEM imaging requires a high vacuum, specimens must be solid with negligible outgassing. The limitations of SEM have resulted in alternative applications of SEM modalities and preparatory techniques in biofilm studies, such as cryo-SEM and environmental-SEM (ESEM).
Figure 11. Scanning electron image (SEM) of biofilms. (A) Conventional SEM. Staphylococcus aureus biofilm grown on a stainless steel surface, at 38°C. © Pierluigi Aldo Di Ciccio. Reuse not permitted. (B) Cryo Scanning electron microscopy (Cryo-SEM). Cryo scanning electron micrographs of P. aeruginosa (Alhede et al., Citation2012). © Morten Alhede and Thomas Bjarnsholt. Reuse not permitted. (C) Environmental SEM (ESEM). Biofilm formed by Staphylococcus pseudintermedius onto polystyrene following three-day incubation. Biofilm exhibits multilayered organization, with the presence of bacteria linked and/or covered by abundant EPS matrix (as indicated by arrows). Magnification: ×20,000. (Pompilio et al., Citation2015). © Giovanni Di Bonaventura. Reuse not permitted. (D) Focused Ion Beam SEM (FIB-SEM) reconstruction of a three-day-old P. aeruginosa biofilm. The reconstruction is based on imaging of successive slices removed by the ion beam followed by 3-D reconstruction of the biofilm. Matrix components marked red (Alhede et al., Citation2012). © Morten Alhede and Thomas Bjarnsholt. Reuse not permitted.
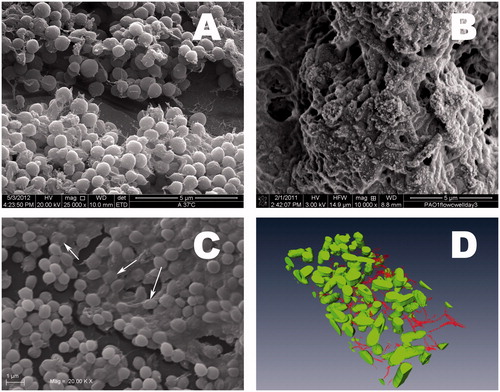
Cryo-SEM: Cryo-fixation allows the preservation of biofilms in a frozen hydrated state, not requiring the preoperational steps of conventional SEM (). This makes sample preparation faster, enabling the investigation of “frozen in time” specimens (Bleck et al., Citation2010). Cryo-SEM also allows for freeze-fracture, where the frozen biological sample is physically broken apart to expose structural detail of the fracture plane, therefore exposing the internal structure of the biofilm that may reveal how the bacteria are interconnected. Deep etching of ultra-rapidly frozen samples permits visualization of the inner structure of cells and their components (Alhede et al., Citation2012; Karcz et al., Citation2012). However, Cryo-SEM has some disadvantages: (i) lower image resolution than conventional SEM, as incomplete sublimation of surface moisture may obscure surface details; (ii) melting and cracking of the frozen surface at high magnifications because of the heat generated by the focused electron beam (Alhede et al., Citation2012); (iii) requirement of highly expensive and specialized equipment, probably explaining its limited use in biofilm studies.
ESEM, unlike Cryo-SEM, retains the integrity of the biofilm in its natural state. Without any pretreatment, the sample is put into a variable pressure chamber, instead of the high vacuum chamber of a traditional SEM, enabling visualization of images at high magnification of hydrated and non-conductive living bacterial biofilms, not affected by dehydration artifacts and loss of mass () (Alhede et al., Citation2012; Bridier et al., Citation2013; Delatolla et al., Citation2009; Hannig et al., Citation2010; Karcz et al., Citation2012; Pompilio et al., Citation2015). However, reduced resolution can occur because of the lack of conductivity in the wet sample, or when a rapid image capture is required for samples moving or changing their structure during examination. Another inherent limitation is sample damage due to a focused electron beam at high magnification (10,000× and more), owing to the absence of metal coating (Alhede et al., Citation2012; Muscariello et al., Citation2005).
Focused Ion Beam-SEM (FIB-SEM) is a novel and more sophisticated tool for the exploration of the subsurface structure of biofilms (). A standard SEM viewing is coupled with FIB milling to, similarly to CLSM, obtain 3-D reconstructions by a process termed “slice and view”. To this, FIB mills away 10-nm thick sections of the sample surface to a specified height, depth and width. The image slices obtained in succession are then stacked by a software to reconstruct the 3-D volume (Alhede et al., Citation2012). Highly precise in producing a cross-section of the sample and not prone to relevant artifacts, FIB-SEM has been mainly used for studying environmental biofilms, allowing new insights on cell-to-cell and cell-to-EPS connections within the sessile communities (Wallace et al., Citation2011). Limitations of FIB-SEM include the probability of needing a vacuum, and the possible decrease in resolution caused by ion beam damage.
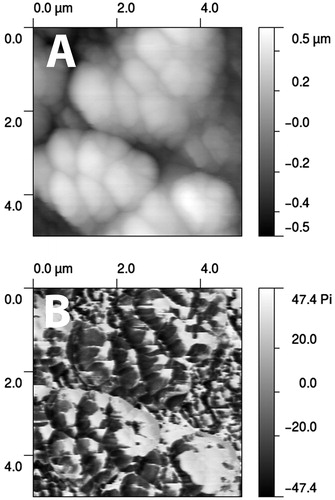
Atomic force microscopy (AFM) is an emerging and powerful technique for imaging biological samples at the nanometer to micrometer scale under nondestructive conditions. The basic principle is to raster scan a sharp tip over the surface of interest while measuring the interaction between the sample and the probe tip, which is on the end of a flexible cantilever. If an attracting force is sensed, the cantilever bends and the force is gauged by measuring the deflection of the cantilever using a laser beam and photodiode (Dufrene, Citation2002; Lower, Citation2011). So, AFM has recently and rapidly evolved into a tool for quantifying the adhesion force between living cells, cells and surface, and even single molecules (Baro & Reifenberger, Citation2012; Beaussart et al., Citation2014). First used by Bremer et al. to visualize biofilms (Bremer et al., Citation1992), AFM has been mainly applied to gain valuable insights in biofilm structure and mechanisms underlying adhesion, as well as single- and multi-strain biofilm formation () (Boyd et al., Citation2014; Cabral et al., Citation2014; Lim et al., Citation2011; Ovchinnikova et al., Citation2013; Potthoff et al., Citation2015). It has also proven useful for quantitative biofilm analysis, especially to confirm findings obtained by quantitative (viable count, CV staining) or other imaging (light microscopy, SEM) techniques (Ansari et al., Citation2013; Chatterjee et al., Citation2014; Li et al., Citation2015; Salunke et al., Citation2014). Among the characteristics of the sample surface examined, height and roughness analyses from AFM images allow quantification of biofilm biomass in terms of thickness and EPS amount, respectively (Ansari et al., Citation2013; Chatterjee et al., Citation2014; Danin et al., Citation2015; Li et al., Citation2015; Mangalappalli-Illathu et al., Citation2008; Nandakumar et al., Citation2004; Qin et al., Citation2009; Sharma et al., Citation2010).
Figure 12. Biofilm of S. aureus grown on hydroflouric acid etched glass slides. (A) Height image recorded in tapping mode. (B) Phase mode image of the same region which maps the elasticity of the region (darker signifying smaller phase difference and hence a more elastic response from the “tap”). © Alokmay Datta. Reuse not permitted.
A thorough understanding of how adhesion and viscoelasticity modulate biofilm establishment may be important for the proper design of control strategies. In fact, viscoelastic properties of biofilms influence antimicrobial penetration and removal of biofilm from surfaces and therefore performs a role in their protection against mechanical and chemical challenges (Peterson et al., Citation2015). On a macroscopic scale, viscoelasticity can be measured by quantifying the compression of the biofilm under a low load (Korstgens et al., Citation2001). Lau and coworkers later developed and validated an application of AFM, coined micro-bead force spectroscopy (MBFS) for the absolute and simultaneous quantitation of biofilm adhesion and viscoelasticity at the micrometer scale (Lau et al., Citation2009). This approach was recently used to demonstrate how amyloid protein production dramatically increases the stiffness of Pseudomonas biofilms (Zeng et al., Citation2015).
Contrary to SEM, AFM can: (i) work under ambient conditions, minimizing pretreatment procedures and occurrence of artifacts even on liquid surfaces (Hannig et al., Citation2010) enabling in situ imaging (Muller et al., Citation2009); (ii) have the same resolution along and perpendicular to the surface; and (iii) provide 3-D images of the surface topography. Another advantage of AFM is the quantitative assessment of biofilm interaction with surfaces and biofilm cohesion (Ahimou et al., Citation2007), along with qualitative imaging of EPS or its individual polymer molecules (Beech et al., Citation2002; Remis et al., Citation2014).
AFM for the study of biofilms presents, however, some limitations: (i) inability to obtain a large area survey scan (typically maximum 150 × 150 μm) and to image the side-walls of bacterial cells; (ii) tip shape and size or interactions between tip and sample causing effects on ambient conditions, especially moisture, artifacts, image degradation, although generally considered negligible (Chatterjee et al., Citation2014); (iii) damaging of the soft and gelatinous nature of biofilms by the imaging of the surface, especially within a liquid environment; (iv) the need for immobilization of cells during imaging. Imaging in liquid is particularly challenging as lateral forces lead to detachment of cells unless they are firmly immobilized (Meyer et al., Citation2010), but a recently developed quantitative imaging mode (QITM mode) eliminates lateral forces because lateral movement is halted during the approach and retraction of the cantilever in each pixel. Other methods of immobilizing the cells have been described (Kang & Elimelech, Citation2009; Zeng et al., Citation2014). Imaging of dry biofilms grown in humid air (unsaturated conditions) is unproblematic in terms of cell detachment, and causes little change in morphology, roughness or adhesion forces when compared with moist biofilms, therefore potentially being a decisive factor in this regard (Auerbach et al., Citation2000), and assuring a better resolution (Auerbach et al., Citation2000; Hu et al., Citation2011). Trying to overcome these downsides, Kim and Boehm developed a high-speed ATM (HSAFM) using a force-feedback scheme for imaging large biological samples at a rate of one frame per second, improving the resolution of topographic signals in both time and space in less invasive ways (Kim & Boehm, Citation2012).
Summarizing, various microscopy techniques provide valuable and complementary information about different aspects of the biofilm’s complex structure. A combined approach is therefore recommended to obtain a more realistic biofilm representation. A direct quantification of biomass is, however, possible by both EM and AFM; although theoretically advantageous by being less biased than indirect methods, the laborious nature of the analysis as well as costs limit its application on a large scale.
Biofilm matrix
Bacteria in biofilms can produce organic extracellular compounds that are released into the bulk phase as soluble and insoluble materials. This material refers to the soluble microbial products (SMP) and concrete organic EPS, respectively (Aquino & Stuckey, Citation2004, Citation2008). These fractions originate from substrate metabolism, microbial by-products or/and waste release as well as cellular residual content from both injured and dead cells. SMP are released inside and outside the biofilm while EPS reinforce the biofilm structure with interconnected polymeric structures between the biofilm embedded cells or micro-colonies (Laspidou & Rittmann, Citation2002). However, the nature and function of SMP and EPS depends on the bacterial species and their response to environmental stresses. In the following section, only methods and technologies to analyze EPS will be discussed.
Measurement of EPS components
EPS are mainly composed of polysaccharides, eDNA and proteins secreted by cells within the biofilm, during its establishment and life (Das et al., Citation2011; Flemming & Wingender, Citation2010; Sutherland, Citation2001). However, the distinction between secreted molecules composing the biofilm matrix and those associated with the cellular membrane is sometimes not very clear. Actually, the secreted polysaccharides and complex proteins make a continuum between the membrane-associated molecules and the biofilm matrix, and their interconnection constitutes the cornerstone of the analysis of biofilm matrix, with EPS extraction and purification from cellular components remaining a challenge. Quantification and characterization of carbohydrates and proteins constituting EPS can be approached by ex situ and in situ methods.
Ex situ analyses are strongly dependent on the extraction methods. EPS extraction protocols are based on physical methods (ultrasound, blending or high speed centrifugation, steaming, heating, cation exchange resin or lyophilization) and/or chemical reagents (ethanol, formaldehyde, formamide, NaOH, EDTA or glutaraldehyde) (Adav & Lee, Citation2008; Azeredo et al., Citation1998; Brown & Lester, Citation1980; Chu et al., Citation2015; Comte et al., Citation2006; Gong et al., Citation2009; Kunacheva & Stuckey, Citation2014; Pan et al., Citation2010; Tapia et al., Citation2009). There is no consensus on the best methodology to be used as it depends on biofilm species composition and EPS complexity. In general, extractions using chemical agents increase EPS yields as compared to extractions using only physical methods. For instance, using centrifugation or ultrasounds resulted in 7.2 and 12.7 mg EPS per g dry biofilm, respectively, while extractions using ethylenediaminetetraacetic acid (EDTA) or EDTA + formaldehyde gave 164.5 and 114.7 mg EPS per g of dry biofilm (Pan et al., Citation2010). The extraction step usually requires optimization depending on biofilms. Testing a combination of mechanical methods associated to chemical agents in conjugation with assays at different ionic strength and duration of exposure constitutes a prerequisite to ensure extraction of enriched fractions of EPS with limitation of intracellular content contaminations. The more adequate extraction protocol depends also upon the scientific question to be addressed. For instance, the binding of ions by the EPS could be affected by extraction using chemical agents or cation exchange resin as the ion strength could alter metal ion complex formation (Comte et al., Citation2006). In this case, extraction of EPS using chemical reagents is not recommended. The protein fraction of extracted EPS is usually obtained by trichloroacetic acid (TCA) precipitation while the carbohydrate fraction is purified and concentrated by ethanol precipitation (Jiao et al., Citation2010). Then, carbohydrates could be characterized using multiple analytical techniques from hydrolyzed polysaccharides to obtain a carbohydrate fingerprint of biofilm EPS while protein diversity could be explored using proteomics approaches (Gallaher et al., Citation2006; Lilledahl & Stokke, Citation2015; Speziale et al., Citation2014; Zhang et al., Citation2015b).
In situ analyses of biofilm EPS have evolved with the microscopy technologies. As EPS contribute to the 3-D structuration of biofilms, their visualization from 3-D microscopy revealed the general architecture of the biofilm, their distribution within the biofilm and their dynamics during adhesion, growth, maturation, dispersal and hyper-colonization of surfaces. Being noninvasive, CLSM represents the methods of choice for the distribution and in situ characterization analyses of EPS (Bhardwaj et al., Citation2013; Neu & Lawrence, Citation2014b; Watrous & Dorrestein, Citation2011). Identification of the EPS carbohydrates could be approached using fluorescence lectin-binding analysis (FLBA) which detects glycoconjugates and their distribution within the biofilm (, and S1) (Marchal et al., Citation2011; Neu & Lawrence, Citation2014b, Citation2015; Turonova et al., Citation2016; Zippel & Neu, Citation2011). Characterization of EPS carbohydrate using FLBA depends on the specificity of the lectins used (Weissbrodt et al., Citation2013; Zhang et al., Citation2015a). Conventional fluorescence-labeled probes detected with fluorescence correlation spectroscopy (FCS) for the overall structure of the biofilm could be also employed to assess the viscosity and porosity of the biofilm (Peulen & Wilkinson, Citation2011). FLBA and fluorescence-labeled probe analyses have to be coupled with CLSM analyses and specific cell fluorescent probes to provide 3-D images of the distribution of the EPS according to cell localization. Other matrix components can also be visualized by CLSM using specific stains, such as fluorescein isothiocyanate (FITC) or SYPRO Ruby staining for proteins (Daniels et al., Citation2013; Hochbaum et al., Citation2011), Thioflavin T or antibody-labeling of amyloids (Larsen et al., Citation2008) or cell-impermeant nucleic acid stains for eDNA (Okshevsky & Meyer, Citation2014; Wang et al., Citation2015; Webb et al., Citation2003). The compound 7-Hydroxy-9H-(1,3-Dichloro-9,9-Dimethylacridin-2-one (DDAO) has been the compound of choice for eDNA staining in many publications, but a recent report systematically compared different eDNA staining techniques and concluded that the dye TOTO-1 provides the most reproducible and sensitive detection of eDNA (Okshevsky & Meyer, Citation2014). Alternatively, some specific fibrous strands of exopolysaccharides in biofilms could be detected using specific antibodies (Choi et al., Citation2009; Cramton et al., Citation1999; Darby et al., Citation2002; Gerke et al., Citation1998; Jarrett et al., Citation2004). This targeted approach requires a well-described implication of specific proteins constituting the biofilm matrix. Besides the cost of antibody production, this approach could be valuable to detect and, combined with microscopy, localize key components in the biofilm matrix.
More recently, Imaging Mass Spectrometry (IMS) has emerged as a new approach to study components in the biofilm matrix. These imaging tools allow 2-D visualization of the distribution of different components (e.g. metabolites, surface lipids, proteins) directly from biological samples, such as biofilms, without the need for chemical tagging or antibodies (Bhardwaj et al., Citation2013; Watrous & Dorrestein, Citation2011).
Initial steps of biofilm formation
Methods to assess microbial adhesion
Several in vitro systems have been developed for assessing bacterial adhesion under controllable and reproducible conditions which resemble those found in natural environments, with flow chambers and microtiter plates being the most widely used platforms. In microtiter plates, adhesion occurs under static or dynamic conditions during a certain period of time, usually 30 min to 2 h after inoculation. After the adhesion process, the substratum is washed for removal of non-adherent microbial cells and then adhered cells can be enumerated in situ. The impact of washing was previously discussed in the Biofilm Formation Devices section, and is also relevant here (Bos et al., Citation1999). Flow chambers are also used to assess adhesion; though having a lower throughput than microtiter plates, these systems provide an adequate control of mass transport mechanism and do not need to employ the washing step to remove loosely adhered cells. The most widespread flow system to study adhesion is the parallel flow chamber developed by Henk Busscher (Bos et al., Citation1999), where adhesion to surfaces can be studied in controlled hydrodynamic environments, enabling the assessment of adhesion in real-time conditions and allowing measurements of other experimental parameters, such as the initial adhesion rate or removal rate after passage of an air–liquid interface (Busscher & van der Mei, Citation2006).
Quantification of adhered cells
The analysis of adhered cells to surfaces can be easily made using microscopy methods. If the surface is transparent then light microscopy can be used; if the adhesion surface is not transparent, epifluorescence microscopy becomes the best option, requiring the staining of cells with specific fluorochromes. The advantages and limitations of these techniques have been described above, under Microscopy Methods of the Biofilm Biomass and Viability section.
Some systems have been developed for quantifying initial adhesion under flow conditions. Szlavik and co-workers described a system based on microscope slides with a flow perfusion chamber (Szlavik et al., Citation2012). The system is mounted on an inverted microscope and the bacterial solution degassed and pumped in at varying velocities resulting in different wall shear stresses. Pictures are taken at time intervals at separate vistas in the laminar flow section. Advantages of the system include: (i) possibility to follow and quantify cell adhesion in real-time; (ii) no need for very expensive equipment; and (iii) no need to transform cells. Drawbacks include sensitivity to bulky material (e.g. fat micelles) and inability to study nontransparent surfaces. For real-time observations on nontransparent surfaces, incandescent dark-field illumination or other microscopic methods have been used (Sjollema et al., Citation1989). Skovager and coworkers used a flow perfusion system set-up combined with flourescence microscopy, which could also be used for nonreflecting surfaces (Skovager et al., Citation2012). Here, the cells need to be stained or transformed with GFP, which represents a disadvantage.
Measuring adhesion at a molecular level
Recently it has become possible to measure adhesive properties on a single-cell level by AFM force spectroscopy, allowing for careful analysis of molecular functions of cell surface structures (Camesano et al., Citation2007). As described above, the AFM cantilever scans across the sample in the x–y direction during imaging. However, if approaching and retracting the cantilever in the vertical direction, the interaction forces between the tip and the sample can be quantified with pico-newton accuracy (Zlatanova et al., Citation2001). This method has been used to study the interaction forces of single molecules immobilized on the cantilever (Hinterdorfer & Dufrene, Citation2006), making it possible to map the distribution and interaction forces of e.g. lectin–polysaccharide interactions on the surface of living cells (Francius et al., Citation2008), and to quantify cell–cell and cell–surface interactions to study how specific bacterial adhesins contribute to bacterial attachment (Das et al., Citation2011), or how the properties of the abiotic surface (Camesano et al., Citation2007) and the surrounding liquid (Pinzon-Arango et al., Citation2009) affect the attachment.
Quartz crystal microbalance (QCM) is another valuable available apparatus that enables the assessment of microbial adhesion force. The technique is based on piezoelectricity, and by applying an alternating electric field, the crystal starts to oscillate at its resonant frequency, which is dependent on the total oscillating mass. Adsorption of molecules causes an increase in the total oscillating mass, which can be monitored as a decrease in frequency (Cooper & Singleton, Citation2007). However, as the frequency shifts are proportional to the attached mass only when the attached mass is thin, evenly distributed, rigid and tightly coupled to the surface, it is difficult to apply this technique to biological samples. Non-rigid binding leads to energy dissipation, which can be recorded simultaneously by QCM with dissipation monitoring (QCM-D) (Rodahl et al., Citation1995). This technique has been used in a wide range of adhesion studies (Olofsson et al., Citation2005; Otto et al., Citation1999; Otto & Silhavy, Citation2002).
Surface Plasmon Resonance (SPR) is an optical detection process based on the fact that adsorbing molecules to the metal sensor chip surface cause changes in the local index of refraction, changing the resonance conditions of the surface plasmon waves. This technique has been used to study adhesion at a molecular level such as the binding properties of purified adhesins to specific receptors immobilized on the SPR sensor chip to study inhibition of binding (Salminen et al., Citation2007), or the interaction of molecules coating the sensor on the adhesion of pathogens (Oli et al., Citation2006).
Identification and localization of microorganisms in biofilms
Fluorescence in situ hybridization (FISH)
Fluorescence in situ hybridization was developed for identification of bacteria in the 90s (Amann et al., Citation1990) and offered the first possibility of phylogenetic identification of bacteria by microscopy. Hence, it opened numerous new research avenues to investigate the spatial organization of mixed microbial communities, such as biofilms, where bacteria with different metabolic processes feed of each other’s metabolites in environments with steep chemical gradients at the micrometer spatial scale. In FISH, fluorescently labeled oligonucleotide probes (typically 15–25 nucleotides long) hybridize to ribosomal RNA in cells that have been fixed and permeabilized to allow entry of the probe and incubation under controlled conditions to ensure stringent hybridization of the probe to the target sequence. Challenges of the method were initially: (i) to ensure no or very little hybridization to non-target sequences; (ii) simultaneous application of multiple probes and (iii) detection of inactive bacteria with few ribosomes. Although the method is still widely used in its original form, several developments have increased its performance and broadened its application. A new group of molecules named nucleic acid mimics or analogs have started to replace DNA as the recognition element of the FISH method. Chemically speaking, these mimics differ from DNA or RNA by modifications at the level of the backbone, both in the phosphate group and in the pentose sugar (Nielsen et al., Citation1991; Vester & Wengel, Citation2004). While the introduced modifications bring different properties to mimics, they still obey the Watson–Crick base pairing rules, and are hence capable of forming complementary and sequence-specific double strands of nucleic acids. In FISH, the most well-known of these molecules is the peptide nucleic acid (PNA) (Nielsen et al., Citation1991). PNA has an uncharged, pseudo peptide-like backbone that has shown to contribute to an increased affinity of PNA towards DNA and RNA than of DNA itself. This means that the probe can be shorter, having advantages at the level of probe penetration through the biofilm matrix and the cellular envelope (Cerqueira et al., Citation2008). The first reports on the use of PNA-FISH in biofilms date back to the early 2000s (Azevedo et al., Citation2003) and more recent applications mostly focus on clinical biofilms (Bjarnsholt et al., Citation2009; Freiberg et al., Citation2014; Kragh et al., Citation2014; Malic et al., Citation2009). Similarly to PNA, locked nucleic acids (LNA) also increases the affinity of a molecule towards DNA or RNA, but the most significant difference lies on the fact that individual residues of the probe can be replaced, rather than the whole probe itself, as for PNA. Therefore, LNA is a much more flexible mimic in terms of probe design, a very helpful characteristic when it comes to mismatch discrimination or multiplex experiments (You et al., Citation2006). LNA-FISH application in biofilms is still in its infancy, but it may pave the way to the development of direct visualization of biofilms within higher-order animals (fluorescence in vivo hybridization) (Fontenete et al., Citation2015).
Adding to a more specific and robust sequence-specific detection of the RNA, improvements have been also introduced at the level of the detection element of FISH, typically a fluorochrome. These modifications are included both to increase signal intensity, such as catalyzed reporter deposition-FISH (CARD-FISH), and to allow multiple bacteria to be identified at the same time, in what is known as a multiplex experiment. In CARD-FISH, the nucleic acid is covalently linked to the enzyme horseradish peroxidase. After exposure to fluorescently-labeled tyramine molecules, it will produce highly reactive intermediates, which will react with neighboring biomolecules and deposit within the cell (Pernthaler et al., Citation2002). CARD-FISH has been commonly used in biofilms, but the large size of the enzyme prevents adequate diffusion of the probe through the biofilm structure and the presence of peroxidases may affect the specificity of the method (Pavlekovic et al., Citation2009). Other simpler options that increase signal intensity of the probe, while not requiring coupling of a large enzyme, are the replacement of the commonly-used cyanine or fluorescein dyes by more photostable dyes such as those from the Alexa Fluor family (which are more expensive), or the coupling of two fluorescent molecules to a single probe ("Double Labelling of Oligonucleotide Probes for FISH", DOPE-FISH) (Stoecker et al., Citation2010). Both these strategies can actually also contribute to increase the number of species discriminated in multiplex experiments (up to 4 and 6 species, respectively). In terms of number of discriminated species, the most promising method is certainly combinatorial labeling and spectral imaging FISH (CLASI-FISH) that allows the discrimination of up to 28 species simultaneously (Valm et al., Citation2011). A summary of the FISH variants, and combinations with other methods, is given in . Although with many advantages, FISH is also associated with limitations such as: (i) requires sample fixation eliminating the possibility to study a sample over time; (ii) requires extensive preparation steps; (iii) requires a genetically-targeted exogenous marker and, consequently, (iv) knowledge of the target bacteria (Beier et al., Citation2012).
Table 4. FISH techniques related to biofilm.
Combination of FISH with other methods to combine identity with metabolic function
The identification of individual bacterial cells by FISH is often accompanied by the desire to understand the role of these bacteria in a mixed microbial community. However, very limited information is available to make suggestions about metabolic phenotypes based on phylogenetic identification. The motivation for linking identity with metabolic phenotypes in situ has driven the development of techniques that combine FISH with methods for marker visualization for uptake of isotope-labeled substrates at single-cell spatial resolutions, see Musat et al. for a recent review (Musat et al., Citation2012).
The first and most widely used of such combinations was developed in 1999 (Lee et al., Citation1999) with micro-autoradiography (FISH/MAR). Incubation with radio-isotope labeled substrates prior to fixation and FISH allows very sensitive detection of radioactivity in cells that have taken up the particular substrate, and the MAR image is then overlaid with the FISH image. In biofilms, this technique has been used, for example, to link the spatial organization of microbial communities and their in situ function in complex multispecies nitrifying biofilms (Okabe et al., Citation2011) and to evaluate the ecophysiological interaction between nitrifying bacteria and heterotrophic bacteria in autotrophic nitrifying biofilms (Kindaichi et al., Citation2004).
The Raman spectrum is widely used for bacterial identification in clinical microbiology, and Raman microscopy was initially proposed as a FISH replacement (Patzold et al., Citation2006). However, it is also suited to detect incorporation of isotope-labeled substrates as these lead to shifts in the spectrum for certain cellular compounds (Huang et al., Citation2007). Most studies using FISH-Raman investigated the incorporation of 13C-labeled organic substrates, but recently D2O incorporation was used as a marker for biosynthesis upon addition of selected unlabeled substrates (Berry et al., Citation2015). This important development allows investigation of substrates that cannot be labeled with isotopes. Mass spectrometry imaging is a powerful way of retrieving information about the chemical composition of a surface. In Time-of-Flight Secondary Ion Mass Spectrometry (ToF-SIMS) the sample surface is bombarded with ions, resulting in release of atoms from the outer few nanometers of the surface, and their identification based on their mass. In SIMS imaging, high resolution in the mass spectrum comes at the price of lower image spatial resolution. However, development of the NanoSIMS allowed imaging at sub-micron resolution while maintaining high mass resolution. This can be used after FISH to pinpoint which cells took up an isotope-labeled substrate, and isotopic ratios can be used to calculate cell-specific uptake rates (Kuypers & Jorgensen, Citation2007). Fluorescence microscopy can even be omitted by adding 127I-labeled oligonucleotide probes or using halogen-containing tyramides for CARD-FISH, allowing detection of in situ hybridization directly by SIMS (Behrens et al., Citation2008; Li et al., Citation2008; Musat et al., Citation2008). ToF-SIMS has been used for two-dimensional chemical imaging of hydrated biofilms (Hua et al., Citation2014, Citation2015) and to study and compare compositional characteristics of extracted EPS fractions and EPS-matrix of intact diatom biofilms (de Brouwer et al., Citation2006).
A challenge for interpreting the results of all of these methods is the risk of cross-feeding, i.e. that the isotope-labeled compound is taken up by one cell and converted into something else which is taken up by other members of the microbial community. This effect is minimized in FISH/MAR due to the high sensitivity of the technique, which allows for short incubation time with the labeled substrate. Raman, however, requires incorporation of the isotope to a level of 10 atom% in the cells. NanoSIMS offers both the highest spatial resolution, sensitivity and quantitative analysis of substrate uptake at the single-cell level in biofilms and other mixed microbial communities.
Biofilm data analysis – image processing and statistical validation
Image processing of biofilm images
In general, image processing software can be divided into two major categories: (i) programs for making pictures for presentation and (ii) programs for making quantitative measurements of biofilm images. Additional categories include database programs for experiment storage, statistical analysis tools, etc. Some of these are not specifically designed for biofilm research and may have unneeded features or miss features needed for proper biofilm analysis. This section will not attempt to include all programs that can be used for biofilm research but will rather focus on representative examples. What a researcher choses depend on what he or she wants to do. If the aim is to produce pretty, informative images programs in category (i) above should be used. If, on the other hand quantitative measurements are required, e.g. for making statistical analysis and comparison of biofilm experiments, programs in category (ii) should be selected.
Biofilm images are usually recorded with CLSM. Each manufacturer tends to make a proprietary image file format, making interchange of image data and data processing difficult. Recently, a common data format was devised and the major manufacturers of microscopy hardware currently adopt it, at least as an optional export format. The format, Open Microscopy Environment (OME-Tiff), is now standardized and tools exist to convert most proprietary file formats into this (Linkert et al., Citation2010; Rueden & Eliceiri, Citation2007), allowing a wider choice of processing software.
Software packages for qualitative presentation of biofilm (confocal) images
Currently, there are numerous software packages available that will allow processing of confocal image stacks to make 2-D data representations, or virtual 3-D representations such as animations. Probably the most used software package currently in the biofilm community is Imaris® by Swiss company Bitplane AG (http://www.bitplane.ch). This commercial package was designed for taking confocal images and generates pseudo-3-D images with shadow projection, iso-surface presentation, cross-sections and 3-D animations (, and S1). However, it is rather costly which is why some research groups prefer to use alternative public domain software packages. Among these, is the popular image processing software ImageJ (Abràmoff et al., Citation2004), an open system to which independent software developers can make plugins for particular purposes. Currently, more than 325 macros and 500 plugins are available at the ImageJ website (Schneider et al., Citation2012). Several of these deal with 3-D image processing and CLSM, as the free McMaster Biophotonics Facility (MBF) plugin collection, which can do most of what Imaris can although requiring more effort from the user. Another very popular free software (for noncommercial purposes) is the daime image processing package (Daims et al., Citation2006), which can do both visualization of image data and some analytical processing. Contrary to the ImageJ plugins, this package was created with biofilm images in mind and can do both their visualization and analysis.
Software packages for quantitative analysis of biofilm (confocal) images
To compare biofilm images, a quantitative measurement of the images, preferentially followed by statistical analysis, can remove the unintentional possibly biased interpretation of the researcher (Kuhn, Citation1970). Various objective parameters can be used to quantitatively describe biofilms, ranging from the obvious like biomass, biofilm (maximum) height to subtler ones like roughness coefficient and fractal dimension. Common to all is that raw data is the confocal microscopy stack images, a range of individual images (slices) recorded from focal planes in specified positions. Each slice can be represented by one image if only one color is recorded, or several images, one for each channel, if more fluorescence colors are used. The biofilm is represented by pixels having a fluorescence signal above a certain value, the threshold. All gray values below the threshold are regarded as noise.
Several analysis packages are available, each with advantages and drawbacks. One of the most widely used is the Comstat package, originally made as a MATLAB® script (Heydorn et al., Citation2000b) and later rewritten as a plugin (Comstat2) to ImageJ (Vorregaard, Citation2008). Comstat2 is freely available from http://www.comstat.dk. Similar packages are the MATLAB script PHLIP (Mueller et al., Citation2006) and ISA3D which is a compiled MATLAB script (Beyenal et al., Citation2004). Daime is the fourth alternative (Daims et al., Citation2006), designed for presentation of the data and not dedicated to but capable of extracting quantitative data. It is also possible to use more general purpose software, e.g. ImageJ (Abràmoff et al., Citation2004) with plugins, ImagePro Plus (MediaCybernetics Inc., Rockville, MD), Imaris (Bitplane AG) and Volocity (Perkin Elmer Corp., Waltham, MA).
Quantitation programs have some typical inherent problems. The major problem with all quantitation programs is the determination of the threshold value. Ideally, the determination of what parts of an image is biomass or not should be individual per stack slice and within a slice. A technique called segmentation allows for such higher fidelity of determining the extent of a biofilm (Zielinski et al., Citation2011). However, since this is technically complicated most programs use different, simpler approaches for determining the threshold. Several of the newer packages offer automatic thresholding which can reduce the workload of the experimenter and remove the operator induced bias, but give different results with different implementations (Lewandowski & Beyenal, Citation2014). However, unless special conditions apply, most advanced automatic thresholding mechanisms give comparable and acceptable results (Lewandowski & Beyenal, Citation2014; Zielinski et al., Citation2011).
Due to the nature of biofilms experiments, a rather large variation of results is typical. Therefore, all quantitation by software should be accompanied by statistical analysis to validate the results (Heydorn et al., Citation2000a, Citation2002).
Minimum information about a biofilm experiment (MIABiE) initiative
Biofilms is becoming a data-intensive research field and that demands novel data management and analysis methodologies to enable critical review and independent validation. To this end, the Minimum Information About a Biofilm Experiment (MIABiE) initiative (http://www.miabie.org), encompassing an international body of biofilm experts, is working on the definition of guidelines to document biofilms experiments, the standardization of the nomenclature in use and the development of community-oriented computational resources and tools (Lourenço et al., Citation2014).
Comparison of raw data and unequivocal characterization of experimental methods are essential to evaluate the possible cause(s) of nonconformity across laboratories. It may help to differentiate between procedural discrepancies and natural-occurring biological variation and thus, ensure the reproducibility and ruggedness of the results. So, this section presents databases, controlled vocabularies and software tools, most of which are under the umbrella of MIABiE.
Harmonized vocabulary for data interchange
The MIABiE consortium has prepared a set of guidelines for documenting biofilms experiments and data, namely the minimum information that should be reported to guarantee the interpretability and independent verification of experimental results, and their integration with knowledge coming from other fields (Lourenço et al., Citation2014). This practical and semantically structured vocabulary defines the fundamental concepts about experiment design, biofilm recovery, biofilm formation and biofilm characterization (Sousa et al., Citation2014). It is being used by biofilms-centered databases, such as BiofOmics and Morphocol (http://morphocol.org), and bioinformatics tools, such as the Biofilms Experiment Workbench (BEW) (see below).
Databases
The implementation of publicly accessible databases is vital to disseminate results and promote data interchange. BiofOmics (http://biofomics.org) stands as the first database providing public Web access to biofilms experiments (Lourenço et al., Citation2012). Experiments are indexed by organism, method of analysis and tested conditions.
Complementary, two recent resources tackle anti-biofilm research, in particular the study of antimicrobial peptides against biofilms. The Biofilm-active antimicrobial peptides (BaAMPS) provides useful physicochemical data on peptides specifically tested against microbial biofilms (http://www.baamps.it/) (Di Luca et al., Citation2015). In turn, the Antimicrobial Combination Network represents synergistic and antagonistic effects of peptide–drug combinations (http://sing.ei.uvigo.es/antimicrobialCombination) (Jorge et al., Citation2016).
Computerized data operation and analysis
BEW is the first software tool dedicated to biofilms data operation and analysis (Perez-Rodriguez et al., Citation2015). It supports structured and standardized documentation of experiments, statistical assessment of various analytical results, on-demand and Web-publishable experiment reporting, experiment publication/retrieval in/from public databases, and comparison of results between laboratories. A novel general-purpose data representation format, the Biofilms Markup Language (BML), has been formalized for effectively promoting data interchange across resources and software tools. BEW is publicly and freely available at http://sing.ei.uvigo.es/bew.
Biofilm-omics
All the above has been aimed at describing either handling (cultivation) and basic observation, or analysis of biofilms. However, due to the biofilm complexity it is necessary to take a birds-eye perspective and use a holistic approach to describe biofilms, and for that -omics analyses can be valuable. This section aims at describing the omics approach to analyze and describe biofilms as the complex structures as they are (Azevedo et al., Citation2009).
To study global changes at gene-, RNA-, protein- and metabolic levels, different -omic approaches allow characterizing bacterial cell behavior in biofilms, namely genomics, proteomics, transcriptomics and metabolomics. Omics profiling has revealed physiological differences occurring in the course of sessile development in response to interactions with its surroundings (An & Parsek, Citation2007), whether symbiotic relationships, environmental conditions or surfaces (Chagnot et al., Citation2013).
A bacterial cell regulates its physiology at different levels (genetic, transcriptional, post-transcriptional, translational and post-translational) but the most immediate and primary regulation level is the enzymatic activity. This point is the cornerstone for correct interpretations of -omic data. While it is well-documented that regulators control the expression of several genes, and can thus affect the overall physiology of the cell (Brul et al., Citation2002), investigating the physiological response at transcriptomic levels simply provides information about the pool of the whole transcripts at a steady-state at a given time (Vogel & Marcotte, Citation2012). The different levels of transcript expression presume neither the level of proteins nor the different levels of metabolic fluxes in the cell. Similarly investigating the global protein expression in the cells by proteomics does not provide indication of the specific enzyme activity or metabolic fluxes in different pathways in the conditions investigated. Thus, the different omics are self-complementary to investigate cell physiology in the course of biofilm formation but are not designed to validate their data one with the other (Burgess et al., Citation2014).
The use of -omics in biofilm research
Despite major advances in biofilm research, the underlying mechanisms controlling the response of attached or immobilized cells as compared to that of planktonic ones are not fully elucidated, except for a few studies, which have focused on differential expression of proteins in sessile and suspended cells (De Angelis et al., Citation2015; Planchon et al., Citation2009). Detailed insight into the global transcriptomic or proteomic properties of biofilms may also enable the identification of proper genetic or proteome markers with relevant functions within the biofilm (Bansal et al., Citation2007; Doulgeraki et al., Citation2014; Stipetic et al., Citation2016). Such information may be of high relevance for detection of potential persistent strains or for the source attribution of pathogens via tracing of the contamination route, during an outbreak investigation. Transcriptomic studies are also important to understand regulatory pathways in foodborne pathogens and thus understand biofilm physiology (Luo et al., Citation2013).
Analyzing the -omics data
One of the most critical issues with -omic approaches applied to biofilm is that data result from a whole cell population harvesting. However, a biofilm is, by definition, heterogeneous (Stewart & Franklin, Citation2008); depending on the localization within the biofilm and the stage of biofilm development, the physiology of bacteria cells can significantly differ. Consequently, -omic profiling corresponds to the average result for an entire but potentially diverse biofilm population. By averaging heterogeneity, any unique pattern for an underrepresented subpopulation can be overlooked or it can also bias the average profiling. Therefore, physiological or genetic characteristics observed from -omic profiling must be interpreted with caution, bearing in mind results are potentially skewed averages. Dynamic growth in flow-cell chambers can circumvent part of the problem by offering more reliable sessile growth conditions than static batch biofilm development. By isolating sub-localized cell populations within a biofilm, laser capture microdissection microscopy is a promising approach that can permit comparing the physiology of cells relative to their spatial distribution within the biofilm (Lenz et al., Citation2008; Perez-Osorio et al., Citation2010), e.g. cells in contact with substratum versus cells at the outskirt of the biofilm. However, it appears that the implementation of this technique to sort cells and carry out targeted omics approaches remains complicated and has not, to date, been successful and demonstrated its relevance. For proteomics studies especially, a selective approach targeting a subpopulation would increase the sensitivity and relevance of analyses, in which the global pool of proteins from all the other subpopulations would not mask changes in the protein expression. Besides the problem of heterogeneity of microbial biofilms, one of the main challenges of targeted approaches remains the minimal quantity of biomass to undertake molecular analyses. The development in recent years of new proteomics workflows based on high-resolution mass spectrometry directly coupled to high performance liquid chromatography is a powerful tool for separating and analyzing complex protein mixtures. These technical approaches, called shotgun proteomics, require much lower amounts of protein than conventional 2-D electrophoresis approaches, and allow to analyze more exhaustively proteomes or sub-proteomes and to perform label-free semi-quantitative comparison.
Another problem relates to the reference to compare the data. Quite often, planktonic cells are used as the control; still remains the question of the most suitable growth phase that could fit the best with the biofilm development stage under consideration. While the use of cells from different growth phases can be argued, none can exactly match any of the biofilm stages; sessile development stages and planktonic growth phases are by definition completely different and any correlation attempt can only be misleading. An important concept to better explore would be to compare biofilms grown under different conditions, for instance after exposure to a disinfectant. In such experiment, the bias of bacterial metabolism would be removed and the omics data obtained would provide insights into how the biofilm reacted to a certain stimuli. Such approach has been used in the medical fields, to better assess how intact biofilms survive to external stimuli (Franca et al., Citation2014; Scherr et al., Citation2013). Of course, physiological investigations comparing a wild type strain with an isogenic mutant remain the best and less dubious experimental approach but this is not always applicable when investigating the effect of different environmental conditions on cell physiology.
Furthermore, the presence of the biofilm matrix may present some technical limitations. One of the key aspects for transcriptomic analysis is related with the yield and quality of the mRNA transcripts, and care should be taken when working with low magnitude changes as the differences obtained may be a result of matrix contamination (Carvalhais et al., Citation2013). For proteomic analysis, the biofilm matrix can also be a significant barrier to effectively access the different intracellular, membrane and parietal sub-proteomes (surfaceome) (Desvaux et al., Citation2009). Furthermore, analysis of the exoproteome, i.e. proteins secreted into the extracellular medium (Desvaux et al., Citation2009), is also challenging. Indeed, in a submerged biofilm, the culture medium contains planktonic cells whose secreted proteins contaminate those specifically secreted by sessile cells. Some authors circumvent this difficulty by recovering the medium in a flow-cell device or by renewing the culture medium in a static device, thus eliminating the population of planktonic bacteria, just a few hours before recovering the medium containing secreted proteins from sessile cells (Lourenço et al., Citation2013).
While a more comprehensive picture of the bacterial cell physiology in biofilms is being gained by combining transcriptional and proteomic profiling, as well as metabolomics, contribution of genomic profiling, e.g. disparity in the genome sequences in the course of biofilm formation or epigenetic regulation due to DNA methylation (methylome) (Sanchez-Romero et al., Citation2015) to the understanding of phenotypic diversification in the course of sessile development has not attracted so much interest so far. Rather than the illusory goal of correlating data, comparison of the transcriptomic and proteomic analyses allows pinpointing other regulatory mechanisms governing biofilm development especially at post-transcriptional and post-translational levels. Analysis of the genomic diversity in biofilms could further allow identifying at a global scale phase-variation mechanisms, a key but overlooked aspect of epigenetic regulation in bacteria (Henderson et al., Citation1999), which play an essential role in sessile development (Chauhan et al., Citation2013). At a larger scale, especially to investigate complex multi-species biofilms, the development of meta-omics is the promise of major breakthrough ahead in our understanding of bacterial interaction and physiology within highly diverse microbial communities (Dugat-Bony et al., Citation2015).
Concluding remarks
Much has happened since the revelation by Bill Costerton that biofilms are far more relevant to study than planktonic bacteria. The physiology of single cells and the interactions inside a biofilm have been analyzed at increasingly higher level of detail facilitated by the development of new and better hardware tools, such as microfluidics and high resolution microscopy. The molecular tools are also becoming far more refined and accessible than before, allowing physiological dissection of small, distinct entities within the complex biofilm structures. The development of -omics technologies will enable us to better understand biofilm development and evolution. New technologies, such as Raman spectroscopy, Imaging mass-spectroscopy and Maldi-TOF analysis are being applied for the chemical analysis of single cells and colonies (Harz et al., Citation2005; Stingu et al., Citation2008; Watrous & Dorrestein, Citation2011), and the biofilm research will no doubt benefit from this (Bleich et al., Citation2015). One problem has still not been solved in a satisfactory manner: the physical dissection and isolation of single cells and matrix components from living biofilms. It is possible to disrupt biofilms by e.g. sonication in order to retrieve single cells but this destroys the spatial relation of the cells. Techniques such as laser dissection may prove useful to cut out functionally distinct niches from a living biofilm, but as of now the resolution is not sufficient for microbial work, and just getting access to the relevant areas of the living biofilm is difficult if not impossible. This challenge should be solved in the coming years in order to further understand the physiological anatomy of the microbial biofilms and to elucidate their network of communication and other interactions.
Acknowledgements
The authors would like to thank for permission to use illustrations: Dr. Thierry Bernardi, Biofilm Control, Saint-Beauzire, France (), Dr. Bryan Warwood, Biosurface Technologies Corp, Bozeman, MT ( and ), Prof. Andrew McBain, University of Manchester, UK (), Dr. Hana Turoňová, University of Chemistry and Technology Prague, Czech Republic (), Dr. Pierluigi Aldo DiCiccio, Università Degli Studi Di Parma, Parma, Italy (), Professor Thomas Bjarnsholt, University of Copenhagen (), and Professor Alokmay Datta, Saha Institute of Nuclear Physics, Kolkata, India (). The authors are grateful to Prof. Gordon Ramage for critical reading of the manuscript.
Disclosure statement
The authors report no declarations of interest.
Funding
The authors would like to acknowledge the support from the EU COST Action BacFoodNet FA1202.
References
- Abràmoff MD, Magalhães PJ, Ram SJ. (2004). Image processing with Image. J Biophotonics Int 11:36–41.
- Adav SS, Lee DJ. (2008). Extraction of extracellular polymeric substances from aerobic granule with compact interior structure. J Hazard Mater 154:1120–6.
- Agostinho AM, Hartman A, Lipp C, et al. (2011). An in vitro model for the growth and analysis of chronic wound MRSA biofilms. J Appl Microbiol 111:1275–82.
- Ahimou F, Semmens MJ, Novak PJ, Haugstad G. (2007). Biofilm cohesiveness measurement using a novel atomic force microscopy methodology. Appl Environ Microbiol 73:2897–904.
- Akiyama H, Hamada T, Huh WK, et al. (2003). Confocal laser scanning microscopic observation of glycocalyx production by Staphylococcus aureus in skin lesions of bullous impetigo, atopic dermatitis and pemphigus foliaceus. Br J Dermatol 148:526–32.
- Alhede M, Qvortrup K, Liebrechts R, et al. (2012). Combination of microscopic techniques reveals a comprehensive visual impression of biofilm structure and composition. FEMS Immunol Med Microbiol 65:335–42.
- Alvarez G, Gonzalez M, Isabal S, et al. (2013). Method to quantify live and dead cells in multi-species oral biofilm by real-time PCR with propidium monoazide. AMB Express 3:1. doi: 10.1186/2191-0855-3-1.
- Amann RI, Krumholz L, Stahl DA. (1990). Fluorescent-oligonucleotide probing of whole cells for determinative, phylogenetic, and environmental studies in microbiology. J Bacteriol 172:762–70.
- Ammons MC, Ward LS, James GA. (2011). Anti-biofilm efficacy of a lactoferrin/xylitol wound hydrogel used in combination with silver wound dressings. Int Wound J 8:268–73.
- An D, Parsek MR. (2007). The promise and peril of transcriptional profiling in biofilm communities. Curr Opin Microbiol 10:292–6.
- Ansari MJ, Al-Ghamdi A, Usmani S, et al. (2013). Effect of jujube honey on Candida albicans growth and biofilm formation. Arch Med Res 44:352–60.
- Aquino SF, Stuckey DC. (2004). Soluble microbial products formation in anaerobic chemostats in the presence of toxic compounds. Water Res 38:255–66.
- Aquino SF, Stuckey DC. (2008). Integrated model of the production of soluble microbial products (SMP) and extracellular polymeric substances (EPS) in anaerobic chemostats during transient conditions. Biochem Eng J 38:138–46.
- Araujo JC, Teran FC, Oliveira RA, et al. (2003). Comparison of hexamethyldisilazane and critical point drying treatments for SEM analysis of anaerobic biofilms and granular sludge. J Electron Microsc (Tokyo) 52:429–33.
- Arnold JW. (2008). Colorimetric assay for biofilms in wet processing conditions. J Ind Microbiol Biotechnol 35:1475–80.
- Asally M, Kittisopikul M, Rue P, et al. (2012). Localized cell death focuses mechanical forces during 3D patterning in a biofilm. Proc Natl Acad Sci USA 109:18891–6.
- ASTM (2012a). ASTM e2196-12 standard test method for quantification of Pseudomonas aeruginosa biofilm grown with medium shear and continuous flow using rotating disk reactor. ASTM International.
- ASTM (2012b). ASTM e2562-12 standard test method for quantification of Pseudomonas aeruginosa biofilm grown with high shear and continuous flow using CDC biofilm reactor. ASTM International.
- Au AK, Lai HY, Utela BR, Folch A. (2011). Microvalves and micropumps for BioMEMS. Micromachines 2:179–220.
- Auerbach ID, Sorensen C, Hansma HG, Holden PA. (2000). Physical morphology and surface properties of unsaturated Pseudomonas putida biofilms. J Bacteriol 182:3809–15.
- Azeredo J, Oliveira R, Lazarova V. (1998). A new method for extraction of exopolymers from activated sludges. Water Sci Technol 37:367–70.
- Azevedo NF, Lopes SP, Keevil CW, et al. (2009). Time to “go large” on biofilm research: advantages of an omics approach. Biotechnol Lett 31:477–85.
- Azevedo NF, Vieira MJ, Keevil CW. (2003). Establishment of a continuous model system to study Helicobacter pylori survival in potable water biofilms. Water Sci Technol 47:155–60.
- Badel S, Laroche C, Gardarin C, et al. (2008). New method showing the influence of matrix components in Leuconostoc mesenteroides biofilm formation. Appl Biochem Biotechnol 151:364–70.
- Badel S, Laroche C, Gardarin C, et al. (2011). A new method to screen polysaccharide cleavage enzymes. Enzyme Microb Technol 48:248–52.
- Bakke R, Kommedal R, Kalvenes S. (2001). Quantification of biofilm accumulation by an optical approach. J Microbiol Methods 44:13–26.
- Bakker DP, Van Der Plaats A, Verkerke GJ, et al. (2003). Comparison of velocity profiles for different flow chamber designs used in studies of microbial adhesion to surfaces. Appl Environ Microbiol 69:6280–7.
- Bansal T, Englert D, Lee J, et al. (2007). Differential effects of epinephrine, norepinephrine, and indole on Escherichia coli O157:H7 chemotaxis, colonization, and gene expression. Infect Immun 75:4597–607.
- Baro AM, Reifenberger RG. (2012). Atomic force microscopy in liquid: biological applications. Weinheim, Germany: Wiley-VCH.
- Beaussart A, El-Kirat-Chatel S, Sullan RM, et al. (2014). Quantifying the forces guiding microbial cell adhesion using single-cell force spectroscopy. Nat Protoc 9:1049–55.
- Becker H, Gartner C. (2008). Polymer microfabrication technologies for microfluidic systems. Anal Bioanal Chem 390:89–111.
- Beech IB, Smith JR, Steele AA, et al. (2002). The use of atomic force microscopy for studying interactions of bacterial biofilms with surfaces. Colloids Surf B Biointerfaces 23:231–47.
- Behrens S, Losekann T, Pett-Ridge J, et al. (2008). Linking microbial phylogeny to metabolic activity at the single-cell level by using enhanced element labeling-catalyzed reporter deposition fluorescence in situ hybridization (EL-FISH) and NanoSIMS. Appl Environ Microbiol 74:3143–50.
- Beier BD, Quivey RG, Berger AJ. (2012). Raman microspectroscopy for species identification and mapping within bacterial biofilms. AMB Express 2:35. doi: 10.1186/2191-0855-2-35.
- Benoit MR, Conant CG, Ionescu-Zanetti C, et al. (2010). New device for high-throughput viability screening of flow biofilms. Appl Environ Microbiol 76:4136–42.
- Berry D, Mader E, Lee TK, et al. (2015). Tracking heavy water (D2O) incorporation for identifying and sorting active microbial cells. Proc Natl Acad Sci USA 112:E194–203.
- Beyenal H, Donovan C, Lewandowski Z, Harkin G. (2004). Three-dimensional biofilm structure quantification. J Microbiol Methods 59:395–413.
- Bhardwaj C, Moore JF, Cui Y, et al. (2013). Laser desorption VUV postionization MS imaging of a cocultured biofilm. Anal Bioanal Chem 405:6969–77.
- Bjarnsholt T, Jensen PO, Fiandaca MJ, et al. (2009). Pseudomonas aeruginosa biofilms in the respiratory tract of cystic fibrosis patients. Pediatr Pulmonol 44:547–58.
- Bleck CK, Merz A, Gutierrez MG, et al. (2010). Comparison of different methods for thin section EM analysis of Mycobacterium smegmatis. J Microsc 237:23–38.
- Bleich R, Watrous JD, Dorrestein PC, et al. (2015). Thiopeptide antibiotics stimulate biofilm formation in Bacillus subtilis. Proc Natl Acad Sci USA 112:3086–91.
- Bos R, Van Der Mei HC, Busscher HJ. (1999). Physico-chemistry of initial microbial adhesive interactions-its mechanisms and methods for study. FEMS Microbiol Rev 23:179–230.
- Boyd CD, Smith TJ, El-Kirat-Chatel S, et al. (2014). Structural features of the Pseudomonas fluorescens biofilm adhesin LapA required for LapG-dependent cleavage, biofilm formation, and cell surface localization. J Bacteriol 196:2775–88.
- Bremer PJ, Geesey GG, Drake B. (1992). Atomic force microscopy examination of the topography of a hydrated bacterial biofilm on a copper surface. Curr Microbiol 24:223–30.
- Bressan E, Tessarolo F, Sbricoli L, et al. (2014). Effect of chlorhexidine in preventing plaque biofilm on healing abutment: a crossover controlled study. Implant Dent 23:64–8.
- Bridier A, Briandet R, Bouchez T, Jabot F. (2014). A model-based approach to detect interspecific interactions during biofilm development. Biofouling 30:761–71.
- Bridier A, Briandet R, Thomas V, Dubois-Brissonnet F. (2011a). Resistance of bacterial biofilms to disinfectants: a review. Biofouling 27:1017–32.
- Bridier A, Dubois-Brissonnet F, Boubetra A, et al. (2010). The biofilm architecture of sixty opportunistic pathogens deciphered using a high throughput CLSM method. J Microbiol Meth 82:64–70.
- Bridier A, Dubois-Brissonnet F, Greub G, et al. (2011b). Dynamics of the action of biocides in Pseudomonas aeruginosa biofilms. Antimicrob Agents Chemother 55:2648–54.
- Bridier A, Meylheuc T, Briandet R. (2013). Realistic representation of Bacillus subtilis biofilms architecture using combined microscopy (CLSM, ESEM and FESEM). Micron 48:65–9.
- Bridier A, Sanchez-Vizuete Mdel P, Le Coq D, et al. (2012). Biofilms of a Bacillus subtilis hospital isolate protect Staphylococcus aureus from biocide action. PLoS One 7:e44506. doi: 10.1371/journal.pone.0044506.
- Brown MJ, Lester JN. (1980). Comparison of bacterial extracellular polymer extraction methods. Appl Environ Microbiol 40:179–85.
- Brul S, Coote P, Oomes S, et al. (2002). Physiological actions of preservative agents: prospective of use of modern microbiological techniques in assessing microbial behaviour in food preservation. Int J Food Microbiol 79:55–64.
- Buckingham-Meyer K, Goeres DM, Hamilton MA. (2007). Comparative evaluation of biofilm disinfectant efficacy tests. J Microbiol Methods 70:236–44.
- Bulut F, Meric F, Yorgancilar E, et al. (2014). Effects of N-acetyl-cysteine and acetylsalicylic acid on the tonsil bacterial biofilm tissues by light and electron microscopy. Eur Rev Med Pharmacol Sci 18:3720–5.
- Burgess C, Desvaux M, Olmez H. (2014). 1st conference of BacFoodNet: mitigating bacterial colonisation in the food chain: bacterial adhesion, biocide resistance and microbial safety of fresh produce. Res Microbiol 165:305–10.
- Busscher HJ, Van Der Mei HC. (2006). Microbial adhesion in flow displacement systems. Clin Microbiol Rev 19:127–41.
- Cabral V, Znaidi S, Walker LA, et al. (2014). Targeted changes of the cell wall proteome influence Candida albicans ability to form single- and multi-strain biofilms. PLoS Pathog 10:e1004542. doi: 10.1371/journal.ppat.1004542.
- Cachet H, El Moustafid T, Herbert-Guillou D, et al. (2001). Characterization of deposits by direct observation and by electrochemical methods on a conductive transparent electrode. Application to biofilm and scale deposit under cathodic protection. Electrochimica Acta 46:3851–7.
- Camesano TA, Liu Y, Datta M. (2007). Measuring bacterial adhesion at environmental interfaces with single-cell and single-molecule techniques. Adv Water Res 30:1470–91.
- Carlson RP, Taffs R, Davison WM, Stewart PS. (2008). Anti-biofilm properties of chitosan-coated surfaces. J Biomater Sci Polym Ed 19:1035–46.
- Carvalhais V, Delgado-Rastrollo M, Melo LD, Cerca N. (2013). Controlled RNA contamination and degradation and its impact on qPCR gene expression in S. epidermidis biofilms. J Microbiol Methods 95:195–200.
- Cerca F, Trigo G, Correia A, et al. (2011). SYBR green as a fluorescent probe to evaluate the biofilm physiological state of Staphylococcus epidermidis, using flow cytometry. Can J Microbiol 57:850–6.
- Ceresa C, Tessarolo F, Caola I, et al. (2015). Inhibition of Candida albicans adhesion on medical-grade silicone by a Lactobacillus-derived biosurfactant. J Appl Microbiol 118:1116–25.
- Ceri H, Olson ME, Stremick C, et al. (1999). The calgary biofilm device: new technology for rapid determination of antibiotic susceptibilities of bacterial biofilms. J Clin Microbiol 37:1771–6.
- Cerqueira L, Azevedo NF, Almeida C, et al. (2008). DNA mimics for the rapid identification of microorganisms by fluorescence in situ hybridization (fish). Int J Mol Sci 9:1944–60.
- Chagnot C, Zorgani MA, Astruc T, Desvaux M. (2013). Proteinaceous determinants of surface colonization in bacteria: bacterial adhesion and biofilm formation from a protein secretion perspective. Front Microbiol 4:303. doi: 10.3389/fmicb.2013.00303.
- Chatterjee S, Biswas N, Datta A, et al. (2014). Atomic force microscopy in biofilm study. Microscopy (Oxf) 63:269–78.
- Chauhan A, Sakamoto C, Ghigo JM, Beloin C. (2013). Did I pick the right colony? Pitfalls in the study of regulation of the phase variable antigen 43 adhesin. PLoS One 8:e73568. doi: 10.1371/journal.pone.0073568.
- Chavant P, Gaillard-Martinie B, Talon R, et al. (2007). A new device for rapid evaluation of biofilm formation potential by bacteria. J Microbiol Methods 68:605–12.
- Chen NT, Chang CW. (2010). Rapid quantification of viable legionellae in water and biofilm using ethidium monoazide coupled with real-time quantitative PCR. J Appl Microbiol 109:623–34.
- Chen V, Li H, Fane AG. (2004). Noninvasive observation of synthetic membrane processes – a review of methods. J Membrane Sci 241:23–44.
- Choi AH, Slamti L, Avci FY, et al. (2009). The pgaABCD locus of Acinetobacter baumannii encodes the production of poly-beta-1-6-N-acetylglucosamine, which is critical for biofilm formation. J Bacteriol 191:5953–63.
- Christensen BB, Sternberg C, Andersen JB, et al. (1999). Molecular tools for study of biofilm physiology. Meth Enzymol 310:20–42.
- Christensen GD, Simpson WA, Bisno AL, Beachey EH. (1982). Adherence of slime-producing strains of Staphylococcus epidermidis to smooth surfaces. Infect Immun 37:318–26.
- Christensen GD, Simpson WA, Younger JJ, et al. (1985). Adherence of coagulase-negative staphylococci to plastic tissue culture plates: a quantitative model for the adherence of staphylococci to medical devices. J Clin Microbiol 22:996–1006.
- Chu H, Yu H, Tan X, et al. (2015). Extraction procedure optimization and the characteristics of dissolved extracellular organic matter (dEOM) and bound extracellular organic matter (bEOM) from Chlorella pyrenoidosa. Colloids Surf B Biointerfaces 125:238–46.
- Coenye T, Nelis HJ. (2010). In vitro and in vivo model systems to study microbial biofilm formation. J Microbiol Methods 83:89–105.
- Comte S, Guibaud G, Baudu M. (2006). Relations between extraction protocols for activated sludge extracellular polymeric substances (EPS) and EPS complexation properties. Enzyme Microb Technol 38:237–45.
- Cooper MA, Singleton VT. (2007). A survey of the 2001 to 2005 quartz crystal microbalance biosensor literature: applications of acoustic physics to the analysis of biomolecular interactions. J Mol Recognit 20:154–84.
- Corbin A, Pitts B, Parker A, Stewart PS. (2011). Antimicrobial penetration and efficacy in an in vitro oral biofilm model. Antimicrob Agents Chemother 55:3338–44.
- Costerton JW, Geesey GG, Cheng KJ. (1978). How bacteria stick. Sci Am 238:86–95.
- Costerton JW, Stewart PS, Greenberg EP. (1999). Bacterial biofilms: a common cause of persistent infections. Science 284:1318–22.
- Cramton SE, Gerke C, Schnell NF, et al. (1999). The intercellular adhesion (ica) locus is present in Staphylococcus aureus and is required for biofilm formation. Infect Immun 67:5427–33.
- Crusz SA, Popat R, Rybtke MT, et al. (2012). Bursting the bubble on bacterial biofilms: a flow cell methodology. Biofouling 28:835–42.
- Daddi Oubekka S, Briandet R, Fontaine-Aupart MP, Steenkeste K. (2012). Correlative time-resolved fluorescence microscopy to assess antibiotic diffusion-reaction in biofilms. Antimicrob Agents Chemother 56:3349–58.
- Daims H, Lucker S, Wagner M. (2006). daime, a novel image analysis program for microbial ecology and biofilm research. Environ Microbiol 8:200–13.
- Dall L, Herndon B. (1989). Quantitative assay of glycocalyx produced by viridans group streptococci that cause endocarditis. J Clin Microbiol 27:2039–41.
- Daniels KJ, Park YN, Srikantha T, et al. (2013). Impact of environmental conditions on the form and function of Candida albicans biofilms. Eukaryotic Cell 12:1389–402.
- Danin PE, Girou E, Legrand P, et al. (2015). Description and microbiology of endotracheal tube biofilm in mechanically ventilated subjects. Respir Care 60:21–9.
- Darby C, Hsu JW, Ghori N, Falkow S. (2002). Caenorhabditis elegans: plague bacteria biofilm blocks food intake. Nature 417:243–4.
- Das T, Sharma PK, Krom BP, et al. (2011). Role of eDNA on the adhesion forces between Streptococcus mutans and substratum surfaces: influence of ionic strength and substratum hydrophobicity. Langmuir 27:10113–18.
- Davis SC, Ricotti C, Cazzaniga A, et al. (2008). Microscopic and physiologic evidence for biofilm-associated wound colonization in vivo. Wound Repair Regen 16:23–9.
- Davison WM, Pitts B, Stewart PS. (2010). Spatial and temporal patterns of biocide action against Staphylococcus epidermidis biofilms. Antimicrob Agents Chemother 54:2920–7.
- De Angelis M, Siragusa S, Campanella D, et al. (2015). Comparative proteomic analysis of biofilm and planktonic cells of Lactobacillus plantarum db200. Proteomics 15:2244–57.
- De Brouwer JF, Cooksey KE, Wigglesworth-Cooksey B, et al. (2006). Time of flight-secondary ion mass spectrometry on isolated extracellular fractions and intact biofilms of three species of benthic diatoms. J Microbiol Meth 65:562–72.
- De Carvalho C, Da Fonseca MM. (2007). Assessment of three-dimensional biofilm structure using an optical microscope. BioTechniques 42:616–20.
- Delatolla R, Tufenkji N, Comeau Y, et al. (2009). In situ characterization of nitrifying biofilm: minimizing biomass loss and preserving perspective. Water Res 43:1775–87.
- Desvaux M, Hebraud M, Talon R, Henderson IR. (2009). Secretion and subcellular localizations of bacterial proteins: a semantic awareness issue. Trends Microbiol 17:139–45.
- Di Bonaventura G, Piccolomini R, Paludi D, et al. (2008). Influence of temperature on biofilm formation by Listeria monocytogenes on various food-contact surfaces: relationship with motility and cell surface hydrophobicity. J Appl Microbiol 104:1552–61.
- Di Bonaventura G, Pompilio A, Picciani C, et al. (2006). Biofilm formation by the emerging fungal pathogen Trichosporon asahii: development, architecture, and antifungal resistance. Antimicrob Agents Chemother 50:3269–76.
- Di Bonaventura G, Spedicato I, D'antonio D, et al. (2003). Biofilm formation by Stenotrophomonas maltophilia: modulation by quinolones, trimethoprim-sulfamethoxazole, and ceftazidime. Antimicrob Agents Chemother 48:151–60.
- Di Luca M, Maccari G, Maisetta G, Batoni G. (2015). BaAMPs: the database of biofilm-active antimicrobial peptides. Biofouling 31:193–9.
- Djordjevic D, Wiedmann M, Mclandsborough LA. (2002). Microtiter plate assay for assessment of Listeria monocytogenes biofilm formation. Appl Environ Microbiol 68:2950–8.
- Dominguez-Benetton X, Sevda S, Vanbroekhoven K, Pant D. (2012). The accurate use of impedance analysis for the study of microbial electrochemical systems. Chem Soc Rev 41:7228–46.
- Doroshenko N, Tseng BS, Howlin RP, et al. (2014). Extracellular DNA impedes the transport of vancomycin in Staphylococcus epidermidis biofilms preexposed to subinhibitory concentrations of vancomycin. Antimicrob Agents Chemother 58:7273–82.
- Doulgeraki AI, Iliopoulos V, Nychas GE. (2014). Metabolomic analysis of Salmonella enterica cells in vitro and in situ. Plant Microbe Interaction, July 6–10 2014. Rhodes, Greece: MPMI.
- Dufrene YF. (2002). Atomic force microscopy, a powerful tool in microbiology. J Bacteriol 184:5205–13.
- Dugat-Bony E, Straub C, Teissandier A, et al. (2015). Overview of a surface-ripened cheese community functioning by meta-omics analyses. PLoS One 10:e0124360. doi: 10.1371/journal.pone.0124360.
- Edmonds JM, Collett PJ, Valdes ER, et al. (2009). Surface sampling of spores in dry-deposition aerosols. Appl Environ Microbiol 75:39–44.
- Eguia E, Trueba A, Rio-Calonge B, et al. (2008). Combined monitor for direct and indirect measurement of biofouling. Biofouling 24:75–86.
- Fittipaldi M, Nocker A, Codony F. (2012). Progress in understanding preferential detection of live cells using viability dyes in combination with DNA amplification. J Microbiol Methods 91:276–89.
- Flemming HC, Wingender J. (2010). The biofilm matrix. Nat Rev Microbiol 8:623–33.
- Fletcher M. (1977). The effects of culture concentration and age, time, and temperature on bacterial attachment to polystyrene. Can J Microbiol 23:1–6.
- Fontenete S, Leite M, Guimaraes N, et al. (2015). Towards fluorescence in vivo hybridization (FIVH) detection of H. Pylori in gastric mucosa using advanced LNA probes. PLoS One 10:e0125494. doi: 10.1371/journal.pone.0125494.
- Franca A, Carvalhais V, Maira-Litran T, et al. (2014). Alterations in the Staphylococcus epidermidis biofilm transcriptome following interaction with whole human blood. Pathog Dis 70:444–8.
- Francius G, Lebeer S, Alsteens D, et al. (2008). Detection, localization, and conformational analysis of single polysaccharide molecules on live bacteria. ACS Nano 2:1921–9.
- Freiberg JA, Mciver KS, Shirtliff ME. (2014). In vivo expression of Streptococcus pyogenes immunogenic proteins during tibial foreign body infection. Infect Immun 82:3891–9.
- Gallaher TK, Wu S, Webster P, Aguilera R. (2006). Identification of biofilm proteins in non-typeable Haemophilus influenzae. BMC Microbiol 6:65. doi: 10.1186/1471-2180-6-65.
- Garcez AS, Nunez SC, Azambuja N Jr, et al. (2013). Effects of photodynamic therapy on gram-positive and gram-negative bacterial biofilms by bioluminescence imaging and scanning electron microscopic analysis. Photomed Laser Surg 31:519–25.
- Gerke C, Kraft A, Sussmuth R, et al. (1998). Characterization of the N-acetylglucosaminyltransferase activity involved in the biosynthesis of the Staphylococcus epidermidis polysaccharide intercellular adhesin. J Biol Chem 273:18586–93.
- Ghosh P, Ben-Jacob E, Levine H. (2013). Modeling cell-death patterning during biofilm formation. Phys Biol 10:066006. doi: 10.1088/1478-3975/10/6/066006.
- Glass NR, Tjeung R, Chan P, et al. (2011). Organosilane deposition for microfluidic applications. Biomicrofluidics 5:36501–365017.
- Goeres DM, Hamilton MA, Beck NA, et al. (2009). A method for growing a biofilm under low shear at the air–liquid interface using the drip flow biofilm reactor. Nat Protoc 4:783–8.
- Gomez-Suarez C, Busscher HJ, Van Der Mei HC. (2001). Analysis of bacterial detachment from substratum surfaces by the passage of air–liquid interfaces. Appl Environ Microbiol 67:2531–7.
- Gong AS, Bolster CH, Benavides M, Walker SL. (2009). Extraction and analysis of extracellular polymeric substances: comparison of methods and extracellular polymeric substance levels in Salmonella pullorum sa 1685. Environ Eng Sci 26:1523–32.
- Grand I, Bellon-Fontaine MN, Herry JM, et al. (2011). Possible overestimation of surface disinfection efficiency by assessment methods based on liquid sampling procedures as demonstrated by in situ quantification of spore viability. Appl Environ Microbiol 77:6208–14.
- Guilbaud M, Piveteau P, Desvaux M, et al. (2015). Exploring the diversity of Listeria monocytogenes biofilm architecture by high-throughput confocal laser scanning microscopy and the predominance of the honeycomb-like morphotype. Appl Environ Microbiol 81:1813–19.
- Haagensen JA, Klausen M, Ernst RK, et al. (2007). Differentiation and distribution of colistin- and sodium dodecyl sulfate-tolerant cells in Pseudomonas aeruginosa biofilms. J Bacteriol 189:28–37.
- Hannig C, Follo M, Hellwig E, Al-Ahmad A. (2010). Visualization of adherent micro-organisms using different techniques. J Med Microbiol 59:1–7.
- Harz M, Rosch P, Peschke KD, et al. (2005). Micro-Raman spectroscopic identification of bacterial cells of the genus Staphylococcus and dependence on their cultivation conditions. Analyst 130:1543–50.
- Hasan S, Danishuddin M, Khan AU. (2015). Inhibitory effect of Zingiber officinale towards Streptococcus mutans virulence and caries development: in vitro and in vivo studies. BMC Microbiol 15:1. doi: 10.1186/s12866-014-0320-5.
- Hassanpourfard M, Sun X, Valiei A, et al. (2014). Protocol for biofilm streamer formation in a microfluidic device with micro-pillars. J Vis Exp e51732. doi:10.3791/51732.
- Henderson IR, Owen P, Nataro JP. (1999). Molecular switches – the ON and OFF of bacterial phase variation. Mol Microbiol 33:919–32.
- Heydorn A, Ersboll B, Kato J, et al. (2002). Statistical analysis of Pseudomonas aeruginosa biofilm development: impact of mutations in genes involved in twitching motility, cell-to-cell signaling, and stationary-phase sigma factor expression. Appl Environ Microbiol 68:2008–17.
- Heydorn A, Ersboll BK, Hentzer M, et al. (2000a). Experimental reproducibility in flow-chamber biofilms. Microbiology 146: 2409–15.
- Heydorn A, Nielsen AT, Hentzer M, et al. (2000b). Quantification of biofilm structures by the novel computer program COMSTAT. Microbiology 146:2395–407.
- Hinterdorfer P, Dufrene YF. (2006). Detection and localization of single molecular recognition events using atomic force microscopy. Nat Methods 3:347–55.
- Hochbaum AI, Kolodkin-Gal I, Foulston L, et al. (2011). Inhibitory effects of d-amino acids on Staphylococcus aureus biofilm development. J Bacteriol 193:5616–22.
- Hochstim CJ, Choi JY, Lowe D, et al. (2010). Biofilm detection with hematoxylin–eosin staining. Arch Otolaryngol Head Neck Surg 136:453–6.
- Hong SD, Dhong HJ, Chung SK, et al. (2014). Hematoxylin and eosin staining for detecting biofilms: practical and cost-effective methods for predicting worse outcomes after endoscopic sinus surgery. Clin Exp Otorhinolaryngol 7:193–7.
- Hope CK, Clements D, Wilson M. (2002). Determining the spatial distribution of viable and nonviable bacteria in hydrated microcosm dental plaques by viability profiling. J Appl Microbiol 93:448–55.
- Hu YF, Zhang JD, Ulstrup J. (2011). Investigation of Streptococcus mutans biofilm growth on modified Au(111)-surfaces using AFM and electrochemistry. J Electroanal Chem 656:41–9.
- Hua X, Marshall MJ, Xiong Y, et al. (2015). Two-dimensional and three-dimensional dynamic imaging of live biofilms in a microchannel by time-of-flight secondary ion mass spectrometry. Biomicrofluidics 9:031101. doi: 10.1063/1.4919807.
- Hua X, Yu XY, Wang Z, et al. (2014). In situ molecular imaging of a hydrated biofilm in a microfluidic reactor by ToF-SIMS. Analyst 139:1609–13.
- Huang WE, Stoecker K, Griffiths R, et al. (2007). Raman-fish: combining stable-isotope Raman spectroscopy and fluorescence in situ hybridization for the single cell analysis of identity and function. Environ Microbiol 9:1878–89.
- Hung C, Zhou Y, Pinkner JS, et al. (2013). Escherichia coli biofilms have an organized and complex extracellular matrix structure. MBio 4:e00645–13.
- Iliescu C, Taylor H, Avram M, et al. (2012). A practical guide for the fabrication of microfluidic devices using glass and silicon. Biomicrofluidics 6:16505–1650516.
- Jackson S, Coulthwaite L, Loewy Z, et al. (2014). Biofilm development by blastospores and hyphae of Candida albicans on abraded denture acrylic resin surfaces. J Prosthet Dent 112:988–93.
- Janakiraman V, Englert D, Jayaraman A, Baskaran H. (2009). Modeling growth and quorum sensing in biofilms grown in microfluidic chambers. Ann Biomed Eng 37:1206–16.
- Jarrett CO, Deak E, Isherwood KE, et al. (2004). Transmission of Yersinia pestis from an infectious biofilm in the flea vector. J Infect Dis 190:783–92.
- Jiao Y, Cody GD, Harding AK, et al. (2010). Characterization of extracellular polymeric substances from acidophilic microbial biofilms. Appl Environ Microbiol 76:2916–22.
- Johnson ME, Landers JP. (2004). Fundamentals and practice for ultrasensitive laser-induced fluorescence detection in microanalytical systems. Electrophoresis 25:3513–27.
- Jorge P, Pérez-Pérez M, Rodríguez GP, et al. (2016). Reconstruction of the network of experimentally validated AMP-drug combinations against Pseudomonas aeruginosa infections. Curr Bioinform, 11. [Epub ahead of print]. doi: 10.2174/1574893611666160617093955.
- Kang S, Elimelech M. (2009). Bioinspired single bacterial cell force spectroscopy. Langmuir 25:9656–9.
- Karcz J, Bernas T, Nowak A, et al. (2012). Application of lyophilization to prepare the nitrifying bacterial biofilm for imaging with scanning electron microscopy. Scanning 34:26–36.
- Kim BI, Boehm RD. (2012). Force-feedback high-speed atomic force microscope for studying large biological systems. Micron 43:1372–9.
- Kim J, Hegde M, Kim SH, et al. (2012). A microfluidic device for high throughput bacterial biofilm studies. Lab Chip 12:1157–63.
- Kindaichi T, Ito T, Okabe S. (2004). Ecophysiological interaction between nitrifying bacteria and heterotrophic bacteria in autotrophic nitrifying biofilms as determined by microautoradiography-fluorescence in situ hybridization. Appl Environ Microbiol 70:1641–50.
- Klausen M, Aaes-Jorgensen A, Molin S, Tolker-Nielsen T. (2003b). Involvement of bacterial migration in the development of complex multicellular structures in Pseudomonas aeruginosa biofilms. Mol Microbiol 50:61–8.
- Klausen M, Heydorn A, Ragas P, et al. (2003a). Biofilm formation by Pseudomonas aeruginosa wild type, flagella and type IV pili mutants. Mol Microbiol 48:1511–24.
- Klein MI, Scott-Anne KM, Gregoire S, et al. (2012). Molecular approaches for viable bacterial population and transcriptional analyzes in a rodent model of dental caries. Mol Oral Microbiol 27:350–61.
- Koban I, Matthes R, Hubner NO, et al. (2012). Xtt assay of ex vivo saliva biofilms to test antimicrobial influences. GMS Krankenhhyg Interdiszip 7:Doc06. doi: 10.3205/dgkh000190.
- Kornegay BH, Andrews JF. (1968). Kinetics of fixed-film biological reactors. J Water Pollut Con F 40:R460–8.
- Korstgens V, Flemming HC, Wingender J, Borchard W. (2001). Uniaxial compression measurement device for investigation of the mechanical stability of biofilms. J Microbiol Methods 46:9–17.
- Kotra LP, Amro NA, Liu GY, Mobashery S. (2000). Visualizing bacteria at high resolution. ASM News 66:675–81.
- Kragh KN, Alhede M, Jensen PO, et al. (2014). Polymorphonuclear leukocytes restrict growth of Pseudomonas aeruginosa in the lungs of cystic fibrosis patients. Infect Immun 82:4477–86.
- Kruger NJ, Buhler C, Iwobi AN, et al. (2014). “Limits of control” – crucial parameters for a reliable quantification of viable campylobacter by real-time PCR. PLoS One 9:e88108. doi: 10.1371/journal.pone.0088108.
- Kuhn TS. (1970). The structure of scientific revolutions. Chicago (MI): University of Chicago Press.
- Kunacheva C, Stuckey DC. (2014). Analytical methods for soluble microbial products (SMP) and extracellular polymers (ECP) in wastewater treatment systems: a review. Water Res 61:1–18.
- Kuypers MM, Jorgensen BB. (2007). The future of single-cell environmental microbiology. Environ Microbiol 9:6–7.
- Larsen P, Nielsen JL, Otzen D, Nielsen PH. (2008). Amyloid-like adhesins produced by floc-forming and filamentous bacteria in activated sludge. Appl Environ Microbiol 74:1517–26.
- Laspidou CS, Rittmann BE. (2002). A unified theory for extracellular polymeric substances, soluble microbial products, and active and inert biomass. Water Res 36:2711–20.
- Lau PC, Dutcher JR, Beveridge TJ, Lam JS. (2009). Absolute quantitation of bacterial biofilm adhesion and viscoelasticity by microbead force spectroscopy. Biophys J 96:2935–48.
- Lawrence JR, Korber DR, Hoyle BD, et al. (1991). Optical sectioning of microbial biofilms. J Bacteriol 173:6558–67.
- Lawrence JR, Swerhone GD, Neu TR. (2000). A simple rotating annular reactor for replicated biofilm studies. J Microbiol Methods 42:215–24.
- Lee JH, Kaplan JB, Lee WY. (2008). Microfluidic devices for studying growth and detachment of Staphylococcus epidermidis biofilms. Biomed Microdevices 10:489–98.
- Lee N, Nielsen PH, Andreasen KH, et al. (1999). Combination of fluorescent in situ hybridization and microautoradiography-a new tool for structure–function analyses in microbial ecology. Appl Environ Microbiol 65:1289–97.
- Lenz AP, Williamson KS, Pitts B, et al. (2008). Localized gene expression in Pseudomonas aeruginosa biofilms. Appl Environ Microbiol 74:4463–71.
- Lewandowski Z, Beyenal H, Stookey D. (2004). Reproducibility of biofilm processes and the meaning of steady state in biofilm reactors. Water Sci Technol 49:359–64.
- Lewandowski Z, Beyenal H. (2014). Quantifying biofilm structure. Fundamentals of biofilm research. 2nd ed. Boca Raton (FL): CRC Press.
- Li L, Mendis N, Trigui H, et al. (2014). The importance of the viable but non-culturable state in human bacterial pathogens. Front Microbiol 5:258. doi: 10.3389/fmicb.2014.00258.
- Li T, Wu TD, Mazeas L, et al. (2008). Simultaneous analysis of microbial identity and function using NanoSIMS. Environ Microbiol 10:580–8.
- Li YF, Sun HW, Gao R, et al. (2015). Inhibited biofilm formation and improved antibacterial activity of a novel nanoemulsion against cariogenic Streptococcus mutans in vitro and in vivo. Int J Nanomedicine 10:447–62.
- Lilledahl MB, Stokke BT. (2015). Novel imaging technologies for characterization of microbial extracellular polysaccharides. Front Microbiol 6:525.
- Lim J, Cui Y, Oh YJ, et al. (2011). Studying the effect of alginate overproduction on Pseudomonas aeruginosa biofilm by atomic force microscopy. J Nanosci Nanotechnol 11:5676–81.
- Linkert M, Rueden CT, Allan C, et al. (2010). Metadata matters: access to image data in the real world. J Cell Biol 189:777–82.
- Linton CJ, Sherriff A, Millar MR. (1999). Use of a modified Robbins device to directly compare the adhesion of Staphylococcus epidermidis RP62A to surfaces. J Appl Microbiol 86:194–202.
- Long T, Ford RM. (2009). Enhanced transverse migration of bacteria by chemotaxis in a porous T-sensor. Environ Sci Technol 43:1546–52.
- Lourenço A, Coenye T, Goeres DM, et al. (2014). Minimum information about a biofilm experiment (MIABiE): standards for reporting experiments and data on sessile microbial communities living at interfaces. Pathog Dis 70:250–6.
- Lourenço A, De Las Heras A, Scortti M, et al. (2013). Comparison of Listeria monocytogenes exoproteomes from biofilm and planktonic state: Lmo2504, a protein associated with biofilms. Appl Environ Microbiol 79:6075–82.
- Lourenço A, Ferreira A, Veiga N, et al. (2012). BiofOmics: a web platform for the systematic and standardized collection of high-throughput biofilm data. PLoS One 7:e39960.
- Lower SK. (2011). Atomic force microscopy to study intermolecular forces and bonds associated with bacteria. Advances in experimental medicine and biology. Dordrecht, The Netherlands: Springer Science + Business Media.
- Luo Q, Shang J, Feng X, et al. (2013). PrfA led to reduced biofilm formation and contributed to altered gene expression patterns in biofilm-forming Listeria monocytogenes. Curr Microbiol 67:372–8.
- Madou MJ. (2011). Fundamentals of microfabrication and nanotechnology. Boca Raton: CRC Press.
- Malic S, Hill KE, Hayes A, et al. (2009). Detection and identification of specific bacteria in wound biofilms using peptide nucleic acid fluorescent in situ hybridization (PNA fish). Microbiology (Reading, Engl.) 155:2603–11.
- Mangalappalli-Illathu AK, Vidovic S, Korber DR. (2008). Differential adaptive response and survival of Salmonella enterica serovar enteritidis planktonic and biofilm cells exposed to benzalkonium chloride. Antimicrob Agents Chemother 52:3669–80.
- Manz W, Szewzyk U, Ericsson P, et al. (1993). In situ identification of bacteria in drinking water and adjoining biofilms by hybridization with 16s and 23s rRNA-directed fluorescent oligonucleotide probes. Appl Environ Microbiol 59:2293–8.
- Mao H, Cremer PS, Manson MD. (2003). A sensitive, versatile microfluidic assay for bacterial chemotaxis. Proc Natl Acad Sci USA 100:5449–54.
- Marchal M, Briandet R, Halter D, et al. (2011). Subinhibitory arsenite concentrations lead to population dispersal in Thiomonas sp. PLoS One 6:e23181. doi: 10.1371/journal.pone.0023181.
- Mccoy WF, Bryers JD, Robbins J, Costerton JW. (1981). Observations of fouling biofilm formation. Can J Microbiol 27:910–17.
- Mcdonald JC, Duffy DC, Anderson JR, et al. (2000). Fabrication of microfluidic systems in poly(dimethylsiloxane). Electrophoresis 21:27–40.
- Meyer MT, Roy V, Bentley WE, Ghodssi R. (2011). Development and validation of a microfluidic reactor for biofilm monitoring via optical methods. J Micromech Microeng 21:054023. doi: 10.1088/0960-1317/21/5/054023.
- Meyer RL, Zhou X, Tang L, et al. (2010). Immobilization of living bacteria for AFM imaging under physiological conditions. Ultramicroscopy 110:1349–57.
- Moller S, Sternberg C, Andersen JB, et al. (1998). In situ gene expression in mixed-culture biofilms: evidence of metabolic interactions between community members. Appl Environ Microbiol 64:721–32.
- Mueller LN, De Brouwer JF, Almeida JS, et al. (2006). Analysis of a marine phototrophic biofilm by confocal laser scanning microscopy using the new image quantification software PHLIP. BMC Ecol 6:1.
- Muller DJ, Krieg M, Alsteens D, Dufrene YF. (2009). New frontiers in atomic force microscopy: analyzing interactions from single-molecules to cells. Curr Opin Biotechnol 20:4–13.
- Muller P, Guggenheim B, Attin T, et al. (2011). Potential of shock waves to remove calculus and biofilm. Clin Oral Investig 15:959–65.
- Musat N, Foster R, Vagner T, et al. (2012). Detecting metabolic activities in single cells, with emphasis on nanoSIMS. FEMS Microbiol Rev 36:486–511.
- Musat N, Halm H, Winterholler B, et al. (2008). A single-cell view on the ecophysiology of anaerobic phototrophic bacteria. Proc Natl Acad Sci USA 105:17861–6.
- Muscariello L, Rosso F, Marino G, et al. (2005). A critical overview of ESEM applications in the biological field. J Cell Physiol 205:328–34.
- Nagant C, Tre-Hardy M, Devleeschouwer M, Dehaye JP. (2010). Study of the initial phase of biofilm formation using a biofomic approach. J Microbiol Methods 82:243–8.
- Nandakumar K, Obika H, Utsumi A, et al. (2004). In vitro laser ablation of laboratory developed biofilms using an Nd:YAG laser of 532 nm wavelength. Biotechnol Bioeng 86:729–36.
- Neu TR, Lawrence JR. (2014a). Advanced techniques for in situ analysis of the biofilm matrix (structure, composition, dynamics) by means of laser scanning microscopy. Methods Mol Biol 1147:43–64.
- Neu TR, Lawrence JR. (2014b). Investigation of microbial biofilm structure by laser scanning microscopy. Adv Biochem Eng Biotechnol 146:1–51.
- Neu TR, Lawrence JR. (2015). Innovative techniques, sensors, and approaches for imaging biofilms at different scales. Trends Microbiol 23:233–42.
- Nickel JC, Ruseska I, Wright JB, Costerton JW. (1985). Tobramycin resistance of Pseudomonas aeruginosa cells growing as a biofilm on urinary catheter material. Antimicrob Agents Chemother 27:619–24.
- Nielsen PE, Egholm M, Berg RH, et al. (1991). Sequence-selective recognition of DNA by strand displacement with a thymine-substituted polyamide. Science 254:1497–500.
- Nishitani K, Sutipornpalangkul W, De Mesy Bentley KL, et al. (2015). Quantifying the natural history of biofilm formation in vivo during the establishment of chronic implant-associated Staphylococcus aureus osteomyelitis in mice to identify critical pathogen and host factors. J Orthop Res 33:1311–19.
- Nocker A, Camper AK. (2009). Novel approaches toward preferential detection of viable cells using nucleic acid amplification techniques. FEMS Microbiol Lett 291:137–42.
- Nocker A, Mazza A, Masson L, et al. (2009). Selective detection of live bacteria combining propidium monoazide sample treatment with microarray technology. J Microbiol Meth 76:253–61.
- Nocker A, Sossa KE, Camper AK. (2007). Molecular monitoring of disinfection efficacy using propidium monoazide in combination with quantitative PCR. J Microbiol Methods 70:252–60.
- Oates A, Bowling FL, Boulton AJ, et al. (2014). The visualization of biofilms in chronic diabetic foot wounds using routine diagnostic microscopy methods. J Diabetes Res 2014:153586. doi: 10.1155/2014/153586.
- O'brien J, Wilson I, Orton T, Pognan F. (2000). Investigation of the alamar blue (resazurin) fluorescent dye for the assessment of mammalian cell cytotoxicity. Eur J Biochem 267:5421–6.
- Okabe S, Satoh H, Kindaichi T. (2011). A polyphasic approach to study ecophysiology of complex multispecies nitrifying biofilms. Meth Enzymol 496:163–84.
- Okshevsky M, Meyer RL. (2014). Evaluation of fluorescent stains for visualizing extracellular DNA in biofilms. J Microbiol Methods 105:102–4.
- Oli MW, Mcarthur WP, Brady LJ. (2006). A whole cell BIAcore assay to evaluate p1-mediated adherence of Streptococcus mutans to human salivary agglutinin and inhibition by specific antibodies. J Microbiol Meth 65:503–11.
- Oliveira F, Lima CA, Bras S, et al. (2015). Evidence for inter- and intraspecies biofilm formation variability among a small group of coagulase-negative staphylococci. FEMS Microbiol Lett 362. doi: 10.1093/femsle/fnv175.
- Olofsson AC, Hermansson M, Elwing H. (2005). Use of a quartz crystal microbalance to investigate the antiadhesive potential of N-acetyl-l-cysteine. Appl Environ Microbiol 71:2705–12.
- Olson ME, Ceri H, Morck DW, et al. (2002). Biofilm bacteria: formation and comparative susceptibility to antibiotics. Can J Vet Res 66:86–92.
- Orsinger-Jacobsen SJ, Patel SS, Vellozzi EM, et al. (2013). Use of a stainless steel washer platform to study Acinetobacter baumannii adhesion and biofilm formation on abiotic surfaces. Microbiology (Reading, Engl.) 159:2594–604.
- O'toole GA, Kolter R. (1998). Flagellar and twitching motility are necessary for Pseudomonas aeruginosa biofilm development. Mol Microbiol 30:295–304.
- Otto K, Elwing H, Hermansson M. (1999). Effect of ionic strength on initial interactions of Escherichia coli with surfaces, studied on-line by a novel quartz crystal microbalance technique. J Bacteriol 181:5210–18.
- Otto K, Silhavy TJ. (2002). Surface sensing and adhesion of Escherichia coli controlled by the Cpx-signaling pathway. Proc Natl Acad Sci USA 99:2287–92.
- Ovchinnikova ES, Krom BP, Harapanahalli AK, et al. (2013). Surface thermodynamic and adhesion force evaluation of the role of chitin-binding protein in the physical interaction between Pseudomonas aeruginosa and Candida albicans. Langmuir 29:4823–9.
- Pallandre A, De Lambert B, Attia R, et al. (2006). Surface treatment and characterization: perspectives to electrophoresis and lab-on-chips. Electrophoresis 27:584–610.
- Pan X, Liu J, Zhang D, et al. (2010). A comparison of five extraction methods for extracellular polymeric substances (EPS) from biofilm by using three dimensional excitation-emission matrix (3DEEM) fluorescence spectroscopy. Water SA 36:111–116.
- Pan Y, Breidt F Jr. (2007). Enumeration of viable Listeria monocytogenes cells by real-time PCR with propidium monoazide and ethidium monoazide in the presence of dead cells. Appl Environ Microbiol 73:8028–31.
- Patzold R, Keuntje M, Anders-Von Ahlften A. (2006). A new approach to non-destructive analysis of biofilms by confocal Raman microscopy. Anal Bioanal Chem 386:286–92.
- Pavarina AC, Dovigo LN, Sanitá PV, et al. (2011). Dynamic models for in vitro biofilm formation. In: Bailey WC, ed. Biofilms: formation, development and properties. 1st ed. Hauppauge, NY: Nova Science Publishers, Inc.
- Pavlekovic M, Schmid MC, Schmider-Poignee N, et al. (2009). Optimization of three fish procedures for in situ detection of anaerobic ammonium oxidizing bacteria in biological wastewater treatment. J Microbiol Meth 78:119–26.
- Peeters E, Nelis HJ, Coenye T. (2008). Comparison of multiple methods for quantification of microbial biofilms grown in microtiter plates. J Microbiol Methods 72:157–65.
- Perez-Osorio AC, Williamson KS, Franklin MJ. (2010). Heterogeneous rpoS and rhlR mRNA levels and 16s rRNA/rDNA (rRNA gene) ratios within Pseudomonas aeruginosa biofilms, sampled by laser capture microdissection. J Bacteriol 192:2991–3000.
- Perez-Rodriguez G, Glez-Pena D, Azevedo NF, et al. (2015). Enabling systematic, harmonized and large-scale biofilms data computation: the biofilms experiment workbench. Comput Meth Programs Biomed 118:309–21.
- Pernthaler A, Pernthaler J, Amann R. (2002). Fluorescence in situ hybridization and catalyzed reporter deposition for the identification of marine bacteria. Appl Environ Microbiol 68:3094–101.
- Peterson BW, He Y, Ren Y, et al. (2015). Viscoelasticity of biofilms and their recalcitrance to mechanical and chemical challenges. FEMS Microbiol Rev 39:234–45.
- Peterson SB, Irie Y, Borlee BR, et al. (2011). Different methods for culturing biofilms in vitro. In: Bjarnsholt T, Jensen PØ, Moser C, Høiby N, eds. Biofilm infections. New York: Springer.
- Pettit RK, Weber CA, Kean MJ, et al. (2005). Microplate alamar blue assay for Staphylococcus epidermidis biofilm susceptibility testing. Antimicrob Agents Chemother 49:2612–17.
- Pettit RK, Weber CA, Pettit GR. (2009). Application of a high throughput alamar blue biofilm susceptibility assay to Staphylococcus aureus biofilms. Ann Clin Microbiol Antimicrob 8:28. doi: 10.1186/1476-0711-8-28.
- Peulen TO, Wilkinson KJ. (2011). Diffusion of nanoparticles in a biofilm. Environ Sci Technol 45:3367–73.
- Pinkart HC, Ringelberg DB, Piceno YM, et al. (2002). Biochemical approaches to biomass measurements and community structure analysis. In: Hurst CJ, Crawford RL, Mcinerney MJ, et al., eds. Manual of environmental microbiology. Washington (DC): ASM Press.
- Pinzon-Arango PA, Liu Y, Camesano TA. (2009). Role of cranberry on bacterial adhesion forces and implications for Escherichia coli-uroepithelial cell attachment. J Med Food 12:259–70.
- Pitts B, Hamilton MA, Zelver N, Stewart PS. (2003). A microtiter-plate screening method for biofilm disinfection and removal. J Microbiol Methods 54:269–76.
- Planchon S, Desvaux M, Chafsey I, et al. (2009). Comparative subproteome analyses of planktonic and sessile Staphylococcus xylosus C2a: new insight in cell physiology of a coagulase-negative Staphylococcus in biofilm. J Proteome Res 8:1797–809.
- Pompilio A, De Nicola S, Crocetta V, et al. (2015). New insights in Staphylococcus pseudintermedius pathogenicity: antibiotic-resistant biofilm formation by a human wound-associated strain. BMC Microbiol 15:109. doi: 10.1186/s12866-015-0449-x.
- Potthoff E, Ossola D, Zambelli T, Vorholt JA. (2015). Bacterial adhesion force quantification by fluidic force microscopy. Nanoscale 7:4070–9.
- Puig C, Domenech A, Garmendia J, et al. (2014). Increased biofilm formation by nontypeable Haemophilus influenzae isolates from patients with invasive disease or otitis media versus strains recovered from cases of respiratory infections. Appl Environ Microbiol 80:7088–95.
- Qin Z, Zhang J, Hu Y, et al. (2009). Organic compounds inhibiting S. epidermidis adhesion and biofilm formation. Ultramicroscopy 109:881–8.
- Raes J, Bork P. (2008). Molecular eco-systems biology: towards an understanding of community function. Nat Rev Microbiol 6:693–9.
- Ramage G, Vande Walle K, Wickes BL, Lopez-Ribot JL. (2001). Standardized method for in vitro antifungal susceptibility testing of Candida albicans biofilms. Antimicrob Agents Chemother 45:2475–9.
- Ramage G. (2016). Comparing apples and oranges: considerations for quantifying candidal biofilms with xtt [2,3-bis(2-methoxy-4-nitro-5-sulfo-phenyl)-2h-tetrazolium-5-carboxanilide] and the need for standardized testing. J Med Microbiol 65:259–60.
- Remis JP, Wei D, Gorur A, et al. (2014). Bacterial social networks: structure and composition of Myxococcus xanthus outer membrane vesicle chains. Environ Microbiol 16:598–610.
- Renier S, Chagnot C, Deschamps J, et al. (2014). Inactivation of the SecA2 protein export pathway in Listeria monocytogenes promotes cell aggregation, impacts biofilm architecture and induces biofilm formation in environmental condition. Environ Microbiol 16:1176–92.
- Reynolds TB, Fink GR. (2001). Bakers' yeast, a model for fungal biofilm formation. Science 291:878–81.
- Richardson N, Mordan NJ, Figueiredo JA, et al. (2009). Microflora in teeth associated with apical periodontitis: a methodological observational study comparing two protocols and three microscopy techniques. Int Endod J 42:908–21.
- Rodahl M, Hook F, Krozer A, et al. (1995). Quartz-crystal microbalance setup for frequency and Q-factor measurements in gaseous and liquid environments. Rev Sci Instrum 66:3924–30.
- Rodrigues D, Banobre-Lopez M, Espina B, et al. (2013). Effect of magnetic hyperthermia on the structure of biofilm and cellular viability of a food spoilage bacterium. Biofouling 29:1225–32.
- Rueden CT, Eliceiri KW. (2007). Visualization approaches for multidimensional biological image data. BioTechniques 43:33–6.
- Sabaeifard P, Abdi-Ali A, Soudi MR, Dinarvand R. (2014). Optimization of tetrazolium salt assay for Pseudomonas aeruginosa biofilm using microtiter plate method. J Microbiol Methods 105:134–40.
- Salanitro JP, Hokanson JS. (1990). Tubular biofilm reactor – biofilm samples are connected in series to monitor biofouling by microorganisms in continuous flow stream. US831-H US039851 20 Apr 1987.
- Salminen A, Loimaranta V, Joosten JA, et al. (2007). Inhibition of p-fimbriated Escherichia coli adhesion by multivalent galabiose derivatives studied by a live-bacteria application of surface plasmon resonance. J Antimicrob Chemother 60:495–501.
- Salta M, Capretto L, Carugo D, et al. (2013). Life under flow: a novel microfluidic device for the assessment of anti-biofilm technologies. Biomicrofluidics 7:64118. doi: 10.1063/1.4850796.
- Salunke GR, Ghosh S, Santosh Kumar RJ, et al. (2014). Rapid efficient synthesis and characterization of silver, gold, and bimetallic nanoparticles from the medicinal plant Plumbago zeylanica and their application in biofilm control. Int J Nanomedicine 9:2635–53.
- Samaranayake YH, Cheung BP, Yau JY, et al. (2013). Human serum promotes Candida albicans biofilm growth and virulence gene expression on silicone biomaterial. PLoS One 8:e62902. doi: 10.1371/journal.pone.0062902.
- Sanchez-Romero MA, Cota I, Casadesus J. (2015). DNA methylation in bacteria: from the methyl group to the methylome. Curr Opin Microbiol 25:9–16.
- Sanchez-Vizuete P, Le Coq D, Bridier A, et al. (2015). Identification of ypqP as a new Bacillus subtilis biofilm determinant that mediates the protection of Staphylococcus aureus against antimicrobial agents in mixed-species communities. Appl Environ Microbiol 81:109–18.
- Sandberg ME, Schellmann D, Brunhofer G, et al. (2009). Pros and cons of using resazurin staining for quantification of viable Staphylococcus aureus biofilms in a screening assay. J Microbiol Methods 78:104–6.
- Sawant SN, Selvaraj V, Prabhawathi V, Doble M. (2013). Antibiofilm properties of silver and gold incorporated PU, PCLm, PC and PMMA nanocomposites under two shear conditions. PLoS One 8:e63311. doi: 10.1371/journal.pone.0063311.
- Scherr TD, Roux CM, Hanke ML, et al. (2013). Global transcriptome analysis of Staphylococcus aureus biofilms in response to innate immune cells. Infect Immun 81:4363–76.
- Schneider CA, Rasband WS, Eliceiri KW. (2012). NIH image to ImageJ: 25 years of image analysis. Nat Methods 9:671–5.
- Schultz MP, Swain GW. (1999). The effect of biofilms on turbulent boundary layers. J Fluid Eng-T Asme 121:44–51.
- Sharma S, Cross SE, Hsueh C, et al. (2010). Nanocharacterization in dentistry. Int J Mol Sci 11:2523–45.
- Sim STV, Suwarno SR, Chong TH, et al. (2013). Monitoring membrane biofouling via ultrasonic time-domain reflectometry enhanced by silica dosing. J Membrane Sci 428:24–37.
- Sjollema J, Busscher HJ, Weerkamp AH. (1989). Experimental approaches for studying adhesion of microorganisms to solid substrata: applications and mass transport. J Microbiol Meth 9:79–90.
- Skolimowski M, Nielsen MW, Emneus J, et al. (2010). Microfluidic dissolved oxygen gradient generator biochip as a useful tool in bacterial biofilm studies. Lab Chip 10:2162–9.
- Skolimowski M, Weiss Nielsen M, Abeille F, et al. (2012). Modular microfluidic system as a model of cystic fibrosis airways. Biomicrofluidics 6:34109. doi: 10.1063/1.4742911.
- Skovager A, Whitehead K, Siegumfeldt H, et al. (2012). Influence of flow direction and flow rate on the initial adhesion of seven Listeria monocytogenes strains to fine polished stainless steel. Int J Food Microbiol 157:174–81.
- Sousa AM, Pereira MO, Azevedo NF, Lourenço A. (2014). An harmonised vocabulary for communicating and interchanging biofilms experimental results. J Integr Bioinform 11:249.
- Speziale P, Pietrocola G, Foster TJ, Geoghegan JA. (2014). Protein-based biofilm matrices in staphylococci. Front Cell Infect Microbiol 4:171. doi: 10.3389/fcimb.2014.00171.
- Stepanović S, Vuković D, Dakić I, et al. (2000). A modified microtiter-plate test for quantification of staphylococcal biofilm formation. J Microbiol Meth 40:175–9.
- Stepanovic S, Vukovic D, Hola V, et al. (2007). Quantification of biofilm in microtiter plates: overview of testing conditions and practical recommendations for assessment of biofilm production by staphylococci. APMIS 115:891–9.
- Sternberg C, Christensen BB, Johansen T, et al. (1999). Distribution of bacterial growth activity in flow-chamber biofilms. Appl Environ Microbiol 65:4108–17.
- Stewart PS, Franklin MJ. (2008). Physiological heterogeneity in biofilms. Nat Rev Microbiol 6:199–210.
- Stewart PS, Rayner J, Roe F, Rees WM. (2001). Biofilm penetration and disinfection efficacy of alkaline hypochlorite and chlorosulfamates. J Appl Microbiol 91:525–32.
- Stingu CS, Rodloff AC, Jentsch H, et al. (2008). Rapid identification of oral anaerobic bacteria cultivated from subgingival biofilm by MALDI-TOF-MS. Oral Microbiol Immunol 23:372–6.
- Stipetic LH, Dalby MJ, Davies RL, et al. (2016). A novel metabolomic approach used for the comparison of Staphylococcus aureus planktonic cells and biofilm samples. Metabolomics 12:75. doi: 10.1007/s11306-016-1002-0.
- Stoecker K, Dorninger C, Daims H, Wagner M. (2010). Double labeling of oligonucleotide probes for fluorescence in situ hybridization (DOPE-FISH) improves signal intensity and increases rRNA accessibility. Appl Environ Microbiol 76:922–6.
- Stoodley P, Dodds I, Boyle JD, Lappin-Scott HM. (1998). Influence of hydrodynamics and nutrients on biofilm structure. J Appl Microbiol 85:19S–28S.
- Storey MV, Ashbolt NJ. (2002). A comparison of methods and models for the analysis of water distribution pipe biofilms. In: Wilderer P, Amy G, Arvin E, et al., eds. 2nd World Water Congress: water distribution and water services management. London, UK: IWA Publishing, 73–80.
- Strauber H, Muller S. (2010). Viability states of bacteria-specific mechanisms of selected probes. Cytometry A 77:623–34.
- Sun L, Liao K, Wang D. (2015). Effects of magnolol and honokiol on adhesion, yeast-hyphal transition, and formation of biofilm by Candida albicans. PLoS One 10:e0117695. doi: 10.1371/journal.pone.0117695.
- Sutherland IW. (2001). Exopolysaccharides in biofilms, flocs and related structures. Water Sci Technol 43:77–86.
- Szlavik J, Paiva DS, Mork N, et al. (2012). Initial adhesion of Listeria monocytogenes to solid surfaces under liquid flow. Int J Food Microbiol 152:181–8.
- Tapia JM, Munoz JA, Gonzalez F, et al. (2009). Extraction of extracellular polymeric substances from the acidophilic bacterium Acidiphilium 3.2sup(5). Water Sci Technol 59:1959–67.
- Tavernier S, Coenye T. (2015). Quantification of Pseudomonas aeruginosa in multispecies biofilms using PMA-qPCR. PeerJ 3:e787. doi: 10.7717/peerj.787.
- Taylor MJ, Bentham RH, Ross KE. (2014). Limitations of using propidium monoazide with qPCR to discriminate between live and dead Legionella in biofilm samples. Microbiol Insights 7:15–24.
- Teodosio J, Simoes M, Mergulhão F. (2013a). Platforms for in-vitro biofilm studies. In: Simoes M, Mergulhão F, eds. Biofilms in bioengineering. New York: Nova Science Publishers.
- Teodosio JS, Silva FC, Moreira JM, et al. (2013b). Flow cells as quasi-ideal systems for biofouling simulation of industrial piping systems. Biofouling 29:953–66.
- Teodosio JS, Simoes M, Melo LF, Mergulhao FJ. (2011). Flow cell hydrodynamics and their effects on E. coli biofilm formation under different nutrient conditions and turbulent flow. Biofouling 27:1–11.
- Teodosio JS, Simoes M, Mergulhao FJ. (2012). The influence of nonconjugative Escherichia coli plasmids on biofilm formation and resistance. J Appl Microbiol 113:373–82.
- Terry J, Neethirajan S. (2014). A novel microfluidic wound model for testing antimicrobial agents against Staphylococcus pseudintermedius biofilms. J Nanobiotechnol 12:1. doi: 10.1186/1477-3155-12-1.
- Timp W, Matsudaira P. (2008). Electron microscopy of hydrated samples. Meth Cell Biol 89:391–407.
- Tolker-Nielsen T, Sternberg C. (2011). Growing and analyzing biofilms in flow chambers. Curr Protoc Microbiol Chapter 1:Unit 1B.2. doi: 10.1002/9780471729259.mc01b02s21.
- Tolker-Nielsen T, Sternberg C. (2014). Methods for studying biofilm formation: flow cells and confocal laser scanning microscopy. Methods Mol Biol 1149:615–29.
- Tote K, Vanden Berghe D, Levecque S, et al. (2009). Evaluation of hydrogen peroxide-based disinfectants in a new resazurin microplate method for rapid efficacy testing of biocides. J Appl Microbiol 107:606–15.
- Toth L, Csomor P, Sziklai I, Karosi T. (2011). Biofilm detection in chronic rhinosinusitis by combined application of hematoxylin–eosin and gram staining. Eur Arch Otorhinolaryngol 268:1455–62.
- Trulear MG, Characklis WG. (1982). Dynamics of biofilm processes. J Water Pollut Con F 54:1288–301.
- Turonova H, Neu TR, Ulbrich P, et al. (2016). The biofilm matrix of Campylobacter jejuni determined by fluorescence lectin-binding analysis. Biofouling 32:597–608.
- Valm AM, Mark Welch JL, Rieken CW, et al. (2011). Systems-level analysis of microbial community organization through combinatorial labeling and spectral imaging. Proc Natl Acad Sci USA 108:4152–7.
- Van Den Driessche F, Rigole P, Brackman G, Coenye T. (2014). Optimization of resazurin-based viability staining for quantification of microbial biofilms. J Microbiol Methods 98:31–4.
- Van Laar TA, Chen T, You T, Leung KP. (2015). Sublethal concentrations of carbapenems alter cell morphology and genomic expression of Klebsiella pneumoniae biofilms. Antimicrob Agents Chemother 59:1707–17.
- Verma V, Harjai K, Chhibber S. (2010). Structural changes induced by a lytic bacteriophage make ciprofloxacin effective against older biofilm of Klebsiella pneumoniae. Biofouling 26:729–37.
- Vester B, Wengel J. (2004). LNA (locked nucleic acid): high-affinity targeting of complementary RNA and DNA. Biochemistry 43:13233–41.
- Villacorte LO, Ekowati Y, Neu TR, et al. (2015). Characterisation of algal organic matter produced by bloom-forming marine and freshwater algae. Water Res 73:216–30.
- Vogel C, Marcotte EM. (2012). Insights into the regulation of protein abundance from proteomic and transcriptomic analyses. Nat Rev Genet 13:227–32.
- Vorregaard M. (2008). Comstat2 – a modern 3D image analysis environment for biofilms. Master of Science [Master thesis]. Technical University of Denmark.
- Wallace PK, Arey B, Mahaffee WF. (2011). Subsurface examination of a foliar biofilm using scanning electron- and focused-ion-beam microscopy. Micron 42:579–85.
- Wang S, Liu X, Liu H, et al. (2015). The exopolysaccharide Psl-eDNA interaction enables the formation of a biofilm skeleton in Pseudomonas aeruginosa. Environ Microbiol Rep 7:330–40.
- Waring MJ. (1965). Complex formation between ethidium bromide and nucleic acids. J Mol Biol 13:269–82.
- Watrous JD, Dorrestein PC. (2011). Imaging mass spectrometry in microbiology. Nat Rev Microbiol 9:683–94.
- Webb JS, Thompson LS, James S, et al. (2003). Cell death in Pseudomonas aeruginosa biofilm development. J Bacteriol 185:4585–92.
- Weissbrodt DG, Neu TR, Kuhlicke U, et al. (2013). Assessment of bacterial and structural dynamics in aerobic granular biofilms. Front Microbiol 4:175. doi: 10.3389/fmicb.2013.00175.
- Willcock L, Gilbert P, Holah J, et al. (2000). A new technique for the performance evaluation of clean-in-place disinfection of biofilms. J Ind Microbiol Biot 25:235–41.
- Winther B, Gross BC, Hendley JO, Early SV. (2009). Location of bacterial biofilm in the mucus overlying the adenoid by light microscopy. Arch Otolaryngol Head Neck Surg 135:1239–45.
- Wirtanen G, Mattila-Sandholm T. (1993). Epifluorescence image-analysis and cultivation of foodborne biofilm bacteria grown on stainless-steel surfaces. J Food Protect 56:678–83.
- Wolfaardt GM, Lawrence JR, Robarts RD, et al. (1994). Multicellular organization in a degradative biofilm community. Appl Environ Microbiol 60:434–46.
- Yasunaga A, Yoshida A, Morikawa K, et al. (2013). Monitoring the prevalence of viable and dead cariogenic bacteria in oral specimens and in vitro biofilms by qPCR combined with propidium monoazide. BMC Microbiol 13:157. doi: 10.1186/1471-2180-13-157.
- Yawata Y, Toda K, Setoyama E, et al. (2010). Monitoring biofilm development in a microfluidic device using modified confocal reflection microscopy. J Biosci Bioeng 110:377–80.
- You Y, Moreira BG, Behlke MA, Owczarzy R. (2006). Design of LNA probes that improve mismatch discrimination. Nucleic Acids Res 34:e60. doi: 10.1093/nar/gkl175.
- Zeng G, Muller T, Meyer RL. (2014). Single-cell force spectroscopy of bacteria enabled by naturally derived proteins. Langmuir 30:4019–25.
- Zeng G, Vad BS, Dueholm MS, et al. (2015). Functional bacterial amyloid increases Pseudomonas biofilm hydrophobicity and stiffness. Front Microbiol 6:1099. doi: 10.3389/fmicb.2015.01099.
- Zhang RY, Neu TR, Bellenberg S, et al. (2015a). Use of lectins to in situ visualize glycoconjugates of extracellular polymeric substances in acidophilic archaeal biofilms. Microb Biotechnol 8:448–61.
- Zhang W, Sun J, Ding W, et al. (2015b). Extracellular matrix-associated proteins form an integral and dynamic system during Pseudomonas aeruginosa biofilm development. Front Cell Infect Microbiol 5:40. doi: 10.3389/fcimb.2015.00040.
- Zhang Z, Han D, Zhang S, et al. (2009). Biofilms and mucosal healing in postsurgical patients with chronic rhinosinusitis. Am J Rhinol Allergy 23:506–11.
- Zhao B, Van Der Mei HC, Subbiahdoss G, et al. (2014). Soft tissue integration versus early biofilm formation on different dental implant materials. Dent Mater 30:716–27.
- Zhu H, Isikman SO, Mudanyali O, et al. (2013). Optical imaging techniques for point-of-care diagnostics. Lab Chip 13:51–67.
- Zielinski JS, Zielinska AK, Bouaynaya N, et al. (2011). Automated biofilm region recognition and morphology quantification from confocal laser scanning microscopy imaging. Biomedical Sciences and Engineering Conference (BSEC); 2011 Mar 15–17, 1–4.
- Zippel B, Neu TR. (2011). Characterization of glycoconjugates of extracellular polymeric substances in tufa-associated biofilms by using fluorescence lectin-binding analysis. Appl Environ Microbiol 77:505–16.
- Zlatanova J, Lindsay SM, Leuba SH. (2001). Single molecule force spectroscopy in biology using the atomic force microscope. Prog Biophys Mol Biol 74:37–61.