
Abstract
The prevalence of asthma in the United States (U.S.) has doubled since 1970, coinciding with the increased use of gypsum-drywall in home construction. Mold growth is promoted when gypsum-drywall gets wet. Since asthma is linked to mold exposures, accurate quantification of mold contamination in homes is critical. Therefore, qPCR assays were created and then used to quantify 36 common molds in dust collected in representative U.S. homes during the first American Health Homes Survey (AHHS). The concentrations of the 36 molds, i.e. 26 water-damage molds (Group 1) and 10 outside molds (Group 2), were used in the formulation of a home’s Environmental Relative Moldiness Index (ERMI) value. The ERMI values for each of the AHHS homes were assembled from lowest to highest to create the ERMI scale, which ranges from −10 to 20. Subsequent epidemiological studies consistently demonstrated that higher ERMI values were linked to asthma development, reduced lung capacity or occupant asthma. Reducing mold exposures by remediation or with HEPA filtration resulted in a reduced prevalence of asthma and improvements in respiratory health. The ERMI scale has also been successfully applied in evaluating mold concentrations in schools and large buildings and appears to have applications outside the U.S.
Introduction
Since 1970, the prevalence of asthma has progressively increased in the U.S. In 1970, about 3% of the U.S. population had asthma (Evans et al. Citation1987) but in 1996, the estimate was 5.5% (Mannino et al. Citation2002). The U.S. Centers for Disease Control and Prevention (CDC) estimated that 7.7% of the U.S. population had current asthma in 2021 (CDC, Citation2021). This increase in the prevalence cannot be accounted for by genetic changes in the whole population in such a short time. Rather, the answer to the increase in prevalence of asthma must lie in the changes in the environment that causes asthma.
In 2004, The Institute of Medicine’s expert committee concluded that exposure to moldy, damp indoor environments was associated with respiratory tract symptoms (IOM, 2004). A 2007 meta-analysis of studies associating mold contamination with adverse health effects (Fisk et al. Citation2007), it was demonstrated that building dampness and mold were associated with approximately a 30% to 50% increase in a variety of respiratory and asthma-related health outcomes. Since mold exposure has been linked to respiratory health, it is important to be able to accurately quantify the risk.
Mold exposure was assessed in a mold investigation by obtaining a short air sample (5 min.) inside a home. The sample was then examined using microscopy and the mold spores enumerated. Alternatively, the sample was cultured on growth media and the resulting colonies identified and counted. However, the U.S. Environmental Protection Agency (U.S. EPA) did not recommend using air samples for mold analysis because of the lack of standardization in the sampling procedure, the analysis, or interpretation of the results (U.S. EPA, 2002). Johnson et al. (Citation2008) reached a similar conclusion by noting that “professional judgment in the evaluation of airborne mold sampling data leads to inconsistent conclusions regarding the presence of an indoor mold source.” A review of the air sampling and analysis process found that these practices were inadequate to quantify mold contamination (Vesper Citation2011). The limitations of the mold sampling and analysis were described in the U.S. Department of Housing and Urban Development (HUD) Report to Congress (HUD, Citation2005) which stated:
“Standard approaches to mold testing include: (1) viable count methods that involve collecting spores in air and dust samples or through direct contact with the mold, then culturing the spores on nutrient media and counting the number of colonies that grow and classifying them by species: and (2) spore counts that involve counting the number of mold spores in air or dust samples and, if possible, identifying individual species or groups. These techniques are time consuming and require considerable technical expertise. Another problem is the difficulty in interpreting test results, since mold spores are ubiquitous and there is no consensus among experts regarding what constitutes acceptable indoor spore concentrations in indoor air or house dust, or which species are most problematic.”
“Yet even now there are situations where reliable test methods are needed, including the identification of hidden mold problems and …to better define mold-related hazards based on significant association with adverse health effects in residents.”
Methods
The development of qPCR assays for common molds
Because of the noted inadequacies of the methods used to estimate mold contamination, U.S. EPA researchers undertook a research program to sequence the nuclear ribosomal RNA operon, internal transcribed spacer (ITS1 or ITS2) regions of common indoor molds. The Type Culture for each mold was obtained from leading Culture Collections. The Type Culture is the isolate on which the genus and species name is assigned at the time of its deposit in recognized Culture Collections. Therefore, no matter how future taxonomists change a mold’s genus and species name, the Type Culture genus and species name is used for our nomenclature.
In a few cases, e.g. Stachybotrys chartarum, the Type Culture has been lost. In those cases, multiple culture collection deposited isolates of Stachybotrys chartarum were obtained, and a consensus sequence established. As a result, we developed a quantitative PCR (qPCR) assay for S. chartarum (Haugland et al. Citation1999) and a reproducible method of extracting DNA for qPCR mold analysis (Haugland et al. Citation2002).
Next, we examined the scientific literature to determine which molds had been reported in indoor environments. Then qPCR assays for more than 100 common indoor molds were created based on our sequencing data (Haugland and Vesper Citation2002) and the assays tested for their sensitivity and specificity (Haugland et al. Citation2004). From the more than 100 qPCR assays, 82 mold species were selected for our initial studies of mold contamination in homes.
Creation of the environmental relative moldiness index (ERMI)
To begin our studies of mold-contamination quantification, Meklin et al. (Citation2004) collected settled dust in homes classified as “moldy homes” (MH) or reference (i.e. “non-moldy”) homes (RH). Then qPCR assays were used to quantify the 82 molds selected for our studies. We found that about 70% of the 82 molds were never or only rarely detected. We then compared the populations of six abundant species (Aspergillus ochraceus, A. penicillioides, A. unguis, A. versicolor, Eurotium group, and Cladosporium sphaerospermum) in MH and RH homes. For these 6 molds, the ratios of the geometric mean in MH compared to the geometric mean in RH homes were >1. These results suggested that it may be possible to evaluate whether a home has an abnormal mold condition by quantifying a limited number of mold species in a dust sample (Meklin et al. Citation2004).
Once the qPCR process of identifying and quantifying common indoor molds had been developed, U.S. EPA and HUD researchers set out to standardize mold sampling and analysis. Realizing the inadequacies of short air-samples, HUD, and its contractor, QuanTech, developed a dust-sampling protocol based on the collection of floor-dust from the living room and bedroom at very specific locations in those rooms and for a specified time limit in each room (Vesper et al. Citation2007c).
In the first American Healthy Homes Survey (AHHS), QuanTech investigators collected the standard dust-sample from homes (n = 1,096) selected to be representative of the housing stock of the continental U.S. (Vesper et al. Citation2007c). The AHHS samples were processed for qPCR analysis and the 82 indoor-mold species were quantified. Next, we determined which of the 82 molds had a national distribution. We defined a mold with a national distribution as one with a geometric mean of at least one spore per mg dust for all 1,096 AHHS homes. By this definition, 36 of the 82 molds had a national distribution.
Of the 36 nationally distributed molds, five were well-known water-damage molds (which we refer to as “Group 1 molds”) – Stachybotrys chartarum, Aspergillus versicolor, A. fumigatus, Trichoderma viride, and Chaetomium globosum. Another five were well-known outdoor molds (“Group 2 molds”) – Cladosporium cladosporioides types 1 and 2, C. herbarum, Alternaria alternata, and Epicoccum nigrum. To associate the remaining 26 mold species with either Group 1 vs. Group 2, we first determined the geometric means (GM) of the species known to be in Groups 1 and 2. The ratio of these 2 GMs (“Base GM Ratio”) was then computed as GM (Group 1)/GM (Group 2). Then for each other species, GM was calculated separately for moldy and for reference homes. If the resulting ratio of GM (moldy) to GM (reference) was greater than the Base GM Ratio, that species was categorized as Group 1. Otherwise, it was categorized as Group 2. The final set of molds with a national distribution was 26 Group 1 molds associated with water-damage in a home and 10 Group 2 molds, which originate predominately from the outdoor environment (). The concentration of each of the 36 molds is expressed as the number of spores per mg of dust.
Table 1. The 36 environmental relative moldiness index (ERMI) molds divided into group 1 and group 2 molds.
Next, we sought a way to place the concentration data for the 36 molds in each of the AHHS samples into the context of relative mold contamination, i.e. how does the mold contamination in a particular AHHS home compare to the other AHHS homes. After exploring many options, we found that converting the concentrations of each mold to its log value (base 10) accounted for each mold’s relative occurrence in a dust sample. (To enable counting non-detected species, we added 1 to all spore counts.)
Group 2 molds in aggregate reflect an influence of the outside environment on a home. The influence is variable from home to home depending on factors such as pets that go outside, whether windows are opened, and frequency of cleaning. Therefore, the concentration of each of the outdoor molds was converted into a single number by adding their logs to arrive at the “sum of the logs” for the Group 2 molds. Then we used this same approach to arrive at the “sum of the logs” of the Group 1 molds for each sample. By subtracting the sum of the logs of the Group 2 molds from the sum of the logs of the Group 1 molds, we adjusted for the different ways that homes are used (Vesper Citation2011). The result of this subtraction is a single number called the Environmental Relative Moldiness Index (ERMI) value for a home.
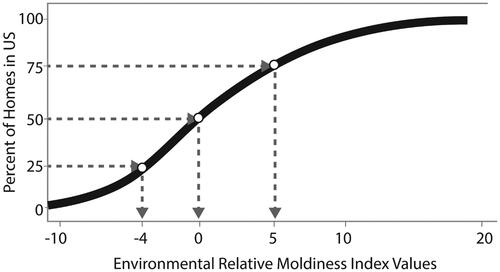
The ERMI value for each of the 1,096 AHHS homes was calculated and then assembled on a scale from lowest ERMI to highest ERMI value to create the ERMI scale (Vesper et al. Citation2007a). This scale ranges from a low of about −10 to 20 with a few homes even higher than 20 (). Notice, there is no defining unit for an ERMI value; it is just a number. The interpretation of the ERMI value of a home comes from its relative position on the scale. The closer an ERMI value is to 20, the higher is the relative mold contamination compared to the U.S. housing stock. Therefore, a newly sampled home’s dust can be analyzed, and its ERMI value placed on the ERMI scale. For the sake of simplification, the ERMI scale can be divided into quartiles. For example, the 25% of homes in the highest ERMI quartile have ERMI values >5 ().
Figure 1. The Environmental Relative Moldiness Index scale.
To ensure that the ERMI was applicable to housing across the continental U.S., we needed to establish that the 36 ERMI molds occurred randomly across the country. As part of the first AHHS, each of the 36 species’ geographical distribution patterns was examined individually, followed by partitioning analysis to identify any spatially meaningful patterns. For mapping purposes, each of the 36 mold populations were divided into disjointed clusters based on their standardized concentrations, and first principal component scores were computed. The partitioning analyses failed to uncover any valid partitioning that yielded compact, well-separated partitions with systematic spatial distributions, either on global or local criteria. Therefore, the 36 molds and ERMI values themselves were found to be heterogeneously distributed across the U.S. (Vesper et al. Citation2011).
Results
Relationship between ERMI values and asthma
Asthma is the respiratory disease commonly associated with mold exposure (Mendell et al. Citation2018). Asthma is also the most common chronic disease of children in the U.S. (Zahran et al. Citation2018). The medical costs associated with asthma are over $80 billion each year (American Thoracic Society Citation2018). Therefore, the relationship between home ERMI values and asthma has been the focus of our epidemiological research.
Even before the ERMI had been finalized, a study showed that two Group 1 molds, Scopulariopsis brevicaulis and Trichoderma viride, had significantly (p < 0.05) higher concentrations in asthmatics’ homes compared with control homes (Vesper et al. Citation2006). Once the final ERMI was established with results from the first AHHS (Vesper et al. Citation2007a), we were able to expand our studies of the relationship between ERMI and asthma/respiratory health. Most of the focus was on children, but additional studies included adults as well.
In an early study after creating the ERMI scale, dust from the homes of children in North Carolina with severe asthma were analyzed (Vesper et al. Citation2007b). The average ERMI value in these homes was 16.6, therefore in the highest quartile on the ERMI scale. In a study in Detroit, children were grouped as non-asthmatic (n = 83), moderately asthmatic (n = 28) and severely asthmatic (n = 32) based on prescription medication usage for their asthma management (none, occasional, and daily, respectively) (Vesper et al. Citation2008). The children with severe asthma were found to be living in homes whose mean ERMI value was significantly greater than the mean ERMI value of the other children’s homes.
As part of the Cincinnati Childhood Allergy and Air Pollution Study (CCAAPS) prospective study of asthma development, dust was collected in infants’ homes and analyzed using the ERMI metric (Reponen et al. Citation2011). When these infants reached the age of seven, 31 of 176 children (18%) were diagnosed with asthma. Infants living in a high (≥5.2) ERMI value homes had more than twice the risk of developing asthma than those in low (<5.2) ERMI value homes. In these homes with high ERMI values, three specific Group 1 mold species, Aspergillus ochraceus, Aspergillus unguis, and Penicillium variabile, were significantly associated with asthma development (Reponen et al. Citation2012).
In 2013, children with asthma in Boston (n = 76), Kansas City (n = 60), and San Diego (n = 93) were found to be living in homes with significantly higher ERMI values than were found in homes randomly selected from the same geographic areas during the first AHHS. The average ERMI value in the homes with an asthmatic child was 8.73, i.e. in the highest ERMI scale quartile, compared to 3.87 for the AHHS homes (Vesper et al. Citation2013a).
ERMI values were determined for homes in the “Head-off Environmental Asthma in Louisiana” (HEAL) study and the children were tested by spirometry (Vesper et al. Citation2013b). The average ERMI value in the HEAL study homes was 7.3, i.e. in the top quartile on the ERMI scale. In homes with ERMI values between 2.5 and 15, there was a significant inverse correlation with the child’s lung function, as measured by forced expiratory volume in 1 s as a percentage of predicted (FEV1%), and the ERMI value. The higher the ERMI value, the lower the FEV1% test value of the child’s respiratory capacity.
Although childhood asthma has been the major focus of our ERMI studies, we have also examined the relationship between asthma/respiratory health and ERMI values in the homes of adults. For example, the ERMI values in homes (n = 139) of adults with asthma and/or rhinitis in northern California were compared to those from dust collected in homes from the same geographic region in the first AHHS. The median ERMI value in homes of adult with airway disease was 6.0, which was significantly greater than median ERMI value of 2.0 in the randomly selected homes from the same region (Blanc et al. Citation2013).
In two low-income, flood-prone communities in Atlanta, Georgia, a logistic regression model (controlling for indoor smoking among participants residing at their current residence for two years or less) showed a significant positive association between asthma and the home’s ERMI value (Eiffert et al. Citation2016). Similarly, the relationship between respiratory health and home ERMI values was evaluated in two immigrant Hispanic communities, Mecca and Coachella City, in Coachella, CA (Sinclair et al. Citation2018). About 11% of the adults and 17% of the children met the study’s definition for having asthma/respiratory illness. The average ERMI values in the housing of the cities of Mecca and Coachella City, 10.3 and 6.0, respectively, are in the top quartile of the ERMI scale. Together, these homes had an average ERMI value of 9.0 and the average prevalence of occupant asthma was 12.8%. Mold contamination, as described by ERMI values, in the housing available to these immigrants and the prevalence of asthma in these communities was greater than these averages for the rest of the U.S.
In a related study, ERMI values and health in the public housing for the Hispanic Community of Sun Valley Colorado were compared to other Denver Colorado residents (Vesper et al. Citation2023). The average ERMI value was 5.25 in Sun Valley homes compared to −1.25 for the other Denver homes. Based on insurance claim data (Medicare, Medicaid, etc.) for the previous five years, acute upper respiratory infections, chronic lower respiratory diseases and asthma were all significantly more likely for Sun Valley than other Denver residents.
In a review article, the relationship between ERMI values and occupant asthma was analyzed using receiver operating characteristic (ROC) curve and area under the curve (AUC) statistical analysis (Vesper and Wymer Citation2016). This is the same statistical analysis used to evaluate the accuracy of a medical diagnostic test (Mallett et al. Citation2012). This statistical analysis produced an AUC value of 0.69, which places the test accuracy in the “fair to good” range (Simundić Citation2006). The results from these studies provide a reasonable assurance of the utility of the ERMI scale for asthma- and mold-related health studies.
Modifying mold exposures and improvements in respiratory health
In several studies, we have evaluated the application of methods for modifying or reducing mold exposures and the impact on respiratory health. For example, a study of targeted remediation of mold and the health response for children with asthma was undertaken in Cleveland, OH (Kercsmar et al. Citation2006). For children with asthma who live in homes with a documented mold problem, remediation aimed at the moisture sources, when combined with a medical/behavioral intervention, significantly reduced symptom days and health care use (Kercsmar et al. Citation2006).
When it is not possible to remediate a moldy environment, high-efficiency particulate (HEPA) filtration can reduce particulates, including mold spores. Cox et al. (Citation2018) demonstrated that placing HEPA filtration units in the bedrooms of children with asthma can reduce particulates. As a results, the average lung function of the children with asthma was significantly improved (Isiugo et al. Citation2019).
Therefore, we examined the possible improvement of lung function if HEPA units were placed in the classrooms of students with asthma. In the School Inner-City Asthma Intervention Study 2 (SICAS 2), HEPA interventions were used to reduce particulate exposures in classrooms of students with asthma (Vesper et al. Citation2023). Prospectively, the students were randomly divided into HEPA- or SHAM-(same unit without HEPA filter) treatment classrooms. Mold contamination in the students’ pre-intervention classrooms and in their homes, specifically the student’s bedroom, were measured using the ERMI metric.
At the beginning of the school year, each student’s lung capacity (FEV1% value) was measured. For those students with a higher Group 1 mold level in their pre-intervention classroom than their home (n = 94), the initial FEV1% test results for those students were significantly (p < 0.05) inversely correlated with the Group 1 level in their classrooms. The higher the sum of the logs of the Group 1 molds in the classroom, the lower was the FEV1% test results.
At the end of the school year, the impacts of the HEPA- and SHAM-treatments were compared. If the level of Group 1 molds had been greater in the student’s bedroom than classroom at the beginning of the school year, then the HEPA intervention in the classroom did not improve the student’s FEV1% test results measured at the end of the school year. However, for those students with greater Group 1 values in their classrooms than homes at the beginning of the school year, their average FEV1% test result was found to have significantly increased by an average of 4.22% in HEPA-treated classrooms compared to students in the Sham-treated classrooms at the end of the school year (Vesper et al. Citation2023). For these students, the average Group 1 and ERMI values had been significantly lowered in their classrooms at the end of the school year compared to the beginning of the school year.
Since exposures of infants to high ERMI homes was predictive of the development of asthma at age 7 (Reponen et al. Citation2011), it appeared that mold exposures during infancy may be critical for the development of asthma. To test this hypothesis, we performed a retrospective study of the prevalence of asthma in a community before and after remediation of their homes.
From 2010 to 2012, the approximately 800 Faye Apartments in Cincinnati, Ohio, were renovated (with HUD support) to green-building standards and renamed the Villages of Roll Hill. To determine if the prevalence of asthma was reduced for those infants born into the community after the renovations were completed, Ohio Medicaid data were accessed. The pre-renovation prevalence of asthma for 7-year-olds in the community was about 12% but for those infants born after the renovations were completed, the prevalence of asthma for 7-year-olds was reduced to about 6% (Beck et al. Citation2023). Although many exposures were reduced by the renovations, e.g. the averge ERMI value was reduced from 6 to 0, this study suggests that, to reduce the prevalence of asthma, infants should not be exposed to deteriorated, substandard housing, including homes with high ERMI values.
Increased use of gypsum drywall may have led to the increased prevalence of asthma
If there is a link between mold exposures, as measured with the ERMI, and asthma; then what had changed to promote mold growth in homes resulting in the increase in the prevalence of asthma since 1970? Beginning in 1940, gypsum drywall began replacing plaster and lathe materials in the home construction industry. By about 1976, nearly all homes constructed in the U.S. utilized gypsum drywall instead of plaster. Unlike plaster, gypsum drywall with its paper coating is highly susceptible to mold growth when it gets wet. Did this change to the use of gypsum drywall in home construction increase the likelihood of greater mold exposures years later?
We addressed this question using AHHS data for each home’s age and its ERMI value. For each AHHS home, the year it was built was investigated. (Unfortunately, in many cases the year a home was built could not be discovered and these homes were eliminated from the study.) Then, the ERMI values for these homes were assessed to determine which had been water damaged. We defined homes with ERMI values >5 (n = 126) as water damaged. These water-damaged homes were divided into two groups; those built in 1976 or before, i.e. older homes (n = 61) and those built in 1977 or later, i.e. the newer homes (n = 65) (Vesper et al. Citation2016b).
We found that newer water-damaged homes had significantly (p = 0.002) higher mean ERMI values than older water-damaged homes, 11.18 versus 8.86 (Vesper et al. Citation2016b). The water-damaged associated Group 1 molds Aspergillus flavus, A. fumigatus, A. ochraceus, Cladosporium sphaerospermum and Trichoderma viride were found in significantly higher concentrations in newer compared to older high-ERMI homes. These Group 1 molds were in greater populations in water-damaged homes that were most likely to have been built with gypsum drywall, i.e. built in 1977 or later. We suggest that the progressive increase in the use of gypsum drywall in home construction, resulted in the increased exposure to water-damage associated molds. This increase in mold exposures may be one reason for the progressive increase in the prevalence of asthma in the U.S. since 1970.
Repeatability and stability of the ERMI metric over time
Next, we needed to establish the repeatability and stability over-time of the ERMI metric. In the Near-Road Exposures and Effects of Urban Air Pollutants Study (NEXUS) in Detroit, MI, floor dust samples were collected 1 to 7 months apart in participants’ homes. The ERMI values for samples collected from the same home were found to be consistent and without systematic bias (Kamal et al. Citation2014).
In the Cincinnati Childhood Allergy and Air Pollution Study (CCAAPS), the repeatability of the ERMI measurement for the same home was evaluated. Quality control repeat sampling was conducted in 5% of randomly selected homes within 3 months of the initial dust sampling. Repeatability was determined by calculating the interclass correlation coefficient (ICC) between the initial ERMI values and the repeated quality-control samples’ ERMI values. The ICC value was calculated as the ratio of intra-home to total variability of ERMI values. The ICC value was 0.61, which indicates moderate-to-high repeatability (Reponen et al. Citation2012).
The stability of the ERMI metric over time was determined by comparing the ERMI values for homes sampled in the first AHHS and sampled again in those same homes in the second AHHS, 15 years later (Vesper et al. Citation2021). The 36 ERMI molds were analyzed in the second AHHS exactly as in the first AHHS. For the 36-ERMI molds, the rates of detection, average concentrations, and geometric means were in significant concordance (p < 0.001) between the two Surveys, indicating that the ERMI methodology was stable over time.
Comparison of the ERMI to other assessments of a mold contamination
In 2007, ASTM International promulgated the standard D 7297 “Practice for Evaluating Residential Indoor Air Quality Concerns” (ASTM International Citation2007). The first phase of this Standard is based on a “walk-through” examination of the home. A “walk-through” examination had also been promulgated in the 2006 ASTM standard E 2418 “Guide for Readily Observable Mold and Conditions Conducive to Mold in Commercial Buildings: Baseline Survey Protocol” (ASTM International Citation2006). The use of a “walk-through” and/or questioning of the occupants about water and mold are frequently the initial steps in a mold investigation.
In the first AHHS, ERMI values were compared to the inspector’s “walk-through” assessment of visual or olfactory evidence of mold combined with occupant’s answers to a questionnaire about mold odors and moisture. Homes in the highest ERMI quartile agreed with visual inspection and/or occupant assessment 48% of the time but failed to detect the mold in 52% of homes in the fourth quartile of the ERMI scale (Vesper et al. Citation2009a). These homes had “hidden” from the inspector mold contamination, i.e. in walls, under appliances, etc. In about 7% of the homes in the lowest ERMI quartile homes, the inspection and occupant assessments overestimated the mold problem. This suggested that mold contamination investigations need objective standards.
In many of our studies, the ERMI value was directly compared to other assessments of mold contamination. The ERMI values were compared to traditional visual mold inspection to classify the mold condition in 271 homes of infants (Reponen et al. Citation2010). Later, the development of respiratory illness was measured for the infants living in these homes and the predictive value of each classification system was evaluated. The binary classification of homes as either moldy or non-moldy by on-site visual home inspection was not predictive of the development of respiratory illness, but the ERMI values, fit to a logistic function, were predictive of the development of respiratory illness (Vesper et al. Citation2007b).
Historically, a comparison of mold populations from indoor and outdoor air samples has been used to determine if there is mold contamination in a home, i.e. whether total mold levels were greater indoors compared to outdoors. Meklin et al. (Citation2007) did a direct comparison of air samples collected indoor and outdoor simultaneously. Of the 36 mold concentrations measured with qPCR assays in both the indoor and outdoor samples, only the concentrations of Aspergillus penicillioides, Cladosporium cladosporioides types 1 and 2 and Cladosporium herbarum were correlated in indoor and outdoor air samples. Therefore, a general comparison of total indoor mold versus total outdoor molds is not justifiable.
Although HUD developed a standard dust sampling protocol, we have found that it is sometimes difficult or impossible to obtain a standard sample using this protocol. Therefore, alternatives sampling methods, which still relied on settled dust, were tested. In the first AHHS study (Vesper et al. Citation2009b), we compared the standard dust sample to the vacuum cleaner dust. The ERMI values from the standard dust sample and vacuum dust sample in the first AHHS placed the home in the same quartile on the ERMI scale. In the NEXUS study (Kamal et al. Citation2014), vacuum bag dust ERMI values were compared to the ERMI values from the standard dust sample. Although the ERMI values for vacuum-cleaner dust samples were generally lower than the ERMI values for the standard floor-dust samples, the values were significantly correlated (r = 0.58).
In some inspection cases, a home is empty and thoroughly cleaned. Therefore, there is no floor dust to collect. In those cases, we have found that an electrostatic collection cloth, like a Swiffer™, can be used to collect dust from above floor surfaces like tops of doors or door molding, ceiling lamps, venetian blinds, etc. We have found these samples to provide comparable ERMI results to the standard dust sample (Cox et al. Citation2017; Vesper et al. Citation2021). Therefore, the ERMI metric is applicable to the many forms of settled-dust collection.
Application of the ERMI in schools and large buildings
Although studies of mold levels in housing have been the focus of our ERMI-investigations, mold problems are not limited to homes. Mold contamination in schools and other large buildings can also contribute to mold exposures. One obvious difference between homes and schools and other large buildings is that the HUD standard method of dust collection is not possible. Therefore, other settled-dust collection methods were used in these studies.
For example, settled dust samples were collected in a water-damaged school in Springfield, Massachusetts using electrostatic cloths (Vesper et al. Citation2015). For comparison, settled dust samples were collected in five Idaho schools with no evidence of water damage. The average ERMI value (15.51) in the Springfield school was significantly greater than the average ERMI value (−2.87) in the Idaho schools. Of note, ten of the twenty-six Group 1 molds were in significantly greater concentrations in the Springfield school than Idaho schools. However, the populations of Group 2 molds, which are common indoors even without water damage, were essentially the same in the Springfield and Idaho schools (Vesper et al. Citation2015). Unfortunately, we do not have a national sampling of schools to create a scale for relative comparison like we have for homes, but even the comparisons between a few schools can establish meaningful differences.
Like schools, we do not have a random national sampling of large buildings from which to create an ERMI scale for large buildings. However, we have again found the home ERMI scale to be useful for comparisons of buildings or parts of buildings. For example, a comparative study of two identical (in terms of design) four-story buildings used the ERMI to compare relative levels of mold contamination (Vesper et al. Citation2018). There were health complaints in one building, but none in the other building. The average ERMI value in the building with health complaints was 5.33 which was significantly greater than the average ERMI value, 0.55, in the non-complaint building (Vesper et al. Citation2018).
In another study of a large building, mold contamination was evaluated on levels 6 to 19 of an office building with a history of water problems and health complaints (Vesper et al. Citation2018). The water leaks were discovered and the health complaints were confined to the upper 5 stories. The average ERMI value on level 17 was 5.66 but only −0.58 on level 8. The higher ERMI values were associated with floors with occupant health complaints. Therefore, the ERMI metric appears to provide useful information about mold contamination on a relative basis for schools and other large buildings, in addition to homes.
Applications of ERMI outside the continental U.S
Although the ERMI scale is only applicable in the continental U.S., researchers in other parts of the world have tested the methodology in many other countries and U.S. territories outside the continental U.S. Quantitative (qPCR) assays were used to compare dust samples obtained from randomly selected homes in the United Kingdom and in homes in Ohio. Only 13 of the 81 species compared in these two sets of homes showed significantly different concentrations (Vesper et al. Citation2005). In Scotland, a population of nonsmoking, adults with asthma completed a questionnaire that allowed for the determination of the Asthma Control Questionnaire (ACQ) scores and St. George’s Respiratory Questionnaire (SGRQ) scores. Floor dust samples were collected in the living room and in the bedroom and ERMI values determined for each home. The FEV1% values of adults with asthma were correlated with ACQ scores, SGRQ scores and ERMI values in the homes (McSharry et al. Citation2015).
In France, Meheust et al. (Citation2012) collected dust samples from 40 dwellings and analyzed them by qPCR. The 40 dwellings were divided into those with a low (<6) or high (>8) ERMI values (n = 20 in each). The average ERMI value was 15.70 for the high ERMI compared to 2.68 for the low ERMI dwellings.
In Finland, the ERMI was significantly associated with certain observations of visible mold in Finnish homes but not with moisture damage (Täubel et al. Citation2015). Several mold species occurred more frequently and at higher levels in Finnish than in U.S. homes. This may be the result of moisture from saunas that are present in nearly every home in Finland. In addition, many Finnish families dry their clothing by hanging them indoors.
In Taiwan, the prevalence of asthma is one of the highest in Asia. In a pilot study of homes in Taiwan, the ERMI values were significantly greater in the homes of children with asthma compared to the control homes (Chen et al. Citation2015). Like the tropical island of Taiwan, the tropical island of Puerto Rico has some of the highest rates of asthma in the U.S. The island of Puerto Rico is divided into Health Regions (HR). In the northeastern HRs, the lifetime childhood asthma prevalence (LCAP) percentages are substantially higher than the southwestern HR. The average ERMI value was significantly greater in homes in the high than in low asthma prevalence Health Regions (Vesper et al. Citation2016a).
In a study of U.S. and Australian homes with matched ERMI values, we compared the populations of the 36 ERMI molds (Rossini et al. Citation2017). Most of the 36 ERMI molds were found in Australian water-damaged homes in comparable concentrations to ERMI-matched U.S. homes. The results suggest that the U.S. ERMI scale might provide reasonable estimates of mold contamination in water-damaged Australian homes (Rossini et al. Citation2017).
Conclusions
Standardized and objective methods and tools are necessary to quantify mold contamination in homes and to evaluate the asthma risk for occupants.
The HUD settled-dust sampling method, or the comparable electrostatic-dust collection method, have been standardized to provide consistency in mold investigations.
Quantitative PCR is now recognized and widely applied as an objective method for identifying and quantifying microorganism, including mold cells.
The ERMI scale provides a metric for the relative comparison of mold contamination in U.S. homes because it is based on HUD’s nationally representative survey of U.S, homes.
The ERMI values in the same home were reproducible over time.
The ERMI scale has been tested in many epidemiological studies and higher ERMI values in the homes, and other indoor environments, are linked to the increased likelihood of occupant asthma, respiratory health complaints, and/or poorer lung function for those with asthma.
The prevalence of asthma might be reduced, if infants are not exposed to substandard housing, including homes with high ERMI values.
Our epidemiological studies and the many other studies and literature reviews have made a link between asthma and mold exposures but this does not prove that mold exposures cause asthma. However, one can reasonably suggest that exposures to substandard housing should be avoided, especially for those with a family history of asthma or known atopy.
Disclaimer
The U.S. Environmental Protection Agency (EPA) through its Office of Research and Development collaborated in the research described here. It has been subjected to the Agency’s peer review and has been approved as an EPA publication. Mention of trade names or commercial products does not constitute endorsement or recommendation by the EPA for use. The findings and the conclusions in this report are those of the authors and do not necessarily represent the views of the U.S. EPA.
Disclosure statement
The author reports there are no competing interests to declare.
Additional information
Funding
References
- American Thoracic Society. 2018. Asthma costs the U.S. economy more than $80 billion per year. https://www.thoracic.org/about/newsroom/press-releases/journal/2018/asthma-costs-the-us-economy-more-than-80-billion-per-year.php.
- ASTM International. 2006. Readily observable mold and conducive to mold in commercial buildings: baseline survey process. West Conshohocken, PA: ASTM International; p. 1046–1060.
- ASTM International. 2007. Practice for evaluating residential indoor air quality concerns. West Conshohocken, PA: ASTM International; p. 1–28.
- Beck AF, Wymer L, Pinzer E, Friedman W, Ashley PJ, Vesper S. 2023. Reduced prevalence of childhood asthma after housing renovations in an under-resourced community. J Allergy Clin Immunol Glob. 2(4):1–4. doi: 10.1016/j.jacig.2023.100143.
- Blanc PB, Quinlan PJ, Katz PP, Balmes JR, Trupin L, Cisternas M, Wymer J, Vesper SJ. 2013. Higher Environmental Relative Moldiness Index values measured in homes of adults with asthma, rhinitis, or both conditions. Environ Res. 122:98–101. doi: 10.1016/j.envres.2013.01.002.
- Centers for Disease Control and Prevention (CDC). 2021. Most Recent National Asthma Data. [accessed 2022 Dec 1]. https://www.cdc.gov/asthma/most_recent_national_asthma_data.htm.
- Chen C-H, Chao HJ, Shen W-C, Chen B-Y, Lin K-T, Guo YL, Vesper S. 2015. Pilot study of mold in homes of asthmatic children in Taipei, Taiwan using the Environmental Relative Moldiness Index. Aerobiologia. 31(2):213–218. doi: 10.1007/s10453-014-9358-y.
- Cox J, Indugula R, Vesper S, Zhu Z, Jandarov R, Reponen T. 2017. Comparative assessment of indoor air sampling and dust collection methods for fungal exposure assessment using quantitative PCR. Environ Sci: Processes Impact. 19(10):1312–1319.
- Cox J, Isiugo K, Ryan P, Grinshpun S, Yermakov M, Desmond C, Jandarov R, Vesper S, Ross J, Chillrud S, et al. 2018. Effectiveness of a portable air cleaner in removing traffic-related aerosol particles. Indoor Air. 28(6):818–827. doi: 10.1111/ina.12502.
- Department of Housing and Urban Development (HUD). 2005. Controlling and preventing household mold and moisture problems, lessons learned and strategies for disseminating best practices report to congress. https://www.hud.gov/sites/documents/report040105.pdf.
- Eiffert S, Noibi Y, Vesper S, Downs J, Fulk F, Wallace J, Pearson M, Winquist A. 2016. A citizen-science study documents environmental exposures and asthma prevalence in two communities. J Environ Public Health. 2016:1962901. doi: 10.1155/2016/1962901.
- Evans R, III, Mullally DI, Wilson RW, Gergen PJ, Rosenberg HM, Grauman JS, Chevarley FM, Feinleib M. 1987. National trends in the morbidity and mortality of asthma in the U.S. Prevalence, hospitalization and death from asthma over two decades: 1965-1984. Chest. 91(6):65S–74S. doi: 10.1378/chest.91.6_Supplement.65S.
- Fisk WJ, Lei-Gomez Q, Mendell MJ. 2007. Meta-analyses of the associations of respiratory health effects with dampness and mold in homes. Indoor Air. 17(4):284–296. doi: 10.1111/j.1600-0668.2007.00475.x.
- Haugland RA, Brinkman N, Vesper SJ. 2002. Evaluation of rapid DNA extraction methods for the quantitative detection of fungal cells using real time PCR analysis. J Microbiol Methods. 50(3):319–323. doi: 10.1016/s0167-7012(02)00037-4.
- Haugland RA, Varma M, Wymer LJ, Vesper SJ. 2004. Quantitative PCR of selected Aspergillus, Penicillium and Paecilomyces species. Syst Appl Microbiol. 27(2):198–210. doi: 10.1078/072320204322881826.
- Haugland RA, Vesper SJ, Wymer LJ. 1999. Quantitative measurement of Stachybotrys chartarum conidia using real-time detection of PCR products with the TaqMan™ fluorogenic probe system. Mol Cell Probes. 13(5):329–340. doi: 10.1006/mcpr.1999.0258.
- Haugland RA, Vesper SJ. 2002. Identification and quantification of specific fungi and bacteria. U.S. Patent 6,387,652. United States Patent and Trademark Office. Washington, D.C.
- Institute of Medicine, National Academies of Science. 2004. Damp indoor spaces and health. Washington, DC: National Academies Press.
- Isiugo K, Jandarov R, Cox J, Ryan P, Newman N, Grinshpun SA, Indugula R, James C, Vesper S, Reponen T. 2019. Indoor particulate matter and lung function in children living near roadways. Sci Total Environ. 663:408–417. doi: 10.1016/j.scitotenv.2019.01.309.
- Johnson D, Thompson D, Clinkenbeard R, Redus J. 2008. Professional judgment and the interpretation of viable mold air sampling data. J Occup Environ Hyg. 5(10):656–663. doi: 10.1080/15459620802310796.
- Kamal A, Burke J, Vesper S, Batterman S, Vette A, Godwin C, Chavez-Camarena M, Norris G. 2014. Applicability of the Environmental Relative Moldiness Index for quantification of residential mold contamination in a study of air pollution and childhood asthma. J Environ Public Health. 2014:261357. doi: 10.1155/2014/261357.
- Kercsmar CM, Dearborn DG, Schluchter MD, Xue L, Kirchner HL, Sobolewski J, Greenberg SJ, Vesper SJ, Allan TM. 2006. Reduction in asthma morbidity in children as a result of home remediation aimed at moisture sources. Environ Health Perspect. 114(10):1574–1580. doi: 10.1289/ehp.8742.
- Mallett S, Halligan S, Thompson M, Collins GS, Altman DG. 2012. Interpreting diagnostic accuracy studies for patient care. BMJ. 345(jul02):e3999. doi: 10.1136/bmj.e3999.
- Mannino DM, Homa DM, Akinbami LJ, Moorman JE, Gwynn C, Redd SC. 2002. Surveillance for asthma-United States, 1980-1999. Surveillance Summaries, Morb Mortal Wkly Rep. 51(SS-1):1–13.
- McSharry C, Vesper S, Wymer L, Howieson S, Chaudhuri R, Wright GR, Thomson NC. 2015. Decreased FEV1% in asthmatic adults in Scottish homes with high Environmental Relative Moldiness Index values. Clin Exp Allergy. 45(5):902–907. doi: 10.1111/cea.12482.
- Meheust D, Gangneux J-P, Reponen T, Wymer L, Vesper S, Le Cann P. 2012. Correlation between Environmental Relative Moldiness Index (ERMI) values in French dwellings and other measures of fungal contamination. Sci Total Environ. 438:319–324. doi: 10.1016/j.scitotenv.2012.08.085.
- Meklin T, Haugland RA, Reponen T, Varma M, Lummus Z, Bernstein D, Wymer LJ, Vesper SJ. 2004. Quantitative PCR analysis of house dust can reveal abnormal mold conditions. J Environ Monit. 6(7):615–620. doi: 10.1039/b400250d.
- Meklin T, Reponen T, McKinstry C, Cho S-H, Grinshpun SA, Nevalainen A, Vepsäläinen A, Haugland RA, LeMasters G, Vesper SJ. 2007. Comparison of mold concentrations in indoor and outdoor air sampled simultaneously and quantified by MSQPCR. Sci Total Environ. 382(1):130–134. doi: 10.1016/j.scitotenv.2007.03.031.
- Mendell MJ, Macher JM, Kumagai K. 2018. Measured moisture in buildings and adverse health effects: a review. Indoor Air. 28(4):488–499. doi: 10.1111/ina.12464.
- Reponen T, Lockey J, Bernstein DI, Vesper SJ, Levin L, Khurana Hershey GK, Zheng S, Ryan P, Grinshpun SA, Villareal M, et al. 2012. Infant origins of childhood asthma associated with specific molds. J Allergy Clin Immunol. 130(3):639–644.e5. doi: 10.1016/j.jaci.2012.05.030.
- Reponen T, Singh U, Schaffer C, Vesper S, Johansson E, Adhikari A, Grinshpun SA, Indugula R, Ryan P, Levin L, et al. 2010. Visually observed mold and moldy odor versus quantitatively measured microbial exposure in homes. Sci Total Environ. 408(22):5565–5574. doi: 10.1016/j.scitotenv.2010.07.090.
- Reponen T, Vesper S, Levin L, Johansson E, Ryan P, Burkle J, Grinshpun SA, Zheng S, Bernstein DI, Lockey J, et al. 2011. High Environmental Relative Moldiness Index during infancy as a predictor of age seven asthma. Ann Allergy Asthma Immunol. 107(2):120–126. doi: 10.1016/j.anai.2011.04.018.
- Rossini G, Neil V, Lark D, Wymer L, Vesper S. 2017. Comparison of mold populations in water-damaged homes in Australia and the United States. Fungal Genom Biol. 07(02):2. doi: 10.4172/2165-8056.1000152.
- Simundić AM. 2006. Diagnostic accuracy. Acta Medica Croatia. 60(Suppl 1):93–111. http://www.ifcc.org/ifccfiles/docs/190404200805.pdf.
- Sinclair R, Russell C, Kray G, Vesper S. 2018. Mold contamination in housing in Eastern Coachella Valley California and Asthma. J Environ Public Health. 2018:9350370. doi: 10.1155/2018/9350370.
- Täubel M, Karvonen AM, Reponen T, Hyvärinen A, Vesper S, Pekkanen J. 2015. Application of the Environmental Relative Moldiness Index in Finland. Appl Environ Microbiol. 82(2):578–584. doi: 10.1128/AEM.02785-15.
- U.S. Environmental Protection Agency, Office of Air and Radiation, Indoor Environments Division (6609 J). 2002. A brief guide to mold, moisture, and your home. Washington, D.C: U.S. EPA.
- Vesper S. 2011. Traditional mold analysis compared to a DNA-based method of mold analysis. Crit Rev Microbiol. 37(1):15–24. doi: 10.3109/1040841X.2010.506177.
- Vesper S, Barnes C, Ciaccio CE, Johanns A, Kennedy K, Murphy JS, Nunez-Alvarez A, Sandel MT, Cox D, Dewalt G, et al. 2013a. Higher Environmental Relative Moldiness Index (ERMI) values measured in homes of asthmatic children in Boston, Kansas City and San Diego. J Asthma. 50(2):155–161. doi: 10.3109/02770903.2012.740122.
- Vesper S, Carter E, Oke O, Rehder T, Eriksen S, Wymer L, Nye M. 2023. Higher mold levels found in the deteriorated housing in the Sun Valley neighborhood of Denver, Colorado compared to other Denver housing and higher rates of health insurance claims for some diseases documented for the Sun Valley residents compared to other Denver residents. Int J Hyg Environ Health. 249:114141. doi: 10.1016/j.ijheh.2023.114141.
- Vesper S, Choi H, Perzanowski MS, Acosta LM, Divjan A, Bolaños-Rosero B, Rivera-Mariani F, Chew GL. 2016a. Comparison of mold populations and dust mite allergen concentrations in house dust samples from across Puerto Rico. Int J Environ Health Res. 26(2):198–207. doi: 10.1080/09603123.2015.1089531.
- Vesper S, Cox-Ganser JM, Wymer L, Ju-Hyeong P. 2018. Quantification of mold contamination in multi-level buildings using the Environmental Relative Moldiness Index. J Occup Environ Hyg. 15(1):38–43. doi: 10.1080/15459624.2017.1376069.
- Vesper SJ, McKinstry C, Ashley P, Haugland RA, Yeatts K, Bradham K, Svendsen E. 2007a. Quantitative PCR analysis of molds in the dust from homes of asthmatic children in North Carolina. J Environ Monit. 9(8):826–830. doi: 10.1039/b704359g.
- Vesper S, McKinstry C, Bradham K, Ashley P, Cox D, Dewalt G, Lin K-T. 2009a. Screening tools to estimate mold burdens in homes. J Occup Environ Med. 51(1):80–86. doi: 10.1097/JOM.0b013e31818dc41e.
- Vesper S, McKinstry C, Cox D, Dewalt G. 2009b. Correlation between ERMI values and other moisture and mold assessments of homes in the American Healthy Homes Survey. J Urban Health. 86(6):850–860. doi: 10.1007/s11524-009-9384-1.
- Vesper SJ, McKinstry C, Haugland RA, Iossifova Y, Lemasters G, Levin L, Khurana Hershey GK, Villareal M, Bernstein DI, Lockey J, et al. 2007b. Relative moldiness index as predictor of childhood respiratory illness. J Expo Sci Environ Epidemiol. 17(1):88–94. doi: 10.1038/sj.jes.7500528.
- Vesper S, McKinstry C, Haugland R, Neas L, Hudgens E, Heidenfelder B, Gallagher J. 2008. Higher Environmental Relative Moldiness Index (ERMIsm) values measured in Detroit homes of severely asthmatic children. Sci Total Environ. 394(1):192–196. doi: 10.1016/j.scitotenv.2008.01.031.
- Vesper S, McKinstry C, Haugland R, Wymer L, Bradham K, Ashley P, Cox D, Dewalt G, Friedman W. 2007c. Development of an Environmental Relative Moldiness Index for homes in the U.S. J Occup Environ Med. 49(8):829–833. doi: 10.1097/JOM.0b013e3181255e98.
- Vesper SJ, McKinstry C, Yang C, Haugland RA, Kercsmar CM, Yike I, Schluchter MD, Kirchner HL, Sobolewski J, Allan TM, et al. 2006. Specific molds associated with asthma. J Occup Environ Med. 48(8):852–858. doi: 10.1097/01.jom.0000224736.52780.2f.
- Vesper S, Prill R, Wymer L, Adkins L, Williams R, Fulk F. 2015. Mold contamination in schools with either high or low prevalence of asthma. Pediatr Allergy Immunol. 26(1):49–53. doi: 10.1111/pai.12324.
- Vesper S, Wakefield J, Ashley P, Cox D, Dewalt G, Friedman W. 2011. Geographic distribution of Environmental Relative Moldiness Index (ERMI) molds in U.S. homes. J Environ Public Health. 2011:242457. doi: 10.1155/2011/242457.
- Vesper S, Wymer L. 2016. The relationship between Environmental Relative Moldiness Index values and asthma. Int J Hyg Environ Health. 219(3):233–238. doi: 10.1016/j.ijheh.2016.01.006.
- Vesper SJ, Wymer L, Coull BA, Koutrakis P, Cunningham A, Petty CR, Metwali N, Sheehan WJ, Gaffin JM, Permaul P, et al. 2023. HEPA filtration intervention in classrooms may improve some students’ asthma. J Asthma. 60(3):479–486. doi: 10.1080/02770903.2022.2059672.
- Vesper S, Wymer L, Cox D, Dewalt G. 2016b. Populations of some molds in water-damaged homes may differ if the home was constructed with gypsum drywall compared to plaster. Sci Total Environ. 562:446–450. doi: 10.1016/j.scitotenv.2016.04.067.
- Vesper S, Wymer L, Cox D, Dewalt G, Pinzer E, Friedman W, Ashley PJ. 2021. The Environmental Relative Moldiness Index reveals changes in mold contamination in U.S. homes over time. J Occup Environ Hyg. 18(1):35–41. doi: 10.1080/15459624.2020.1844892.
- Vesper SJ, Wymer L, Kennedy S, Grimsley LF. 2013b. Decreased pulmonary function measured in children exposed to high Environmental Relative Moldiness Index homes. Open Respir Med J. 7(1):83–86. doi: 10.2174/1874306401307010083.
- Vesper SJ, Wymer LJ, Meklin T, Varma M, Stott R, Richardson M, Haugland RA. 2005. Comparison of populations of mold species in homes in the UK and U.S. using mold-specific quantitative PCR (MSQPCR). Lett Appl Microbiol. 41(4):367–373. doi: 10.1111/j.1472-765X.2005.01764.x.
- World Health Organization (WHO). 2009. WHO guidelines for indoor air quality, dampness and mold publications. Copenhagen, Denmark: WHO Regional Office for Europe.
- Zahran HS, Bailey CM, Damon SA, Garbe PL, Breysse PN. 2018. Vital signs: asthma in children – United States, 2001-2016. MMWR: Morb Mortal Wkly Rep. 67(5):149–155. doi: 10.15585/mmwr.mm6705e1.