
Abstract
The ability of epidemiologic evidence to inform regulatory decisions is largely dependent on the coherence and quality of the published literature. This systematic review examines the quality and consistency of studies assessing health outcomes associated with exposure to triclosan (TCS), an antimicrobial chemical with a short physiologic half-life. We used elements of the Biomonitoring, Environmental Epidemiology, and Short-Lived Chemicals instrument to evaluate aspects of study quality. Each methodological domain – overall design, exposure assessment, and data analysis – was categorized according to three tiers where Tier 1 indicated the highest quality. We also examined consistency of methods, results and reporting as considerations for weight of evidence (WOE) assessment. Studies were considered sufficiently comparable if they addressed the same or similar research questions. Forty-two studies met the criteria for inclusion. Only one randomized cross-over clinical trial of TCS was assigned to Tier 1 for all three domains. Most other studies were assigned to Tier 3 for at least one domain. Although the available literature examined more than 100 different health endpoints and reported hundreds of different measures of association, few studies were considered comparable. For reported measures of association, most were not significantly different from the null; the few statistically significant results represented isolated findings without a discernable across- or within-study pattern. We conclude that the current body of epidemiologic literature does not allow a meaningful WOE assessment due to methodological limitations of individual studies and lack of inter-study consistency. On the other hand, methodologically stronger studies may be used to inform future research.
Introduction
Systematic assessment of evidence from epidemiologic studies investigating potential health effects of environmental chemicals is playing an increasing role in regulatory decision-making (USEPA Citation2010; NAS Citation2014; OHAT Citation2015). However, the utility of epidemiologic data as the basis for regulation is largely dependent on the strength, coherence, and quality of the published studies (OHAT Citation2015; USEPA Citation2016). While the epidemiologic studies exploring health outcomes and associations with environmental chemical exposures are numerous, recent publications, and governmental reports indicate that informed decision-making may be difficult due to the variable quality of the available evidence and the lack of consistency in terms of specific hypotheses tested, study methods, and reporting of results (Goodman et al. Citation2010, Citation2014a, Citation2014b; Youngstrom et al. Citation2011; LaKind et al. Citation2014a, Citation2014b, Citation2015a, Citation2015b; Rooney et al. Citation2014; USEPA Citation2016). In this communication, we offer a systematic examination of the epidemiologic literature on one specific chemical of interest – triclosan (TCS).
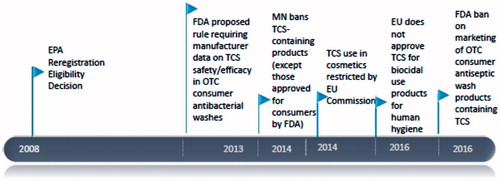
TCS (2,4,4′-trichloro-2′-hydroxydiphenyl ether) is a broad-spectrum antimicrobial agent that has been in use for over 40 years (Calafat et al. Citation2008; Yueh and Tukey Citation2016). TCS is used as an antiseptic, disinfectant, or preservative in medical and personal care products such as hand soaps and shampoos, mouthwash, toothpaste, and cosmetics, and in household items such as cutting boards (Witorsch and Thomas Citation2010; Yueh and Tukey Citation2016). TCS was found in the majority of urine samples obtained via population-based surveys both in the US and in Canada (Calafat et al. Citation2008; Health Canada Citation2015) and, as shown in , a number of international regulatory activities in recent years have focused on this chemical.
Figure 1. Regulatory actions related to TCS (EU: European Commission; FDA: Food and Drug Administration; MN: Minnesota; OTC: over-the-counter) (Beyond Pesticides Citation2016; EU Citation2016; USEPA Citation2010; USFDA Citation2016).
Toxicological studies suggest that TCS can impact endocrine function, thyroid hormone homeostasis, and antibiotic resistance (Yueh and Tukey Citation2016). As reviewed in detail elsewhere (Witorsch and Thomas Citation2010), mechanism of action of TCS may involve interactions with aryl hydrocarbon and sex hormone receptors, and effects on the hypothalamo-pituitary-thyroid axis. However, in vitro and in vivo findings have not been consistently coherent leaving room for uncertainty in predicting health outcomes.
Widespread human exposure and concerns about health effects make TCS an emerging chemical of interest and an increasing focus of research. At the same time, several important aspects of TCS biomonitoring present a challenge for observational epidemiologic studies. For example, a factor that may introduce error in TCS exposure assessment is the likelihood of sample contamination because the chemical is widespread in the environment and can be commonly found in laboratory and clinical settings (Barr et al. Citation1999; Needham et al. Citation2007; Calafat and Needham Citation2008, Citation2009). In addition, stability of urinary TCS metabolites, which are typically measured in biomonitoring studies, may depend on the proper handling, freezing and storage of samples (Ye et al. Citation2007; Provencher et al. Citation2014).
Perhaps the most distinguishing feature of TCS is its short physiological half-life, which means that it is rapidly absorbed, metabolized, and eliminated (primarily via urine) with a median excretion half-life of 11 h after oral intake (Yueh and Tukey Citation2016). In addition, TCS exposures vary over time following changes in health status, product use, activity or location (Pleil and Sobus Citation2013). For these reasons, full characterization of exposure to TCS may require continuous biomonitoring, which involves taking multiple samples from the same individual at different times (NRC Citation2006).
This review examines the quality, quantity, and consistency of studies assessing the associations between TCS exposure and various health outcomes in humans. In assessing study quality, we focus on the critical issues of study design, exposure assessment (with specific emphasis on exposure misclassification due to insufficient number of measures) and data analysis. We then examine consistency of the TCS literature in terms of specific hypotheses tested, methods, results and reporting, and assess its utility for weight of evidence (WOE) assessment. In reviewing the literature on TCS, we also aim to share observations pertaining to methodological issues that are applicable to other ubiquitous chemicals with short physiological half-lives.
Quality assessment considerations
In conducting this review, we relied on elements of the Biomonitoring, Environmental Epidemiology, and Short-Lived Chemicals (BEES-C) instrument, which was developed specifically to guide the transparent assessment of the quality of epidemiologic studies focused on exposure to short-lived environmental chemicals such as TCS (LaKind et al. Citation2014a). The BEES-C instrument provides a framework for evaluating three main domains of study quality: (i) study design, (ii) exposure assessment (including biomarker selection and measurement), and (iii) data analysis. Each of the above domains is categorized according to three tiers where Tier 1 indicates the highest quality and Tier 3 is reserved for study aspects that are considered suboptimal.
Study design
In assessing design quality, we focused on two distinct, but related issues: threats to validity and ability to establish the temporal relation between exposure of interest (in this case TCS) and the outcome of concern. There is general consensus that experimental studies (particularly randomized clinical trials) have fewer threats to validity and provide more definitive evidence compared to observational studies addressing the same research question (Guyatt et al. Citation2000a, Citation2000b; Petticrew and Roberts Citation2003). The main purpose of randomization is to avoid confounding by ensuring that participant characteristics are evenly distributed across treatment groups (Roberts and Torgerson Citation1998). In addition, a well-designed and properly implemented experimental study guarantees that the probability of being enrolled does not depend on the probability of being assigned to a particular treatment group, thereby minimizing another threat to validity – selection bias (Kahan et al. Citation2015).
An additional important attribute of experimental studies is that they leave no room for ambiguity with respect to temporal relation between exposure and outcome. By contrast, in observational research, establishing temporality is only possible in “incidence” studies, which identify health-related events such as new cases of disease at the time of onset or at least at the time of detection (Pearce Citation2012). Observational incidence studies may use a cohort and various versions of a case-control (particularly nested case-control) design. Regardless of design, however, the main feature of incidence studies is the ability to establish the proper sequence of exposure and outcome. If exposures are likely to vary over time (as in many biomonitoring studies of short-lived chemicals), a useful approach in some circumstances may be a longitudinal study that assesses the relation between repeated measures of exposure (e.g. TCS) and repeated measures of health biomarkers (e.g. levels of thyroid hormones).
Unlike incidence studies, a “prevalence” study cannot establish temporality. A typical prevalence study relies on cross-sectional design, which ascertains the exposure and health outcome information simultaneously (Rothman and Greenland Citation1998). Case-control studies also fall into this category if they use prevalent rather than incident cases (LaKind et al. Citation2014a).
Another consideration when assessing strength and weakness of study design is the need to capture critical windows of exposure relevant to the outcome of interest. For TCS, this critical window is usually not known; however, when a health outcome is expected to occur within a relatively short time after exposure (e.g. a change in health biomarker levels following intentional TCS administration in a clinical trial), conclusions about a presence or absence of a causal link may be justified.
Exposure assessment
In biomonitoring studies of ubiquitous, short-lived chemicals such as TCS, perhaps the most important source of exposure misclassification is an insufficient number of samples (LaKind et al. Citation2014a). It has been shown that reliance on a single random sample to characterize exposure to a short-lived chemical may result in substantial misclassification (i.e. over- or under-estimation of the true exposure level) and may not provide sufficient information to state with confidence that the measured exposure preceded the outcome (Preau et al. Citation2010; LaKind et al. Citation2012, Citation2014a; Wielgomas Citation2013; Goodman et al. Citation2014a).
The BEES-C instrument (LaKind et al. Citation2014a, Citation2015b) offers specific guidance for assessing this and other issues (e.g. analyte stability and sample contamination) as possible sources of exposure misclassification and for assigning studies to quality tiers. In this review, we focus on the number of samples measured for TCS in each study, as this is likely to have the greatest impact on exposure misclassification. (In assessing the utility of one measurement for understanding longer-term exposures, researchers often rely on intra-class correlation coefficients, or ICCs – either previously reported values or ones developed from their own study data. This is explored further in the Discussion section. In addition, it is often the case that publications do not include sufficient information to assess whether avoidance of sample contamination and analyte stability were properly considered; this issue is also revisited in the Discussion section of this paper.
Data analysis and reporting of results
While essential aspects of data analysis are not specific to TCS or other short-lived chemicals, an assessment of study quality would be incomplete without an evaluation of the data analysis methods. The BEES-C instrument emphasizes the importance of distinguishing between predictive and explanatory analyses (LaKind et al. Citation2014a). The goal of predictive analysis is to maximize model fit and a decision on whether to retain a particular covariate is based on statistical considerations (Bellazzi and Zupan Citation2008). By contrast, in an explanatory (hypothesis testing) analysis, inclusion and exclusion of control variables (confounders, mediators or effect modifiers) are driven, at least in part, by a priori reasoning (Concato et al. Citation1993; Hernan et al. Citation2002; Beran and Violato Citation2010).
Considerations of analytic strategy and proper handling of confounding factors depend on the hypothesis under study. For example, confounding variables that are commonly considered in studies of neurodevelopmental effects in children include participant age, race, gender, socioeconomic status (SES), and maternal variables such as age, education, and IQ (Amler et al. Citation2006). Similarly, factors that need to be considered in studies of respiratory effects may include, in addition to demographic and SES variables, personal and family history of allergies or asthma, occupation, and exposure to tobacco smoke (Beasley et al. Citation2015).
It is important to keep in mind that the results of observational studies are inevitably subject to uncertainty due to unaccounted threats to validity and various data handling decisions and assumptions. The magnitude of uncertainty can be formally assessed through quantitative sensitivity analyses, which are considered an important part of an analysis plan (Greenland Citation1996).
Methods
Overall approach
For this review, we followed the Assessment Tool of Multiple Systematic Reviews (AMSTAR) (Shea et al. Citation2007). AMSTAR is similar to the often-cited Preferred Reporting Items for Systematic Reviews and Meta-Analyses (PRISMA) instrument (Liberati et al. Citation2009); however, unlike PRISMA, AMSTAR is not focused on health care interventions and is dedicated primarily to quality of review methods rather than completeness of reporting.
Eight of the 11 AMSTAR items are relevant to this review: (1) a priori statement of research questions and inclusion/exclusion criteria; (2) duplicate literature searches by two or more coauthors; (3) the use of at least two electronic search engines followed by a supplemental search of reviews, textbooks, and secondary references with keywords and MeSH (Medical Subject Headings) statements reported in the methods section; (4) a list of studies excluded from the review; (5) a summary of study characteristics that met the inclusion criteria; (6) a formal assessment of individual study quality; (7) consideration of study quality in drawing conclusions; and (8) a statement of sources of support (Shea et al. Citation2007).
Two AMSTAR items omitted from this list relate specifically to meta-analyses which are not part of this review. The third omitted item calls for consideration of reports and other non-peer reviewed papers. As the goal of this review was to the assess TCS literature in terms of its utility for WOE assessment, it is important to keep in mind that many organizations charged with this task (e.g. the National Toxicology Program [NTP]) use only “publicly accessible, peer-reviewed information in its evaluations” (OHAT Citation2015). For this reason, we relied only on the published literature that would be considered by such organizations.
Identification and selection of studies
Electronic data sources PubMed and Web of Science Core CollectionTM were used to conduct the initial literature search. For the PubMed search, the following keywords and Medical Subjects Heading (MeSH) terms were used: (“triclosan” [MeSH Terms] OR “triclosan” [All Fields]) AND (“epidemiology” [Subheading] OR “epidemiology” [All Fields] OR “epidemiology” [MeSH Terms]). The results of this search were limited to human studies. A separate search utilized the following terms: (“triclosan” [MeSH Terms] OR “triclosan” [All Fields]) AND (“toxicity” [Subheading] OR “toxicity” [All Fields]) AND (“humans” [MeSH Terms] OR “humans” [All Fields] OR “human” [All Fields]). For the Web of Science search, we used broad search criteria with only two keywords: “triclosan” and “epidemiology.”
References of retrieved articles were reviewed to identify publications not captured by the electronic search. The search and selection of relevant studies was conducted independently by two study authors (JSL, MG) with all disagreements resolved by consensus. The criteria for inclusion into the review were as follows:
research of human populations,
a comparison of one or more levels of exposure to TCS in relation to a specified reference category (independent variable),
data included health-related outcomes (dependent variables),
the association between TCS exposure and outcome was either reported or could be assessed based on the information provided in the publication, and
publication appeared in English prior to 15 August 2016 (end of literature search).
Publications on antimicrobial efficacy of TCS in different products (e.g. toothpaste and sutures), descriptive studies that did not assess the associations between TCS and health outcomes and papers that did not include data on humans were excluded. A list of studies retrieved and evaluated, but excluded from the review, and the reasons for exclusions are provided in Supplement 1.
Data extraction
We followed the literature review protocol described in previous publications (Goodman et al. Citation2014a; LaKind et al. Citation2014b). Each study that met the inclusion criteria was examined independently by two coauthors (MG and JSL). Information extracted from each study for the purposes of this review included the following:
Description of the study population: size, composition, source, and location
Study design: e.g. clinical trial, cohort, cross-sectional, case-control, or other
Type of TCS exposure: e.g. intervention- or biomonitoring-based, and for the latter, source of specimen and number and timing of samples
The type of exposure variable (e.g. ordinal, binary, or continuous) used in the analysis
Health outcomes of interest
Statistical methods for assessing the association of interest and the list of covariates
Results: the reported measure of association (e.g. an odds ratio [OR] for binary endpoints, or a linear regression coefficient [β] for continuous endpoints), and a measure used for statistical inference (e.g. a 95% confidence interval [CI] or a p value).
If the result of interest was not reported in the paper, whenever possible, the measures of association and 95% CIs were calculated by one of the authors (MG). When the result was reported in a qualitative fashion, the corresponding text was reproduced verbatim. The data from each study were tabulated, and the resulting summary tables were again cross-checked with disagreements resolved by consensus.
Assessment of strength of evidence (data quality) from individual studies
We used components of the BEES-C instrument (LaKind et al. Citation2014a) for evaluating three main domains of study quality: (i) study design, (ii) exposure assessment (with specific emphasis on the number of samples and/or quantitative assessment of measurement error), and (iii) data analysis. Each of these domains is categorized according to three tiers where Tier 1 indicates the highest quality and Tier 3 is reserved for study aspects that are considered suboptimal.
Study design
When evaluating quality of the overall study design, clinical trials of TCS were included in Tier 1 because they present the lowest threat to validity and clearly establish the temporal relation between intervention and outcome. Cohort studies and case-control studies that used incident cases were placed in Tier 2; these studies are generally able to establish the correct sequence of exposure and outcome, but are more vulnerable to bias than clinical trials. Case-control studies with prevalent cases and cross-sectional studies were assigned to Tier 3 because in these studies both exposure and outcome are ascertained at the same time, and in some instances exposure assessment follows rather than precedes the outcome of interest. Publications that included both a cohort and cross-sectional design (depending on the analysis) were assigned to Tier 2.
Exposure assessment
In Tier 1 studies, the exposure assessment was based on a sufficient number of samples per individual to estimate exposure over the appropriate duration, or used adequate long-term sampling (e.g. multiple 24-h urine collections). If only one sample was used to characterize TCS exposure, the study was assigned to Tier 1 if it provided quantitative evidence that probability of misclassification was small. A Tier 2 study included more than one sample but without explicit evaluation of error or had more than one TCS measure, but used each measure as a separate observation. The randomized experimental studies were assigned to Tier 1 if they provided evidence of increased TCS levels following intervention (relative to the reference group) thereby leaving little room for exposure misclassification. Otherwise, experimental studies were assigned to Tier 2. In a Tier 3 study, exposure was based on a single sample without considering error or there were no biomonitoring data.
Data analysis and reporting of results
We reviewed the data analysis sections of each paper and made decisions regarding assignment to one of the three tiers for the data analysis domain based on the general considerations outlined in the BEES-C guidelines (LaKind et al. Citation2014a). Tier 1 was reserved for studies that used randomization or demonstrated comprehensive evaluation of control variables and included sensitivity analyses. Tier 2 ratings described studies that applied appropriate statistical methods but did not include sensitivity analyses. Studies that did not control for extraneous factors or considered only a few potential confounders (e.g. age and BMI) without justification for covariate selection were assigned to Tier 3. If a publication included several analyses, the tier assignment was based on the analysis of the highest quality.
Assessment of consistency across studies
All studies were organized according to nine broad categories of outcomes of interest: (1) allergies and asthma, (2) measures of overweight and obesity, (3) female reproductive endpoints, (4) male reproductive endpoints, (5) birth outcomes, (6) puberty endpoints in girls, (7) thyroid function, (8) sex hormone levels, and (9) miscellaneous. The last category included a variety of outcomes for which only one or two studies were conducted and assessment of consistency across studies was not possible. In instances when the methods section of a publication indicated evaluation of multiple outcomes but the results section reported only selected findings, the non-reported results were also documented. This approach allowed us to search for reasonably homogeneous groups of comparable articles and evaluate consistency of methods, results and reporting within each group. Studies were considered sufficiently comparable if they addressed the same or similar research questions. The comparability was assessed using the PI(E)CO format, where P specifies the target population, I(E) determines the intervention (or exposure), C denotes the comparison group, and O identifies the outcome of interest (Centre for Reviews and Dissemination Citation2016). The within-study consistency was assessed by comparing results of different analyses testing the same hypothesis, but using different exposure metrics or analytic approaches.
Results
Overview of studies
We identified 89 studies from our literature search; of those, 43 studies met the criteria for inclusion in the current review (Supplement 1). Of the 43 studies, 24 were conducted in North America (Wolff et al. Citation2008, Citation2010, Citation2015; Clayton et al. Citation2011; You et al. Citation2011; Buttke et al. Citation2012; Savage et al. Citation2012, Citation2014; Koeppe et al. Citation2013; Lankester et al. Citation2013; Buser et al. Citation2014; Spanier et al. Citation2014; Adgent and Rogan Citation2015; Li et al. Citation2015; Ihde et al. Citation2015; Shiue Citation2015a, Citation2015b; Velez et al. Citation2015; Ashley-Martin et al. Citation2016; Buckley et al. Citation2016; Poole et al. Citation2016; Scinicariello and Buser Citation2016; Smarr et al. Citation2017; Geer et al. Citation2017), two studies in the Caribbean (Watkins et al. Citation2015; Aker et al. Citation2016), 10 studies in Europe (Allmyr et al. Citation2009; Chevrier et al. Citation2012; Philippat et al. Citation2012, Citation2014; Bertelsen et al. Citation2013; Buhl et al. Citation2014; Den Hond et al. Citation2013, Citation2015; Geens et al. Citation2015; Lassen et al. Citation2016), four in Asia (Chen et al. Citation2013; Wang et al. Citation2015; Xue et al. Citation2015; Zhu et al. Citation2016), and three in Australia (Cullinan et al. Citation2012, Citation2015a, Citation2015b).
The literature on TCS exposures and health outcomes is quite recent and rapidly expanding. Most studies included in the review were published within the last three years, and none prior to 2008.
Not all studies represented independent data sources. For example, 14 US studies used data from the National Health and Nutrition Examination Survey (NHANES) (Clayton et al. Citation2011; You et al. Citation2011; Buttke et al. Citation2012; Savage et al. Citation2012, Citation2014; Koeppe et al. Citation2013; Lankester et al. Citation2013; Buser et al. Citation2014; Spanier et al. Citation2014; Adgent and Rogan Citation2015; Li et al. Citation2015; Shiue Citation2015a, Citation2015b; Scinicariello and Buser Citation2016), and most used at least partially overlapping survey years. Similarly, three Australian papers (Cullinan et al. Citation2012, Citation2015a, Citation2015b) were based on the same study, as were two publications from Puerto Rico (Watkins et al. Citation2015; Aker et al. Citation2016), and three papers by Wolff et al. (Citation2008, Citation2010, Citation2015).
Assessment of strength of evidence: quality of studies
Study design
As shown in , more than half of studies (n = 25) were assigned to Tier 3 based on their overall design. Twenty two studies were cross-sectional and the remaining three (Chen et al. Citation2013; Den Hond et al. Citation2015; Wang et al. Citation2015) used case-control design, but included prevalent rather than incident cases.
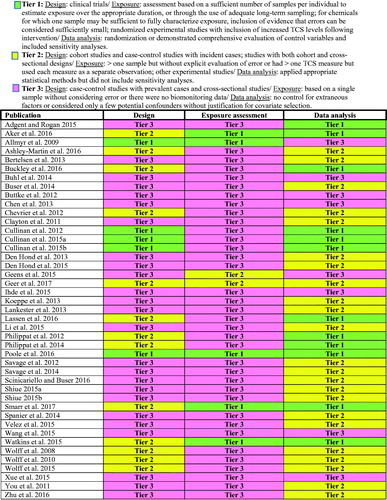
Figure 2. Results of evaluation of quality of individual TCS epidemiology studies using elements of the BEES-C instrument.
Tier 2 included 13 publications. Twelve of those publications (Wolff et al. Citation2008, Citation2010, Citation2015; Philippat et al. Citation2012, Citation2014; Watkins et al. Citation2015; Aker et al. Citation2016; Ashley-Martin et al. Citation2016; Buckley et al. Citation2016; Lassen et al. Citation2016; Smarr et al. Citation2017; Geer et al. Citation2017) were based on seven different cohorts assembled in France, Puerto Rico, Denmark, Canada, and various parts of the US. One paper (Chevrier et al. Citation2012) presented a case-control study that used incident cases identified among members of a French cohort.
Five experimental studies were included in Tier 1. One of the methodologically strongest studies in this category was the double-blind, randomized, crossover trial assessing the effect of TCS on human microbiome (Poole et al. Citation2016). In that study, participants were randomly assigned to receive TCS-containing or TCS non-containing household and personal care products for 4 months and then switched exposure arms for an additional 4 months.
Three publications were based on the double-blind, randomized, placebo-controlled, prospective clinical trial Cardiovascular and Periodontal Study (CAPS) conducted in Australia among patients who had history of cardiovascular disease (Cullinan et al. Citation2012, Citation2015a, Citation2015b). CAPS participants were randomly assigned into one of two groups: one group received placebo toothpaste, and the other received toothpaste containing 0.3% TCS. All subjects were followed for five years.
The fifth publication in this group was the single arm Swedish study (Allmyr et al. Citation2009) that examined changes in cytochrome P450 3A4 (CYP3A4) activity and thyroid hormone concentrations before and after a two-week intervention that involved use of TCS-containing toothpaste.
Exposure assessment
Almost all of the studies (N = 37) reviewed here based their exposure assessment on one urine sample or included no measures of TCS (). Only one of the studies with a single measurement (Smarr et al. Citation2017) provided an exploration of error associated with the use of one sample instead of generically describing error (e.g. with a discussion of ICCs; this is further described in the Discussion section). Thus, 36 of the 43 papers were assigned to Tier 3.
Geens et al. (Citation2015) obtained multiple urine samples at different times in the study but each was used as a separate observation; thus, this publication was assigned to Tier 2. Similarly, Geer et al. (Citation2017) analyzed third trimester urine samples and cord blood samples separately and was assigned to Tier 2. The remaining five publications were assigned to Tier 1. Two of those (Watkins et al. Citation2015; Aker et al. Citation2016) were longitudinal cohort studies that included three samples obtained at different times and examined associations with health outcomes, taking all three TCS measures into consideration. Allmyr et al. (Citation2009) conducted an experimental study comparing health biomarker levels before and after intentional TCS administration and observed significantly higher plasma TCS levels following the 14-day study intervention (0.009–0.81 ng/g and 26–296 ng/g: ranges before and after exposure, respectively). Poole et al. (Citation2016) used a cross-over experimental study design and included measurements of TCS in five urine samples for each study period with clear evidence of increased exposure during the intervention phase. Smarr et al. (Citation2017) used one sample in a study of reduced fecundity but explored the extent of error by conducting a separate analysis restricted to couples with a shorter time to pregnancy.
While we did not formally assign quality tiers for steps taken to avoid sample contamination and to ensure analyte stability, we note that only two studies specifically reported the incorporation of field and lab blanks in their methods (Velez et al. Citation2015; Ashley-Martin et al. Citation2016). None of the studies offered documentation of analyte stability. Fourteen studies used NHANES data, and did not provide documentation for either of these issues. Documentation for prevention of contamination of samples during laboratory operations is available (Calafat et al. Citation2008; CDC Citation2013), but no similar documentation describing these precautions during sample collection was available nor was information given on sample handling and storage conditions.
Data analysis
When assessing the quality of data analysis, Tiers 1 and 2 included 12 and 23 publications, respectively (). The remaining eight publications failed to control for extraneous factors or considered only a few selected basic covariates such as age and BMI; these were assigned to Tier 3 ().
Among papers included in Tier 1, particularly notable were studies that performed longitudinal analyses with repeated measures of TCS exposure, outcomes of interest, or both. For example, Aker et al. (Citation2016) used data from a cohort study of pregnant women in Puerto Rico to examine associations between urinary TCS concentrations measured during three visits at 16–20, 20–24, and 24–28 weeks gestation and serum levels of thyroid and sex hormones at visits 1 and 3.
Although all cross sectional studies included in the present review were assigned to Tier 3 in the overall design and the exposure assessment domains, one cross-sectional study was placed in Tier 1 with regards to its data analysis methods. Adgent and Rogan (Citation2015) analyzed the data from the 2005–2008 NHANES to examine the association between urinary TCS and enterolactone (an indirect marker of gut microflora and antibiotic use). The linear regression analyses in that study controlled for a number of potential confounders including patient demographic characteristics, SES, dietary habits, and frequency of bowel movement. The authors also conducted several sensitivity analyses, which treated TCS as continuous, binary, and ordinal variables.
Assessment of consistency
The 43 studies included in the present review examined more than 100 different health endpoints and reported hundreds of different measures of association across nine broad categories: (1) allergies and asthma, (2) measures of overweight and obesity, (3) female reproductive endpoints, (4) male reproductive endpoints, (5) birth outcomes, (6) puberty endpoints in girls, (7) thyroid function, (8) sex hormone levels, and (9) miscellaneous. In the following sections of the review, we examine each of these categories and assess inter- and intra-study consistency of methods and reported results. summarize the studies in each of the nine groups using the PI(E)CO format.
Table 1. Summary of epidemiologic studies evaluating association between TCS exposure and allergic conditions (bolded text indicates a statistically significant result).
Table 2. Summary of epidemiologic studies evaluating association between TCS exposure and measures of overweight/obesity measures (bolded text indicates a statistically significant result).
Table 3. Summary of epidemiologic studies evaluating association between TCS exposure and female reproductive function (bolded text indicates a statistically significant result).
Table 4. Summary of epidemiologic studies evaluating association between TCS exposure and male reproductive function (bolded text indicates a statistically significant result).
Table 5. Summary of epidemiologic studies evaluating association between TCS exposure and birth outcomes (bolded text indicates a statistically significant result).
Table 6. Summary of epidemiologic studies evaluating association between TCS exposure and puberty outcomes in girls (bolded text indicates a statistically significant result).
Table 7. Summary of epidemiologic studies evaluating association between TCS exposure and sex hormone concentrations (bolded text indicates a statistically significant result).
Table 8. Summary of epidemiologic studies evaluating association between TCS exposure and measures of thyroid function (bolded text indicates a statistically significant result).
Table 9. Summary of epidemiologic studies evaluating association between TCS exposure miscellaneous health outcomes (bolded text indicates a statistically significant result).
Allergies and asthma
summarizes six studies that evaluated the association between TCS and various indicators of allergy and asthma (Clayton et al. Citation2011; Savage et al. Citation2012, Citation2014; Bertelsen et al. Citation2013; Buhl et al. Citation2014; Spanier et al. Citation2014). All six studies were cross sectional. In five studies, TCS exposure was based on measured urinary levels from a single sample. The sixth study (Buhl et al. Citation2014) defined TCS exposure as a positive response to a skin patch test. All six studies were included in Tier 3 with regards to their exposure assessment methods. The studies examined 24 different endpoints such as various categories of wheeze and asthma, evidence of sensitization to numerous allergens, rhinitis, dermatitis and eczema. Most of the analyses did not show significant associations and the results demonstrated no consistent patterns across studies. Three studies reported that persons with higher TCS levels may have higher prevalence of inhalation allergies; however, two of those studies (Savage et al. Citation2012; Spanier et al. Citation2014) used the same 2005–2006 NHANES data. These same studies did not find consistent evidence of an association with asthma prevalence.
Measures of overweight and obesity
Nine studies assessed the association between TCS exposure and measures of overweight or obesity (e.g. body mass index [BMI], waist circumference [WC]) (). All but three studies in this group were cross-sectional, and all except one were assigned to Tier 3 with respect to the quality of exposure assessment.
In the previously cited double-blind, randomized, crossover trial assessing the effect of TCS on human microbiome (Poole et al. Citation2016), the authors also examined whether the participants demonstrated any weight gain during the TCS vs. non-TCS intervals (each interval was 4 months duration). Six subjects gained weight (defined as increase of at least 0.6%) in the TCS phase but lost weight or stayed at the same weight in the non-TCS phase; however this result was not statistically significant (p = 0.22).
A study of 173 mother–child pairs (Buckley et al. Citation2016) included measurements of TCS in a single spot urine sample collected from prospective mothers at 25–40 weeks gestation and followed their children postnatally to calculate percent body fat at three visits between 4 and 9 years of age. Mixed effects linear models with repeated measures were used to examine the association between prenatal TCS and percent body fat across the follow up period. Additional models examined the same endpoint at each visit and extensive sensitivity analyses were used to examine the effects of different strategies of controlling for urine dilution. None of the results demonstrated a significant departure from the null value; however these findings are difficult to examine for inter-study consistency because no other studies used percent body fat as the endpoint of interest.
Another cohort study (Wolff et al. Citation2015) followed 1170 girls (ages 6–8 years) with annual examinations over a period of up to seven years. TCS was measured at baseline in a single urine sample collected at enrollment. Body mass index percentile was examined at the last pre-pubertal visit. None of the results demonstrated a statistically significant association.
The results of the cross-sectional studies did not reveal any discernable pattern. Most analyses yielded findings consistent with the null hypothesis. In two NHANES studies that observed significant associations (Lankester et al. Citation2013; Li et al. Citation2015), the results were in opposite directions.
Female reproductive endpoints
Two cross-sectional studies and one cohort study examined the association between TCS exposure and female reproductive health (). The cohort study by Smarr et al. (Citation2017) was assigned to Tier 1 for exposure characterization as described previously. The cross-sectional studies by Wang et al. (Citation2015) and Velez et al. (Citation2015) were assigned to Tier 3 with respect to exposure assessment methods, as they both relied on one TCS measurement with no assessment of error in exposure characterization.
Wang et al. (Citation2015) examined urine TCS concentrations in women who had medically unexplained spontaneous abortion in mid-gestation (cases) and in women who had no history of spontaneous abortion and had at least one living child (controls). Using subjects whose urinary TCS was < LOD as the reference category, the authors reported significantly elevated ORs for “medium” and “high” TCS exposure. While these findings led the authors to conclude that “TCS-exposure might cause spontaneous abortion,” this causal conclusion based on the human data from Wang et al. is not warranted because exposure in this study was measured after the event of interest and because methods of study design, exposure assessment and data analysis were consistent with Tier 3.
A cohort of women enrolled in the Longitudinal Investigation of Fertility and the Environment (LIFE) study provided a single spot urine sample within 2 months of stopping contraception and the participants were followed to pregnancy (Smarr et al. Citation2017). The outcome of interest was time to pregnancy. The study included a variety of analyses that treated TCS as a binary, continuous or ordinal (quartiles) variable after controlling for multiple potential confounders including male partner’s TCS. None of the analyses demonstrated a significant association between baseline TCS and time to pregnancy and there was no evidence of a dose-response. As noted earlier, a methodological strength of the Smarr et al. (Citation2017) study is the ability to examine the extent of exposure assessment error by comparing the overall result to the result of a separate analysis restricted to couples with a shorter time to pregnancy.
Velez et al. (Citation2015) conducted a cross-sectional analysis that examined the association between urinary TCS measured during first trimester of pregnancy and time to pregnancy (ascertained by recall). The results were mixed; only one analysis, which used urinary TCS levels as a binary variable (using 75th percentile as the cutoff), demonstrated a statistically significant association with longer time to pregnancy; however, this result was not confirmed when TCS was treated as a continuous or ordinal variable.
Male reproductive endpoints
Endpoints examined in this group of studies included male infertility or subfertility (two studies), time to pregnancy (one study), and a variety of measures of semen quality such as volume, concentration, total sperm count, and sperm motility and morphology (three studies). All but one study in this group were cross-sectional (). Only one cohort study (Smarr et al. Citation2017) evaluated the association between TCS levels at baseline and time to partner’s pregnancy; the results showed no evidence of association in any of the analyses.
The two cross-sectional studies assessing the association between male subfertility or infertility and TCS did not demonstrate consistent results. One study conducted in China (Chen et al. Citation2013) observed a significant positive association in one of the two analyses (creatinine-adjusted only), whereas the second study conducted in Belgium (Den Hond et al. Citation2015) reported a null result.
Studies that examined the various measures of semen quality were also inconsistent. The studies by Chen et al. (Citation2013) and Den Hond et al. reported null results. Another cross-sectional study from China (Zhu et al. Citation2016) reported some statistically significant results among 24 TCS tertile-specific regression coefficients, but all of these results were observed in the lowest rather the highest tertiles of TCS exposure and the significant associations varied in terms of magnitude and direction.
Birth outcomes
Five cohort studies and one case-control study examined the association between prenatal exposure to TCS and birth outcomes (). All of these studies were assigned to Tier 3 with respect to their exposure assessment methods.
Only one of six studies, a case-control study from France, focused on birth defects – hypospadias and undescended testes. The five cohort studies reported data for 11 different endpoints: gestational age, preterm birth, low birth weight for gestational age, weight, body length, head circumference, abdominal circumference, two alternative measures of anogenital distance, penile width, and femoral length. These endpoints were assessed at different ages pre- and postnatally, among different population subgroups, and for different exposure metrics, which resulted in over 130 individual measures of association.
Despite the large number of reported results, consistency across studies is difficult to assess because very few of these results are directly comparable. For example, Wolff et al. (Citation2008) and Geer et al. (Citation2017) reported the associations between prenatal TCS and birth weight in boys and girls adjusted for sex, Philippat et al. (Citation2012) and Philippat et al. (Citation2014) excluded girls from their analyses, and Lassen et al. (Citation2016) reported findings separately for boys and girls.
Very few of the results were statistically significantly different from the null value and the statistically significant results lacked inter- or intra-study consistency. For example, the significant association between prenatal TCS and head circumference in the Lassen et al. (Citation2016) study was observed in boys, but not girls; the two other studies limited to boys (Philippat et al. Citation2012, Citation2014) reported null results, as did the two studies that examined boys and girls together (Wolff et al. Citation2008; Geer et al. Citation2017).
Puberty endpoints in girls
Three studies evaluated the hypothesis that TCS exposure may influence onset of puberty in girls (). Two of those studies were based on the same Breast Cancer and Environment Research Program (BCERP) cohort (Wolff et al. Citation2010, Citation2015) and the third study (Buttke et al. Citation2012) used data from the 2003–2008 NHANES.
The participants in the BCERP cohort study were enrolled at the age of 6–8 years and were followed for up to seven years. TCS was measured at baseline in a single urine sample collected at enrollment. The main endpoints of interest were the presence and timing of breast and pubic hair development (Tanner stages B2 and PH2, respectively). The first analysis of this cohort (Wolff et al. Citation2010) evaluated the association between urinary TCS at baseline and evidence of B2 or PH2 at one year of follow up. TCS was expressed as an ordinal (quintiles) or a continuous variable, although the results for continuous TCS were not reported. In the analyses by quintile, no association was observed for B2, but there was evidence of an inverse relation between TCS and PH2. In the second publication (Wolff et al. Citation2015), which described the same cohort but used time-to-event analysis, the results for B2 demonstrated a positive association with TCS (this was not present in the Wolff et al. Citation2010 study). By contrast, the previously observed inverse association for PH2 was no longer present in Wolff et al. (Citation2015).
The NHANES-based study (Buttke et al. Citation2012) ascertained age at menarche among 12- to 16-year-old girls based on information provided by a parent or guardian. TCS was measured in a single urine sample obtained at the time of the interview. No association between TCS and age at menarche was observed; this study was assigned to Tier 3 for all three methodological domains (design, exposure assessment and data analysis).
Sex hormone concentrations
summarizes the five studies that investigated the association between TCS and sex hormone levels. The cohort study by Aker et al. (Citation2016) conducted longitudinal analyses using serum levels of estrogen, progesterone, sex-hormone-binding globulin (SHBG), and estrogen/progesterone ratio as the endpoints of interest. There was no evidence of an association in any of the analyses. Similarly, the cross-over trial by Poole et al. (Citation2016) found no evidence that TCS exposure affects serum levels of free or total testosterone.
The remaining three studies in this group used cross-sectional design. Den Hond et al. (Citation2015) reported a positive significant association of TCS with luteinizing hormone and an inverse significant association with inhibin B in men, but no association with any other measures (SHBG, FSH, free and total estrogen and free and total testosterone). An NHANES-based study (Scinicariello and Buser Citation2016) reported an inverse significant trend for association of TCS with total serum testosterone, but only among male children and not among male adolescents or female participants of any age group. Ihde et al. (Citation2015) observed no statistically significant associations between TCS and urine estrogen metabolite levels in pre-pubertal children.
Thyroid function
Six studies examined the association between TCS and thyroid hormone levels (). Three of these studies were experimental and three were observational. One observational study was based on a cohort of pregnant women in Puerto Rico and the remaining two observational studies were cross sectional.
A single arm Swedish trial (Allmyr et al. Citation2009) examined changes in thyroid hormone concentrations before and after a two-week use of a TCS-containing toothpaste. Plasma TCS levels increased from 0.009–0.81 ng/g before the intervention to 26–296 ng/g at the completion of the trial. Despite this increase in TCS exposure, the levels of thyroid stimulating hormone (TSH), free thyroxine (FT4), and free triiodothyronine (FT3) remained largely unchanged.
Another experimental study was based on the double-blind, randomized, placebo-controlled, CAPS trial (Cullinan et al. Citation2012). Subjects assigned to receive either TCS or placebo toothpaste were compared with respect to changes in TSH, FT3, FT4, and thyroid antibodies at year 1 and year 5 of the trial. Additional analyses also compared the two groups with respect to the percentages of participants whose thyroid hormone values moved outside the reference range. There was no evidence that TCS toothpaste had a deleterious effect on thyroid function. Only one of 31 different analyses demonstrated statistically significant difference between two groups (FT4 at 5 years); however, the difference was opposite of the hypothesized direction with TCS group showing higher levels relative to the placebo group.
The third experimental study in this group was a double-blind, randomized, crossover trial of TCS incorporated in household and personal care products (Poole et al. Citation2016). One of the analyses in that study compared serum TSH and FT4 levels at baseline and at the end of each (TCS and placebo) 4-month interval. No significant effect on either of these markers was found, despite an almost 100-fold difference in TCS exposure between the two study intervals.
Aker et al. (Citation2016) used data from a cohort study of pregnant women in Puerto Rico to examine associations between urinary TCS concentrations measured during three visits at 16–20, 20–24, and 24–28 weeks gestation and serum levels of thyroid hormones at visits 1 and 3. A distinguishing feature of this study is the availability of three TCS measures and two estimates of thyroid hormones. This allowed the authors to conduct longitudinal analyses assessing the association between TCS and each of the thyroid function markers (TSH, FT3, and FT4) across the follow up. Neither the longitudinal analyses nor the cross sectional analyses carried out separately for each visit showed a significant association between TCS and thyroid hormone levels.
The results of the two cross-sectional studies demonstrated greater variability. Geens et al. (Citation2015) measured TCS in urine samples collected at baseline and at 3, 6, and 12 months of follow-up from obese adult patients undergoing weight loss treatment. Serum TSH and FT4 were also measured at each visit. In addition, one-time TCS and thyroid hormone measures were obtained from non-obese volunteers. No associations were observed for TSH. The results for FT4 were inconsistent. There was a significant inverse association with TCS, but this association was only found among all participants or obese women, and not among obese men or non-obese subjects of either sex. For obese women, the association was only present at baseline and at 3 months, but not at the 6 month follow up.
In another cross-sectional study based on the 2007–2008 NHANES data (Koeppe et al. Citation2013), the authors conducted multiple analyses evaluating associations between urinary TCS levels and serum FT3, FT4, TSH, thyroglobulin, and total T3 and T4. Analyses were conducted separately by age and by sex. Only one of 24 reported results (the association between TCS and total T3 among all adolescents) showed a statistically significant departure from the null and the direction of that association was positive, opposite of the hypothesized direction.
Miscellaneous
The studies of miscellaneous health endpoints are presented in . This group included 11 different publications (many already discussed in the previous sections). Four of these publications were clinical trials (Allmyr et al. Citation2009; Cullinan et al. Citation2015a, Citation2015b, Poole et al. Citation2016), two were cohort studies (Watkins et al. Citation2015; Ashley-Martin et al. Citation2016) and the remaining five studies were cross sectional (all NHANES-based). Only two of the studies examined a similar endpoint. A cross-sectional analysis of the 2003–2006 NHANES data (You et al. Citation2011) observed that persons with lower estimated glomerular filtration rate (a measure of kidney function) tended to have lower levels of urinary TCS (a measure of excretion). By contrast, the placebo-controlled trial of TCS toothpaste (Cullinan et al. Citation2015a, Citation2015b) found no evidence that eGFR differed across the two study groups (p = 0.77).
All other endpoints examined in this group of studies varied widely, and for this reason this group cannot be evaluated with respect to consistency or patterns of results. These studies are included in the current review for completeness.
Discussion
In the past two decades, the focus in environmental epidemiology has shifted from chemicals with long physiologic half-lives (e.g. dioxins and polychlorinated biphenyls) to those that are metabolized and/or eliminated within hours or days. Short-lived chemicals present unique challenges for exposure assessment and for study design and interpretation (Goodman et al. Citation2014a; LaKind et al. Citation2014b). TCS is an important short-lived chemical because of widespread human exposure and public concern surrounding its use (http://www.nytimes.com/2013/12/17/health/fda-to-require-proof-that-antibacterial-soaps-are-safe.html). In this review, we systematically examined the body of published epidemiologic literature on TCS and a range of health endpoints. We focused on two aspects of this literature: the quality of the publications as defined by elements in the BEES-C instrument (LaKind et al. Citation2014a, Citation2015b) and – for a given health outcome – the extent to which we observed inter-study and intra-study consistency in terms of specific research questions, methods, results, and reporting.
Quality of the available evidence
One lesson of the current review is the relative paucity of high quality studies capable of providing convincing evidence for or against a causal link between TCS and any of the outcomes studied. Only one study, a randomized cross-over clinical trial (Poole et al. Citation2016) was assigned to Tier 1 for all three domains. Most studies (38 of 43) were assigned to Tier 3 for at least one of the domains.
In conducting a quality assessment of individual studies, we found that problems with the extant literature fall into two main categories: limited ability to establish the relevant temporal relationship between exposure to TCS and outcomes of interest and inadequate exposure assessment increasing the likelihood of misclassification.
Study design and temporal relationship
As the main and perhaps the only inarguable property of a causal link is the temporal relationship between exposure and outcome (Potischman and Weed Citation1999; Rothman and Greenland Citation2005), cross-sectional and other prevalence-based studies are usually inadequate for confirming or refuting causal associations (Adami et al. Citation2011). Most of the studies in this review fall into this category.
Clinical trials may offer unequivocal evidence that the exposure (e.g. via intentional administration of TCS products) truly preceded the outcome (e.g. as measured by a change in hormone levels). On the other hand, clinical trials have a limited ability to address relevant research questions related to long-term outcomes. Moreover, testing hypothesized detrimental effects of TCS in a clinical trial may be unethical, unless there is a demonstrable equipoise between hypothesized harm and potential benefit (Nycum and Reid Citation2007).
When a clinical trial is unethical or not feasible, cohort studies may present the best design option. As TCS exposures vary over time, even cohort studies in which exposure assessment preceded outcome ascertainment may not be able to adequately establish the temporal relationship, thereby limiting causal inferences. Consider, for example, cohort studies that examined the association between prenatal TCS levels and neonatal endpoints (e.g. birth weight, head circumference, or anogenital distance) assessed either at birth or postnatally. Fetal head circumference increases from about 10 to 22 cm between gestational weeks 14 and 24, at a rate of 2.2 cm per week. In the next 10 weeks of gestation, the average head circumference growth rate is around 0.7 cm/week; and for the remainder of a full-term pregnancy (34–40 weeks), the growth slows down further to about 0.5 cm/week (Papageorghiou et al. Citation2014). If a maternal urine sample is obtained in late, rather than early, pregnancy, the resulting measure may miss the most relevant exposure window, and the study may be unable to establish the true temporal relation between the exposure and the outcome.
Exposure assessment
The quality of exposure assessment is a major determinant of the overall quality of any environmental epidemiology study (LaKind et al. Citation2014a). Areas of uncertainty in biomonitoring studies of TCS, or similar short-lived and ubiquitous chemicals, include the integrity of the sample itself as well as the optimal sample number and appropriate timing of sample collection required to adequately assign longer-term exposure status.
As TCS is widespread in the environment, in laboratory settings and even in sample collection equipment (Barr et al. Citation1999; Needham et al. Citation2007; Calafat and Needham Citation2008, Citation2009), studies must include approaches that ensure that samples are not affected by contamination during collection, shipping, storage, and analysis (USEPA Citation2008, Citation2009; Ye et al. Citation2013). This is particularly important for environmental phenols such as bisphenol A, TCS, and some parabens, which may be present in numerous consumer and household products.
Some short-lived chemicals can be broken down by blood enzymes, absorbed by storage containers or degrade when freezing of samples is delayed or if the samples are thawed and re-frozen (Ye et al. Citation2007; Provencher et al. Citation2014). TCS in samples stored at 4 °C and –70 °C has been reported to be stable for up to 7 and 180 days, respectively (Ye et al. Citation2007); to our knowledge, TCS stability outside of these storage parameters has not been explored.
Once converted to the parent compound, it is not possible to distinguish TCS derived from the biological sample and that from environmental contamination (Ye et al. Citation2007). These observations indicate that documentation of analyte stability constitutes an important element of exposure assessment in studies of TCS.
Given the importance of sample integrity to the reliability and quality of the exposure assessment, it is surprising that few of the publications reviewed here documented steps taken to avoid sample contamination or demonstrate analyte stability. For example, Wang et al. (Citation2015) included participants who likely provided urine samples in a health care setting where TCS might have been widely used (MacIsaac et al. Citation2014), yet gave no documentation on efforts taken to prevent sample contamination during collection, shipping, storage, or analysis.
Information showing that TCS levels remained stable from the time of the biological sample collection until the time of laboratory analysis was also not provided in this literature. For example, Lassen et al. (Citation2016) recruited women into their study starting in January 2010 and some samples were not analyzed until December 2012. No information was given on the length of time the samples were maintained at room temperature or whether any assessment of analyte stability was conducted in order to ascertain that two years is an acceptable storage time.
We recognize that certain aspects of study design may not have been included in a publication but were still documented elsewhere (e.g. in laboratory reports). In general, we did not attempt to seek these out but rather relied on what was provided in each publication or associated publication supplement.
Perhaps the most important methodological problem in studies of short-lived chemicals is the use of a single measure as a surrogate for longer-term exposure. Error and the resulting misclassification associated with this approach is well-documented for bisphenol A and several short-lived pesticides (Teeguarden et al. Citation2011; Attfield et al. Citation2014; Morgan et al. Citation2016).
One approach used by the scientific community to assess temporal stability in exposure is to consider the intraclass correlation coefficient, or ICC, for the chemical of interest. The ICC is defined as the proportion of the overall variation in measurements that is explained by differences between the subject distributions (in other words, how much variation is related to within person variability and how much is related to variability between people). ICC values range from zero to one, with a value for the ICC of zero meaning that all variation is due to variability within the subject, and a value of one indicating that all variation is due to variability between subjects. The ICC values are typically divided into three categories, with an ICC <0.40 indicating poor reproducibility, an ICC of 0.40 to <0.75 indicating fair to good reproducibility, and an ICC of 0.75 or greater indicating excellent reproducibility (Fleiss Citation1981; Rosner Citation2000). Researchers will generally assume that an ICC value closer to 1 supports the use of one measurement of a short-lived chemical based on the assumption that the variability within a subject is small (i.e. one measurement represents long-term exposure). As published ICCs for TCS range from approximately 0.3 to 0.9 (), these TCS ICC values suggest reproducibility could be described as either poor, fair or excellent, depending on which published value is used.
Table 10. TCS ICCs in the published literature.
This wide range of ICCs reflects the complications associated with relying on ICC values when exploring intra-individual variability for urinary TCS. For example, as noted by Koch et al. (Citation2014), “In many cases the relatively high ICC values in the current study derived from large between-individual differences in exposure levels rather than from low within-individual variation…” Koch et al. further observe that a single spot sample may “substantially over- or under-represent average exposure to that individual.” Similarly, referring to ICCs of around 0.5–0.6, Philippat et al. (Citation2013) stated: “Although a correlation of this magnitude is greater than reported for many other rapidly metabolized compounds, it may still result in bias due to exposure misclassification if the putative window of susceptibility is distant from the sample collection period… To limit the effects of exposure misclassification, studies of the effects of phenol prenatal exposure on health should try to collect multiple urine samples during pregnancy.”
We further explore issues surrounding the use of the ICC as the foundation for using one measurement to approximate longer term exposures here, and in detail in Supplement 2 of this paper. We ask two questions: How should a particular ICC value be interpreted in terms of misclassification probabilities? What issues ought to be considered when interpreting the ICC that is reported in a given study?
Misclassification probabilities. The following is an illustration from the TCS literature. Lassen et al. (Citation2013) obtained serial measurements of urinary TCS levels in 33 individuals (while raw individual data for the 33 men are not given, data are shown in in the publication). Serial measurements for some of the men showed urinary TCS levels ranging over approximately three orders of magnitude during the 3-month period. Regarding one’s ability to use one urinary measure to assign a study participant to a correct exposure tertile, Lassen et al. found that for men with three serial morning urine measurements, 13 (42%) of the 31 men had all three measurements in the same tertile within three months, while 6% had no measurements in the same tertile. For 24-h urine samples collected over a three month period, only 25% of the men had all three measurements in the same tertile.
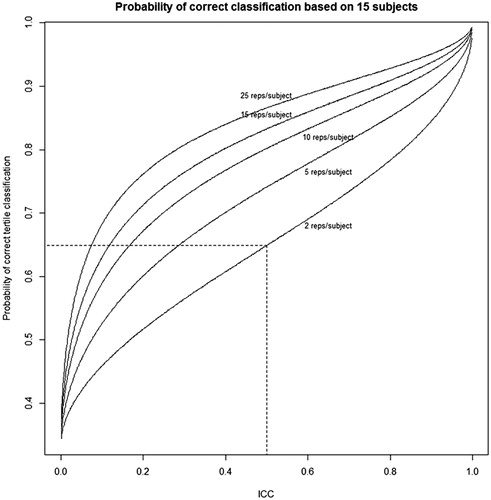
To quantify reproducibility, consider a study in which we obtain urinary chemical measurements for 15 subjects. We can then determine the probability that the subjects are classified in their correct tertiles based on their measurements, depending on the true ICC and the number of measurements per subject. For example, if the true ICC is 0.50, and there are two measurements per subject, the chance that a subject is correctly classified is 64.9% (). When the number of measurements per subject is 25, this proportion becomes 86.6%. In addition, as the true ICC increases, the chance of correctly classifying the tertile of a subject increases. As the ICC approaches one, we should attain correct prediction 100% of the time. At the other extreme, when the ICC is zero, predicting the correct tertile should be equivalent to random guessing, hence a 33⅓% prediction rate. In summary, the lower the value of the true ICC and the fewer the number of urine samples measured, the greater the likelihood that study will incorrectly characterize participants’ exposures. Even for an ICC value that is considered to indicate “good” reproducibility, a large portion of the study population may been misclassified regarding their exposures.
Figure 3. Probability that the sample mean for a subject falls in same tertile as that subject’s true tertile, based on a study of 15 subjects. The probability is dependent on the number of measurements per subject. Each probability is based on a Monte Carlo simulation of the one-way ANOVA model with 100 000 trials.
Issues to be considered when interpreting reported ICCs. It is important to recognize that the ICC itself is based on modeling assumptions. Most researchers estimate ICCs under the one-way ANOVA random effects assumptions, but in fact these assumptions can be violated in a variety of ways. Specifically, measurement distributions can have different variances, they may not have the same shape after accounting for differences in spread, and they may vary over time. It is also important to recall that the ICC is an estimated quantity, and consequently it has a sampling distribution that depends on the numbers of subjects and number of replicate measurements per subject. An additional violation of ANOVA assumptions is that there is reason to expect that concentrations for a subject measured over time will exhibit serial correlation, with pairs of measurements collected at closer times tending to be more similar than pairs measured over longer time gaps. When the ICC estimation is based on measurements that are tightly clustered in time, this can lead to under-estimation of within subject variance, and hence an over-estimate of the ICC. Finally, ignoring covariates that account for between-subject variation is another potential source of over-estimation of the ICC (see Supplement 2).
In summary, the reliance on literature-based ICCs can give false confidence in our ability to properly characterize exposures to short-lived chemicals such as TCS using one measurement. Ultimately, research on temporal variability for an array of population types will need to be conducted. In addition, a discussion on “acceptable” levels of misclassification is needed.
Consistency of methods results and reporting across studies
Replication of findings is crucial for drawing inferences, making regulatory decisions, and developing policy. In the field of clinical medicine, there is consensus that replication of studies, and specifically clinical trials, is required for approval of drugs and medical devices (Berlin and Colditz Citation1999). By contrast, in environmental research most data on humans are observational and thus the conditions within a study are far less controlled.
Compared to their colleagues who perform clinical trials, researchers conducting observational studies have far more leeway in terms of selecting measures of exposure and outcome, choosing statistical methods, and deciding which of the analyses should be reported (Goodman et al. Citation2010). In those circumstances, a systematic weight-of-the-evidence assessment of observational research is only possible if the literature is sufficiently coherent to allow a PI(E)CO review (Centre for Reviews and Dissemination Citation2016).
One of the problems with reviewing the literature on TCS is a lack of clear a priori understanding of its expected effects on human health. Consider the general concern that TCS may act as an endocrine disruptor capable of altering sex hormone function (Dann and Hontela Citation2011). As the concept of “endocrine disruption” may have multiple possible manifestations, an important next step in the assessment of evidence from human studies is to formulate one or more specific hypotheses.
An a priori hypothesis stemming from clinical or basic science evidence may be described as “the cornerstone of any epidemiological inquiry” (LaKind et al. Citation2014a). Studies that rely on data with multiple variables offer an opportunity for multiple simultaneous hypothesis testing, which may increase efficiency, but presents a challenge with respect to proper interpretation of results. For example, data from in vitro assays and results of in vivo animal studies appear to be in disagreement on whether or not TCS is expected to exert androgenic or anti-androgenic activity (Foran et al. Citation2000; Chen et al. Citation2007; Kumar et al. Citation2009; Witorsch Citation2014). Without strong a priori evidence, it may be reasonable to examine two competing hypotheses: (1) higher levels of TCS exposure are associated with higher levels of testosterone in humans and (2) TCS exposure is inversely related to testosterone concentrations. If TCS indeed affects testosterone levels in either direction, a coherent body of human literature, assessed within a PI(E)CO framework, should support one of the two competing hypotheses.
A closer examination of the literature on TCS and testosterone levels shows that a PI(E)CO review is not possible. Three studies measured testosterone levels in relation to TCS exposure, but their methods of data collection, analysis, and reporting were too discordant to allow a side-by-side comparison of results. With respect to the population of interest (P), one study included healthy adult volunteers of both sexes (Poole et al. Citation2016), the other included men with low sperm motility counts and controls whose counts were normal (Den Hond et al. Citation2015), and the third was limited to children and adolescents (Scinicariello and Buser Citation2016). The intervention (I) or exposure (E) categories and the comparison groups (C) also differed across studies. The first study was a cross-over clinical trial that compared intervals of intentional TCS administration to the corresponding no-exposure interval for the same subjects (Poole et al. Citation2016). The second was a cross-sectional study that expressed urine TCS as a natural logarithm-transformed continuous variable (Den Hond et al. Citation2015). The third study also used cross-sectional design, but divided urinary TCS levels into quartiles (Scinicariello and Buser Citation2016). In terms of outcome definitions, the article by Poole et al. (Citation2016) focused on free testosterone (although total testosterone results are available in the Supplementary materials), Scinicariello and Buser (Citation2016) measured total testosterone only, and Den Hond et al. (Citation2015) reported data for both. The analyses also differed across studies. Poole et al. (Citation2016) performed a Wilcoxon test and reported the results as p values only, Den Hond et al. (Citation2015) used linear models and reported regression coefficients and Scinicariello and Buser (Citation2016) expressed their results as ORs for each quartile using the first quartile as the reference category. Moreover, Scinicariello and Buser (Citation2016) reported the association between TCS and total testosterone separately for male children, male adolescents, female children and female adolescents further complicating the inter-study comparisons.
As another example, a recent review of animal studies concluded that TCS administration results in decreased concentrations of T4 in rats (Johnson et al. Citation2016). This observation presents a rare opportunity to examine the human literature with a clear a priori formulated hypothesis that higher levels of TCS exposure should produce lower T4. Three clinical trials addressed this hypothesis. Of those, two studies (Allmyr et al. Citation2009; Poole et al. Citation2016) found no discernable effect of TCS, and one study (Cullinan et al. Citation2012) reported that the T4 changes after 5 years of TCS intervention, although clinically not relevant, were in the opposite of the hypothesized direction when compared to the placebo group. Cullinan et al. (Citation2012) reported that the difference between TCS and placebo arms reflected “reduced levels in the placebo group but no change in the triclosan group.” Based on their results, the authors concluded that “triclosan toothpaste had no detectable effect on thyroid function.” Of the three observational studies addressing the same hypothesis, two (Koeppe et al. Citation2013; Aker et al. Citation2016) reported null results, and one (Geens et al. Citation2015) observed a significant inverse association that was limited to all obese participants and obese women at 0 months and obese women at 3 months.
Similar problems with attempting a PI(E)CO review can be observed with the two available studies on exposure to TCS and time to pregnancy (Velez et al. Citation2015; Smarr et al. Citation2017). The results from these studies were inconsistent, as were the study design and exposure assessment approaches. Regarding exposure, Smarr et al. (Citation2017) measured TCS in a single spot urine sample collected within 2 months of stopping contraception while Velez et al. (Citation2015) used a spot sample collected during the first trimester. Whether these differences impacted the reported measures of association is unknown, but other research has suggested that many factors affect TCS levels in pregnant women (e.g. time of day of urine sample collection, time since previous void, day of the week and season of sample collection, number of previous pregnancies) (Arbuckle et al. Citation2015; Weiss et al. Citation2015) and it is possible that not accounting for these could impact study findings.
When assessing consistency of reported results, it is also important to consider publication bias, defined as the “tendency on the parts of investigators or editors to fail to publish study results on the basis of the direction or strength of the study findings” (Dickersin and Min Citation1993). It has been demonstrated that studies with positive significant results are more likely to be published, and the tendency towards publication bias is more pronounced in observational studies than in clinical trials (Easterbrook et al. Citation1991). It is therefore plausible that the literature on TCS is also affected by publication bias. For example, in performing this review we identified three very similar studies that evaluated the 2011–2012 NHANES data to assess three separate outcomes (oral health, memory problems, and self-reported health status) in relation to urinary levels of heavy metals, phthalates, phenols, thiocyanate, parabens, pesticides, polyaromatic hydrocarbons, and polyfluorinated compounds (Shiue Citation2015a, Citation2015b, Citation2015c). Although all three analyses were based on the same NHANES data and evaluated the same chemicals, only two papers (Shiue Citation2015a, Citation2015b) included results for TCS, although there were over 500 NHANES participants with both TCS exposure and memory problem data.
Another closely related concept is selective within-study reporting defined as “selection on the basis of the results of a subset of the original variables recorded for inclusion in a publication” (Dwan et al. Citation2008). Consider, for example, a study from the French EDEN mother–child cohort (Philippat et al. Citation2014). The study included children of both sexes, but the results were presented for boys only. The number of girls available for analysis was about the same as that for boys and there is little evidence that the proposed mechanisms of effect on fetal growth (e.g. via glucocorticoid or thyroid action) are only relevant to boys. The authors justify exclusion of girls by citing two papers (Wolff et al. Citation2008; Harley et al. Citation2013) as supporting sex-specific effects. However, a closer look at these two papers fails to identify a discernable pattern. In the analyses of birth weight, Wolff et al. (Citation2008) report a significant inverse association for 2,5-dichlorophenol in boys but not in girls, and a positive association for benzophenone-3 among boys, but an inverse association among girls. Harley et al. (Citation2013) report inverse association between bisphenol A and body size at 9 years of age among girls, and no evidence of associations in boys. Taken together, these data do not appear to provide a good reason for limiting analysis or reporting to any particular sex.
As reviewed elsewhere (Kyzas et al. Citation2007), it is a common practice to highlight positive and statistically significant results in the abstract or conclusion sections of articles. Most studies included in the present review reported some positive findings. For example, Lassen et al. (Citation2016) presented 39 different quartile-specific measures of association and 13 measures of associations that treated TCS as a continuous variable. Most results were consistent with the null hypothesis; some were inverse and some were positive. Among four statistically significant ORs, three were inverse, and one was positive. The tests for interaction were not statistically significant, justifying an overall sex-adjusted analysis. The authors concluded that their findings were “compatible with an anti-androgenic effect of prenatal TCS exposure on fetal growth in boys,” but another likely explanation of the observed results is random variation stemming from multiple comparisons.
The above examples illustrate that a narrative review of stated conclusions may leave a false impression that the studies are in agreement. The inconsistencies only become evident when results from different analyses are organized and presented systematically.
Conclusions
Although the available epidemiological literature on TCS included examinations of more than 100 different health endpoints and reported on hundreds of different measures of association, very few studies addressed similar specific research questions and used sufficiently consistent methods to allow a meaningful comparison of results. Of the reported measures of association, most were not significantly different from the null, and the few statistically significant results represented isolated findings without a discernable across- or within-study pattern.
This review indicates that the existing body of epidemiological literature on TCS does not allow a meaningful weight of the evidence assessment due to methodological limitations of individual studies and a lack of inter-study consistency. For this reason, our proposals for future research are focused on ways of improving the primary studies since the quality of the review is inevitably tied to the quality and coherence of the underlying literature.
In designing future research, it is important to take into consideration methodologically stronger studies. For example, studies assessing relatively short-term changes in health biomarkers in response to TCS exposure would benefit from following the example of the existing experimental trials described in this review. If experimental trials are not feasible, future observational studies may consider emulating some of the aspects of existing prospective cohorts, particularly those with the highest quality exposure assessment methods. It is important to point out, however, that the methods of assessing exposure to TCS are a matter of considerable uncertainty due to the overall lack of knowledge on how to properly characterize exposure to short-lived chemicals. While there appears to be a consensus that a one-time spot sample leaves too much room for misclassification, the optimal number and the correct timing of samples required for the state-of-the-art exposure assessment are not known. Further research on best approaches for characterizing exposures to short-lived chemicals with exposures impacted by the time-dependent and product-use variations by humans is needed to address this issue and to allow interpretation of these data to match our analytical capabilities.
One approach would be to conduct studies of the associations between TCS and health outcomes that are preceded by a series of methodological exposure characterization studies that could then inform well-designed epidemiological research. These methodological studies could employ timed sample collection protocols, describe various exposure profiles by measuring peak and background concentrations, and take into consideration variable product use in humans.
In the meantime, the present systematic review demonstrates that the body of published epidemiological literature on TCS is not sufficiently concordant in terms of methodology or results nor is it of sufficient quality to inform WOE assessments. The issues identified here are in no way unique to TCS and are applicable to other chemicals with similar properties. With the growing reliance on human data for public health decision-making, we are at an important juncture in terms of developing guidance for future epidemiological studies capable of producing more conclusive evidence for or against the hypothesis that TCS – or chemicals with similar physico-chemical properties – adversely affect human health.
Declaration of interest
The employment affiliations of the authors are shown on the cover page. The authors have sole responsibility for the writing and content of this paper. LaKind Associates is a private consulting firm specializing in strategic risk management, assessment of human exposures and health risks, biomonitoring, state-of-the-science reviews, and environmental regulatory review; LaKind Associates consults to governmental and private sectors. The academic institutions with which the authors are affiliated are traditional academic institutions. All authors consult to both industry and government and conduct research with industry, government, and academia. The research was supported via funding from Colgate-Palmolive Company to LaKind Associates, with subcontracts to the two other coauthors. Colgate-Palmolive was not involved in the design, collection, management, analysis, or interpretation of the information in the manuscript; or in the preparation of the manuscript. This work is the exclusive professional work product of the three authors. While Colgate-Palmolive had the opportunity to offer comments on the draft manuscript, the findings and conclusions in this manuscript are those of the authors and do not necessarily represent the views of Colgate-Palmolive or any institutions with which the authors are affiliated. None of the authors have appeared in any legal or regulatory proceedings within the past 5 years related to the contents of the paper nor have been engaged to make such appearances in the future.
Supplemental material
Supplemental material for this article is available online here.
Goodman_et_al._Crit_Rev_Toxicol_Supplement_1.pdf
Download PDF (40.2 KB)Goodman_et_al._Crit_Rev_Toxicol_Supplement_2.pdf
Download PDF (201.2 KB)Acknowledgements
The authors thank Dr. Brian Slezak of Colgate-Palmolive for his minor editorial comments on the manuscript. We also thank the six anonymous reviewers selected by the journal Editor for their thoughtful comments on the manuscript.
Additional information
Funding
References
- Adami H-O, Berry CL, Breckenridge CB, Smith LL, Swenberg JA, Trichopoulos D, Weiss NS, Pastoor TP. 2011. Toxicology and epidemiology: improving the science with a framework for combining toxicological and epidemiological evidence to establish causal inference. Toxicol Sci. 122:223–234.
- Adgent MA, Rogan WJ. 2015. Triclosan and prescription antibiotic exposures and enterolactone production in adults. Environ Res. 142:66–71.
- Aker AM, Watkins DJ, Johns LE, Ferguson KK, Soldin OP, Anzalota Del Toro LV, Alshawabkeh AN, Cordero JF, Meeker JD. 2016. Phenols and parabens in relation to reproductive and thyroid hormones in pregnant women. Environ Res. 151:30–37.
- Allmyr M, Panagiotidis G, Sparve E, Diczfalusy U, Sandborgh-Englund G. 2009. Human exposure to triclosan via toothpaste does not change CYP3A4 activity or plasma concentrations of thyroid hormones. Basic Clin Pharmacol Toxicol. 105:339–344.
- Amler RW, Barone S, Jr, Belger A, Berlin CM Jr, Cox C, Frank H, Goodman M, Harry J, Hooper SR, Ladda R, et al. 2006. Hershey Medical Center Technical Workshop Report: optimizing the design and interpretation of epidemiologic studies for assessing neurodevelopmental effects from in utero chemical exposure. NeuroToxicology. 27:861–874.
- Arbuckle TE, Weiss L, Fisher M, Hauser R, Dumas P, Bérubé R, Neisa A, LeBlanc A, Lang C, Ayotte P, et al. 2015. Maternal and infant exposure to environmental phenols as measured in multiple biological matrices. Sci Total Environ. 508:575–584.
- Ashley-Martin J, Dodds L, Arbuckle TE, Marshall J. 2016. Prenatal triclosan exposure and cord blood immune system biomarkers. Int J Hyg Environ Health. 219:454–457.
- Attfield KR, Hughes MD, Spengler JD, Lu C. 2014. Within- and between-child variation in repeated urinary pesticide metabolite measurements over a 1-year period. Environ Health Perspect. 122:201–206.
- Barr DB, Barr JR, Driskell WJ, Hill RH Jr, Ashley DL, Needham LL, Head SL, Sampson EJ. 1999. Strategies for biological monitoring of exposure for contemporary-use pesticides. Toxicol Ind Health. 15:168–179.
- Beasley R, Semprini A, Mitchell EA. 2015. Risk factors for asthma: is prevention possible? Lancet. 386:1075–1085.
- Bellazzi R, Zupan B. 2008. Predictive data mining in clinical medicine: current issues and guidelines. Int J Med Inform. 77:81–97.
- Beran TN, Violato C. 2010. Structural equation modeling in medical research: a primer. BMC Res Notes. 3:267.
- Berlin JA, Colditz GA. 1999. The role of meta-analysis in the regulatory process for foods, drugs, and devices. JAMA. 281:830–834.
- Bertelsen RJ, Engel SM, Jusko TA, Calafat AM, Hoppin JA, London SJ, Eggesbø M, Aase H, Zeiner P, Reichborn-Kjennerud T, et al. 2014. Reliability of triclosan measures in repeated urine samples from Norwegian pregnant women. J Expo Sci Environ Epidemiol. 24:517–521.
- Bertelsen RJ, Longnecker MP, Lovik M, Calafat AM, Carlsen KH, London SJ, Lodrup Carlsen KC. 2013. Triclosan exposure and allergic sensitization in Norwegian children. Allergy. 68:84–91.
- Beyond Pesticides. 2016. Triclosan. Washington (DC). [accessed 2017 July 8]. http://www.beyondpesticides.org/programs/antibacterials/triclosan/fda-2016-decision-and-history.
- Buckley JP, Herring AH, Wolff MS, Calafat AM, Engel SM. 2016. Prenatal exposure to environmental phenols and childhood fat mass in the Mount Sinai Children's Environmental Health Study. Environ Int. 91:350–356.
- Buhl T, Fuchs T, Geier J. 2014. Contact hypersensitivity to triclosan. Ann Allergy Asthma Immunol. 113:119–120.
- Buser MC, Murray HE, Scinicariello F. 2014. Association of urinary phenols with increased body weight measures and obesity in children and adolescents. J Pediatr. 165:744–749.
- Buttke DE, Sircar K, Martin C. 2012. Exposures to endocrine-disrupting chemicals and age of menarche in adolescent girls in NHANES (2003–2008). Environ Health Perspect. 120:1613–1618.
- Calafat AM, Needham LL. 2008. Factors affecting the evaluation of biomonitoring data for human exposure assessment. Int J Androl. 31:139–143.
- Calafat AM, Needham LL. 2009. What additional factors beyond state-of-the-art analytical methods are needed for optimal generation and interpretation of biomonitoring data? Environ Health Perspect. 117:1481–1485.
- Calafat AM, Ye X, Wong L-Y, Reidy JA, Needham LL. 2008. Urinary concentrations of triclosan in the U.S. population: 2003–2004. Environ Health Perspect. 116:303–307.
- CDC (Centers for Disease Control and Prevention). 2013. Laboratory procedure manual. Analyte: benzophenone-3, bisphenol A, 2,4-dichlorophenol, 2,5-dichlorophenol, methyl-, ethyl-, propyl-, and butyl parabens, triclosan. Atlanta (GA): Organic Analytical Toxicology Branch, Division of Laboratory Sciences, National Center for Environmental Health.
- Centre for Reviews and Dissemination. 2016. Guidance notes for registering a systematic review protocol with PROSPERO. York, UK: University of York.
- Chen J, Ahn KC, Gee NA, Gee SJ, Hammock BD, Lasley BL. 2007. Antiandrogenic properties of parabens and other phenolic containing small molecules in personal care products. Toxicol Appl Pharmacol. 221:278–284.
- Chen M, Tang R, Fu G, Xu B, Zhu P, Qiao S, Chen X, Xu B, Qin Y, Lu C, et al. 2013. Association of exposure to phenols and idiopathic male infertility. J Hazard Mater. 250–251:115–121.
- Chevrier C, Petit C, Philippat C, Mortamais M, Slama R, Rouget F, Calafat AM, Ye X, Silva MJ, Charles MA, et al. 2012. Maternal urinary phthalates and phenols and male genital anomalies. Epidemiology. 23:353–356.
- Clayton EM, Todd M, Dowd JB, Aiello AE. 2011. The impact of bisphenol A and triclosan on immune parameters in the U.S. population, NHANES 2003-2006. Environ Health Perspect. 119:390–396.
- Concato J, Feinstein AR, Holford TR. 1993. The risk of determining risk with multivariable models. Ann Intern Med. 118:201–210.
- Cullinan MP, Palmer JE, Carle AD, West MJ, Seymour GJ. 2012. Long term use of triclosan toothpaste and thyroid function. Sci Total Environ. 416:75–79.
- Cullinan MP, Palmer JE, Carle AD, West MJ, Westerman B, Seymour GJ. 2015a. The influence of a triclosan toothpaste on adverse events in patients with cardiovascular disease over 5-years. Sci Total Environ. 508:546–552.
- Cullinan MP, Palmer JE, Faddy MJ, Westerman B, Carle AD, West MJ, Seymour GJ. 2015b. The influence of triclosan on biomarkers of cardiovascular risk in patients in the Cardiovascular and Periodontal Study (CAPS): a randomized controlled trial. J Periodontol. 86:847–855.
- Dann AB, Hontela A. 2011. Triclosan: environmental exposure, toxicity and mechanisms of action. J Appl Toxicol. 31:285–311.
- Den Hond E, Paulussen M, Geens T, Bruckers L, Baeyens W, David F, Dumont E, Loots I, Morrens B, de Bellevaux BN, et al. 2013. Biomarkers of human exposure to personal care products: results from the Flemish Environment and Health Study (FLEHS 2007-2011). Sci Total Environ. 463?464:102–110.
- Den Hond E, Tournaye H, De Sutter P, Ombelet W, Baeyens W, Covaci A, Cox B, Nawrot TS, Van Larebeke N, D'Hooghe T. 2015. Human exposure to endocrine disrupting chemicals and fertility: a case-control study in male subfertility patients. Environ Int. 84:154–160.
- Dickersin K, Min YI. 1993. Publication bias: the problem that won't go away. Ann N Y Acad Sci. 703:135–146.
- Dwan K, Altman DG, Arnaiz JA, Bloom J, Chan AW, Cronin E, Decullier E, Easterbrook PJ, Von Elm E, Gamble C, et al. 2008. Systematic review of the empirical evidence of study publication bias and outcome reporting bias. PLoS One. 3:e3081.
- Easterbrook PJ, Berlin JA, Gopalan R, Matthews DR. 1991. Publication bias in clinical research. Lancet. 337:867–872.
- EU. 2016. Commission Implementing Decision (EU) 2016/110 of 27 January 2016 not approving triclosan as an existing active substance for use in biocidal products for product-type 1; [accessed 2017 July 8]. http://eur-lex.europa.eu/legal-content/EN/TXT/?uri=uriserv%3AOJ.L_.2016.021.01.0086.01.ENG.
- Fleiss J. 1981. Statistical methods for rates and proportions. New York: Wiley.
- Foran CM, Bennett ER, Benson WH. 2000. Developmental evaluation of a potential non-steroidal estrogen: triclosan. Mar Environ Res. 50:153–156.
- Geens T, Dirtu AC, Dirinck E, Malarvannan G, Van Gaal L, Jorens PG, Covaci A. 2015. Daily intake of bisphenol A and triclosan and their association with anthropometric data, thyroid hormones and weight loss in overweight and obese individuals. Environ Int. 76:98–105.
- Geer LA, Pycke BF, Waxenbaum J, Sherer DM, Abulafia O, Halden RU. 2017. Association of birth outcomes with fetal exposure to parabens, triclosan and triclocarban in an immigrant population in Brooklyn, New York. J Hazard Mater. 323(Pt A):177–183.
- Goodman M, LaKind JS, Mattison DR. 2014a. Do phthalates act as obesogens in humans? A systematic review of the epidemiological literature. Crit Rev Toxicol. 44:151–175.
- Goodman M, Mandel JS, DeSesso JM, Scialli AR. 2014b. Atrazine and pregnancy outcomes: a systematic review of epidemiologic evidence. Birth Defects Res B Dev Reprod Toxicol. 101:215–236.
- Goodman M, Squibb K, Youngstrom E, Anthony LG, Kenworthy L, Lipkin PH, Mattison DR, LaKind JS. 2010. Using systematic reviews and meta-analyses to support regulatory decision making for neurotoxicants: lessons learned from a case study of PCBs. Environ Health Perspect. 118:727–734.
- Greenland S. 1996. Basic methods for sensitivity analysis of biases. Int J Epidemiol. 25:1107–1116.
- Guyatt GH, Haynes RB, Jaeschke RZ, Cook DJ, Green L, Naylor CD, Wilson MC, Richardson WS. 2000a. Users' Guides to the Medical Literature: XXV. Evidence-based medicine: principles for applying the Users' Guides to patient care. Evidence-Based Medicine Working Group. JAMA. 284:1290–1296.
- Guyatt GH, Naylor D, Richardson WS, Green L, Haynes RB, Wilson MC, Cook DJ, Jaeschke RZ. 2000b. What is the best evidence for making clinical decisions? JAMA. 284:3127–3128.
- Harley KG, Schall RA, Chevrier J, Tyler K, Aguirre H, Bradman A, Holland NT, Lustig RH, Calafat AM, Eskenazi B. 2013. Prenatal and postnatal bisphenol A exposure and body mass index in childhood in the CHAMACOS cohort. Environ Health Perspect. 121:514–520.
- Health Canada. 2015. Third report on human biomonitoring of environmental chemicals in Canada. Ottawa: Minister of Health; [accessed 2016 Dec 19]. https://www.canada.ca/en/health-canada/services/environmental-workplace-health/reports-publications/environmental-contaminants/third-report-human-biomonitoring-environmental-chemicals-canada.html.
- Hernan MA, Hernandez-Diaz S, Werler MM, Mitchell AA. 2002. Causal knowledge as a prerequisite for confounding evaluation: an application to birth defects epidemiology. Am J Epidemiol. 155:176–184.
- Ihde ES, Loh JM, Rosen L. 2015. Association of environmental chemicals & estrogen metabolites in children. BMC Endocr Disord. 15:83.
- Johnson PI, Koustas E, Vesterinen HM, Sutton P, Atchley DS, Kim AN, Campbell M, Donald JM, Sen S, Bero L, et al. 2016. Application of the navigation guide systematic review methodology to the evidence for developmental and reproductive toxicity of triclosan. Environ Int. 92–93:716–728.
- Kahan BC, Rehal S, Cro S. 2015. Risk of selection bias in randomised trials. Trials. 16:405.
- Koch HM, Aylward LL, Hays SM, Smolders R, Moos RK, Cocker J, Jones K, Warren N, Levy L, Bevan R. 2014. Inter- and intra-individual variation in urinary biomarker concentrations over a 6-day sampling period. Part 2: personal care product ingredients. Toxicol Lett. 231:261–269.
- Koeppe ES, Ferguson KK, Colacino JA, Meeker JD. 2013. Relationship between urinary triclosan and paraben concentrations and serum thyroid measures in NHANES 2007–2008. Sci Total Environ. 445–446:299–305.
- Kumar V, Chakraborty A, Kural MR, Roy P. 2009. Alteration of testicular steroidogenesis and histopathology of reproductive system in male rats treated with triclosan. Reprod Toxicol. 27:177–185.
- Kyzas PA, Denaxa-Kyza D, Ioannidis JP. 2007. Almost all articles on cancer prognostic markers report statistically significant results. Eur J Cancer. 43:2559–2579.
- LaKind JS, Goodman M, Barr DB, Weisel CP, Schoeters G. 2015b. Lessons learned from the application of BEES-C: systematic assessment of study quality of epidemiologic research on BPA, neurodevelopment, and respiratory health. Environ Int. 80:41–71.
- LaKind JS, Goodman M, Makris SL, Mattison DR. 2015a. Improving concordance in environmental epidemiology: a three-part proposal. J Toxicol Environ Health B Crit Rev. 18:105–120.
- LaKind JS, Goodman M, Mattison DR. 2014b. Bisphenol A and indicators of obesity, glucose metabolism/type 2 diabetes and cardiovascular disease: a systematic review of epidemiologic research. Crit Rev Toxicol. 44:121–150.
- LaKind JS, Goodman M, Naiman DQ. 2012. Use of NHANES data to link chemical exposures to chronic diseases: a cautionary tale. PLoS One. 7:e51086.
- LaKind JS, Sobus JR, Goodman M, Barr DB, Fürst P, Albertini RJ, Arbuckle TE, Schoeters G, Tan Y-M, Teeguarden J, et al. 2014a. A proposal for assessing study quality: biomonitoring, Environmental Epidemiology, and Short-Lived Chemicals (BEES-C) Instrument. Environ Int. 73C:195–207.
- Lankester J, Patel C, Cullen MR, Ley C, Parsonnet J. 2013. Urinary triclosan is associated with elevated body mass index in NHANES. PLoS One. 8:e80057.
- Lassen TH, Frederiksen H, Jensen TK, Petersen JH, Main KM, Skakkebæk NE, Jørgensen N, Kranich SK, Andersson AM. 2013. Temporal variability in urinary excretion of bisphenol A and seven other phenols in spot, morning, and 24-h urine samples. Environ Res. 126:164–170.
- Lassen TH, Frederiksen H, Kyhl HB, Swan SH, Main KM, Andersson AM, Lind DV, Husby S, Wohlfahrt-Veje C, Skakkebaek NE, et al. 2016. Prenatal triclosan exposure and anthropometric measures including anogenital distance in Danish infants. Environ Health Perspect. 124:1261–1268.
- Li S, Zhao J, Wang G, Zhu Y, Rabito F, Krousel-Wood M, Chen W, Whelton PK. 2015. Urinary triclosan concentrations are inversely associated with body mass index and waist circumference in the US general population: experience in NHANES 2003–2010. Int J Hyg Environ Health. 218:401–406.
- Liberati A, Altman DG, Tetzlaff J, Mulrow C, Gøtzsche PC, Ioannidis JP, Clarke M, Devereaux PJ, Kleijnen J, Moher D. 2009. The PRISMA statement for reporting systematic reviews and meta-analyses of studies that evaluate health care interventions: explanation and elaboration. J Clin Epidemiol. 62:e1–e34.
- MacIsaac JK, Gerona RR, Blanc PD, Apatira L, Friesen MW, Coppolino M, Janssen S. 2014. Health care worker exposures to the antibacterial agent triclosan. J Occup Environ Med. 56:834–839.
- Meeker JD, Cantonwine DE, Rivera-González LO, Ferguson KK, Mukherjee B, Calafat AM, Ye X, Anzalota Del Toro LV, Crespo-Hernández N, Jiménez-Vélez B, et al. 2013. Distribution, variability, and predictors of urinary concentrations of phenols and parabens among pregnant women in Puerto Rico. Environ Sci Technol. 47:3439–3447.
- Morgan MK, Sobus JR, Barr DB, Croghan CW, Chen FL, Walker R, Alston L, Andersen E, Clifton MS. 2016. Temporal variability of pyrethroid metabolite levels in bedtime, morning, and 24-h urine samples for 50 adults in North Carolina. Environ Res. 144:81–91.
- NAS (National Academy of Sciences). 2014. Review of EPA's Integrated Risk Information System (IRIS). Process Committee to Review the IRIS Process; Board on Environmental Studies and Toxicology; Division on Earth and Life Studies; National Research Council. 78-0-309-30414-6.
- National Research Council (NRC). 2006. Human biomonitoring for environmental chemicals. Washington (DC): The National Academies Press.
- Needham LL, Calafat AM, Barr DB. 2007. Uses and issues of biomonitoring. Int J Hyg Environ Health. 210:229–238.
- Nycum G, Reid L. 2007. The harm-benefit tradeoff in “bad deal” trials. Kennedy Inst Ethics J. 17:321–350.
- OHAT (Office of Health Assessment and Translation). 2015. Handbook for conducting a literature-based health assessment using OHAT approach for systematic review and evidence integration. Research Triangle Park (NC): National Toxicology Program, National Institute of Environmental Health Sciences.
- Papageorghiou AT, Ohuma EO, Altman DG, Todros T, Ismail LC, Lambert A, Jaffer YA, Bertino E, Gravett MG, Purwar M, et al. 2014. International standards for fetal growth based on serial ultrasound measurements: the Fetal Growth Longitudinal Study of the INTERGROWTH-21st Project. The Lancet. 384:869–879.
- Pearce N. 2012. Classification of epidemiological study designs. Int J Epidemiol. 41:393–397.
- Petticrew M, Roberts H. 2003. Evidence, hierarchies, and typologies: horses for courses. J Epidemiol Community Health. 57:527–529.
- Philippat C, Botton J, Calafat AM, Ye X, Charles MA, Slama R, ES Group. 2014. Prenatal exposure to phenols and growth in boys. Epidemiology. 25:625–635.
- Philippat C, Mortamais M, Chevrier C, Petit C, Calafat AM, Ye X, Silva MJ, Brambilla C, Pin I, Charles MA, et al. 2012. Exposure to phthalates and phenols during pregnancy and offspring size at birth. Environ Health Perspect. 120:464–470.
- Philippat C, Wolff MS, Calafat AM, Ye X, Bausell R, Meadows M, Stone J, Slama R, Engel SM. 2013. Prenatal exposure to environmental phenols: concentrations in amniotic fluid and variability in urinary concentrations during pregnancy. Environ Health Perspect. 121:1225–1231.
- Pleil JD, Sobus JR. 2013. Estimating lifetime risk from spot biomarker data and intraclass correlation coefficients (ICC). J Toxicol Environ Health A. 76:747–766.
- Poole AC, Pischel L, Ley C, Suh G, Goodrich JK, Haggerty TD, Ley RE, Parsonnet J. 2016. Crossover control study of the effect of personal care products containing triclosan on the microbiome. mSphere. 1:e00056-15.
- Potischman N, Weed DL. 1999. Causal criteria in nutritional epidemiology. Am J Clin Nutr. 69:1309S–1314S.
- Preau JL, Jr, Wong LY, Silva MJ, Needham LL, Calafat AM. 2010. Variability over 1 week in the urinary concentrations of metabolites of diethyl phthalate and di(2-ethylhexyl) phthalate among eight adults: an observational study. Environ Health Perspect. 118:1748–1754.
- Provencher G, Bérubé R, Dumas P, Bienvenu JF, Gaudreau E, Bélanger P, Ayotte P. 2014. Determination of bisphenol A, triclosan and their metabolites in human urine using isotope-dilution liquid chromatography–tandem mass spectrometry. J Chromatogr A. 1348:97–104.
- Roberts C, Torgerson D. 1998. Randomisation methods in controlled trials. BMJ. 317:1301.
- Rooney AA, Boyles AL, Wolfe MS, Bucher JR, Thayer KA. 2014. Systematic review and evidence integration for literature-based environmental health science assessments. Environ Health Perspect. 122:711–718.
- Rosner B. 2000. Fundamentals of biostatistics. 5th ed. Pacific Grove (CA): Duxbury.
- Rothman KJ, Greenland S. 1998. Modern epidemiology. Philadelphia (PA): Lippincott Williams and Wilkins.
- Rothman KJ, Greenland S. 2005. Causation and causal inference in epidemiology. Am J Public Health. 95 Suppl 1:S144–S150.
- Savage JH, Johns CB, Hauser R, Litonjua AA. 2014. Urinary triclosan levels and recent asthma exacerbations. Ann Allergy Asthma Immunol. 112:179–181e172.
- Savage JH, Matsui EC, Wood RA, Keet CA. 2012. Urinary levels of triclosan and parabens are associated with aeroallergen and food sensitization. J Allergy Clin Immunol. 130:453–460e457.
- Scinicariello F, Buser MC. 2016. Serum testosterone concentrations and urinary bisphenol A, benzophenone-3, triclosan, and paraben levels in male and female children and adolescents: NHANES 2011–2012. Environ Health Perspect. 124:1898–1904.
- Shea BJ, Grimshaw JM, Wells GA, Boers M, Andersson N, Hamel C, Porter AC, Tugwell P, Moher D, Bouter LM. 2007. Development of AMSTAR: a measurement tool to assess the methodological quality of systematic reviews. BMC Med Res Methodol. 7:10.
- Shiue I. 2015c. Arsenic, heavy metals, phthalates, pesticides, hydrocarbons and polyfluorinated compounds but not parabens or phenols are associated with adult remembering condition: US NHANES, 2011–2012. Environ Sci Pollut Res. 22:6381–6386.
- Shiue I. 2015a. Urinary arsenic, heavy metals, phthalates, pesticides, polyaromatic hydrocarbons but not parabens, polyfluorinated compounds are associated with self-rated health: USA NHANES, 2011–2012. Environ Sci Pollut Res Int. 22:9570–9574.
- Shiue I. 2015b. Urinary heavy metals, phthalates, phenols, thiocyanate, parabens, pesticides, polyaromatic hydrocarbons but not arsenic or polyfluorinated compounds are associated with adult oral health: USA NHANES, 2011–2012. Environ Sci Pollut Res Int. 22:15636–15645.
- Smarr MM, Sundaram R, Honda M, Kannan K, Buck Louis GM. 2017. Urinary concentrations of parabens and other antimicrobial chemicals and their association with couples' fecundity. Environ Health Perspect. 125:730–736.
- Spanier AJ, Fausnight T, Camacho TF, Braun JM. 2014. The associations of triclosan and paraben exposure with allergen sensitization and wheeze in children. Allergy Asthma Proc. 35:475–481.
- Teeguarden JG, Calafat AM, Ye X, Doerge DR, Churchwell MI, Gunawan R, Graham MK. 2011. Twenty-four hour human urine and serum profiles of bisphenol a during high-dietary exposure. Toxicol Sci. 123:48–57.
- Teitelbaum SL, Britton JA, Calafat AM, Ye X, Silva MJ, Reidy JA, Galvez MP, Brenner BL, Wolff MS. 2008. Temporal variability in urinary concentrations of phthalate metabolites, phytoestrogens and phenols among minority children in the United States. Environ Res. 106:257–269.
- USEPA (US Environmental Protection Agency). 2008. National functional guidelines for superfund organic methods data review. OSWER 9240.1-48 USEPA-540-R-08-01; [accessed 2016 Dec 17]. http://nepis.epa.gov/Exe/ZyPURL.cgi?Dockey=P100C7ST.TXT.
- USEPA (US Environmental Protection Agency). 2009. Region III fact sheet quality control tools: blanks; [accessed 2016 Dec 17]. https://www.epa.gov/sites/production/files/2015-06/documents/blanks.pdf.
- USEPA (US Environmental Protection Agency). 2010. Framework document: DRAFT framework for incorporating human epidemiologic & incident data in health risk assessment; [accessed 2016 Dec 19]. https://www.regulations.gov/document?D=EPA-HQ-OPP-2009-0851-0004.
- USEPA (US Environmental Protection Agency). 2016. Glyphosate issue paper: evaluation of carcinogenic potential EPA’s Office of Pesticide Programs.
- USFDA (US Food and Drug Administration). 2016. FDA issues final rule on safety and effectiveness of antibacterial soaps; [accessed 2016 July 8]. https://www.fda.gov/newsevents/newsroom/pressannouncements/ucm517478.htm.
- Velez MP, Arbuckle TE, Fraser WD. 2015. Female exposure to phenols and phthalates and time to pregnancy: the Maternal-Infant Research on Environmental Chemicals (MIREC) Study. Fertil Steril. 103:1011–1020e1012.
- Wang X, Chen X, Feng X, Chang F, Chen M, Xia Y, Chen L. 2015. Triclosan causes spontaneous abortion accompanied by decline of estrogen sulfotransferase activity in humans and mice. Sci Rep. 5:18252.
- Watkins DJ, Ferguson KK, Anzalota Del Toro LV, Alshawabkeh AN, Cordero JF, Meeker JD. 2015. Associations between urinary phenol and paraben concentrations and markers of oxidative stress and inflammation among pregnant women in Puerto Rico. Int J Hyg Environ Health. 218:212–219.
- Weiss L, Arbuckle TE, Fisher M, Ramsay T, Mallick R, Hauser R, LeBlanc A, Walker M, Dumas P, Lang C. 2015. Temporal variability and sources of triclosan exposure in pregnancy. Int J Hyg Environ Health. 218:507–513.
- Wielgomas B. 2013. Variability of urinary excretion of pyrethroid metabolites in seven persons over seven consecutive days—implications for observational studies. Toxicol Lett. 221:15–22.
- Witorsch RJ, Thomas JA. 2010. Personal care products and endocrine disruption: a critical review of the literature. Crit Rev Toxicol. 40:1–30.
- Witorsch RJ. 2014. Critical analysis of endocrine disruptive activity of triclosan and its relevance to human exposure through the use of personal care products. Crit Rev Toxicol. 44:535–555.
- Wolff MS, Engel SM, Berkowitz GS, Ye X, Silva MJ, Zhu C, Wetmur J, Calafat AM. 2008. Prenatal phenol and phthalate exposures and birth outcomes. Environ Health Perspect. 116:1092–1097.
- Wolff MS, Teitelbaum SL, McGovern K, Pinney SM, Windham GC, Galvez M, Pajak A, Rybak M, Calafat AM, Kushi LH, et al. 2015. Environmental phenols and pubertal development in girls. Environ Int. 84:174–180.
- Wolff MS, Teitelbaum SL, Pinney SM, Windham G, Liao L, Biro F, Kushi LH, Erdmann C, Hiatt RA, Rybak ME, et al. 2010. Investigation of relationships between urinary biomarkers of phytoestrogens, phthalates, and phenols and pubertal stages in girls. Environ Health Perspect. 118:1039–1046.
- Xue J, Wu Q, Sakthivel S, Pavithran PV, Vasukutty JR, Kannan K. 2015. Urinary levels of endocrine-disrupting chemicals, including bisphenols, bisphenol A diglycidyl ethers, benzophenones, parabens, and triclosan in obese and non-obese Indian children. Environ Res. 137:120–128.
- Ye X, Bishop AM, Reidy JA, Needham LL, Calafat AM. 2007. Temporal stability of the conjugated species of bisphenol A, parabens, and other environmental phenols in human urine. J Expo Sci Environ Epidemiol. 17:567–572.
- Ye X, Zhou X, Hennings R, Kramer J, Calafat AM. 2013. Potential external contamination with bisphenol A and other ubiquitous organic environmental chemicals during biomonitoring analysis: an elusive laboratory challenge. Environ Health Perspect. 121:283–286.
- You L, Zhu X, Shrubsole MJ, Fan H, Chen J, Dong J, Hao CM, Dai Q. 2011. Renal function, bisphenol A, and alkylphenols: results from the National Health and Nutrition Examination Survey (NHANES 2003–2006). Environ Health Perspect. 119:527–533.
- Youngstrom E, Kenworthy L, Lipkin PH, Goodman M, Squibb K, Mattison DR, Anthony LG, Makris SL, Bale A, Raffaele KC, et al. 2011. A proposal to facilitate weight-of-evidence assessments: harmonization of neurodevelopmental environmental epidemiology studies (HONEES). Neurotoxicol Teratol. 33:354–359.
- Yueh MF, Tukey RH. 2016. Triclosan: a widespread environmental toxicant with many biological effects. Annu Rev Pharmacol Toxicol. 56:251–272.
- Zhu W, Zhang H, Tong C, Xie C, Fan G, Zhao S, Yu X, Tian Y, Zhang J. 2016. Environmental exposure to triclosan and semen quality. Int J Environ Res Public Health. 13:224.