
Abstract
Cosmetics Europe, the European Trade Association for the cosmetics and personal care industry, is conducting a multi-phase program to develop regulatory accepted, animal-free testing strategies enabling the cosmetics industry to conduct safety assessments. Based on a systematic evaluation of test methods for skin sensitization, five non-animal test methods (DPRA (Direct Peptide Reactivity Assay), KeratinoSensTM, h-CLAT (human cell line activation test), U-SENSTM, SENS-IS) were selected for inclusion in a comprehensive database of 128 substances. Existing data were compiled and completed with newly generated data, the latter amounting to one-third of all data. The database was complemented with human and local lymph node assay (LLNA) reference data, physicochemical properties and use categories, and thoroughly curated. Focused on the availability of human data, the substance selection resulted nevertheless resulted in a high diversity of chemistries in terms of physico-chemical property ranges and use categories. Predictivities of skin sensitization potential and potency, where applicable, were calculated for the LLNA as compared to human data and for the individual test methods compared to both human and LLNA reference data. In addition, various aspects of applicability of the test methods were analyzed. Due to its high level of curation, comprehensiveness, and completeness, we propose our database as a point of reference for the evaluation and development of testing strategies, as done for example in the associated work of Kleinstreuer et al. We encourage the community to use it to meet the challenge of conducting skin sensitization safety assessment without generating new animal data.
Introduction
Skin sensitization is one of the key adverse effects to be addressed in the human hazard characterization and risk assessment of chemicals and cosmetic ingredients. Skin sensitization, is the first step in the development of allergic contact dermatitis (ACD). It is induced when dermal exposure occurs at sufficient levels to result in T-cell activation and proliferation. ACD is then elicited with subsequent dermal exposures. The adverse effect is triggered during elicitation by a response of the immune system, resulting in dermal symptoms of ACD, including erythema formation, itching, and burning (Kimber et al. Citation2002).
Traditionally, the skin sensitization potential of substances has been addressed by using animal models, ranging from guinea pig models (Buehler Citation1965; Magnusson and Kligman Citation1969; OECD Citation1992) to the murine LLNA (OECD Citation2010). The LLNA quantifies the induction phase of the response by measuring lymphocyte proliferation as a predictive biomarker of skin sensitization (Kimber et al. Citation1994). In addition, it derives an EC3 (the test substance concentration inducing a three-fold proliferation compared to concurrent vehicle-treated controls) as a measure of relative potency, which is inversely proportional to the potency of a skin sensitizer (Basketter et al. Citation2000; Gerberick et al. Citation2007; Loveless et al. Citation2010).
An increasing political and ethical demand to replace animal experiments resulted in the regulatory requirement in Europe to assess the safety of cosmetic ingredients without testing on animals (EU Citation2009). Moreover, a recent amendment of the industrial chemical regulation explicitly requests information on skin sensitization from non-animal test methods and prescribes that animal testing can only be conducted if the non-animal methods are not applicable or the obtained results are inadequate for classification and risk assessment purposes (EU Citation2016). Alongside these political developments, the OECD has summarized the detailed understanding of the biological mechanism of skin sensitization (Vandebriel and van Loveren Citation2010) by structuring the various biological steps in the process into an Adverse Outcome Pathway (AOP). The four key events (KE); covalent binding to skin proteins (KE1), keratinocyte responses (KE2), activation of dendritic cells (KE3), and T-cell proliferation (KE4) that lead to the adverse outcome of allergic contact dermatitis/contact hypersensitivity have been described (OECD Citation2012). In addition, general and skin sensitization-specific guidance documents have been published to support structuring of information derived via integrated approaches to testing and assessment (IATA), key elements of which are defined approaches with fixed data interpretation procedures (OECD Citation2016a, Citation2016b). A number of non-animal test methods, addressing one or more of the first three key events, are currently at different stages of development. Some methods are in the phase of optimization and standardization (Hennen and Blömeke Citation2016), others, such as SENS-IS and GARD, while others are undergoing validation or peer review (Teunis et al. Citation2013; Cottrez et al. Citation2016; Forreryd et al. Citation2016). So far, five test methods have completed this process and have achieved this acceptance: (1) the Direct Peptide Reactivity Assay (DPRA), an in chemico test method that addresses KE1 by measuring depletion of synthetic peptides (Gerberick et al. Citation2004; OECD Citation2015a), (2) the KeratinoSens™, an in vitro assay that is based on the activation of the Keap1-Nrf2-ARE pathway and addresses KE2 (Emter et al. Citation2010; OECD 2015 b), and three in vitro assay measuring biomarkers of dendritic cell activation and thus addressing KE3 (OECD Citation2017), i.e. the human cell line activation test (h-CLAT) (Ashikaga et al. Citation2006), the U937 cell line activation test (U-SENSTM) (Alépée et al. Citation2015) and the IL-8 Luc assay (Kimura et al. Citation2015). The landscape of non-animal test methods for skin sensitization also includes methods similar to or improving on existing ones: the LuSens method is closely related to the KeratinoSensTM and the Peroxidase Peptide Reactivity Assay (PPRA) is a refined version of the DRPA, i.e. by using liquid chromatography and tandem mass spectrometry, and by introducing oxidative capacity via the addition of horseradish peroxidase (Gerberick et al. Citation2009; Ramirez et al. Citation2016). Note that, despite considerable efforts, no sufficiently standardized non-animal test methods are currently available to address the KE 4 of T-cell proliferation for the purpose of skin sensitization assessment (van Vliet et al. Citation2017).
For the cosmetic industry, this demand for replacement comprises the specific challenge of conducting risk assessment. In response, Cosmetic Europe has set-up a four-step scientific program to achieve regulatory accepted animal free testing strategies that enable the cosmetic industry to conduct skin sensitization safety assessments, if possible by 2020. In the first phase, we have reviewed and evaluated many of the existing test methods (Reisinger et al. Citation2015). While continuously observing new developments, we prioritized the five test methods DPRA, KeratinoSens™, h-CLAT, U-SENS™, and SENS-IS for the second phase of our program, i.e. to evaluate and possibly to amend existing testing strategies for skin sensitization. Alongside with this effort, we explored human data as a reference for assessing the predictivity of individual test methods and testing strategies (Basketter et al. Citation2014), potentially reducing the uncertainty introduced by the use of animal data in human risk assessment.
The results of the second phase of the program are summarized here and in Kleinstreuer et al. (Citation2018). In this work, we present a database compiled of existing and newly generated data of the test methods together with LLNA and human reference data for 128 substances. We describe the database in detail and make use of it to evaluate the individual test methods’ predictivity and aspects of applicability in a harmonized way. Kleinstreuer et al. (Citation2018) complement these evaluations by assessing the twelve defined approaches and IATA for skin sensitization that have been proposed to the OECD as case studies (OECD Citation2016c; Ezendam et al. Citation2016). In particular, the predictive performance of six of these approaches using the information held within our database was analyzed.
In the third phase of Cosmetic Europe’s program, the database will be expanded with substance of high relevance for the cosmetic industry, such as hair dyes and UV filters, whereas in the fourth phase risk assessment approaches exclusively based on non-animal data will be developed.
With our work presented here, we aim to advance the understanding of strengths and weaknesses of test methods and defined approaches and inform the assessments of variability, applicability domains, and uncertainties. Such knowledge is indispensable for developing a comprehensive and modern safety assessment approach for skin sensitization.
Materials and methods
Substance selection
The primary substance selection criterion for inclusion in our database was the availability of human data and associated potency categorization according to Basketter et al. (Citation2014). Another pre-requirement was the availability of LLNA data, preferably accompanied by information on the maximum dose tested and the solvent/vehicle used. In addition, the substances needed to be commercially available in a sufficient quantity for testing. Metals and metal-containing substances were excluded because of their very limited relevance for the development of new cosmetic ingredients. Of the 131 substances in Basketter et al. (Citation2014), 98 fulfilled the selection criteria. Using the same selection criteria, further 30 eligible fragrances were identified in collaboration with the Research Institute for Fragrance Materials (RIFM), resulting in a total of 128 selected substances.
Description of the selected substances
Substances were assigned to primary use categories (fragrances, preservatives, actives (e.g. acrylates), surfactants, dyes, pharmaceuticals, UV filters, other cosmetic use, or no cosmetic use) according to their main historical or actual use in cosmetic products, where applicable. In addition, chemical categories data were retrieved from the CPCat (Chemical and Product Categories) Database of the U.S. EPA (http://actor.epa.gov/cpcat; accessed on January 3, 2017) to more broadly describe the use categories covered (Dionisio et al. Citation2015). Substances were assigned to one or several use categories as defined in the Aggregated Computational Toxicology Resource (ACToR) database.
Where possible (i.e. excluding the natural extracts), the molecular structures of the substances were expressed in Daylight SMILES format (see Supplemental Table 1). Data on six physicochemical properties related to skin penetration and skin protein binding, i.e. octanol-water partition coefficient (LogP), water solubility (LogS), melting point (MP), boiling point (BP), vapor pressure (LogVP) and molecular weight (MW) were collated. If experimental measurements were not available in the Estimation Program Interface (EPI) Suite Data, a publicly available data source (http://esc.syrres.com/interkow/EPiSuiteData.htm; accessed January 3, 2017), these properties were predicted using quantitative structure–property relationship (QSPR) models (Zang et al. Citation2017).
Mechanistic domains of chemical reactions were extracted in a sequential manner from Roberts et al. (Citation2007a, Citation2007b) and Urbisch et al. (Citation2015). For substances not included in any of these three references or with multiple assigned domains, the protein binding alerts for skin sensitization in the OECD QSAR toolbox 4.1 (freely available at www.qsartoolbox.org) and the skin sensitization reactivity domains of Toxtree v2.6.13 (freely available at www.toxtree.sourceforge.net) were obtained (Patlewicz et al. Citation2008). In cases when either the OECD QSAR toolbox or Toxtree predicted a domain and the other model did not, the predicted domain was used. In addition, it is indicated if a substance has been reported to require (metabolic) activation in the skin (pro-hapten) or external activation (pre-hapten) by Patlewicz et al. (Citation2016) or by Urbisch et al. (Citation2015). Structurally, the substances were characterized by investigating the occurrences of important structural or functional groups by inspection (data not shown, but presented in the Supplemental Table 1, worksheet 4).
Non-animal test method data was collated from the literature and completed with newly generated data, the latter amounting to approximately one-third of all data. Substances that were newly tested were either obtained from Sigma-Aldrich (Milan, Italy; Hamburg, Germany) with an average purity of 98%, where applicable, or, in case of the fragrances identified in collaboration with RIFM, directly from the suppliers (in commercial quality).
For the existing data, (im-)purities of the substances are largely unknown. We acknowledge that sensitizing impurities might lead to false positive results in any test method. However, it can reasonably be assumed that these cases are rare and thus of limited impact, and require substance-specific discussion, which are beyond scope here.
In vivo reference data
Human
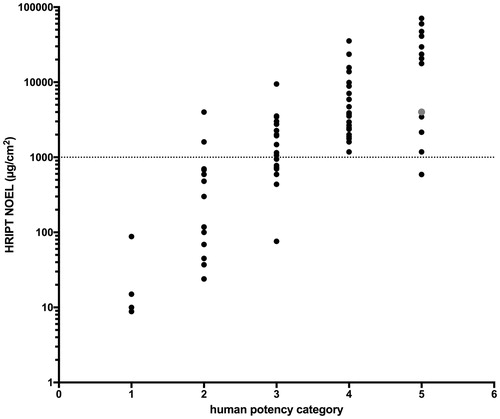
Human data and the resulting human potency category for 98 substances were available from Basketter et al. (Citation2014) and for additional 30 fragrances from Api et al. (Citation2017). The human evidence comprised of data from human maximization tests (HMT) and human repeat insult patch tests (HRIPT) and diagnostic patch test (DPT) data. In addition, use information, especially annual volumes, but also typical maximum use levels, has been used for some fragrances. The relevant information was collected by exploiting various sources, such as standard contact dermatitis textbooks and the dermatological literature. Whilst Basketter et al. (Citation2014) describe criteria for translation of the available evidence into six potency categories, Api et al. (Citation2017) provide a comprehensive table that summarizes how the human evidence is used to assign substances to the six potency categories, with categories 5 and 6 being basically non-sensitizers and categories 1–4 being sensitizers ranging from extreme to weak. In brief, a preliminary category is determined based on no observed effect levels (NOEL) from HRIPT or HMT, accounting for information on dose-response. This preliminary category is subsequently refined by DPT data accounting for the amount and severity of the clinical data and for some fragrances by the use information, primarily by relating it to the frequency of positive DPT (Api et al. Citation2017). Through this procedure, direct human induction (HRIPT) and pre-clinical induction data (LLNA) have been combined with human clinical data, building on an approach of translating clinical data into a frequency of contact allergy in a general population (Thyssen et al. Citation2009). The impact of the modifications becomes evident when correlating the HRIPT NOEL of the 128 substances, where available in Basketter et al. (Citation2014) and Api et al. (Citation2017), with the human categories (). For example, the potency category of α-methyl-1,3-benzodioxole-5-propionaldehyde, which has an HRIPT NOEL of 4016 µg/cm2 (grey dot in ), has been modified from category 4 to 5 based on the substantially higher HRIPT lowest observed effect level (LOEL) of 15 000 µg/cm2, which is supported by an HMT NOEL of 13 800 µg/cm2, and few positive DPT data, despite a high annual use volume (Api et al. Citation2017).
Figure 1. HRIPT no observed effect levels (NOEL) as µg/cm2 for the human potency categories for 79 substances, for which Basketter et al. (Citation2014) or Api et al. (Citation2017) reported NOEL.
While the categorization process is transparently described, it is acknowledged, depending on the amount, quality, and consistency of the available evidence, expert judgment is required.
LLNA
Existing LLNA data were available for all 128 substances. These data were collected from the literature, the NICEATM LLNA database (which includes data from studies from 1989 to 2010), included in NTP’s integrated chemical environment (Bell et al. Citation2017) and from the proprietary database of the Research Institute for Fragrance Materials (RIFM). The LLNA studies were conducted according to the OECD test guideline 429 ‘Skin sensitization: local lymph node assay’ (OECD Citation2010) or similar protocols. For inclusion of positive/sensitizing results, the LLNA EC3 value (i.e. estimated concentration [by interpolation] of a substance expected to produce a stimulation index of 3, the threshold value for a substance to be considered a sensitizer in the LLNA), highest dose tested and vehicle identity were required. In total, 575 LLNA studies were included that covered a broad spectrum of EC3 values, ranging from 0.001% (1,4-phenylenediamin; CAS no. 106–50-3) to 95.8% (Xylene; CAS no. 1330–20-7), and also contained 92 negative studies. For approximately 45% (57/128) of the substances, more than one LLNA study was available.
An appropriate approach to estimate the location of repeat test results of a substance, i.e. provide a representative value for each substance was required to allow for comparison of assay predictions with the LLNA. The conservative approach of using the lowest EC3 value available was considered inappropriate as it depends on the number of repeats, so that no fixed location parameter, i.e. a specific quantile, is estimated (e.g. lowest value of three repeats is the 33%-quantile, while the lowest value of five repeats is the 20%-quantile of the underlying distribution). Likewise, we refrained from selecting one test result, e.g. by expert judgment, as this approach has a high risk of personal bias and disregards valuable information on variability/uncertainty. Also other, widely applied approaches that estimate a fixed quantile, such as the arithmetic and the geometric mean, or even the median of the positive EC3 values (neglecting negatives), cannot adequately account for the entire response spectrum of LLNA results, which comprises of quantitative EC3 values and the qualitative information ‘negative’ (associated with the highest concentration tested). Therefore, we specifically constructed a median-like location parameter. This parameter was defined as the median for substances with repeat studies with an EC3 in more than 50% of the repeats. For substances with at least 50% negative repeat studies, i.e. no EC3 value was available, the parameter was defined as the modified median. The first step in deriving the modified median was to review the negative studies in detail: when the maximum concentration tested in a given study was lower than the median EC3 of the positive studies for the same chemical, the respective negative study was excluded, because it was considered a limited validity as tested concentrations were too low. From the remaining negative and all positive studies, the median was used as a location parameter (modified median). In the case of 50% of repeat studies being negative and 50% being positive, the highest EC3 value was defined as the modified median. Among the 12 substances with such mixed repeat results, the approach can best be described with resorcinol, for which two positive (EC3 of 6.3% and 5.5%) and three negative studies were available. Two of the negative studies tested resorcinol up to 25%, i.e. well above the median of 5.9% of the two positive studies, and were considered valid, while the third negative study was excluded as its maximum 2.5% (< 5.9%) as the maximum concentration was too low. From the remaining two positive and two negative studies, the maximum EC3 value of 6.3% resulted as the modified median. Note that studies testing the same substance were considered as repeats regardless of the solvents/vehicles used.
Non-animal test methods
DPRA
The Direct Peptide Reactivity Assay (DPRA) determines the reactivity of a test substance towards synthetic cysteine (C)- and lysine (K)-containing peptides as a model for the compound’s potential to haptenize proteins and peptides in vivo (Gerberick et al. Citation2004). Briefly, dissolved test substances were incubated with peptides in ratios of 1:10 (for C-peptide) or 1:50 (for K-peptide) for 24 h at room temperature and the remaining non-depleted peptide concentration was determined by high performance liquid chromatography (HPLC) with gradient elution and UV-detection at 220 nm. Test substances without a specific molecular weight were dissolved at a concentration of 100 mM assuming a molecular weight of 375 g/mol and a purity of 100%, and incubated in ratios of 1:5 (for C-peptide) or 1:24 for (K-peptide) based on absolute mass. Further, a co-elution control was performed with each test substance in order to detect possible interference with the peptides. C- and K-peptide depletion relative to solvent control were reported for each test substance, whereas negative values in the range from 0% to -10% were considered as no depletion, i.e. reported as 0%, and negative below -10% were reported unmodified as they indicate co-elution. Data on 126 substances, which were generated and interpreted in accordance with the OECD test guideline 442 C (OECD Citation2015a), are presented here. Of these, 32 were newly tested, 75 were published earlier mainly (Natsch et al. Citation2013), and data on 19 substances were personally communicated by the test developer.
KeratinoSens™
The KeratinoSensTM assay evaluates the activation of the Keap1-Nrf2-ARE-pathway by a test substance as published by Emter et al. (Citation2010), using an immortalized adherent cell line derived from HaCaT human keratinocytes, stably transfected with a luciferase gene under the control of the ARE-element of the human gene AKR1C2. Twelve concentrations of a DMSO or cell culture media-dissolved test substance (ranging from 0.98 to 2000 µM) were applied to the cells for 48 h in at least two independent repetitions. Mixtures or test substances lacking a defined molecular weight (MW) were diluted considering a pro forma molecular weight of 200 g/mol, resulting in 12 test concentrations ranging from 0.195 µg/mL to 400 µg/ml. Luciferase induction is summarized as EC1.5, EC2 and EC3, i.e. the interpolated concentration inducing a 1.5-, 2- and 3-fold response as compared to vehicle control, respectively. In addition, the test concentration with the highest induction is defined as the lmax. Cytotoxicity was determined by the MTT assay and expressed as IC50, i.e. the concentration inducing 50% of the maximum cytotoxicity. KeratinoSensTM data were available for all 128 substances and were produced and interpreted according to procedure described in the OECD test guideline 442 D (OECD 2015 b). Data for 27 of these substances were newly generated, while data on 99 substances were obtained from the literature, mainly Natsch et al. (Citation2015). In addition, the test developer provided data on two substances through personal communication.
h-CLAT
The h-CLAT quantifies changes in the cell surface expression of the co-stimulatory molecules CD86 and CD54 in THP-1 cells after 24 h exposure to a test substance (Ashikaga et al. Citation2006). For dose finding, the CV75 value, i.e. a concentration showing 75% THP-1 cell survival (25% cytotoxicity), was obtained by cytotoxicity tests using propidium iodide staining. Anchored around the CV75, eight concentrations were tested in one experiment consisting of at least two independent runs. After 24 h of exposure, the expression levels of CD86 and CD54, and cell viability were analyzed using flow cytometry. The relative fluorescence intensity (RFI) of CD86 and CD54 for positive control cells and substance-treated cells were calculated. The data presented were obtained and interpreted in accordance with the OECD test guideline 422E, which essentially describes the test protocol used since 2010 (Ashikaga et al. Citation2010). h-CLAT data on 127 substances are presented, comprising of 41 newly tested substances, 85 from Urbisch et al. Citation2015 (based on Nukada et al. Citation2012) and data on one substance provided by the test developer through personal communication.
U-SENS™
The U-SENS™ method is based on the human histiocytic lymphoma U937 cell line and measures CD86 expression as a marker of skin sensitization (Piroird et al. Citation2015). After 45 h incubation with test substances, cells were stained with propidium iodide and CD86 antibodies for flow cytometry analysis. Propidium iodide-stained cultures were used to determine cell viability for each of the test concentrations. For the test concentrations with at least 70% viability, CD86 staining served to determine the stimulation index (S.I.) in relation to the corresponding solvent/vehicle control. From these data, the EC150 (concentration with a S.I. of 150) was calculated by linear interpolation. A U-SENSTM experiment comprised at least two valid runs. While the six test concentrations of the first run are fixed, the 4 to 6 test concentrations of subsequent runs were adjusted if necessary on the basis of the CD86 induction and/or the cytotoxicity observed in previous runs. U-SENSTM data were available for 105 substances, which were obtained and interpreted in accordance with the OECD test guideline 442E (OECD Citation2017). Five substances were newly tested. The data for the remaining 100 substances, for most of which data have been published earlier using a different prediction model (Piroird et al. Citation2015), were re-interpreted (using the actual prediction model) and provided by the test developer through personal communication.
SENS-IS
The SENS-IS assay uses quality-controlled reconstituted human epidermis (SkinEthic’s Episkin model). Appropriately dissolved test substance was applied onto the stratum corneum of two-week cultured epidermis for 15 min at 37 °C and 5% CO2. Test concentrations were 0.1%, 1%, 10%, 50%, and 100% v/v, whereas 10% and 50% are usually tested first and, if necessary, subsequent concentrations were chosen based on the obtained results. After a washing step with PBS, the epidermis was further incubated under the same conditions for another six hours. At the end of the incubation period, the epidermis was snap frozen in liquid nitrogen and the total RNA was extracted for quantitative reverse transcription-polymerase chain reaction (RT-PCR) analysis. Transcript amounts for 61 genes were normalized to the mean expression levels of three house-keeping genes. The genes are categorized into three groups: 23 genes as indicators of skin irritation, 21 “SENS-IS” genes, and 17 “Redox” genes. The first group of genes was used for assay acceptance, i.e. the test was rejected and the substance was tested at a lower concentration if >20 these irritation genes were over-expressed (> 1.25 × control vehicle value). The relative expression of the “SENS-IS” and “Redox” genes were used for the prediction of a test substance’s skin sensitizing potency. While the identity of irritation-associated genes has been published (Cottrez et al. Citation2015), the identity of the genes of the “SENS-IS” and “Redox” genes has been disclosed in a patent. The cycle threshold value of the HSPAA1 gene was used for the evaluation of tissue destruction and had to be ≤110% to be acceptable. The prediction model, which was developed to predict the LLNA, was based on the number of over-expressed genes in the SENS-IS and REDOX group and the test substance concentration. To be considered as a skin sensitizer, a test substance had to induce at least a 1.25-fold increase in the expression of at least seven genes in either the SENS-IS or REDOX group. The lowest concentration meeting these requirements determined the potency prediction: 100% or 50% = weak sensitizer, 10% = moderate sensitizer, 1% = strong sensitizer, and 0.1% = extreme sensitizer. If none of the test concentrations met these criteria, the substance was considered negative. Relative gene expression data are provided in Supplemental Table 1 (worksheet 4). SENS-IS data are presented for 126 substances, comprising of new test data for 73 substances and published data on 53 substances, obtained mainly from Cottrez et al. (Citation2016).
The database
The following information was entered in the database (Supplemental Table 1). Substances were identified by substance name, CAS number, SMILES, and primary use category. For each individual LLNA study, the EC3 was recorded together with vehicle, maximum dose tested, and reference (see Supplemental Table 1, worksheet 2). In addition, the modified median EC3 and the human potency category of each substance are captured. For the non-animal test methods, the following information was entered into the database and referenced:
DPRA: C- and K-peptide depletion (in %)
KeratinoSensTM: EC1.5; EC3; IC50; lmax (all in µM; for natural extracts in µg/mL)
h-CLAT: CD86 EC150; CD54 EC200, CV75 (all in µg/mL)
U-SENS™: CD86 EC150; CV70 (all in µg/mL)
SENS-IS: potency prediction, vehicle and gene expression data.
Note that the variables recorded for the DPRA, KeratinoSensTM, and h-CLAT allow ready application of the standard prediction models of the respective test methods (OECD Citation2015a, Citation2015b, Citation2017). Moreover, the database includes for each substance: data on six physicochemical properties related to skin penetration and skin protein binding, mechanistic reaction domain classification(s) and an indication if the substance is a pre- or pro-hapten.
Primary data extraction involved a review of the studies, identification of relevant results, and data entry into the database. Quality assurance (of extraction) was conducted by another individual that reviewed the same studies and confirmed that the appropriate data had been entered into the database. Any differences between the two reviewers were discussed to obtain consensus.
Data analysis
The predictions were calculated using the standard prediction models of the test methods for both the human and the LLNA reference dataset. The skin sensitization potential predictivity of the individual test methods was described using the standard parameters of specificity, i.e. the proportion of the non-sensitizing substances predicted as non-sensitizers, sensitivity, i.e. the proportion of the sensitizing substances predicted as sensitizers, accuracy (or concordance), i.e. the proportion of the correctly predicted substances, and balanced accuracy, i.e. the mean of specificity and sensitivity. The predictivity of skin sensitization potency classes of the SENS-IS was described for both reference datasets by contingency tables and accuracy. Correlations of physico-chemical properties were evaluated using Pearson’s correlation coefficient. Applicability domains of the individual test methods were explored descriptively and with the Kruskal–Wallis test with Dunn’s multiple comparison (using GraphPad Prism 7.0c, GraphPad Software, Inc., La Jolla, CA, USA).
Results
Description of the database
The database contains 128 substances, which were identified by substance name and CAS number (Supplemental Table 1). With the exception of six natural extracts (Jasmine absolute [grandiflorum], Jasmine absolute [sambac], oakmoss, treemoss, tea leaf absolute, and ylang-ylang), the included substances were well-defined single substances. Three substances were considered as solutions (glutaraldehyde [act. 50%], formaldehyde [act. 37%] and glyoxal [act. 40%]). With the exception of data missing for 2-hexylidene cyclopentanone (no DPRA h-CLAT and SENS-IS data) and for menthadiene-7-methyl formate (no SENS-IS data), which was at the time of testing not commercially available, and data on 23 substances for the U-SENSTM, failing quality control primarily due to deviations from the standard protocol, the data are complete.
The substances comprised of 58 fragrances, 16 preservatives, nine actives (e.g. acrylates), seven surfactants, seven dyes, six pharmaceuticals, one UV filter, eight substances with other cosmetic uses, and 16 substances without any known cosmetic use. In addition, the chemical and product categories (CPCat) from EPA were used to more broadly describe the use categories covered. Substances were assigned to one or more use categories as defined in the aggregated computational toxicology resource (ACToR) database (). Overall, 12 use categories were covered by the 128 substances, most of them well-populated. Most substances have multiple use categories, resulting in an average number of 4.2 use categories per substance. For example, penicillin G is used only as a pharmaceutical, whereas isopropanol and phenol have the most use categories. This broad coverage demonstrates the diversity of the included substances in terms of their uses. Consequently, the database and the results are not limited to cosmetic ingredients, but apply to a broad range of chemical uses.
Table 1. Use category of substances based on ACToR Use DB Categories in CPCat (106 of the 128 substances were associated with more than one category).
The included substances also covered all mechanistic domains of chemical reaction. Domains have been assigned to 122 substances, comprising of 38 Michael acceptors, 21 Schiff base electrophiles, eleven SN2 electrohiles (including three substance with proposed SN2-reaction at the S-atom), nine acyl transfer agents, two SNAr electrophiles, and 41 substances without a domain (Supplemental Table 1: worksheet 1).
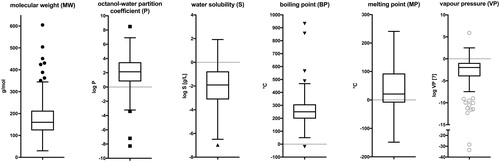
The chemical space covered by the database was also described in terms of physicochemical properties, either experimentally determined or estimated, excluding the natural extracts. The MW ranged from 30 g/mol to 605 g/mol. The vast majority of the substances (95%) had a MW of less than 400 g/mol. The range of logP values covered almost 17 log-orders, while the logP of 97% of the substances ranged between -3 and 6. The water solubility (logS) of the substances spanned nine log-orders from −7 to 2. Boxplots of the distributions of the individual properties are shown in . As to be expected, some properties were highly correlated. Pearson correlation coefficients >0.7 or <−0.7 were observed for the pairs MW-BP, MW-logVP, BP-logVP, and logP-logS.
Figure 2. Boxplots of six physicochemical properties for 122 substances.
Concordance of reference results
The results for the LLNA and human data are presented in Supplemental Table 1. The substances covered the six human potency categories with six substances in category 1, 24 in category 2, 29 in categories 3, 29 in category 4, 25 in category 5, and 15 in category 6.
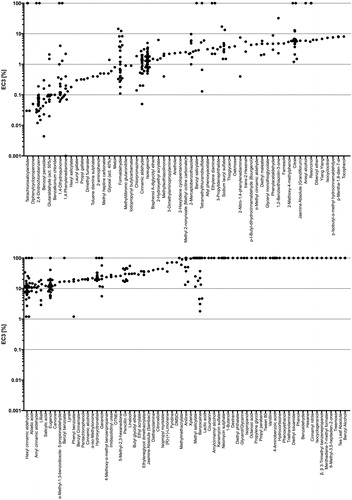
In the LLNA, 95 substances were sensitizing and 33 non-sensitizing. For 54.7% of the substances, only one LLNA study was available. The median number of studies for the 58 substances, for which repeat studies were available, was 4.5, with the maximum of 44 studies on isopropanol. The individual repeat LLNA EC3 for each substance (regardless of the vehicle used) are presented in , whereas studies that did not reach a three-fold stimulation index, i.e. are considered negative in the LLNA, are shown with an EC3 value of 100% for plotting purposes.
Figure 3. Distribution of LLNA EC3 values for substances: substances with multiple LLNA EC3 values are plotted in order from most to least potent based on the modified median (top: <10% EC3; bottom: > 10% EC3), where the y-axis is in log scale. Potency categories are delineated by horizontal dotted lines. Negative LLNA are displayed with an EC3 of 100%.
For substances with repeat LLNA studies, the median-like location parameter was used to compare the LLNA with the human reference data (). We evaluated the concordance of classification of these two sets of reference data for three various degrees of resolution. First, we dichotomized the two standards. Substances with the human categories 1, 2, 3, and 4 were considered as sensitizers and the categories 5 and 6 as non-sensitizers. Substances in human category 5 were considered as non-sensitizer as they were characterized by either high NOELs (≥ 10,000 µg/cm2) or at best, low incidence of cases of human sensitization reported in DPT, which we considered as not sufficient to justify a classification as a sensitizer. The LLNA data were discriminated into sensitizers and non-sensitizers using the modified median. This dichotomization allowed us to compare the two reference data sets by means of a 2 × 2 contingency table, resulting in an accuracy of 74% (95/128), with 20 non-sensitizers and 75 sensitizers predicted concordantly (). Of the discordant substances, 20 (16%) were predicted as sensitizers in the LLNA, but classified as not sensitizing in humans, and 13 (10%) were sensitizing to humans, but not in the LLNA. Categorizing both human (categories 5 and 6 as non-sensitizers, categories 3 and 4 as lower potency sensitizers and categories 1 and 2 as higher potency sensitizers) and LLNA (non-sensitizers, modified median EC3 ≥ 1% as weak/moderate sensitizers and modified median EC3 < 1% as strong/extreme sensitizers) in three groups resulted in an accuracy to 59% (76/128) (). Of the discordant substances, 25 (20%) were classified into a higher category and 27 (21%) into a lower category in the LLNA compared to humans. Accounting for all six human classes, whereby categories 5 and 6 were still considered as non-sensitizers, and for five LLNA potency classes (modified median EC3 < 0.1%: extreme; 0.1% ≤ modified median EC3 < 1%: strong; 1% ≤ modified median EC3 < 10%: moderate; 10% ≤ modified median EC3 ≤ 100%: weak; otherwise non-sensitizer) resulted in an accuracy of 45% (58/128) (). Among the 33 (26%) substances, which were classified into a higher category in the LLNA compared to humans, 24 (i.e. 20% of the total 128) were over-classified by one class. In addition, the LLNA classified 37 (29%) substances into a lower category. Of these, 29 (i.e. 23% of the total 128) were under-classified by one class.
Figure 4. Plot of LLNA EC3 modified median against the six human categories for all 128 substances. LLNA Potency categories are delineated by horizontal dotted lines. Negative LLNA are displayed with an EC3 of 100%.
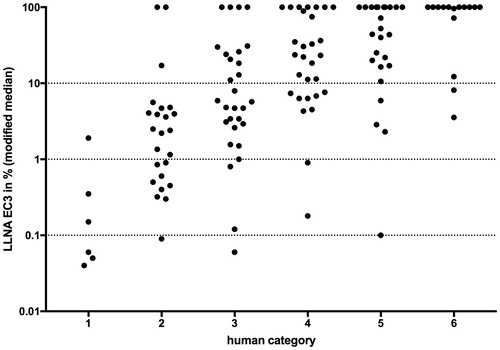
Table 2. Contingency tables (A: 2 × 2; B: 3 × 3; C: 5 × 5) comparing human and LLNA reference data for 128 substances.
Predictivity of individual test methods
We analyzed the predictivity of the test methods, most of which have been evaluated by others in detail, e.g. by Urbisch et al. (Citation2015), using the parameters specificity, sensitivity, and (balanced) accuracy compared to human and to the LLNA using the same dichotomization of the reference standards as described above (). In the absence of human-specific prediction models for the individual test methods, we applied the standard prediction models, which were developed for predicting LLNA results, also for the comparison with human data. For both references, specificity and sensitivity was almost equally balanced for the DPRA and the KeratinoSensTM, while the other three test methods had higher sensitivity, but lower specificity. Accuracy with human data ranged from 72% to 79%, being lowest for the DPRA, while the balanced accuracy was slightly lower (70% to 76%), being highest for the KeratinoSensTM. Accuracy with LLNA data was lower for the DPRA and KeratinoSensTM as compared to the h-CLAT, U-SENSTM, and SENS-IS, while balanced accuracies were very similar across test methods.
Table 3. Skin sensitization potential predictivity of individual test methods and the mechanistic domains compared to both human and LLNA reference data, incl.
The SENS-IS test method has established a prediction model to assign substances to one of five potency classes. Compared to human categories, the SENS-IS predicted the same potency for 51% (64/126) substances (). Fifty-one substances (40%) were assigned to an adjacent class; 33 substances (26%) to the next higher class and 18 (14%) to the next lower class. Four substances (3%) were over-classified by more than one class and seven (6%) were under-classified by more than one class. The extreme human sensitizer that was classified by the SENS-IS as weak was tetrachlorosalicylanilide (CAS no. 1154–59-2). In a re-test, tetrachlorosalicylanilide was solubilized at 65 °C and an ‘extreme’ potency was predicted (data not shown).
Table 4. Contingency table of skin sensitization potency predictions of the SENS-IS for 126 substances compared to human reference data categories (grey indicates concordant predictions).
In addition, we also compared the predictivity of the mechanistic reaction domain classifications. When dichotomizing the substances by considering those with an assigned domain as skin sensitizers and those without a domain as non-sensitizers, (balanced) accuracies were higher than those of the individual test methods for both human and LLNA reference data ().
Exploration of the applicability of individual test methods
We explored the applicability of the individual test methods to better describe their strengths and limitations. Therefore, we focused on several aspects: the testability of substances, the ability to predict pre- and pro-haptens, patterns in predictivity (as compared to human data) related to physico-chemical properties, as well as patterns related to mechanistic reaction domains. Due to the limited number of substances, features were analyzed independently from each other and mainly descriptively.
DPRA
Of the 127 commercially available substances, 124 could be tested in the DPRA. Two substances likely co-elutied with cysteine, so that no reliable peptide depletion data could be obtained, and one (Dextran) was not testable due to its physico-chemical properties. Interestingly, these three substances had relatively high molecular weights (> 300). Of the 21 human sensitizing pre- and pro-haptens, for which DPRA results were available, eight were predicted as non-sensitizers, seven being pro- or pre/pro-haptens according to Patlewicz et al. (Citation2016). Regarding the mechanistic reaction domains, no pattern deviating from the overall predictivity was observed, with the exception that the substances reacting by acyl transfer were correctly predicted as positive as compared to human data.
Comparing the distributions of the physico-chemical properties between the four groups of correctly predicted human sensitizers and non-sensitizers, and the respective false negative and positive predictions, no significant differences were detected (Kruskal–Wallis test p values > .25).
KeratinoSensTM
All 128 substances could be tested in the KeratinoSensTM. Seven of the 22 human sensitizing pre- and pro-haptens were predicted as non-sensitizers, five being pro- or pre/pro-haptens according to Patlewicz et al. (Citation2016). While this relation is less clear as for the DPRA, it may still be relevant for applicability considerations.
Predictivity in the mechanistic reaction domains was similar to the overall predictivity. However, in contrast to the DPRA, four of the nine substances reacting by acyl transfer were false negative.
The comparison of the physico-chemical properties revealed that false positive substances have a significantly higher molecular weight, logP and boiling point than correct negative substances. In addition, the logS of the false positive substances were significantly lower than that of the correct positives and negatives. While the sample of the false positive was small (n = 9) and the physico-chemical properties were correlated, this pattern could potentially be used to refine the applicability domain of the KeratinoSensTM.
h-CLAT
All 127 available substances could be tested in the h-CLAT. With 20 of the 22 human sensitizing pre- and pro-haptens correctly predicted, the h-CLAT was as sensitive for these substances as for substances not needing any activation.
Regarding the mechanistic reaction domains, no particular pattern in predictions was obvious, except that 23 of 41 substances without any assigned domain were predicted as sensitizers. However, 14 of these 23 were human non-sensitizers. As the prediction model of the h-CLAT was developed to obtain a high sensitivity, this highlights that applicability domain assessments based on predictions is of limited usefulness, as it is directly influenced by the subjective choices made in prediction model development.
As for the DPRA, no significant differences were detected (Kruskal–Wallis test p values > .22) when comparing the distributions of the physico-chemical properties. In particular, the frequency of false negative predictions for substances with a logP >3.5 (2/18 = 11.1%) is similar as the respective frequency for substances with a logP <3.5 (7/63 = 11.1%).
U-SENSTM
While all 126 available substances could be tested in the U-SENSTM, only the 105 that were tested according to the standard protocol were considered. The 21 human sensitizing pre- and pro-haptens tested in the U-SENSTM were correctly predicted. Also, the prediction model of the U-SENSTM was developed to reduce the number of false negative predictions, resulting in only three false negative substances. Therefore, the insight to be gained by the analysis of patterns regarding mechanistic reaction domains and physico-chemical properties using predictions is limited.
Similar to the h-CLAT, 19 of 36 substances without any assigned domain were predicted as sensitizers, 14 of which were not being human sensitizers. Regarding the physico-chemical properties, the small group of false negative substances had a significantly larger molecular weight than the correct negatives and, partly correlated to this, a lower vapor pressure compared to the correct negatives and positives.
SENS-IS
All 126 commercially available substances could be tested in the SENS-IS. All 22 human sensitizing pre- and pro-haptens were correctly identified as sensitizers. With a prediction model reducing the number of false negatives, further analysis of the applicability domains based on false and correct prediction is of limited generalizability.
Regarding the mechanistic reaction domains, most false positives have been observed for substances without an assigned domain. Differences in closely correlated physico-chemical properties were detected for the five false negative substances: their molecular weight was significantly larger and their vapor pressure was significantly lower as compared to the correct negatives, while their boiling points were significantly higher than those of the correct positives and negatives.
Discussion
Based on a systematic evaluation of available test methods for skin sensitization (Reisinger et al. Citation2015), we selected five non-animal test methods for the compilation of a comprehensive database of 128 substances. Existing and newly generated data for the test methods were obtained according to standard protocols. Across the five non-animal test methods, a total of 613 test results have been compiled. About a third of these (202) are unpublished results, the vast majority from new testing (179), but also from personal communications (23). The primary output data of the test methods were recorded, e.g. the depletion values of the synthetic peptides used in the DPRA. In addition, the predictions of skin sensitization potential and, if applicable, potency were reported for each test method according to the standard prediction models (as included in the respective OECD test guidelines or publications). Our dataset has several advantages compared to other dataset, such as Asturiol et al. (Citation2016), Urbisch et al. (Citation2015), or Natsch et al. (Citation2013), which were compiled for different purposes. It includes a substantial set of newly generated data, systematically reviewed reference data (especially LLNA) and a level of harmonization that allows meaningful comparative assessments. In particular, the comprehensiveness and level of detail presented enables the use of our database for data-mining purposes, e.g. the evaluation of defined approaches for skin sensitization (Kleinstreuer et al. Citation2018).
The main selection criterion for the substances was the availability of both human and LLNA reference data. For many substances, several LLNA studies were identified (Supplemental Table 1). These were summarized by a modified median EC3. While the general variability of the LLNA has been discussed in detail, e.g. by Hoffmann (Citation2015), Roberts et al. (Citation2016), and Dumont et al. (Citation2016), care needs to be taken when addressing individual substances, especially regarding the suitability of the solvent used and the concentrations tested. For example, xylene, which was tested once in the LLNA giving an EC3 of 95.8% and was therefore considered for the purpose of this work as positive in the LLNA, was consistently negative in all non-animal test methods and is also not considered a human skin sensitizer. This difference leads to discordance when assessing the skin sensitization potential, but is of low-practical relevance for the assessment of skin sensitization potency, e.g. in the risk assessment of chemical ingredients.
The substance selection process resulted in a high diversity of chemistry in the database in terms of ranges of physicochemical properties covered, mechanistic reaction domains and use categories. While the majority of the included substances have specific cosmetic uses, other use categories are also well represented. Natural extracts pose specific challenges. Their composition is defined by natural material and extraction process, so that it cannot be defined unambiguously and is likely to vary over time. Consequently, comparison with existing data, which usually lack proper documentation of composition, is compromised.
All data included in the database were extensively curated and are provided in Supplemental Table 1.
We made use of the database to compare the two reference datasets – LLNA and human data. In dichotomizing the human data, potency categories 5 and 6 were grouped as negative, because we considered that the human evidence on skin sensitization for group 5 substances would justify no classification, e.g. according to CLP. However, we acknowledge that this, like any dichotomization of a continuum, might create the need for discussion of specific cases. The overall accuracy of predictions of skin sensitization potential was 74% and thus lower than the 82% reported by Urbisch et al. (Citation2015). Potential reasons for this are differences in the respective substance samples and in the reference data used. When focusing on the prediction of potency, the accuracy between the reference datasets was 59% for three categories and 45% for five categories. As expected, this decrease is inversely dependent on the number of categories considered. However, this quantification provides for the first time a systematically derived basis for the assessment of potency predictions of individual test methods or testing strategies, such as defined approaches, for skin sensitization. For example, the SENS-IS that discriminates five potency categories predicted human categories with an accuracy of 51%.
The general performance of the individual test methods to predict skin sensitization potential was analyzed with the parameters of specificity, sensitivity, and (balanced) accuracy. Even though the standard prediction models of the test methods were developed using the LLNA as a reference, we focused our assessment on the comparison to human data, primarily because such a direct comparison with the target species eliminates uncertainty introduced by interspecies differences. However, the results when comparing to the LLNA were also calculated. Similar to the accuracy of human and LLNA data, the accuracies of the test methods ranged from 67% to 80% (balanced accuracies from 67% to 70%). The DPRA and the KeratinoSensTM prediction models equally balanced specificity and sensitivity, whereas the prediction models of the other three test methods were more sensitive and less specific. Such differences can at least partly be explained by choices the test developers made when developing the original prediction models, i.e. defining prediction thresholds either to optimize overall accuracy or to increase sensitivity, while maintaining a reasonable specificity. Accuracies for predicting human skin sensitization potential reported in the literature are consistently higher than those reported here: by about 5% for the KeratinoSensTM and h-CLAT (Urbisch et al. Citation2015), by about 10% for the DPRA (Urbisch et al. Citation2015) and the U-SENSTM (Piroird et al. Citation2015) and by 19% for the SENS-IS (Cottrez et al. Citation2016). This tendency could be explained by differences in the substance samples.
In addition, we analyzed the several aspects of applicability of the individual test methods. With very few exceptions, all substances could be tested in any of the five test methods. While the DPRA and the KeratinoSensTM showed limited predictivity, especially for pro-haptens, the other test methods correctly predicted the human sensitizing pre- and pro-haptens. Accounting for this limitation, e.g. by excluding the pro- or pre/pro-haptens for the DPRA, possibly opens up means to explore the predictivity in more detail that could also inform potency assessment. While such an analysis is beyond the scope presented here, we would like to point to potential opportunities with an example for the DPRA, for which cysteine depletion alone correlated significantly better with human potency categories than the average depletion of cysteine and lysine. The analysis of the relation of misclassifications to physico-chemical properties revealed that the KeratinoSensTM, the U-SENS, and the SENS-IS predicted sensitizing substances with a high MW more likely as non-sensitizers than lower MW substances. In particular, we could not confirm the results of Takenouchi et al. (Citation2013), who found a higher false-negative rate for substances with a logP >3.5, most likely due to differences in the sets of high logP substances. Finally, we investigated predictivity in the various mechanistic reaction domains. No specific limitation or strengths were identified, with the exception that the KeratinoSensTM tended to predict sensitizing substances reacting by acyl transfer as non-sensitizers.
Many of the applicability aspects that are well described for the individual test methods in the respective OECD test guidelines (OECD Citation2015a, Citation2015b, Citation2017), except for the SENS-IS, for which no such guideline is available, were confirmed. However, we would like to stress that the usefulness of applicability assessment based on prediction models and the resulting predictive parameters of sensitivity, specificity, and accuracy, is limited, as preferences in developing those models clearly differed between test methods.
This limitation is further increased when operating under the assumption that no individual test method will be sufficiently informative for hazard and risk assessment purposes, because prediction models were developed in isolation optimizing the predictive performance of an individual test method. More informative measures of predictive performance such as receiver operating characteristic curves and predictive values are better suited to comprehensively understand the predictivity individual test methods (Hoffmann and Hartung Citation2005). Also, classification loss functions weighing mispredictions, e.g. penalizing false negative predictions higher than false positives, are an informative tool for prediction model development and predictivity assessment, which is recommended for the validation of (quantitative) structure-activity relationship models (OECD Citation2007), but is rarely applied to non-animal test methods (Hoffmann et al. Citation2008). However, for the more challenging aims of using the data of the individual test methods for skin sensitization and potency and risk assessment, individual test methods’ prediction models should be abandoned and the focus placed on the primary data, as provided here (Supplemental Table 1).
In summary, this database provides a wealth of high quality information that can be used for a range of purposes, but especially for advancing the understanding of strengths and weaknesses of test methods and testing strategies, including defined approaches, but possibly also IATA. Here, we used it as a common basis to conduct a harmonized assessment of the various reference and non-animal test methods involved. In this way, we exclude uncertainties introduced by differences in substance sample used and by differences in reference values. As another example, we utilized the data to assess the predictive performance of six defined approaches for skin sensitization, resulting in an independent and harmonized evaluation (Kleinstreuer et al. Citation2018). We propose our database as a point of reference for example for the evaluation and development of testing strategies and encourage the community to use it to meet the challenge of conducting skin sensitization safety assessment without generating new animal data. However, we are aware of aspects requiring further considerations. First, the variability and uncertainties in all relevant information sources, i.e. in all data used in testing strategies and in the reference data used for assessment of test methods and testing strategies, should be identified, qualified, and if possible, quantified. While the variability of the LLNA has been well described (Hoffmann Citation2015; Dumont et al. Citation2016; Dimitrov et al. Citation2016), confidence in the human data has not yet been addressed systematically. Another issue related to human data is that it will be available for a limited number of substances only. Variability of non-animal test method results is usually investigated to some extent in validation studies, which should include an experimental evaluation of within- and between laboratory reproducibility. However, the impact of this variability has not yet been fully accounted for when assessing the predictive performance of individual test methods and testing strategies. On the level of individual test methods, a first attempt to evaluate the effect of variability in the context of prediction thresholds and models has been published by Leontaridou et al. (Citation2017). On the level of testing strategies, the impact of variability of input data is even more complex to account for, as the propagation of variability and error is difficult to model and quantify. In addition, we are aware that inclusion of further substances in our database increases the power of statistical analyses. This, in turn, may allow more detailed analyses of uncertainties and applicability of individual test and testing strategies. Ultimately, an increased substance sample may enable developing statistically sound sub-group analyss, e.g. based on physicochemical properties of substances, for specific purposes, e.g. identifying groups of substances, which can be predicted well or poorly.
Therefore, we are continuing this work in the frame of Cosmetics Europe’s program to achieve regulatory acceptance of animal free testing strategies that enable cosmetic industries to conduct skin sensitization safety assessments, which was initially described by Reisinger et al. (Citation2015). While some regulatory acceptance of non-animal test methods for the prediction of skin sensitization potential of chemicals has been achieved (EU Citation2016), the need of cosmetic industry to distill information on skin sensitization potency from these methods in order to facilitate human safety assessment remains a challenge. As a next step, we will complete the U-SENSTM dataset, add the PPRA method, and expand the database by approximately 40 substances, which are of high relevance for cosmetic industry. With the enlarged database including two test methods (SENS-IS and PPRA), which have not yet been used in defined approaches and IATA for skin sensitization, we will explore optimizations of existing and the construction of new testing strategies to predict potency, maintaining the focus on human reference data where possible. This work will go hand-in-hand with our efforts to develop safety assessment approaches based on non-animal data only. Including information on bioavailability and metabolism, we intend to highlight opportunities and limitations of the use of the non-animal test method data presented here for safety assessment purposes through case studies.
Declaration of interest
This work has been conceived, planned, and executed by Cosmetic Europe’s Skin Tolerance Task Force (CE STTF) in collaboration with the Research Institute for Fragrance Materials (RIFM) and NIH/NIEHS/DNTP/NICEATM (Nicole Kleinstreuer), supported by ILS (Dave Allen, Qingda Zang).
Cosmetics Europe is the European trade association for the cosmetics and personal care industry. The members include cosmetics and personal care manufacturers, and also associations representing our industry at national level, right across Europe (for more information see: https://www.cosmeticseurope.eu/). Since several years, Cosmetics Europe is driving research in the area of non-animal testing for the safety evaluation of cosmetics and personal care products and, in particular, in the field of skin sensitization assessment. Cosmetic Europe facilitated scientific meetings of the CE STTF and coordinated the overall project management and administrative tasks relating to the completion of this work. The CE STTF is composed of cosmetic company experts (see affiliations on cover page), who are not paid for their work on the task force, external consultants (Sebastian Hoffmann and Erwin van Vliet paid by Cosmetics Europe) and Cosmetics Europe staff (Bertrand Desprez and Martina Klaric employed by Cosmetics Europe). The CE STTF members carried out the work, i.e. the collection of existing data, sponsoring and monitoring the generation of new data, the data analyses and drafting of the paper.
Anne-Marie Api, Jon Lalko, and Rahul Parakhia are/were employees of RIFM, contributing to this work with data and their interpretation on, depending on the test method, up to 30 fragrances. Nicole Kleinstreuer is employed by NIH/NIEHS/DNTP/NICEATM. The work conducted, primarily the description of the diversity of the database (in terms of uses, physic-chemical properties and functional groups) at NIH/NIEHS/DNTP/NICEATM was supported with federal funds from the National Institute of Environmental Health Sciences, National Institutes of Health under Contract No. HHSN273201500010C to ILS in support of NICEATM. Dave Allen and Qingda Zang are employed by ILS. ILS was contracted by Cosmetics Europe to perform the data curation.
The opinions expressed herein and the conclusions of this publication are those of the authors and do not necessarily represent the views of Cosmetics Europe nor those of its member companies.
During this work, Sebastian Hoffmann has been supporting the development and validation of three test methods mentioned here (U-SENSTM, LuSens, Hennen and Blömeke (Citation2016)) as a paid consultant, primarily in the role of an independent statistician. Other authors have no conflicts of interest. None of the authors has appeared in any legal or regulatory proceedings in the last five years related to the contents of this paper.
The companies of the CE STTF members, the NIEHS, and RIFM have approved this work for publication.
This work was supported by Cosmetics Europe and RIFM.
Supplemental material
Supplemental material for this article is available online here.
Supplemental Table
Download MS Excel (587.3 KB)Acknowledgements
The authors thank Eileen Phillips (ILS, USA) for supporting the data curation, Andreas Natsch (Givaudan, Switzerland) for providing KeratinoSensTM data for some substances and Dori Germolec (NIH, NIEHS, USA) and Nicola Gilmour (Unilever, UK) for reviewing the manuscript. In addition, the authors gratefully acknowledge the constructive comments of the reviewers, which were very helpful in improving the manuscript.
Related Research Data
References
- Alépée N, Piroird C, Aujoulat M, Dreyfuss S, Hoffmann S, Hohenstein A, Meloni M, Nardelli L, Gerbeix C, Cotovio J. 2015. Prospective multicentre study of the U-SENS test method for skin sensitization testing. Toxicol InVitro. 30:373–382.
- Api AM, Parakhia R, O’Brien D, Basketter DA. 2017. Fragrances categorized according to relative human skin sensitization potency. Dermatitis. 28:299–307.
- Ashikaga T, Yoshida Y, Hirota M, Yoneyama K, Itagaki H, Sakaguchi H, Miyazawa M, Ito Y, Suzuki H, Toyoda H. 2006. Development of an in vitro skin sensitization test using human cell lines: the human cell line activation test (h-CLAT) I. Optimization of the h-CLAT protocol. Toxicol In Vitro.20:767–773.
- Ashikaga T, Sakaguchi H, Sono S, Kosaka N, Ishikawa M, Nukada Y, Miyazawa M, Ito Y, Nishiyama N, Itagaki H. 2010. A comparative evaluation of in vitro skin sensitisation tests: the human cell-line activation test (h-CLAT) versus the local lymph node assay (LLNA). Altern Lab Anim. 38:275–284.
- Asturiol D, Casati S, Worth A. 2016. Consensus of classification trees for skin sensitisation hazard prediction. Toxicol In Vitro.36:197–209.
- Basketter DA, Balikie L, Dearman RJ, Kimber I, Ryan CA, Gerberick GF, Harvey P, Evans P, White IR, Rycroft RJ. 2000. Use of the local lymph node assay for the estimation of relative contact allergenic potency. Contact Derm. 42:344–348.
- Basketter DA, Alepee N, Ashikaga T, Barroso J, Gilmour N, Goebel C, Hibatallah J, Hoffmann S, Kern P, Martinozzi-Teissier S, et al. 2014. Categorization of chemicals according to their relative human skin-sensitizing potency. Dermatitis. 25:11–21.
- Bell S, Phillips J, Sedykh A, Tandon A, Sprankle C, Morefield S, Shapiro A, Allen D, Shah R, Maull E, et al. 2017. An integrated chemical environment to support 21st-century toxicology. Environ Health Perspect. 125:054501
- Buehler EV. 1965. Delayed contact hypersensitivity in the guinea pig. Arch Dermatol. 91:171–177.
- Cottrez F, Boitel E, Auriault C, Aeby P, Groux H. 2015. Genes specifically modulated in sensitized skins allow the detection of sensitizers in a reconstructed human skin model. Development of the SENS-IS assay. Toxicol In Vitro. 29:787–802.
- Cottrez F, Boitel E, Ourlin JC, Peiffer JL, Fabre I, Henaoui IS, Mari B, Vallauri A, Paquet A, Barbry P, et al. 2016. SENS-IS, a 3D reconstituted epidermis based model for quantifying chemical sensitization potency: Reproducibility and predictivity results from an inter-laboratory study. Toxicol In Vitro. 32:248–260.
- Dimitrov S, Detroyer A, Piroird C, Gomes C, Eilstein J, Pauloin T, Kuseva C, Ivanova H, Popova I, Karakolev Y, et al. 2016. Accounting for data variability, a key factor in in vivo/in vitro relationships: application to the skin sensitization potency (in vivo LLNA versus in vitro DPRA) example. J Appl Toxicol. 36:1568–1578.
- Dionisio KL, Frame AM, Goldsmith M-R, Wambaugh JF, Liddell A, Cathey T, Smith D, Vail J, Ernstoff AS, Fantke P, et al. 2015. Exploring consumer exposure pathways and patterns of use for chemicals in the environment. Toxicol Rep. 2:228–237.
- Dumont C, Barroso J, Matys I, Worth A, Casati S. 2016. Analysis of the local lymph node assay (LLNA) variability for assessing the prediction of skin sensitisation potential and potency of chemicals with non-animal approaches. Toxicol In Vitro. 34:220–228.
- Emter R, Ellis G, Natsch A. 2010. Performance of a novel keratinocyte-based reporter cell line to screen skin sensitizers in vitro. Toxicol Appl Pharmacol. 245:281–290.
- EU. 2009. Regulation (EC) No 1223/2009 of the European Parliament and of the Council of 30 November 2009 on cosmetic products. Off J Eur Union L. 342:1–59.
- EU. 2016. Commission regulation (EU) 2016/1688 of 20 September 2016 amending Annex VII to Regulation (EC) No 1907/2006 of the European Parliament and of the Council on the registration, evaluation, authorisation and restriction of chemicals (REACH) as regards skin sensitisation. Off J Eur Union L. 59:14–16.
- Ezendam J, Braakhuis HM, Vandebriel RJ. 2016. State of the art in non-animal approaches for skin sensitization testing: from individual test methods towards testing strategies. Arch Toxicol. 90:2861–2883.
- Forreryd A, Zeller KS, Lindberg T, Johansson H, Lindstedt M. 2016. From genome-wide arrays to tailor-made biomarker readout – Progress towards routine analysis of skin sensitizing chemicals with GARD. Toxicol In Vitro. 37:178–188.
- Gerberick GF, Vassallo JD, Bailey RE, Chaney JG, Morrall SW, Lepoittevin JP. 2004. Development of a peptide reactivity assay for screening contact allergens. Toxicol Sci. 81:332–343.
- Gerberick GF, Ryan CA, Dearman RJ, Kimber I. 2007. Local lymph node assay (LLNA) for detection of sensitization capacity of chemicals. Methods. 41:54–60.
- Gerberick GF, Troutman JA, Foertsch LM, Vassallo JD, Quijano M, Dobson RL, Goebel C, Lepoittevin JP. 2009. Investigation of peptide reactivity of pro-hapten skin sensitizers using a peroxidase-peroxide oxidation system. Toxicol Sci. 112:164–174.
- Hennen J, Blömeke B. 2016. Keratinocytes improve prediction of sensitization potential and potency of chemicals with THP-1 cells. ALTEX. 34:279–288.
- Hoffmann S, Hartung T. 2005. Diagnosis: toxic!–trying to apply approaches of clinical diagnostics and prevalence in toxicology considerations. Toxicol Sci. 85:422–428.
- Hoffmann S, Saliner AG, Patlewicz G, Eskes C, Zuang V, Worth AP. 2008. A feasibility study developing an integrated testing strategy assessing skin irritation potential of chemicals. Toxicol Lett 180:9–20.
- Hoffmann S. 2015. LLNA variability: an essential ingredient for a comprehensive assessment of non-animal skin sensitization test methods and strategies. ALTEX. 32:379–383.
- Kimber I, Dearman RJ, Scholes EW, Basketter DA. 1994. The local lymph node assay: developments and applications. Toxicology. 93:13–31.
- Kimber I, Basketter DA, Gerberick GF, Dearman RJ. 2002. Allergic contact dermatitis. Int Immunopharmacol. 2:201–211.
- Kimura Y, Fujimura C, Ito Y, Takahashi T, Nakajima Y, Ohmiya Y, Aiba S. 2015. Optimization of the IL-8 Luc assay as an in vitro test for skin sensitization. Toxicol In Vitro. 29:1816–1830.
- Kleinstreuer N, Hoffmann S, Alépée N, Allen D, Ashikaga T, Casey W, Clouet E, Cluzel M, Desprez B, Gellatly N, et al. Forthcoming 2018. Assessment of non-animal defined approaches for predicting skin sensitization. Crit Rev Toxicol.
- Leontaridou M, Urbisch D, Kolle SN, Ott K, Mulliner DS, Gabbert S, Landsiedel R. 2017. Quantification of the borderline range and implications for evaluating non-animal testing methods' precision. ALTEX. 34:525–538.
- Loveless SE, Api AM, Crevel RW, Debruyne E, Gamer A, Jowsey IR, Kern P, Kimber I, Lea L, Lloyd P, et al. 2010. Potency values from the local lymph node assay: application to classification, labelling and risk assessment. Regul Toxicol Pharmacol. 56:54–66.
- Magnusson B, Kligman AM. 1969. The identification of contact allergens by animal assay. The guinea pig maximization test. J Invest Dermatol. 52:268
- Natsch A, Ryan C, Foertsch L, Emter R, Jaworska J, Gerberick F, Kern P. 2013. A dataset on 145 chemicals tested in alternative assays for skin sensitization undergoing prevalidation. J Appl Toxicol. 33:1337–1352.
- Natsch A, Emter R, Gfeller H, Haupt T, Ellis G. 2015. Predicting skin sensitizer potency based on in vitro data from KeratinoSens and kinetic peptide binding: global versus domain-based assessment. Toxicol Sci. 143:319–332.
- Nukada Y, Ashikaga T, Miyazawa M, Hirota M, Sakaguchi H, Sasa H, Nishiyama N. 2012. Prediction of skin sensitization potency of chemicals by human cell line activation test (h-CLAT) and an attempt at classifying skin sensitization potency. Toxicol In Vitro. 26:1150–1160.
- OECD. 1992. Test No. 406: skin sensitisation. Paris: OECD Publishing.
- OECD. 2007. Guidance document on the validation of (quantitative) structure-activity relationship [(Q)SAR] models. Paris: OECD Publishing.
- OECD. 2010. Test No. 429: skin sensitisation: local lymph node assay. Paris: OECD Publishing.
- OECD. 2012. The adverse outcome pathway for skin sensitization initiated by covalent binding to proteins. Part 1: scientific evidence; Part 2: use of the AOP to develop chemical categories and integrated assessment and testing approaches. Series on testing and assessment No. 168. Paris: OECD Publishing.
- OECD. 2015a. Test No. 442C: In chemico skin sensitisation: direct peptide reactivity assay (DPRA). Paris: OECD Publishing.
- OECD. 2015b. Test No. 442D: In vitro skin sensitisation: ARE-Nrf2 luciferase test method. Paris: OECD Publishing.
- OECD. 2016a. Guidance document on the reporting of defined approaches to be used within integrated approaches to testing and assessment. Series on testing and assessment No. 255. Paris: OECD Publishing.
- OECD. 2016b. Guidance document on the reporting of defined approaches and individual information sources to be used within integrated approaches to testing and assessment (IATA) for skin sensitisation. Series on testing and assessment No. 256. Paris: OECD Publishing.
- OECD. 2016c. Annex I: case studies to the guidance document on the reporting of defined approaches and individual information sources to be used within integrated approaches to testing and assessment (IATA) for skin sensitisation. Series on testing and assessment No. 256. Paris: OECD Publishing.
- OECD. 2017. Test No. 442E: In vitro skin sensitisation assays addressing the key event on activation of dendritic cells on the adverse outcome pathway for skin sensitisation. Paris: OECD Publishing.
- Patlewicz G, Jeliazkova N, Safford RJ, Worth AP, Aleksiev B. 2008. An evaluation of the implementation of the Cramer classification scheme in the Toxtree software. SAR QSAR Environ Res. 19:495–524.
- Patlewicz G, Casati S, Basketter DA, Asturiol D, Roberts DW, Lepoittevin JP, Worth AP, Aschberger K. 2016. Can currently available non-animal methods detect pre and pro-haptens relevant for skin sensitization? Regul Toxicol Pharmacol. 82:147–155.
- Piroird C, Ovigne JM, Rousset F, Martinozzi-Teissier S, Gomes C, Cotovio J, Alépée N. 2015. The Myeloid U937 Skin Sensitization Test (U-SENS) addresses the activation of dendritic cell event in the adverse outcome pathway for skin sensitization. Toxicol In Vitro. 29:901–916.
- Ramirez T, Stein N, Aumann A, Remus T, Edwards A, Norman KG, Ryan C, Bader JE, Fehr M, Burleson F, et al. 2016. Intra- and inter-laboratory reproducibility and accuracy of the LuSens assay: a reporter gene-cell line to detect keratinocyte activation by skin sensitizers. Toxicol In Vitro.32:278–286.
- Reisinger K, Hoffmann S, Alépée N, Ashikaga T, Barroso J, Elcombe C, Gellatly N, Galbiati V, Gibbs S, Groux H, et al. 2015. Systematic evaluation of non-animal test methods for skin sensitisation safety assessment. Toxicol In Vitro. 29:259–270.
- Roberts DW, Aptula AO, Patlewicz G. 2007a. Electrophilic chemistry related to skin sensitization. Reaction mechanistic applicability domain classification for a published data set of 106 chemicals tested in the mouse local lymph node assay. Chem Res Toxicol. 20:44–60.
- Roberts DW, Patlewicz G, Kern PS, Gerberick F, Kimber I, Dearman RJ, Ryan CA, Basketter DA, Aptula AO. 2007b. Mechanistic applicability domain classification of a local lymph node assay dataset for skin sensitization. Chem Res Toxicol. 20:1019–1030.
- Roberts DW, Api AM, Aptula AO. 2016. Chemical applicability domain of the local lymph node assay (LLNA) for skin sensitisation potency. Part 2. The biological variability of the murine local lymph node assay (LLNA) for skin sensitisation. Regul Toxicol Pharmacol. 80:255–259.
- Takenouchi O, Miyazawa M, Saito K, Ashikaga T, Sakaguchi H. 2013. Predictive performance of the human cell line activation test (h-CLAT) for lipophilic chemicals with high octanol-water partition coefficients. J Toxicol Sci. 38:599–609.
- Teunis M, Corsini E, Smits M, Madsen CB, Eltze T, Ezendam J, Galbiati V, Gremmer E, Krul C, Landin A, et al. 2013. Transfer of a two-tiered keratinocyte assay: IL-18 production by NCTC2544 to determine the skin sensitizing capacity and epidermal equivalent assay to determine sensitizer potency. Toxicol In Vitro. 27:1135–1150.
- Thyssen JP, Menné T, Schnuch A, Uter W, White I, White JM, Johansen JD. 2009. Acceptable risk of contact allergy in the general population assessed by CE-DUR-a method to detect and categorize contact allergy epidemics based on patient data. Regul Toxicol Pharmacol. 54:183–187.
- Urbisch D, Mehling A, Guth K, Ramirez T, Honarvar N, Kolle S, Landsiedel R, Jaworska J, Kern PS, Gerberick F, et al. 2015. Assessing skin sensitization hazard in mice and men using non-animal test methods. Regul Toxicol Pharmacol. 71:337–351.
- Vandebriel RJ, van Loveren H. 2010. Non-animal sensitization testing: state-of-the-art. Crit Rev Toxicol. 40:389–404.
- van Vliet E, Kühnl J, Göbel C, Martinozzi-Teissier S, Alépée N, Ashikaga T, Blömeke B, del Bufalo A, Cluzel M, Corsini E, et al. 2017. Cosmetics Europe Skin Tolerance Task Force Workshop: current state-of the-art and new options for assessing T-cell activation by skin sensitizers. ALTEX. https://doi.org/10.14573/altex.1709011
- Zang Q, Mansouri K, Williams AJ, Judson RS, Allen DG, Casey WM, Kleinstreuer NC. 2017. In silico prediction of physicochemical properties of environmental chemicals using molecular fingerprints and machine learning. J Chem Inf Model. 57:36–49.