
Abstract
Decision on the safety margin, for instance by using uncertainty factors (UFs), is a key aspect in setting Occupational Exposure Limits (OELs). We analyzed the UFs in 128 OEL recommendations from the European Commission’s Scientific Committee on Occupational Exposure Limits (SCOEL). We investigated factors expected to potentially influence the UFs, as well as a selection of factors that might influence how expert groups perceive quality or reliability of key studies. We extracted UFs explicitly stated in the recommendations (EUFs) and, when EUFs were missing, calculated an implicit safety margin (ISM) by dividing the point of departure (PoD) by the OEL. EUFs and ISMs were lower for recommendations based on human data than those based on animal data. EUFs and ISMs were also lower for No-Observed Adverse Effect Concentrations (NOAECs) than Lowest Observed Adverse Effect Concentrations (LOAECs). We saw no differences based on local vs systemic critical effects. Acute data resulted in lower EUFs and ISMs than subchronic. We saw no influence from status of key study (publication status, performer or funder), but high tonnage substances (1,000,000+ tonnes) have lower EUFs and ISMs than substances currently not registered under REACH. Although SCOEL methodology stated that UF should be documented, only 65 out of 128 OEL recommendations included an EUF. Indeed, the ratio of EUFs to ISMs even decreased from 1991–2003 to 2004–2017. Additionally, EUFs were, on average, 1.8 times higher than ISMs. We conclude that a more articulate framework for using UFs could enhance consistency and transparency of the SCOEL recommendations.
Introduction
In a previous study, we investigated the use and size of uncertainty factors (UFs) in the setting of Occupational Exposures Limits (OEL) by the Europeans Commission’s Scientific Committee on Occupational Exposure Limits (SCOEL) (Schenk and Johanson Citation2010). The previous study covered 75 indicative OEL values (IOELVs) described in 62 SCOEL documents published from 1991 to 2003. Although the SCOEL methodology for derivation of OELs (SCOEL Citation1999) specified that UFs were to be documented together with their justification, 31 IOELVs lacked such explicit uncertainty factors (EUFs). For these IOELVs, we calculated implicit safety margins (ISMs), by dividing the IOELV by the stated point of departure (PoD). The 44 EUFs ranged from 1 to 50 while the 31 ISMs only ranged from 1 to 5; the EUFs were also on average 2.1 times higher than the ISM. Furthermore, the EUFs remained unaffected over the investigated time period while the ISMs decreased slightly. The EUFs and the ISMs were only slightly affected by whether the PoD was based on animal or human data and whether it was a no-observed adverse effect concentration (NOAEC) or a lowest observed adverse effect concentration (LOAEC). Furthermore, the EUFs and ISMs of OELs based on using irritation as the PoD were similar to those using more severe systemic effects (Schenk and Johanson Citation2010).
A number of new health-based OEL recommendations have been published since we performed our previous study. As attitudes and policies in risk assessment have changed since 2003 (the last year covered by Schenk and Johanson Citation2010), this may have influenced the use and magnitude of UFs. However, while the SCOEL methodology has been updated, the guidance on UFs has remained the same (SCOEL Citation1999, Citation2009, Citation2013) until December 2017 when a newly structured methodology was adopted (SCOEL Citation2018). In this new methodology SCOEL more specifically lists the sources of variability and uncertainty that influence the evaluation of evidence, and also approaches to manage them, including in a few cases proposed default factors (e.g. for allometric scaling and volunteer data on sensory irritation). Currently available OEL recommendations from SCOEL have all been published prior to the adoption of the new methodology.
As stated in the methodology, SCOEL derives the UFs on a case-by-case basis, the methodology in place until 2017 furthermore specified that magnitude in most cases is dependent on the availability of and confidence in the NOAEC and PoD (SCOEL Citation2013, pp. 22–23). Case-by-case judgment is highly dependent on the experts involved and hence changes in committee members may have influenced the use and choice of UFs. Although SCOEL has several long-standing members, there have also been significant changes in members. According to records from 1995 until 2018, eleven individual experts have been appointed members for 15 years or more, four of these are still active in SCOEL in 2018 (SCOEL meeting notes 1995, 1999; EC Citation2002, Citation2006, Citation2009, Citation2015; Table S1).
Another change pertaining to the broad field of exposure guidance values for the workplace is the implementation of the European Union (EU) REACH (Registration, Evaluation, Authorization, and Restriction of Chemical substances) legislation which came into force in June 2007. For chemicals with an import/production exceeding 10 tonnes/year, the registrant has to perform a chemical safety assessment of which the derived no-effect level (DNEL) is a part. One kind of DNEL is similar to the OELs, in that it applies to inhalation exposure of workers. Such worker DNELs (wDNELs) were initially (before the first registration deadline) expected to turn out considerably lower than OELs for the same substance (Kreider and Williams Citation2010; Schenk and Johanson Citation2011). These expectations were based on the guidance provided by the European Chemicals Agency (ECHA), in particular the guidance on default assessment factors (AFs, serving the same purpose as UFs) which should be applied unless deviations can be justified (ECHA Citation2012). These ECHA default AFs are generally considerably higher than the EUFs and ISMs historically applied by SCOEL and other occupational standard setting committees. However, later comparisons between wDNELs (set by REACH registrants) and OELs have shown them to be rather similar, in particular for IOELVs (Nies et al. Citation2013; Schenk et al. Citation2014, Citation2015; Tynkkynen et al. Citation2015). In spite of this similarity, one may speculate that the introduction of the ECHA guidance and its AFs may have influenced the use and magnitude of UFs also for OEL setting groups such as SCOEL. Indeed, harmonization is evidently desired by the European Commission which recently requested the ECHA Risk Assessment Committee (RAC) and SCOEL to outline their present methods to derive wDNELs and OELs, respectively, with reference to similarities and differences including the use of AFs/UFs (ECHA Citation2015; RAC and SCOEL Citation2017).
However, there is also a trend within the broader exposure limit setting community towards more chemical specific approaches to reduce and quantify uncertainty (Dankovic et al. Citation2015; SCOEL Citation2018). Improved dose estimates through benchmark dose modeling, increased availability of toxicokinetic and toxicodynamic models and refined mode of action reasoning may all contribute to a need for lower and/or more specific UFs. Indeed, the ECHA guidance document for DNELs states that AFs based on substance-specific information should be replace the default assessment factors when possible (ECHA Citation2012). One such example is the chemical specific assessment factors (CSAFs), which are derived by using chemical-specific toxicokinetic and/or toxicodynamic data to account for interspecies differences and human variability in e.g. exposure limit derivation (WHO/ICPS Citation2005). However, the relative scarcity of such substance specific assessment factors is illustrated by Bhat et al. (Citation2017), who identified roughly 100 CSAFs, derived as parts of a regulatory risk assessment or published in the scientific literature. None of these were derived by SCOEL or any other OEL expert committee. However, several of the CSAFs identified from the published scientific literature were applied to the occupational setting: acetone (Mörk and Johanson Citation2010) methyl chloride, styrene, toluene (Mörk et al. Citation2014), N-methyl pyrrolidone (Poet et al. Citation2016), timolol maleate (Naumann et al. Citation2004) and local sensory irritants (Brüning et al. Citation2014).
The aim of the present study was to analyze SCOEL’s use of UFs when setting 8-h time-weighted average OELs, and aspects that may influence these UFs. It represents a follow up and an extension of our previous study (Schenk and Johanson Citation2010). A new aspect that is now included is the relation between the UF and the origin of the toxicological data, which could conceivably influence SCOEL’s assessment of UFs. For example, reliance on non-peer reviewed industry reports may require higher UFs. On the other hand, these reports may have been carried out according to better protocols (Good Laboratory Practice, adherence to OECD Guidelines) which would merit lower UFs. Another issue is that of vested interests, i.e. that a party may have an interest to promote or counteract a specific chemical and therefore use unscientific methods or avoid publishing data that speaks against their cause.
Materials and methods
The approach used in the present work follows that in Schenk and Johanson (Citation2010). The database was extended to all documents published by SCOEL until February 2017.
In total, we reviewed 192 SCOEL documents (including its predecessor the Scientific Expert Group, SEG). Cases where SCOEL recommended the same OEL (value and justification) for several substances with different CAS numbers, e.g. copper and inorganic copper compounds, were considered as one entry. Documents outlining risk estimates, e.g. for non-threshold carcinogens, were excluded. We also excluded documents that only proposed short-term exposure limits or biological limit values. Thus, the 192 documents resulted in a database of 128 OEL recommendations (8-h time-weighted average). We focus on the 8-h time-weighted averages as these are in most cases more complex to derive and are described in more detail than the STELs.
SCOEL documents are available through the website of the European Commission (http://ec.europa.eu/social/main.jsp?-catId=148&intPageId=684&langId=en, 2017-10-06). In case the SCOEL has updated their recommendation, only the most recent recommendation is published at this website. We were unable to retrieve old documents and hence only included one document per substance in our analyses. The documents included in the present study are tabulated in the Supplementary material (Table S2).
From each document the following information regarding the 8 h OEL was extracted and tabulated for further analysis:
Year of document.
Recommended OEL value.
Critical effect used for the PoD.
PoD data (value, dose estimate, exposure duration, species).
Key study for the PoD.
Total number of references.
Uncertainty factors applied (Explicit uncertainty factor, EUF).
Implicit safety margin, calculated as the PoD divided by the OEL.
If more than one endpoint was pointed out as a critical effect (29 recommendations), the one associated to the chosen PoD was used. If more than one PoD was raised (five recommendations), the one closest to the recommended OEL, as a proxy for being most relevant for the target population, was selected. Categories of critical effects containing less than 5 OELs were excluded from the analysis. PoD exposure duration was categorized in four groups: acute (exposures <2 wk), sub-acute (>2 wk), subchronic (>10 wk) and chronic (>52 wk, occupational exposure, or in case of developmental toxicity, reproductive studies covering the relevant period of gestation). Consideration was also given to the duration of exposure in studies cited as supporting the PoD, for instance if SCOEL cited chronic data as supporting a subacute/subchronic PoD, the PoD was tabulated as chronic.
As data on tonnage are not consistently reported in the SCOEL documents, tonnage and number of active registrations were collected from the ECHA chemical substances database (www.echa.eu, 2017-10-12 – 2017-10-13). For SCOEL recommendations on metals and their compounds (9 recommendations), the tonnage and registrant data for the pure metal only was tabulated. In case of multiple nonmetal substances (eight recommendations), the data for the substance with the highest tonnage were tabulated.
Occupational exposure limit recommendations containing statements such as ‘no UF is necessary’ were assigned an EUF of 1. For OEL recommendations without explicit statements on UFs, an ISM was calculated by dividing the PoD by the recommended OEL value. The value of the ISM is affected not only by the implicit safety factor but to some extent also by the preferred value approach, i.e. the rounding off of the OEL value to decimals of the integers 1, 2 or 5. If the ISM calculation required route-to-route extrapolation, we assumed 100% absorption via both routes, a body weight of 70 kg and a lung ventilation of 10 m3 per 8 h work-day.
Furthermore, key studies were retrieved (unavailable for eight of the 128 8 h OELs) and the following information was tabulated:
Publication year of key study
Publication type (scientific paper: reporting original data and published in the peer-reviewed scientific literature, report: reporting original data but not published in the peer-reviewed scientific literature, review/risk assessment: not reporting original data, other: e.g. personal communication, letter to the editor)
First author affiliation (industry, academia, and other)
Study funding (industry, governmental/independent, and not stated)
Based on author affiliation and funding statements we categorized the critical studies with respect to financial vested interest as follows:
Vested study – The first author is affiliated to an organization with an economic interest in the studied compound, and/or performed by a contract research organization.
Vested funding – The first author from academia or research institute and funding statement refers to funding by such organizations with interests.
Governmental – First author is from a governmental agency or first author is from academia or public institute with stated funding from governmental or other funding agencies without direct interests.
Not stated – First author is from academia but funding was not disclosed in the study.
Frequently, SCOEL used multiple key studies to identify the PoD, for such cases the publication year of the most recent key study was then tabulated. In all these cases, at least one key study was scientifically published, hence all were tabulated as scientific papers. Also in ten cases several key studies, authored by different research groups and reporting from different studies, not all key studies belonged to the same level of vested interest. For these we coded the entry according to the study representing the lowest degree of vested interest (Governmental < Not stated < Vested funding < Vested study).
Differences in counts were tested by the Chi-square test of independence. Other trends were analyzed by linear regression. Differences between groups were tested by Welch t-test or ANOVA. Significant results in ANOVA analyses were followed up by pairwise comparisons using t-tests with pooled standard deviations and Bonferroni correction of p values. EUFs and ISMs were log transformed in all analyses, as they are ratios. Number of references were log transformed to avoid heteroscedasticity. The software used in the analyses was R (version 3.3.2). Assumptions of normality and homogeneous variance were checked using the basic diagnostic plots of R commander (Rcmdr v2.3-2).
Results
Among the 128 reviewed 8 h OELs, we identified almost as many EUFs (65) as ISMs (63) (). However, these numbers mask a change over time. After subdivision of the material in two periods of equal length, it is seen that the use of EUFs has become less and ISMs more frequent (χ 2 n = 128, df = 1 = 9.0, p = .003). Moreover, ISMs were significantly lower than the EUFs across the full period, although the difference was only borderline significant for the later period (). Both EUFs and ISMs were lower on average for the period 2004–2017 than 1991–2003. However, differences between the two time periods were not statistically significant (), unless combining EUFs and ISMs (p = .003, Welch t-test on log transformed values).
Table 1. Comparison of explicit (EUFs) and implicit safety margins (ISMs) applied by SCOEL in the periods 1991–2003Table Footnote a and 2004–2017.
Similarly, regression analysis over time revealed no significant change for either EUFs or ISMs (). However, EUFs and ISMs combined revealed a significant decrease over time (β = −0.01, p = .006, r 2 = 0.06). Significant decreases were also seen for log EUF and for log EUF and log ISM combined versus year of key study (β = −0.01, p = .004, r 2 = 0.12 and β = −0.007, p = .002, r 2 = 0.08, respectively, ). The EUFs (β = −0.1, p = .02, r 2 = 0.09) and EUFs and ISMs combined (β = −0.1, p = .001, r 2 = 0.08) decreased with an increasing logarithm of the total number of references in the documents, but not ISMs alone (β = −0.04, p = .2, r 2 = 0.02). These effects may be related to the age of the documents as there was a pronounced trend of the logarithm of number of references to increase with year of document (β = 0.11, p < .0001, r 2 = 0.69; ).
Figure 1. Explicit uncertainty factors (EUF) and implicit safety margins (ISM) plotted over the year of the SCOEL document. Linear regression on log transformed EUFs and ISMs: EUFs β = −0.009, p = .14, r 2 = 0.03; ISMs β = −0.006, p = .21; r 2 = 0.03; combined β = −0.01, p = .006, r 2 = 0.06.
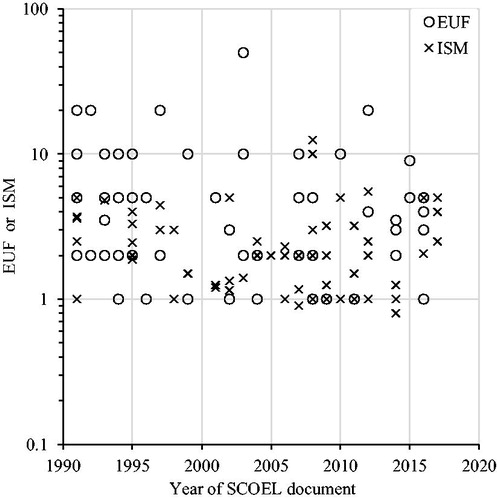
Figure 2. Explicit uncertainty factors (EUFs) and implicit safety margins (ISMs) plotted over the year of the most recent key study. Linear regression on log transformed EUFs and ISMs: EUFs β = −0.01, p = .004, r 2 = 0.12; ISMs β = −0.002, p = .34, r 2 = 0.01; combined β = −0.007, p = .002, r 2 = 0.08.
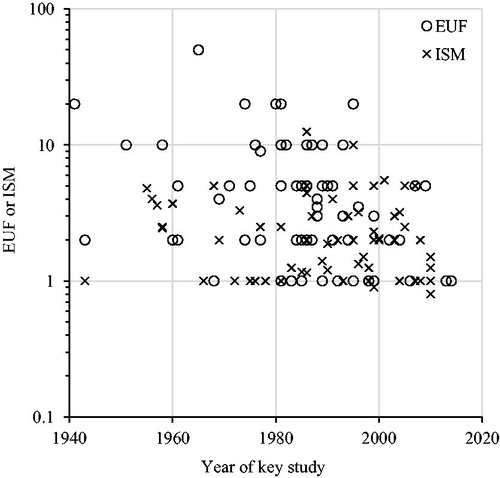
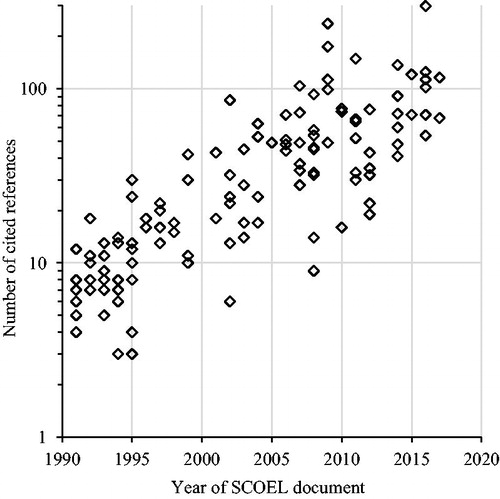
Figure 3. Number of references per document plotted over year of document. Linear regression on log transformed reference counts: β = 0.11, p < .0001, r 2 = 0.69.
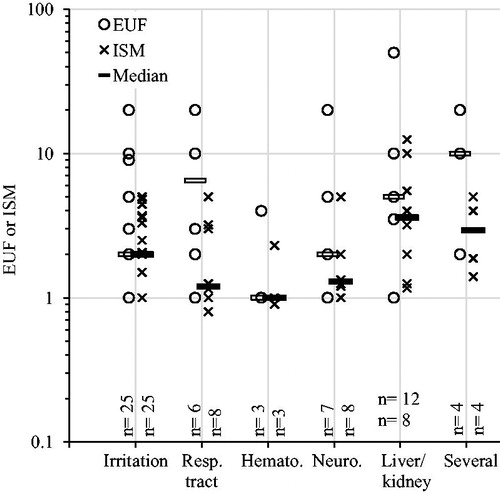
It is expected that more complex, and possibly severe, systemic effects have higher safety margins than effects such as irritation. Contrary to this expectation, the only statistically significant difference seen was that EUFs and ISMs combined were lower for hematological effects than for liver and kidney toxicity (). As a side note, however, the overall difference between EUFs and ISMs () was more pronounced for lung effects and systemic effects besides hematologic effects than for irritation ().
Figure 4. Explicit uncertainty factors (EUFs) and implicit safety margins (ISMs) plotted over nature of critical effect. Resp. tract: respiratory tract damage; Hemato.: hematological effects; Neuro.: neurotoxicity. Horizontal bars indicate median values. Numbers (n) indicate number of substances (EUFs/ISMs), only categories with at least five EUFs and ISMs were included. ANOVA analysis (log transformed values): EUFs p = .08, ISMs p = .07; combined p = .009. Pairwise comparisons showed that EUFs and ISMs combined were significantly lower for hematological effects than for liver/kidney toxicity (p = .05, t-tests with pooled standard deviations and Bonferroni correction of p values).
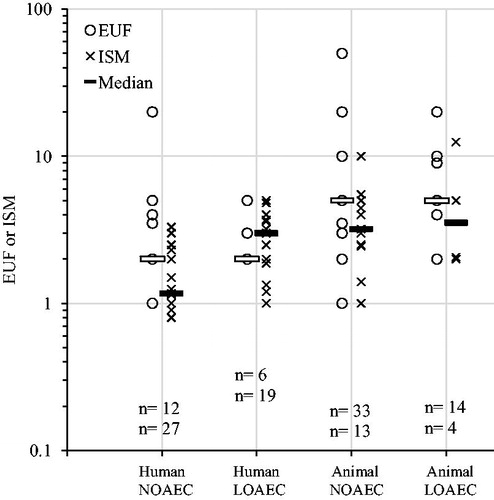
EUFs and ISMs plotted over kind of data used as PoD () shows a wide spread within categories, yet, as expected, the ratios tend to increase going from human to animal (significant for both EUFs and ISMs) and from NOAEC to LOAEC (significant for ISMs and ISMs and EUFs combined, ).
Figure 5. Explicit uncertainty factors (EUFs) and implicit safety margins (ISMs) plotted over type of data used as point of departure (PoD). Numbers (n) indicate number of substances. Both EUFs and ISMs were lower for human PoDs than for animal PoDs (EUF p = .008, ISM p = .004, Welch’s t-test on log transformed values). ISMs and ISMs and EUFs combined were lower than for PoDs that were NOAECs than for PoDs that were LOAECs (EUF p = .3 ISM p = .009 combined p = .04, Welch’s t-test on log transformed values).
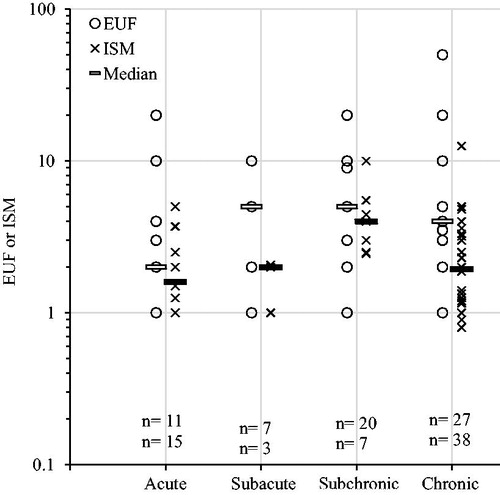
EUFs and ISMs are plotted over the duration of exposure of the key study in . The median values were slightly lower for acute exposures compared to longer exposures. However, differences between categories were not statistically significant for EUFs (p = .54), for ISMs (p = .03) and EUFs and ISMs combined (p = .02) subchronic PoDs yielded higher values than acute PoDs (). The lower EUFs and ISMs for acute PoDs are largely explained by the large number of SCOEL recommendations being based on acute human irritation data (see also ). Performing the same analysis on EUFs and ISMs for animal key studies only, yields non-significant results (EUFs p = .93, ISMs p = .16, combined p = .83).
Figure 6. Explicit uncertainty factors (EUFs) and implicit safety margins (ISMs) plotted over exposure duration of the key study. Horizontal bars indicate median values. Numbers (n) indicate number of substances (EUFs/ISMs). ANOVA analysis (log transformed values): EUFs p = .5; ISMs p = .03; combined p = .02. Pairwise comparisons showed that ISMs for subchronic PoDs were significantly higher than ISMs for acute and chronic PoDs (p = .03 and p = .05, t-tests with pooled standard deviations and Bonferroni correction of p values). Pairwise comparisons for the ISMs and EUFs combined showed that subchronic values were significantly higher than acute (p = .02, t-tests with pooled standard deviations and Bonferroni correction of p values).
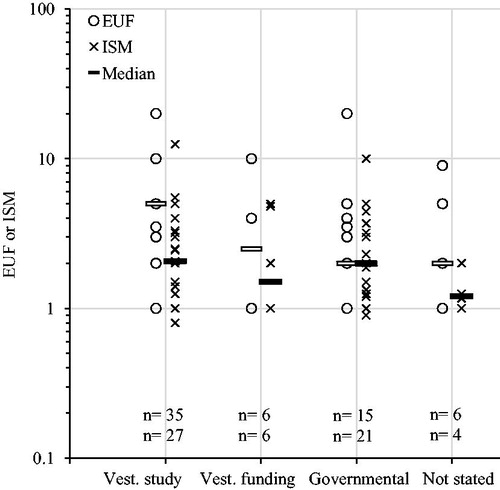
Publication status of the key study had no discernible influence on the size of EUFs and ISMs (). Neither was there a significant difference if only comparing EUFs and ISMs for PoDs derived from a scientific paper nor a report (EUFs p = .9, ISM p = .8, combined p = .8; Welch t-test on log transformed values). Furthermore, origin of key study, as measured by affiliation of first author, did not yield any statistically significant differences between EUFs (p = .3), ISMs (p = .7) or the two combined (p = .08). Neither did an analysis of funding statements (EUFs p = .6, ISMs p = .7, combined p = .4) nor our combined measure of level of vested interest (see methods; ).
Figure 7. Explicit uncertainty factors (EUFs) and implicit safety margins (ISMs) plotted over publication type of key study, see methods for definitions. Numbers (n) indicate number of substances (EUFs/ISMs). Horizontal bars indicate median values. ANOVA analysis (log transformed values): EUFs p = .2; ISMs p = .9; combined p = .7.
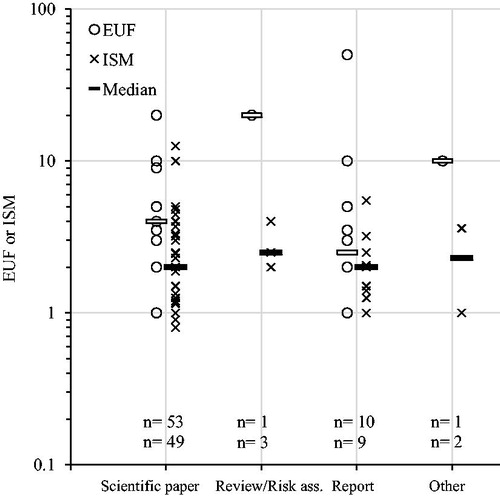
Figure 8. Explicit uncertainty factors (EUFs) and implicit safety margins (ISMs) plotted over level of vested interest category, see methods for definitions. Horizontal bars indicate median values. Numbers (n) indicate number of substances (EUFs/ISMs). ANOVA analysis (log transformed values): EUF p = .6; ISM p = .8; combined p = .4.
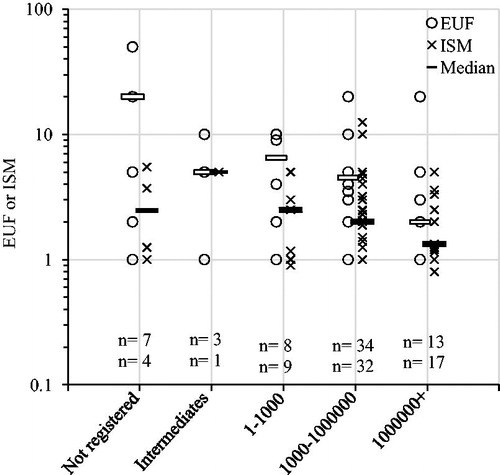
We found a statistically significant negative correlation between number of registrations and log transformed EUFs (β = −0.003, p = .02, r 2 = 0.08) as well as EUFs and ISMs combined (β = −0.002, p = .005, r 2 = 0.06), although the variation explained by number of registrations was very small (). Similarly, there was a significant negative relation between tonnage and EUFs and ISMs combined (p = .02), in which EUFs and ISMs were higher for not registered substances than for substances in the highest tonnage category (). Substances that have many registrations and/or are produced in high tonnages have presumably been investigated in more depth and with more high quality studies, including e.g. human data. However, whether the PoD was human or animal was not predicted by number of registrations (logistic regression χ 2 = 1.9, p = .2) or tonnage category (χ 2 n = 128, df=4 =5.0285, p = .3).
Figure 9. Explicit uncertainty factors (EUFs) and implicit safety margins (ISMs) plotted over number of active registrations (as of October 2017). Log scale on both y- and x-axis, unregistered substances are plotted at 0.2 (left in figure). Linear regression on log transformed EUFs and ISMs: EUF β = −0.003, p = .02, r 2 = 0.08; ISMs β = −0.0008, p = .16, r 2 = 0.03; combined β = −0.002, p = .005, r 2 = 0.06.
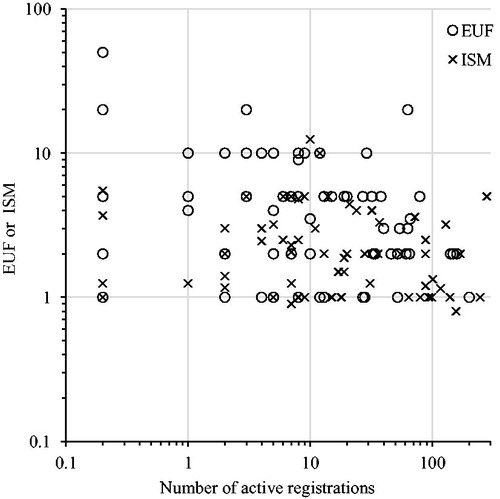
Figure 10. Explicit uncertainty factors (EUFs) and implicit safety margins (ISMs) plotted over total registered tonnage groups (as of October 2017). Horizontal bars indicate median values. Numbers (n) indicate number of substances (EUFs/ISMs). ANOVA analysis (log transformed values): EUFs p = .1; ISMs p = .3; combined p = .02. Pairwise comparisons showed that EUFs and ISMs combined were higher for not registered substances than for substances in the highest tonnage category (p = .01, t-tests with pooled standard deviations and Bonferroni correction of p values).
Discussion
This follow up study confirmed some of the findings in the previous study (Schenk and Johanson Citation2010) but also identified a few changes in the period of 2004–2017, as compared to the previous period of 1993–2003. In the following, we compare our findings for the two time periods and then discuss the changes in the perspective of regulatory developments in Europe. First, it should be noted that the numbers reported for 1993–2003 in the present work differ slightly from those given in our previous study for the same period. The main reason is that our previous study only considered SCOEL recommendations that at the time had been implemented as indicative occupational exposure limit values (IOELVs) by the European Commission. Another reason is that some recommendations were updated since our previous study, for these only the most recent document was included in the present study (as older versions are not made available on the website of the European Commission).
A finding in both studies is that EUFs on average are higher than ISMs. Although this difference seems to have decreased over time as EUFs were 1.5 times higher than ISMs in the second period compared to 1.8 times higher in the first period (2.1 times higher for the IOELVs investigated in Schenk and Johanson Citation2010). However, difference in average level between the two time periods was not statistically significant for either EUFs or ISMs (although when combined the values are significantly lower for the second period). Strikingly, the EUFs have become less frequent than ISMs over time. This is contrary to the SCOEL methodology (SCOEL Citation2013) which states that the choice of UFs should be documented and justified. SCOEL was more likely to apply ISMs for recommendations based on human data, and more likely to apply EUFs for subchronic PoDs, indicating that the use of EUFs vs ISMs to some degree is governed by the complexity of the extrapolation being made.
There was no correlation between the EUFs and ISMs and the number of cited references, although this is likely an insufficient indicator of available knowledge given that SCOEL in the past generally has relied on recent toxicological reviews and risk assessments from other sources as a basis for their own evaluation and only cited the identified key bibliography. However, as also noted in Schenk and Johanson (Citation2010), the use of references in the summary documents has increased over time.
Compared to Schenk and Johanson (Citation2010) we saw a higher number of statistically significant effects from the factors expected to potentially influence UFs (age of documents and data, number of references, PoD and exposure duration). This may not be an effect of changes in the SCOEL approach to UFs as much as the current work being based on a larger database of OELs thus achieving higher statistical power. As expected by developments in methods for measuring effects and exposures as well as by improved standards for documentation of scientific studies, older key studies were connected to higher EUFs and ISMs, although this was not seen for ISMs alone. We saw little influence from severity of the critical effect as EUFs and ISMs for OEL recommendations based on irritation were similar to those for OELs based on more severe local or systemic effects. However, among systemic effects liver and kidney toxicity had higher EUFs and ISMs than hematological effects. Whether the PoD was from animal or human data affected both the EUFs and ISMs, and whether the PoD was a NOAEC or LOAEC affected ISMs and EUFs and ISMs combined. However, like in the previous study, the difference was relatively small between categories, the median ISMs ranged from 1.5 to 5 (Human NOAEC to Animal LOAEC) and median EUFs from 2 to 5. Also, the lowest values of the EUFs and ISMs for each of the four categories are within a factor of 2.5 (0.8–2), slightly less pronounced than the factor of 3 found previously (Schenk and Johanson, Citation2010). In our previous study, the distribution of ISMs over duration of the key study was opposed to the expected, i.e. higher ISMs were associated with chronic data. A similar trend was seen in the present study, as ISMs for acute and chronic data were similar and ISMs and EUFs combined were lower for acute data than those for subchronic data. Acute data were generally human data on irritation effects, which require lower ISMs/EUFs than animal data and observational data (for which uncontrolled exposures may add to the uncertainties). For EUFs, no significant differences were found based on exposure duration.
From a risk assessment perspective, also the quality of the key studies may influence the UF. Uncontrolled exposures, low number of study subjects or limitations to the health end-points investigated are factors not investigated in the present study, but that would add to the uncertainty of an OEL and may explain some of the remaining variability of EUFs and ISMs.
The origins of the data had no discernible effect on the EUFs or ISMs. Publication status, author affiliation and funding statements all yielded non-significant results. This is in line with our expectation that SCOEL selects the most relevant study of sufficient quality as key study. What can be noted from these analyses is the importance of industry derived data, more than half (52%) of the investigated SCOEL recommendations for which key studies were retrievable (n = 119) were based on a PoD from industry data. An additional 9% (n = 11) of key studies were performed with open/explicit financial support from industry sources. Hence, already before the introduction of REACH, industry has been a major provider of toxicological data for occupationally used chemicals.
We noted a slight effect of economic importance (measured as number of registrations and tonnage) of the substances on the magnitude of the EUFs and ISMs. Although the explained variation was very small, there was a trend of EUFs decreasing as the number of active registrations increased. This trend was also seen for EUFs and ISMs combined. In addition, for the EUFs and ISMs combined, values were higher for unregistered substances than for substances in the highest tonnage category. These relationships need further exploration as there likely are connections to the economic importance of the substances and the amount and quality of toxicological studies performed.
The present study only investigated whether SCOEL adapted the magnitude of EUFs or ISMs to certain sources of potential interests. This does not cover aspects such as influence on selection of critical effect and PoD or whether the primary data are indeed influenced by the financial interests involved. Furthermore, the present paper does not investigate any potential influences from the conflict of interest of the SCOEL members. Further analyses could study connections to national industry (although members are appointed in their personal capacity and not as representatives of their member states) or connections to employers, research funders, etc. However, declarations of interest are only available for the most recently appointed mandate period (starting 2015).
Another source of potential vested interest not further investigated herein is that of consumer or employee groups calling for stricter regulations or phasing out of certain chemicals. Candidates among the substances covered in the present study are lead, diacetyl and phosphine, all of which have been subject to legal action due to alleged insufficient protective measures regarding environmental release, occupational and/or consumer use.
The findings of the present study are contrary to expectation in many ways. As hypothesized previously, the introduction of REACH and the REACH guidance on derived no effect levels (DNEL) could push the OEL setting practice towards a more explicit use of UFs, and possibly also towards higher UFs (Schenk and Johanson Citation2011). This seems not to have been the case so far as the use of EUFs is decreasing in SCOEL documents, and the level of EUFs has not increased. More importantly, the decreased use of EUFs is, as already noted, also in contradiction to SCOEL’s own methodology. In cases where no EUFs are presented, the general reasoning of uncertainty and its translation to UFs may still have been applied, however, transparency is lost.
Conclusions
Among the expected scientific factors, the largest influence seen was that for OEL recommendations based on human data the EUFs and ISMs were lower than if based on animal data. Also, NOAECs had lower ISMs and EUFs and ISMs combined than LOAECs. Influence seen from critical effect or duration of exposure differed from our expectations. Like in our previous analysis (Schenk and Johanson Citation2010) safety margins became higher when UFs were explicitly used to derive the OELs. However, while we expected that the use of EUFs would increase, in line with the SCOEL methodology and regulatory developments such as REACH, the use of EUFs has actually decreased since our earlier analysis of SCOEL documents. As previously stated, we find that reference to expert judgment cannot justify lack of transparency and, accordingly, OEL setters should clearly document choice of UFs and the aspects they are intended to cover. Hence, we again recommend SCOEL to develop and adhere to a more articulate framework for their use of UFs in order to enhance the consistency and transparency of their recommendations. The recently published document (SCOEL Citation2018), is a step in this direction, as it outlines different sources of uncertainty and variability in more detail, as well as approaches to handle these.
Declaration of interest
Gunnar Johanson is a member of SCOEL. The authors? affiliations are as shown on the cover page. Neither of the authors have appeared in any legal or administrative proceedings related to the contents of the paper with the exception that Gunnar Johanson (as a member of SCOEL) participated in the task Joint Task Force ECHA Committee for Risk Assessment (RAC) and SCOEL on Scientific aspects and methodologies related to the exposure of chemicals at the workplace. This work was funded by the Swedish Research Council for Health, Working Life and Welfare (FORTE) [grant number 2016-00229], which is a government agency under the Swedish Ministry of Health and Social Affairs. The funding agency had no role in the research performed, writing of the manuscript or the decision to submit.
Supplemental material
Supplemental material for this article is available online here .
Supplementary_material.docx
Download MS Word (25.3 KB)Acknowledgements
The authors thank the five reviewers selected by the Editor and anonymous to the authors for insightful and constructive comments which were very helpful in improving the manuscript.
Related Research Data
References
- Bhat VS, Meek ME, Valcke M, English C, Boobis A, Brown R. 2017. Evolution of chemical-specific adjustment factors (CSAF) based on recent international experience; increasing utility and facilitating regulatory acceptance. Crit Rev Toxicol. 47:729–749.
- Brüning T, Bartsch R, Bolt HM, Desel H, Drexler H, Gundert-Remy U, Hartwig A, Jäckh R, Leibold E, Pallapies D, et al. 2014. Sensory irritation as a basis for setting occupational exposure limits. Arch Toxicol. 88:1855–1879.
- Dankovic DA, Naumann BD, Maier A, Dourson ML, Levy LS. 2015. The scientific basis of uncertainty factors used in setting occupational exposure limits. J Occup Environ Hyg. 12:S55–S68.
- ECHA – European Chemicals Agency. 2012. Guidance on information requirements and chemical safety assessment Chapter R.8: Characterisation of dose [concentration]-response for human health. Version 2.1; [accessed 2018 Apr 24]. https://echa.europa.eu/documents/10162/13632/information_requirements_r8_en.pdf/e153243a-03f0-44c5-8808-88af66223258
- European Chemicals Agency (ECHA). 2015. Note for the attention of Dr Tim Bowmer, Chairman of the Committee for Risk Assessment. I(2015)0377; [accessed 2018 Apr 24]. https://echa.europa.eu/documents/10162/13641/rac_mandate_attention_en.pdf/7931cbb7-8f3d-4f65-a081-728fad8a237e
- European Commission (EC). 1995. SCOEL meeting notes, SCOEL meeting number 23, 22 September 1995.
- European Commission (EC). 1999. SCOEL meeting notes, SCOEL meeting number 37, 21 September 1999.
- European Commission (EC). 2002. Appointment of the Scientific Committee for Occupational Exposure Limits to Chemical Agents (2002/C 245/03). OJ C 245/5.
- European Commission (EC). 2006. COMMISSION DECISION of 18 August 2006 appointing members of the Scientific Committee for Occupational Exposure Limits to Chemical Agents for a new term of office (2006/573/EC). OJ L 228/22.
- European Commission (EC). 2009. COMMISSION DECISION of 18 December 2009 appointing members of the Scientific Committee for Occupational Exposure Limits to Chemical Agents for a new term of office (2009/985/EU). OJ L 338/98.
- European Commission (EC). 2015. COMMISSION DECISION of 14.4.2015 appointing members of the Scientific Committee on Occupational Exposure Limits for Chemical Agents for a new term of office. Brussels, 14.4.2015 C(2015) 2369 final.
- Kreider ML, Williams E. 2010. Interpreting REACH guidance in the determination of the derived no effect level (DNEL). Regul Toxicol Pharmacol. 58:323–329.
- Mörk AK, Jonsson F, Johanson G. 2014. Adjustment factors for toluene, styrene and methyl chloride by population modeling of toxicokinetic variability. Regul Toxicol Pharmacol. 69:78–90.
- Mörk AK, Johanson G. 2010. Chemical specific adjustment factors for intra-species variability of acetone toxicokinetics using a probabilistic approach. Toxicol Sci. 116:336–348.
- Naumann BD, Dolan DG, Sargent EV. 2004. Rationale for the chemical-specific adjustment factors used to derive an occupational exposure limit for timolol maleate. Human Ecol Risk Assess. 10:99–111.
- Nies E, Musanke U, Püringer J, Rühl R, Arnine M. 2013. DNELs for workplaces – observations from an inspection of the DGUV DNEL list. Gefahrstoffe Reinhaltund Der Luft. 73: 455–462.
- Poet TS, Schlosser PM, Rodriguez CE, Parod RJ, Rodwell DE, Kirman CR. 2016. Using physiologically based pharmacokinetic modeling and benchmark dose methods to derive an occupational exposure limit for N-methylpyrrolidone. Regul Toxicol Pharmacol. 76:102–112.
- RAC and SCOEL. 2017. Joint Task Force ECHA Committee for Risk Assessment (RAC) And Scientific Committee on Occupational Exposure Limits (SCOEL) on Scientific aspects and methodologies related to the exposure of chemicals at the workplace; [accessed 2018 Apr 24] https://echa.europa.eu/documents/10162/13579/rac_joint_scoel_opinion_en.pdf/58265b74-7177-caf7-2937-c7c520768216
- Schenk L, Johanson G. 2010. Use of uncertainty factors by the SCOEL in their derivation of health-based occupational exposure limits. Crit Rev Toxicol. 40:791–798.
- Schenk L, Johanson G. 2011. A quantitative comparison of the safety margins in the European indicative occupational exposure limits and the derived no-effect levels for workers under REACH. Toxicol Sci. 121:408–416.
- Schenk L, Palmen N, Theodori D. 2014. Evaluation of worker inhalation DNELs Part A: Quality assessment of a selection of DNELs. Part B: Discussion paper on the possibilities to improve the overall quality of DN(M)ELs. RIVM Letter report 110001001/2014.
- Schenk L, Deng U, Johanson G. 2015. Derived No-Effect Levels (DNELs) under the European chemicals regulation REACH – an analysis of long-term inhalation worker-DNELs presented by industry. Ann Occup Hyg. 59:416–438.
- SCOEL. 1999. Methodology for the Derivation of Occupational Exposure Limits. Key documentation. EUR 19253; European Commission. Luxemburg: Office for Official Publications of the European Communities.
- SCOEL. 2009. Methodology for the Derivation of Occupational Exposure Limits: Key Documentation (version 6). Employment, Social Affairs & Inclusion; European Commission.
- SCOEL. 2013. Methodology for the Derivation of Occupational Exposure Limits: Key Documentation (Version 7). Employment, Social Affairs & Inclusion; European Commission.
- SCOEL. 2018. Methodology for derivation of occupational exposure limits of chemical agents. The general Decision-Making Framework of the Scientific Committee on Occupational Exposure Limits (SCOEL) 2017. Employment, Social Affairs & Inclusion; European Commission.
- Tynkkynen S, Santonen T, Stockmann-Juvala H. 2015. A comparison of REACH-derived no-effect levels for workers with EU indicative occupational exposure limit values and national limit values in Finland. Ann Occup Hyg. 59:401–415.
- WHO/ICPS. 2005. Harmonization Project Document No. 2. Chemical-Specific Adjustment Factors for Interspecies Differences and Human Variability: Guidance Document for Use Of Data In Dose/Concentration–Response Assessment. Geneva: WHO. ISBN 92 4 154678 6; [accessed 2018 Apr 24]. http://www.who.int/ipcs/methods/harmonization/areas/csaf/en/