
 ?Mathematical formulae have been encoded as MathML and are displayed in this HTML version using MathJax in order to improve their display. Uncheck the box to turn MathJax off. This feature requires Javascript. Click on a formula to zoom.
Abstract
Lung cancer mortality (LCM) has been associated with smoking and air pollution. This article draws on smoking relationships to clarify air pollution relationships. We analyzed cohort and population-based smoking studies and identified effects of latency and cumulative exposures. We found cogent relationships through longitudinal rather than cross-sectional analysis, thus involving historical data. We also considered passive smoking, occupational exposures, radon, and established carcinogens. We found stable nonsmoking LCM rates during periods of improving ambient air quality. We considered 59 cross-sectional studies of lung cancer and air pollution and found similar statistically significant relative risks for PM2.5, PM10, EC, NO2, SO2, SO2−4, and O3, and minimal risks for benzo(alpha)pyrene and trace metals. Most air pollution studies did not consider latency, exposure duration, or temporal trends; none included estimates of smoking risks implied by their models. We conclude that while LCM studies of smoking, radon, and occupational exposures appropriately considered latency and cumulative exposures; ambient air quality studies have not. Lung cancer has a long memory and exposure histories are required. Effects of cumulative exposures after pollution abatement include substantially reduced risk estimates, delayed health benefits, inability to show accountability for the abatement. However, associations of lung cancer with ambient air pollution cannot be ruled out, especially for historic periods when much higher exposures persisted. Given the major reductions in air quality and smoking habits that have been realized since the Clean Air Act, new studies of LCM and air pollution, including smoking histories and exposure data decades before diagnosis, are needed.
Lifetime cigarette consumption is a good predictor of lung cancer risk.
The latent period for lung cancer ranges from about 10 to 30 y.
Lung cancer risks for nonsmokers have been stable during the period when ambient air quality improved substantially.
Risks of established airborne carcinogens may have been important in the past but not under current conditions.
Radon can be important.
Air pollution-lung cancer risks should be evaluated jointly with smoking risks but are sensitive to their accuracy.
When cumulative exposures to conventional air pollutants are considered rather than concurrent, the applicable risk estimates may decrease by an order of magnitude and abatement benefits will not be readily apparent.
Most of the recent cross-sectional studies of lung cancer and regulated air pollutants did not consider latency, duration of exposure, or established carcinogens and their findings have been misinterpreted.
Effects of smoking on LCM are now well established as are the spatial distributions of ambient air pollution; however, linkages among the three parameters remain uncertain.
Highlights
1. Introduction
Lung cancers comprise the bulk of cancer deaths in the United States and the sixth-largest cause of death worldwide, having increased substantially since the 1950s. At that time, smoking and exposures to air pollution were considered the primary causes; radon and occupational exposures have also been identified (Hueper Citation1951). Those risk factors tend to be smaller than risks of smoking but could potentially affect more individuals, especially after the substantial declines in smoking prevalence. The interplay between lung cancer mortality (LCM) relationships with air pollution and smoking has been investigated since the 1950s but considered separately more recently. Here we consider whether LCM differences dominated by smoking risks may relate to additional risks from ambient air pollution and other agents, and we contrast the distinction between “controlling” for smoking (i.e. yes/no) in epidemiology and modeling its exposures and effects in terms of intensity and duration.
Epidemiological studies of lung cancer and smoking or occupational exposures have been published for cohorts as well as populations and considered age, gender, smoking intensity, exposure duration, and latency period. Cigarette smoking has by far the strongest effects on lung cancer with risks relative to nonsmokers as high as 50, whereas the relative risks reported for air pollution seldom exceed 1.2.
Most studies of environmental effects on LCM have been based on spatial gradients and coincident outdoor air quality at fixed time periods. That study design effectively describes places, i.e. locations of individual residences, but provides no information about conditions leading up to disease incidence. Note that in a cohort, smoking is assigned to individuals while air quality is assigned to groups (populations) since personal exposure data are never available for sufficient numbers of individuals. By contrast, population-based studies must rely on grouped smoking data, such as cigarette sales, suitable for longitudinal studies of trends in both air quality and smoking. We found no such studies in our searches of PubMed.
Ambient air quality in the United States and elsewhere has improved steadily since the 1950s. By contrast, lung cancer and smoking rates exhibited trend reversals during this period, by contrast with China for example (Yang et al. Citation2020). In this article, we show that exposure timing is important in distinguishing risks associated with environmental exposures from the much larger risks of smoking. Lung cancer in nonsmokers is of special interest with respect to environmental tobacco smoke (ETS), occupational exposures, and ambient air pollution.
Our overall objective was to examine relationships between lung cancer and air pollution in the context of relationships between lung cancer and smoking given the similar nature of these agents (Husgafvel-Pursiainen Citation2004) and defining their independent effects. Smoking exposure protocols involve intensity (cigarettes per day), timing (latency, lag period), duration (age at beginning to smoke, time-history of exposure), and prior conditions (time since quitting, time after pollution abatement). Air pollution exposures depend on concentration and duration. We considered the physics and chemistry of cigarette smoke and ambient air pollution with respect to carcinogenic constituents, some of which have been poorly defined.
Our approach was to first summarize the findings of 7 cohort smoking studies in terms of LCM as functions of age and smoking parameters, emphasizing cumulative cigarettes smoked (CCS) including LCM data for nonsmokers We considered 3 population-based smoking studies including a new longitudinal analysis of LCM in the U.S. population since 1935. We then evaluated studies of air pollution and lung cancer in terms of their” controls” for smoking. We summarized 60 of the extant outdoor air pollution studies in this context. For comparison, we also examined the literature on LCM and established carcinogens including radon, benzo(alpha)pyrene and trace metals. We focus our review on studies of cohorts and populations from the United States and the United Kingdom.
We then examined how the smoking relationships, notably latency and cumulative exposures, could inform our expectations with respect to air pollution. We discuss dose- or exposure-response functions (ERFs), models of smoking effects, latency issues, airborne carcinogens, evidence for causality, and the implications of our findings for future studies of air pollution and LCM (Appendices include additional source material and data sources).
1.1. Literature searches
The literature on lung cancer is extensive. We searched the entire NIH PubMed database for review papers and found 155 with (human) “lung cancer” and “air pollution” in abstract or title. Adding “smoking” to the search terms reduced the count to 65 papers and excluding “indoor” reduced it to 45, two of which involved cohorts (Whitrow et al. Citation2003; Gamble et al. Citation2012). Because of this relatively sparse extant database, we concluded that our study design had the potential to yield new and timely information.
1.2. Use of historical data
Historical data and patterns are important in these analyses, given the major improvements in ambient air quality and trend reversals in smoking prevalence and LCM rates that have occurred in recent decades. The timelines in Appendix A show some of the changes during the past century. Smoking prevalence increased until about 1970 and then decreased by about a factor of 4. A similar trend reversal in LCM followed about 20 y later. Residential coal burning was a major source of air pollution prior to about 1950; we used data on retail coal consumption as a basis for estimating such earlier urban conditions.
Concerns about rising rates of lung cancer began in the 1950s and it is likely that the reliability of lung cancer diagnosis reliability may have since improved. We thus expected that, with the use of more recent data, the reliability of our effect estimates would be to improve and we concluded that longitudinal analyses would be appropriate.
A national air quality monitoring program for suspended particulate matter (TSP) was instituted in 1953 including chemical composition data. After passage of the Clean Air Act of 1970 detailed monitoring of PM was terminated and routine monitoring of additional pollutants began, including gases. National monitoring of the fine particles (PM2.5) of current concern began in 1999 after a more limited program from 1979 to 83 (Lipfert et al. Citation1988). We estimate that PM2.5 concentrations have now improved by a factor of 3 since 1980 (3.7%/y). It is thus clear that historical data are required to estimate the air pollution exposure data required for comparison with trends in smoking and lung cancer since about 1960.
2. Methods and data
2.1. Methods
2.1.1. Smoking effects
We extracted data on LCM and smoking statistics from the studies we identified. To facilitate LCM comparisons among cohorts on a common basis, we estimated cumulative tobacco smoke exposure as the product of intensity (cigarettes/day) and years smoked, i.e. CCS. This metric is similar to those used for occupational exposures (years worked). The underlying assumptions are that cohort members who smoked at recruitment continued to do so during follow-up at the same rate, during which none began smoking. Population data correspond to conditions at death and we assume that deceased smokers had continued to smoke since about age 20. The actual age of beginning to smoke is likely to be independent from other variables in our analyses and not critical to our conclusions. Recent air pollution cohort studies have “controlled” for smoking with limited consideration of differences in smoking behavior or duration among cohort members and without providing evidence of the effectiveness of such controls. Moolgavkar et al. (Citation2018) examined methods of characterizing smoking for all-cause mortality and noted modifications by age.
Recall bias and uncertainties may have influenced individual estimates of smoking intensity or initiation. Cohort studies usually present their findings in groups or “bins”, for example, by age, smoking intensity, or duration; we used the midpoints of such bins in our regression analyses and data plots.
Ordinary least-squares (OLS) multiple regression was our primary analytical tool for estimating linear relationships and their 95% confidence intervals. Since studies of mortality usually find semi-log relationships with age, we used the logarithm of LCM or relative risk as dependent variables. The regression CCS coefficients comprise ERFs for cigarette smoking; the y-intercept provides a risk estimate for nonsmokers and includes any occupational or environmental effects. We use the ERF terminology because relationships between exposure and actual doses to the lung are not well defined, thus precluding estimating dose-response functions.
Latency (induction period) is an important issue in studies of cancer. In a cohort study for which the rate of exposure is assumed to have remained constant as the cohort ages, the delay of cancer incidence until ages 30–40 could be interpreted as an induction period. In longitudinal analyses, we estimated latency directly as the time interval between population averages of cigarette consumption and lung cancer mortality. We did not distinguish between lung cancer incidence and mortality because of the historically low lung cancer survival rates.
2.1.2. Air pollution effects
In the early studies, smoking-LCM differences between urban and rural residences were interpreted as air pollution effects, but more recent cohort smoking studies have neglected possible contributions from ambient air pollution (e.g. Burns et al. Citation1996). Air pollutant exposures have usually been based on averages at recruitment or during follow-up. We used estimated cumulative air pollution exposures (μg/m3-y) to represent total lung deposits, which are important in studies of particle inhalation effects. Cumulative air pollution exposure during a period of improving air quality is given by the concentration integral over exposure time.
2.2. Data
2.2.1. Lung cancer data
We extracted LCM rates and smoking data from the literature and added air quality data from various published sources. In this regard, we contrast the various spatial scales of the sources of the variables of interest: personal (age, gender, race, smoking status), immediate environs (socioeconomic status), and county environs (urban, rural, ambient air quality). LCM rates are now higher in rural rather urban areas and have declined during the last decade by about 20% and 30%, respectively (O'Neil et al. Citation2019).
We present effects on LCM rates in terms of deaths per 100,000 population or as risks relative to nonsmokers (RRs). For categorical attributes such as occupational or ETS exposures, RR is the proportion of risk due to having the condition (yes, no). The relative risks of LCM depend on the baseline mortality rate (RR = 1). Log-linear regressions of mortality rates and relative risks provide identical ERFs. We expressed ERFs as ln(LCM) per million cigarettes smoked from age 20.
2.2.2. Smoking data
The primary data on individual smoking comprise intensity (packs of cigarettes per day) and duration (age begun). Smoking exposures are personal, based on the recollections of individuals, whereas ambient air quality exposures in the lung cancer studies reviewed here are ecological, inferred from a limited set of monitors that do not account for indoor or personal exposures. The most reliable ETS risks are obtained by comparing smoking and nonsmoking spouses. Several studies of interest are based on group cigarette consumption rather than individual smoking habits. Consumption data based on counts have the advantage of accuracy at the expense of relevance since they only pertain to total populations of all smoking statuses. Nevertheless, we show that population consumption data are useful in longitudinal analyses.
2.2.3. Ambient air quality data
Ambient air quality has improved considerably over time in both the U.S. and U.K. We focused on particulate species because of the likelihood of accumulation in the respiratory system. We extracted data on U.S. ambient air quality from various publications and compared their temporal trends (). Concentrations of primary pollutants (B[a]P though V) decreased at a mean annual rate of about 9.6%; rates of change were slower for secondary pollutants like PM2.5 and SO2−4. The 2002 data are from Lipfert et al. (Citation2006); the earlier data are from NASN and EPA annual reports (see “Air Quality References” below). Trends in personal exposures have not been systematically quantified (Lipfert Citation2015).
Table 1. Trends in measures of air pollution (μg/m3).
Particulate matter in the U.K. (“British smoke” or “black smoke) has long been characterized by the blackness of sampling filters, scaled to correspond to the total suspended particulate (TSP) metric used in the U.S. The estimated mean particle size is 4.4 μm; in this sense BS thus resembles PM2.5. Here we designate this measure as “BS”. Similar measures were used in the U.S. in previous decades, referred to as “smoke”, “smokeshade”, or “coefficient of haze” (COH). We obtained national mean values of BS from 1962 to 1994 in the UK from the British Quality of Urban Air Review Group (QUARG Citation1996, Fig 6.7). Chemically, BS is similar to elemental carbon (“EC”), which is a small percentage of TSP.
In order to examine latency, we needed air quality data well before ambient monitoring began. Note that the annual rates of change are substantial; 9%/year amounts to an order of magnitude over 27 y. Sterling and Pollack (Citation1972) presented data on national retail coal sales from 1900 to 1968; we estimated ambient PM levels back to 1935 using a relationship between coal sales and PM data (R = 0.95). Coal consumption has also been used more recently as an air quality indicator (Lin et al. Citation2019). We had no data on air pollution such from indoor sources such as solid fuel combustion. Bold-face values and confidence intervals are at the 95% level.
3. Results
3.1. Cohort studies of smoking effects
3.1.1. The American Cancer Society Cancer cohorts
The ACS Cancer Prevention Studies (CPS) are the largest and most important U.S. cancer studies, comprising a total of about 2.2 million subjects followed from 1952 to 1988 in three separate cohorts: the Hammond and Horn (Citation1958) pilot study from 1952 to 55 that we labeled “CPS-0”, CPS-I from 1959 to 1965, and CPS-II, from 1982 to 88. CPS-I follow-up was later extended through 1972 (Burns et al. Citation1996). compares these cohorts, none of which considered air pollution directly.
Table 2. Characteristics of the ACS CPS cohorts for males.
Rodriguez et al. (Citation2001) compared details for the male subjects in the CPS-I and CPS-II cohorts. CPS-II subjects were slightly taller with slightly larger body-mass indices. CPS-I subjects may have served in World War I, survived the 1918 flu epidemic, and may have started smoking earlier in life. CPS-II subjects may have served in World War II when cigarettes were essentially part of military rations.
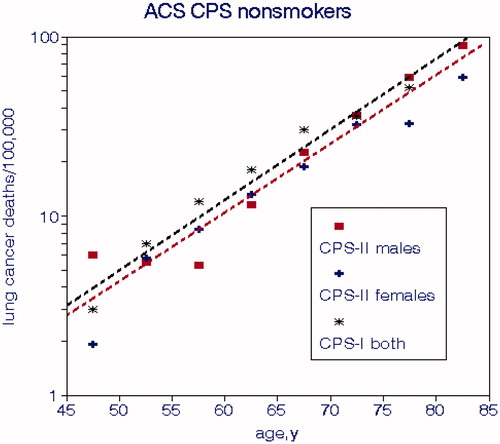
shows LCM rates for nonsmokers in CPS-I and CPS-II and displays the typical log-linear relationships with age. The slopes are about 0.088 while typical values for all-cause mortality rates tend to be around 0.075, indicating that lung cancer is more sensitive to aging. Accounting for age in a logarithmic regression model is tantamount to “age adjustment”. Rates for nonsmokers in CPS-I are slightly higher than for CPS-II. Risks for nonsmokers comprise baselines for relative risk calculations and also indicate effects on lung cancer other than smoking. The age relationship represents the rate of physiological decline of all systems and organs that weakens abilities to defend against disease and harmful agents. We thus conclude that this deterioration process is similar regardless of imminent cancer. LCM and CCS values from CPS-0 were much lower than those for CPS-I and CPS-II; the relationship with CCS was given by
(1)
(1)
Figure 1. Lung cancer mortality rates in the ACS CPS cohorts for nonsmokers by age. Regression lines are limited to CPS-II for clarity (Burns et al. Citation1996; Thun and Heath Citation1997).
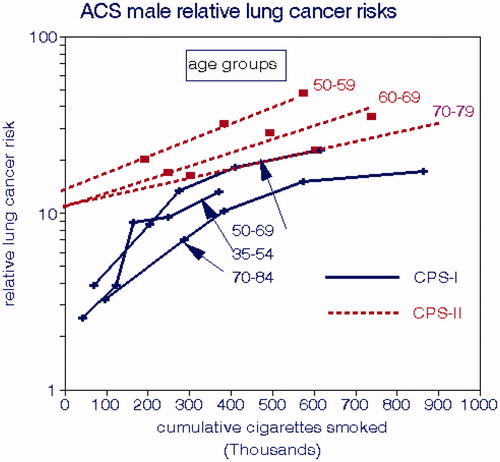
LCM rates for CPS-I for the entire cohort were presented by Burns et al. (Citation1996) in terms of age group and smoking intensity and by Thun et al. (Citation1996) in terms of age group, smoking intensity, and duration of smoking. We computed CCS values for each combination of age and intensity having more than 5 deaths and assumed that the CPS-I subjects began smoking at age 20. displays the relationships with CCS by gender and age group, both of which exhibit significant differences. The solid line shown represents the overall ERF (EquationEquation (2)(2)
(2) ) and corresponds to a relative risk of 1.75 per 100,000 cigarettes smoked, equivalent to smoking 2 packs per day for 8.5 years. From this regression, we estimated a nonsmoking cancer rate of 13 deaths per 100,000.
(2)
(2)
Figure 2. Lung cancer mortality rates in the CPS-I cohort (Burns et al. Citation1996).
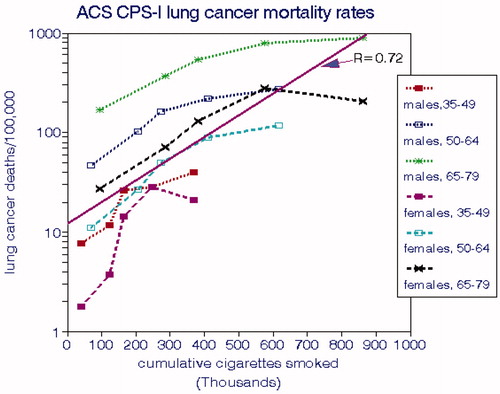
shows that LCMs for males consistently exceed those for females for each age group and that rates for both genders increase substantially with age. The implied risks for nonsmokers also increase substantially with age as do the direct estimates (). LCMs tend to level off at the highest levels of CCS.
Enstrom and Kabat (Citation2003) extended the CPS-I cohort to 2002 for California subjects, comprising the longest follow-up (43 y) among US cohorts, with 118,094 subjects including 35,561 never-smokers. A follow-up questionnaire was completed by 7159 subjects in 1998. Degree of urbanization (but not air pollution per se) was one of the confounding variables considered. They reported mean nonsmoking LCMs of about 20 deaths per 100,000 that were not associated with spousal smoking rates. The relationship of smokers’ LCM rate was sensitive to the highest smoking category (40–80 cigarettes/d), which is substantially higher than in the other CPS cohorts. For the sake of uniformity, we omitted that outlier data point, resulting in a highly significant ERF relationship:
(3)
(3)
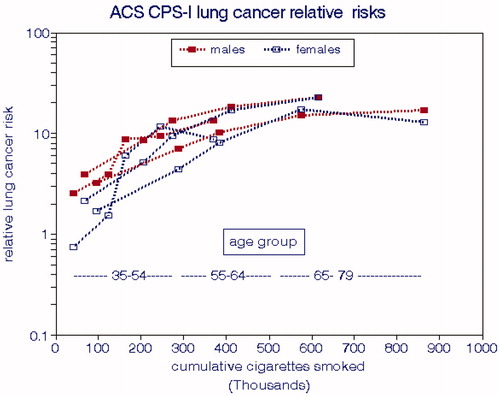
shows lung cancer relationships in terms of risks relative to nonsmokers. There is no consistent gender effect and the age gradients are greatly reduced on this basis, suggesting that smokers and nonsmokers share common relationships with age. The horizontal dashed line shows the ranges of each age group.
Figure 3. Lung cancer risks relative to nonsmokers in the ACS CPS-I cohort (Burns et al. Citation1996).
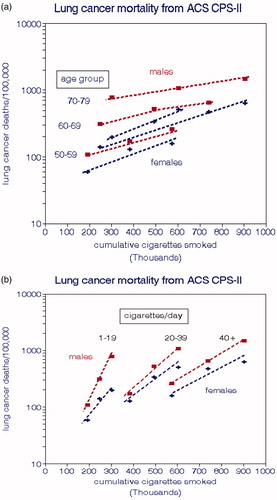
For clarity, we present the smoking relationships for ACS CPS-II in two formats. shows relationships with age at death, which are linear with CCS and similar for both genders. shows relationships with smoking intensity that are also linear but more sensitive at lower rates of smoking. The implied risk for nonsmokers was about 100 deaths per 100,000 population. The CPS-II risk relationship for both genders is
(4)
(4)
Figure 4. Lung cancer mortality rates for smokers in the ACS-CPS-II cohort. (a) by age at death. (b) by daily cigarettes smoked (Thun and Heath Citation1997).
compares relative risks for males between the two cohorts. The age gradients are reversed relative to and the CPS-II cohort has consistently larger LCM rates on either absolute or relative bases despite the cleaner environment in the later period. As indicated by EquationEquations (4)(4)
(4) and Equation(2)
(2)
(2) , LCM has a weaker relationship with CCS for CPS-II and a higher implied nonsmoking LCM rate.
Figure 5. Comparison of male lung cancer risks relative to nonsmokers in the ACS CPS-I and CPS-II cohorts (Thun and Heath Citation1997).
The LCM differences between CPS-I and CPS-II are stark and have been noted elsewhere but not rationalized (Thun and Heath Citation1997). The CPS-II results are limited to ages >50, which could have flattened the overall regression slope. Nevertheless, the maximum LCM rates, at CCS = 900,000, are about 900 and 1200 deaths per 100,000, which is a substantial difference.
3.1.2. The Kaiser-Permante study
About 60,000 Northern California medical care insurance subscribers were recruited and completed questionnaires on medical history and smoking habits, beginning in 1979 (Friedman et al. Citation1997). The mean follow-up period was 6.1 y. This cohort comprised 32,624 persons of which 61 women and 65 men died from lung cancer, for an overall mortality rate of 64 per 100,000. We estimated these mortality rates by dividing the numbers of deaths by the person-years at risk.
The cohort was stratified by gender, age, and SR smoking habits (intensity and duration). There were 3 categories of daily smoking rate: 0, ≤19, and 20+, for which we used 0, 15, and 25 cigarettes/d in our regression analyses. The age groups were 35–49, 50–64, 65–74, and 75+; data were also presented for all ages combined. We found a significant relationship with age but not gender, with regression intercepts near zero. The reported mean nonsmoking LCM rates were 11 and 14 deaths per 100,000. The univariate relationship with CCS for both genders pooled (EquationEquation (5)(5)
(5) ) was stronger than in the CPS cohorts.
(5)
(5)
3.1.3. Southern Ohio case–control study
Mills and Porter (Citation1957) conducted door-to-door surveys of white subjects who had resided for at least 10 y in Cincinnati and environs of whom 420 died of respiratory cancer from 1947 to 55, compared with 1341 living controls. This cohort was stratified by age group, residential area (central city-suburban, rural), vehicular traffic level (greater or less than 12,000 mi/y), smoking habit (none, pipe or cigar, daily cigarettes <15, 15–35, 35+). Mills and Porter designated “motor exhaust” as an important air pollutant (Mills Citation1960). Residential areas were roughly evenly divided but relatively few individuals lived in the high traffic areas. We used OLS regression with the logarithm of the ratios of cancer victims to living members as the dependent variable for various subsets, focusing on the 40+ age group. Vehicular traffic was never a significant predictor, by contrast with smoking and residential area (urban/suburban risk = 1.28; suburban/rural risk = 3.5). The smoking regression coefficient was consistently about 0.066 (0.054–0.078) per daily cigarette yielding RR = 14 for a 2-pack/d smoker, consistent with more recent estimates. The corresponding CCS risk factor was 4.6 per million cigarettes.
The large urban–rural difference is difficult to rationalize but given the preponderance of coal for residential heating at that time, the resulting area-wide air pollution may be a plausible causal agent. Latency was not an issue here since these conditions were likely steady during this period; we assumed that the subject’s age would indicate the duration of smoking.
3.1.4. A study of U.S. military veterans
Dorn (Citation1959) developed a cohort of male veterans of about 200,000 by means of questionnaires in 1954 (recruitment) and 1957 (follow-up). He considered a number of causes of death and smoking habits. The respondents varied in age from 30 to 80+, with 84% between 50 and 70 y; we assumed a mean age of 60 with smoking beginning at age 20. We found a lung-cancer mortality rate of 11 deaths/100,000 for nonsmokers and the following relationship for cigarette smokers:
(6)
(6)
The relative risk for smoking 21 or more cigarettes per day was 15.8.
3.1.5. An early British cohort study
Stocks and Campbell (Citation1955) assembled a cohort of 3528 male lung cancer patients aged 45–74 in the Liverpool region who died from 1952 to 1954. They were grouped according to rural vs. urban residence, smoking habits, and other data deemed applicable for the preceding 20 y. They also reported ambient air quality data from several locations for about 6 mo, including BS and several polycyclic hydrocarbons.
We fit linear regressions to these group means and found that CCS was a better predictor of rural LCM (R2 = 0.74) than urban LCM (R2 = 0.40). The difference between urban and rural mortality rates diminished with the amount of smoking; the mean difference was 138 deaths per 100,000 or about 40% of the mean urban mortality rate, consistent with Stocks’ (Stocks Citation1960) cross-sectional study that did not control for smoking. This urban increment corresponded to 4.4 deaths/100,000 per 10 µg/m3 BS (∼1.3%) or alternatively, 2 deaths per ng/m3 B(a)P (∼0.7%). The nonsmoking rural mortality rate was about 20 deaths per 100,000. The rural regression relationship was as follows:
(7)
(7)
3.1.6. The British Doctors Study
The British Doctors Study began in 1951 by mailing questionnaires about smoking to 59,600 male and female physicians, of which 40,701 were usable and classified according to their smoking habits (Doll and Hill Citation1956). Nonsmokers comprised 10,145 of the men. This first report deduced effects of smoking by comparing actual and “expected” deaths based on demography. They concluded that the reported measures of cigarette consumption did not fit the data well but did not consider other potential causes of lung cancer such as air pollution; occupational exposures would not have been an issue with this cohort. This analysis was compromised because of the few lung cancer deaths (84) during this initial period.
The 10-y report (Doll and Hill Citation1964) devoted more attention to other causes of death and noted that the overall death rates of the physicians were lower than for the general public but did not attribute this finding to their higher socioeconomic status. This article also presented details of smoking habits such as frequency of inhaling. The 20-y report (Doll and Peto Citation1976) did not present lung cancer deaths by age and smoking rate but the all-age rates were similar to previous data. The 40-y report (Doll et al. Citation1994) covered all causes of death with less emphasis on lung cancer. There was a separate 50-y report on cancer at various sites (Doll et al. Citation2005) showing differences in survival for various birth cohorts. Survival rates for nonsmokers increased for successive birth cohorts from 1900 to 1929, but nor for smokers. Temporal changes in lung cancer deaths were similar to those for all deaths, suggesting common risk factors. The fraction of lung cancer deaths decreased slightly after 1991, perhaps due to selective depletion of the cohort.
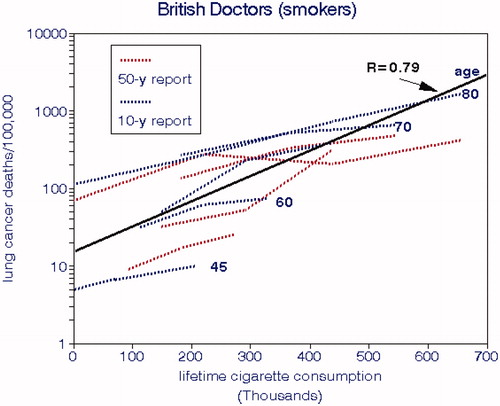
Nonsmoking lung cancer deaths among the British doctors varied with age and were trivial except for the most recent period, with an overall mean of 12 deaths/100,000 men. displays relationships with CCS by age group. It appears that age also plays a role up until age 70, after which cohort depletion may have been a factor. If cumulative exposures to air pollution had been important, we would expect LCM rates to have increased for the elderly. shows an estimated overall LCM slope of 7.1, which comports well with the other cohorts.
3.1.7. Scottish cohort studies
Gillis et al. (Citation1988) studied lung cancer from 1975 to 85 in a male cohort aged 45–64 from the general populations of two boroughs in western Scotland and reported a nonsmoking mortality rate of 51 per 100,000. They reported relative risks of smoking around 10 that peaked at about 25 cigarettes per day with a mortality rate of about 450 deaths per 100,000. The authors pointed out that these rates are about double those from other cohorts but offered no convincing explanations. Hart et al. (Citation2001) compared these LCM rates by social class; they were larger for manual laborers and for those who smoked more and lived in more deprived areas. They concluded that these differences could be explained by lifelong socioeconomic factors and poor lung health. Although lung cancer rates were described as “very high incidence”, the relative risks were very similar to those for ACS CPS-II. Beverland et al. (Citation2012) reported only moderate BS concentrations for this area during follow-up (∼40 µg/m3) but previous levels were likely to have been much higher.
3.2. Population studies of smoking effects
3.2.1. A british national study
Doll (Citation1978) reported British LCM rates from 1952 to 72 by age group and temporal period as shown in for males and females, respectively. These data represent columns from his Table 15; we extrapolated these plots down to age 30 in order to estimate more complete smoking histories. Male rates were independent of death year up to about age 55 after which they diverged considerably with the highest elderly rates in the most recent period. Female rates diverged over time for all ages and also with rates increasing over time. Since these increases occurred at a time when medical care and ambient air quality were improving, they likely reflect the effects of cumulative consumption and differences in smoking behavior.
presents relationships between changes in LCM rates and CCS averaged for males and females for the UK population cohorts and based on the total population for the U.S. (Haenszel and Shimkin Citation1956). These consumption rates pertain to the entire population, not just the smokers. The estimated smoking rates for women in the UK were about half of those for men, which accounts for the lower population smoking rates shown in the figure that differ between the U.K. and U.S. Cigarette consumption rates are low because they represent changes since 1955, but the slopes should be valid nevertheless. The range among birth cohorts is about a factor of 2, the oldest cohort having had higher mortality rates at a given smoking level, but there is no systematic variation by death year. It thus appears that effects of aging per se are mainly subsumed by the cumulative effects of smoking, which supports our neglect of socioeconomic variables in these analyses.
The increased lung cancer rates for the elderly are almost entirely due to accumulated tobacco effects and not from aging per se, although age serves as a surrogate for cigarette consumption in this model. The U.S. data are based on deaths for ages 18–65+ in 1956. The relative risks for a 20% increase in cigarette consumption are about 3.5 for the U.S. and 2.5 for the U.K. It is not clear why smoking effects differ by gender as seen in ; details of smoking behavior may be involved or mutational processes.
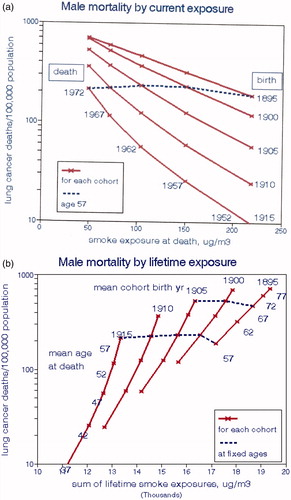
In , we illustrate male lung cancer risks for each cohort by national levels of BS (QUARG Citation1996), for the exposure period coincident with death (a) and for the cumulative exposure since age 20 (b). Here cumulative smoking is controlled through proportionality with age, and time proceeds from right to left as ambient air quality improved. Air pollution concentration is a (negative) function of time for all ages but cumulative pollution exposures increased with age. The effect of smoking on LCM is a function of CCS (only) and is a linear function of age for all times as seen in . In , the oldest subjects who had the highest cigarette consumption but the best air quality during the year of death had the highest LCM, thus giving the impression of a strong but implausible beneficial effect of air pollution. The dashed line, for which CCS and age are constant, connects LCMs at age 57 (1972–1915, 1952–1895) for each cohort and indicates essentially no effect of air pollution in this model when smoking is effectively controlled by maintaining age constant.
illustrates relationships with cumulative BS exposures, implying strong adverse effects of air pollution exposure due to increases in both cigarette consumption and exposure with age. However, the dashed lines for ages 57 and 67 in show essentially no effect of air pollution when CCS (age) is controlled. With this lifetime exposure model, cancer reductions expected after implementing air pollution controls would not be realized for decades as is the case with smoking cessation (Speizer et al. Citation1999). The data of Peto et al. (Citation2000) show that male lung cancer risk is reduced by 6.4% each year after quitting smoking; the relative risk would thus be 1.04 after 50 y. Smoking exposure drops to zero after cessation, but such reductions would be much smaller under typical air pollution abatement policies. We present more detailed examples of this phenomenon below.
3.2.2. Longitudinal studies of the US population, 1930–2016
We collected data showing long-term national trends in LCM, total cigarette sales prepared by the Tobacco Tax Council (Citation2014), and estimated average PM2.5 concentrations and compared trends from 1930 (). Cigarette sales and lung cancer rates show important trend reversals as also noted by Hecht and Szabo (Citation2014). National cigarette sales peaked about 1970–80, while lung cancer rates lagged 10–20 y and peaked about 1990, which Alberg et al. (Citation2013) referred to as the “lung cancer epidemic”. Boer et al. (Citation2012) present plots of percentages of smokers for birth cohorts from 1915 to 2000 that also showed peak rates at that time. Burns et al. (Citation1996) showed plots indicating peak tobacco consumption from 1945 to 1965 during which the percentage of current smokers reached almost 50%. By contrast, PM levels dropped continuously, initially due to the shift away coal for home heating and then due to emissions abatement after passage of the 1970 Clean Air Act. The PM2.5 temporal trend is monotonic and is roughly parallel to the decline in cigarette sales after 1980; those trends would likely also apply to other regulated air pollutants. Had our analysis been limited to data after ∼1990, it would have been difficult to distinguish the trend in smoking from the parallel trends of air pollution.
compares these trends as reported and with LCM lagged by 18 y, which provides the best correlation between smoking and LCM. We computed bivariate correlations among these trend lines, shown in . Without lag (concurrent data), LCM is negatively correlated with cigarette sales and increasingly positively correlated with estimated PM2.5; cigarette sales are significantly positively correlated with estimated PM2.5. As LCM is increasingly lagged, its correlation with cigarette sales becomes strongly positive.
Table 3. Correlation coefficients for national LCM rates, cigarette sales, estimated PM2.5.
We conclude from this simple analysis that the interplay between these variables is strongly dependent on lag, i.e. disease latency, as well as the time period considered.
3.3. Lung cancer risks in non- or never-smokers
Exposure to airborne carcinogens may result from active smoking, ETS, occupational exposures, or ambient air quality exposure. Active smoking poses the greatest risk by far, but lung cancer rates in non- or never-smokers afford the best opportunity to identify separate effects of ambient air quality or other exposures that will become relatively more important as smoking rates continue to decrease.
Thun et al. (Citation2008) analyzed lung cancer rates in 13 cohorts from 10 countries over 52 y, comprising 630,000 never-smokers. They concluded “no temporal trends were seen when comparing incidence and death rates during the 1930s among US women age 40–69 y with contemporary populations where few women smoke, or in temporal comparisons of never-smokers in two large American Cancer Society cohorts from 1959 to 2004”. We show some of these data in : neither geographic nor temporal trends are apparent. Villeneuve and Mao (Citation1994) estimated that LCM for Canadian never-smokers averaged about 9.4% of that for current smokers, yielding an LCM rate of 4.5 deaths/100,000 population. However, the CPS-II data of Turner, Krewski, Chen, et al. (Citation2011) indicate a never-smoking LCM of about 11 deaths/100,000 over 26-y of follow-up. shows nonsmoking LCMs for the ACS cohorts and shows no trend over 25 y. Doll (Citation1978) reported an age-adjusted LCM of 7.4 per 100,000 for both genders.
Table 4(a). Age-adjusted LCM rates for never-smoking females (Thun et al. Citation2008).
Kotin et al. (Citation1958) tabulated LCMs from various countries under “minimal” smoking conditions from 1930 to 1938 (. It is not clear why these earlier rates are significantly lower than those in except for possible missed diagnoses or more contributions from ETS in the later data. Nevertheless, and indicate that LCMs for nonsmokers are insensitive to local environmental conditions.
Table 4(b). Lung cancer mortality rates with minimal smoking (Kotin et al. Citation1958).
Since US ambient air quality has improved dramatically after about 1950 and differed markedly among the locations shown in , there is no indication that exposure to air pollution played a role in nonsmoking female lung cancer (and by extension to all lung cancers). Garfinkel (Citation1981) observed no trend in LCM for nonsmokers from 1954 to 1972 and only small increases for nonsmoking spouses of smokers. The cross-sectional study of Turner, Krewski, Chen, et al. (Citation2011) included radon and found increased PM2.5 risk estimates with more recent (concurrent) exposures, although they were largely non-significant. Furthermore, they showed no increased LCM risks with age (and thus longer exposures) and reported increased PM2.5 risks at higher levels of radon, implying interactions between these two agents.
3.4. Lung cancer rates by age and gender
Many of our regression analyses found risk increasing significantly with age independently of smoking, including nonsmokers, and substantially lower risks for females after accounting for smoking, suggesting physiological interactions. Increasing risk with age could be attributed to age-related weakening of physiological defenses to external risks or to behavioral changes. Depletion of a cohort of its most susceptible subjects could also decrease the apparent effects of age.
Risch et al. (Citation1993) reported that heavy-smoking females had significantly greater lung cancer risks than males after controlling for histological subtype of tumor. Barrera-Rodriguez and Morales-Fuentes (Citation2012) reported that male and female lung cancers were fundamentally different, but that women do not appear to be more susceptible to developing lung cancer. By comparison, estimated risks of air pollution on all-cause mortality by gender were mixed. Female spouses of smokers could be more exposed to ETS.
shows substantial LCM differences for nonsmokers by gender in the ACS cohorts. We would expect males to have experienced more occupational exposures but nonsmoking females more likely to have experienced more ETS exposure, from smoking spouses.
3.5. Summary of smoking studies
The three types of smoking studies we reviewed each provide strong evidence on the effects of cigarette smoking on lung cancer but each type has limitations. The cohort studies followed specific individuals over time and show that LCMs increased exponentially with the lifetime numbers of cigarettes smoked (CCS). This was seen in variety of settings over the period 1955–88 during which major changes in smoking behavior occurred. However, the strengths of these relationships vary considerably among studies and the CCS data were based on personal recall and are thus subject to error. We found a lung cancer latency period of about 20 y based on the U.S. longitudinal data. It is also likely that smoking rates may have changed (usually decreased) during follow-up, resulting in overstating the actual cumulative consumption. This would have biased the dose-response function downward and may have been responsible for leveling off for some of the downward-concave shapes found () and understatement of the linearized response coefficients. We averaged the coefficients in EquationEquations (1)–(7) and derived the following overall relationship:
(8)
(8)
The y-intercept corresponds to a nonsmoking LCM of 17 deaths per 100,000 population, somewhat higher than the previous estimates. According to this relationship, switching from 1 to 2 packs/d for 30 y would triple the LCM rate.
Population-based studies also show relationships with CCS based on cigarette sales data that may be more reliable than self-reports, but pertain to the entire population, not just the smokers. We showed that LCM in population-based birth cohorts for which age was a surrogate for smoking was also proportional to CCS defined on the basis of national smoking rates. The longitudinal population-based analysis provided strong and direct evidence of cancer latency.
Mannino et al. (Citation2001) showed that the largest numbers of U.S. lung cancer deaths occurred in the 1910–1925 birth cohorts. i.e. those who died in the late 1980s, consistent with and well after most of the cohort studies we reviewed. Our longitudinal study covering the entire period based on age-adjusted mortality found a latency period of about 10–30 y; initiation of lung cancer around ages 35–40 is thus consistent with this latency estimate.
Studies of nonsmokers showed similar and lower LCM rates for which we obtained alternative estimates by extrapolating the CCS plots () down to zero smoking or from the y-intercepts of the ERFs (17 per 100,000). The differences in these estimates with respect to direct measurements from nonsmokers (8–13 per 100,000) suggest other factors unrelated to CCS that we explored next.
Figure 6. Lung cancer mortality rates from the Kaiser Permanente cohort study (Friedman et al. Citation1997). The dashed line represents the overall slope of lung cancer mortality with cumulative cigarettes smoked.
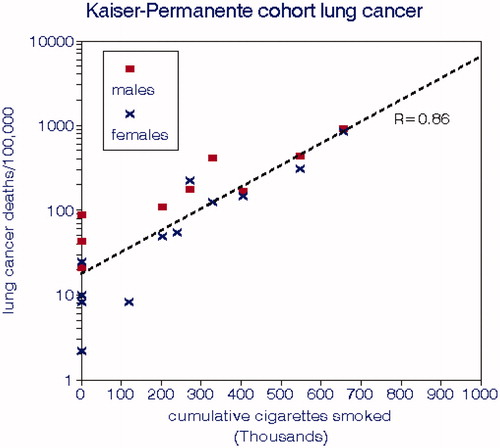
Figure 7. 1952–54 urban and rural male lung cancer mortality rates from an English cohort by urban/rural residence and cumulative cigarettes smoked.
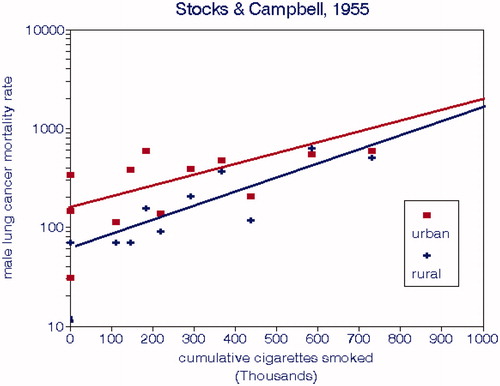
Figure 8. Lung cancer mortality rates for male British doctors by age group and lifetime cigarette smoking (Doll and Hill Citation1964; Doll et al. Citation2005).
3.6. Studies of LCM associations with ambient air pollution
We searched the NIH PubMed database for epidemiology papers linking ambient air pollution with LCM, either as the sole endpoint or as one of several causes of death. We categorized them according to the ways in which smoking effects were controlled; studies lacking individual data on smoking were denoted “ecological”. Where regression models of increasing complexity were used, we used results from the most complex model for our risk estimates. We computed average risks as the exponential of the mean logarithm of the set of relative risks.
These studies were published from 1958 to 2018 and are listed in Appendix B. They include 9 different pollutants plus constituents of PM2.5 and were conducted in North America, Europe, Asia, and New Zealand. Follow-up periods were as long as 25 y; sample sizes ranged from 41 to 350,000. We consider pollutants identified as “smoke” or “BS” to be primarily elemental carbon (soot) and labeled them “EC”. All of the studies were cross-sectional, i.e. based on spatial relationships at some time during follow-up; we found no longitudinal studies. Only Chinn et al. (Citation1981) considered age-specific mortality risks, none of which were statistically significant. Only a few studies reported their estimated smoking risks or considered latency or exposure duration.
The British lung cancer studies of the 1950s and 60 s are of special interest because they focused on air pollution as a primary cause and only considered smoking as an independent cause after some debate (Stocks Citation1952, Citation1959, Citation1960, Citation1966; Stocks and Campbell Citation1955). The British developed analytical methods for B(a)P and related hydrocarbons and did extensive ambient monitoring. BS was the principal PM metric of interest and was strongly correlated with B(a)P, for which carcinogenesis was established through laboratory or animal experiments and was found in cigarette smoke and solid (but not liquid) fuel combustion products. Indications of the role of air pollution in lung cancer came from urban and rural differences and from higher lung cancer rates in countries with greater usage of coal for domestic heating.
3.6.1. Cohort studies
We found 18 cohort studies of LCM (alone) and 13 more studies including various causes of death. We make this distinction because the requirements for exposure history are most important for cancer and other causes of death may require different regression models. The 1998 cohort study of Beeson et al. (Citation1998) had too few cancer deaths (36) for meaningful analysis. All of these studies were based on coincident rather than cumulative exposures which constitutes a major source of bias and exposure error.
After allowing for sample size, the strongest relationships between LCM and air pollution were seen in European cohorts. The overall average LCM relative risk was 1.13 (1.08–1.19). There were weak negative relationships between estimated relative risks and sample size or initial year of the study. Raaschou-Nielsen et al.’s Citation2016 study of PM2.5 constituents reported no significant association of LCM with concurrent exposures to any of them, including Ni.
3.6.2. Ecological studies
We found 11 ecological and population-based studies ranging from 53 English boroughs over 4 years to the California state cancer registry study of 16,700 annual deaths over 21 years. Considering its small sample, the strongest relationships were among Oslo neighborhoods (Naess et al. Citation2007). The overall average LCM risk for this group was 1.125 (1.071–1.173), virtually identical with the cohort studies, despite its lack of smoking controls.
3.6.3. Studies involving latency or exposure duration
We found three relevant air pollution studies that considered lagged LCM. Gallus et al. (Citation2008) reviewed the European literature and found no clear pollution-cancer associations and noted uncertainties in exposure and latency. Trichopoulos et al. (Citation1992) found no support for air pollution effects on lung cancer in the highly polluted city of Athens. The comprehensive reanalysis of the ACS CPS-II cohort by Krewski et al. (Citation2009) included separate exposure time windows (1–5 y, 6–10 y, 11–15 y) in the context of latency, among which there were only small differences in associations with LCM. However, they did not consider a 0–20-y time window nor did they consider cumulative exposures, perhaps because of their inadequate PM2.5 database. Their protocol requires individual PM2.5 data back to 1967; however, since the earliest measurements were in 1979–81 with a gap until 1999, their exposure data were clearly inadequate. They used the same methodology for all other causes of death and did not recognize differences in the importance of exposure duration and latency among them. Gamble et al. (Citation2012) reviewed the occupational epidemiology literature and concluded that the “weight of evidence was inadequate to confirm the diesel-lung cancer hypothesis.” Xu et al. (Citation1996) reported significant ERFs for cumulative exposures to “dust” and B(a)P in northeastern China.
Elliott et al. (Citation2007) published a quasi-spatio-temporal analysis of LCM in British election wards with respect to long-term BS and SO2 from 1982 to 1998, a period of greatly improving air quality. The population was subdivided into four mortality periods and accompanying exposure periods with various time windows for selected causes of death. Here we were interested in how estimated LCM risks changed with successively wider time windows. Data were not available on smoking, for which a highly correlated deprivation index was used; the authors noted that such confounder relationships changed over time. They found that the 16-y LCM relationship with air pollution was only significant for time-windows >4 y and became stronger with wider time windows. The strongest relationship with BS was for LCM over years 0–16 with BS over years 9–12. No mention was made of cumulative exposures. This study was the only one of this scope that we found; it demonstrated a latency effect but did not address cumulative exposures.
3.6.4. Review papers
We found 12 relevant air pollution review papers of various types published from 1952 to 2018. Dean (Citation1966) compared age-adjusted LCM rates for smokers and nonsmokers among various cities, suburban and rural areas for this early period. Rates for nonsmokers ranged from 0 to 10 deaths per 100,000 in rural areas and from 15 to 44 in urbanized areas. The relative risks of smoking among these diverse locations ranged from about 2.5 to 10.
Doll’s Citation1978 review was perhaps the most useful since it provided data on the England-Wales cohort from which we presented detailed results above. Doll and Hill (Citation1999) noted concerns about both indoor and outdoor air pollution and argued that it is unlikely that tobacco smoke could be the sole cause of increasing lung cancer in Britain. By contrast, Higgins (Citation1984) focused on occupational exposures to diesel and coal smoke, commenting that it is unlikely that “general air pollution” could be important. Cohen (Citation2000) cited B(a)P as possibly important and concluded that longitudinal studies could be useful. Whitrow et al. (Citation2003) reported on 10 case-control and 4 cohort studies, commented on their failure to consider latency, and concluded that the Bradford Hill (Citation1965) causality criteria were not met. Enomoto et al. (Citation2008) noted that the duration of exposure is important and listed a number of carcinogens of interest emphasizing B(a)P and other automobile exhaust carcinogens. Demetriou and Vineis (Citation2015) noted that the epidemiology supports longer rather than short-term exposures, suggesting “persistent cumulative effects.” Most recently, Li et al. (Citation2018) discussed a number of epigenetic and “microenvironmental alterations” in connection with studying the “function” of PM2.5, noting that the “chemical properties” and “pathological toxicity” are of interest but identified no plausible relationships with specific PM constituents. It thus seems that concerns about lung cancer and the environment have become more focused over the past 6 decades but that comprehensive analyses of longitudinal and current relationships are still lacking.
3.6.5. Summary and assessment of conventional air pollution studies
We found mean relative risks of 1.13 for both cohort and ecological studies of conventional outdoor air pollutants based on concurrent exposures, but we found no such studies based on established carcinogens. We also computed mean risks and standard errors by pollutant (); there are no statistically significant differences among pollutants, but the strongest risks are seen for traffic-related pollutants such as NO2, EC, or BS. By comparison, we found an average relative air pollution risk for nonsmokers of 1.18. These 59 estimates thus imply that LCM rates were about 14% higher in more polluted locations during the periods of study, regardless of the type of pollution or source. compares relative risks for other agents, which are substantially larger. Using the rates of increase shown in , we estimated the likely changes in risk had they been based on concentrations 20 y earlier. The mean RR was about 1.05 or one lung cancer death per 100,000 based on the nonsmoking LCM rate of 20/100,000.
Table 5. Summary of relative risk estimates [(number of studies [n]), mean relative risk, (95% CIs)].
Recent air pollution epidemiology has focused on ambient fine particles (PM2.5), a small fraction of which might comprise carcinogenic species. In , we compared incremental LCM rates based on risk factors from the World Health Organization for selected carcinogenic species with the relative PM2.5 risk based on a published air pollution study, based on concurrent exposures in both cases. We estimated ambient concentrations for 1960 and 2015 in order to compare absolute values of LCM risks and their changes over the 55-y period. On average, concentrations of airborne carcinogens are now only about 1% of 1960 levels but 30% for PM2.5. Thus, the combined LCM rate for airborne carcinogens in 1960 would have been about 2.6 deaths per 100,000 population, consistent with Doll’s (Citation1978) estimate of <5 per 100,000; Speizer (Citation1983) concurred with this assessment. Using a baseline LCM rate of 50 deaths per 100,000 population, the additional PM2.5 risk would have been 5 times the carcinogenic risk in 1960 and 120 times in 2015. We conclude from this exercise that while air pollution probably contributed to LCM in historic periods, this is no longer the case because of the succeeding substantial reductions in potentially carcinogenic emissions that have since been achieved.
Table 6. Lung cancer mortality rate relationships with ambient PM2.5 and established carcinogens.
Hemminki and Pershagen (Citation1994) estimated a combined LCM risk of 0.025/100,000 for seven established carcinogens, but Higgins (Citation1976) suggested that air pollution risks might be as high as 10% of smoking risks (∼5/100,000) at a time of much higher ambient levels. Both of these estimates are consistent with our estimates in .
There are two inter-related questions about relationships between lung cancer and air pollution: Do such relationships still exist? Can current epidemiology detect them? There is evidence, however crude, that air pollution was responsible for increased LCM before serious air abatement programs took hold, say in the mid-1960s. However, air quality monitoring was sparse at that time and was largely inferred from the urban vs. rural gradients that were experienced at various locations in the U.S. and U.K. Given a 20-y latency period, the increasing smoking trend and decreasing air pollution trends at that time, air pollution effects cannot be dismissed in connection with established carcinogens such as B(a)P. Since air pollution effects are included in LCMs for nonsmokers, such effects were likely to have been <10 deaths per 100,000 population.
With respect to the second question and assuming a linear ERF and our substantially improved ambient air quality, it would not be feasible to detect the corresponding air pollution effects of ∼1 death per 100,000 population, especially since exposure data would be required ∼20-y previous in the absence of airborne carcinogen monitoring data.
3.7. Relationships with established carcinogens
Many airborne carcinogenic compounds and species have been identified over the years. Established carcinogens mentioned by Doll (Citation1978) include radon, polycyclic hydrocarbons, chrome ore, nickel ore, asbestos, arsenic, mustard gas, bischloromethyl ether, vinyl chloride, radiation from uranium ore, and benzo(a)pyrene [B(a)P]. More recently, De Matteis et al. (Citation2008) discussed asbestos, silica, Ni, and Cr. Villeneuve et al. (Citation2012) studied effects of asbestos, diesel fumes (Villeneuve et al. Citation2011), and radon-fluorospar (2004). Here we review some of the more prevalent species.
3.7.1. Environmental tobacco smoke
Nonsmokers have often been exposed to high levels of ETS, especially in prior decades before the advent of indoor smoking bans. The 1986 Surgeon General’s Report (US Department of Health and Human Services Citation1986) reviewed the available evidence and concluded that more data on exposure were needed before a definite conclusion could be reached on causes of lung cancer. Their data on the smoking habits of spouses suggested an ETS threshold from smoking about 1 pack/d and concluded that the duration of exposure was important.
Darby and Pike (Citation1988) developed a mathematical model based on the data from the British Doctors’ duration of exposure as with active smoking and found differences between the observed lung cancer risks (RR = 1.5) and predictions from their model (RR = 1.5–4), depending on the active smoking rate. Others have noted differences in the chemistry of sidestream and mainstream smoke.
Hackshaw et al. (Citation1997) compiled 37 published ETS studies and estimated an RR of 1.24 (1.13–1.36) for the group, and Taylor et al. (Citation2007) derived an estimate of 1.27 (1.17–1.37) that was consistent for North America, Europe, and Asia. Note that population-based mortality rates for nonsmokers include effects of ETS for that portion of the population and that relative risks depend on the baseline mortality rates, which were not provided by Hackshaw et al. (Citation1997).
We examined interrelationships within the group with respect to sample size (numbers of cases, 10–1253) and publication date (1982–1997). The latter is important with respect to potential contributions of ambient air quality, which improved substantially during this period. Using OLS regression, we found a weak correlation with sample size () and that relative lung cancer risks of ETS exposure were independent of timing. Since suggests a funnel plot, we consider the median RR (1.34) to best represent this data set.
Vineis et al. (Citation2007) studied nonsmokers in 10 European countries with respect to ETS, proximity to traffic, and ambient NO2. They reported RRs of 1.2 (1.12–1.24) for ETS and 1.06 (1.04–1.07) for NO2 or traffic. Their result for joint exposures had wide confidence limits and was judged unreliable, but their ETS estimate is consistent with . A more recent study (García-Esquinas et al. Citation2018) reported an RR of 1.14 for smoking-related cancers (n = 81).
3.7.2. Radon
Radon (Rn) is an established natural radioactive carcinogen emitted from rock, soil, and concrete and an indoor air quality concern, especially in buildings with low outdoor air exchange rates. Residential radon levels tend to be highest in the northern states including the industrial Midwest (US EPA 2003). A recent estimate put the radon contribution at 14% of total lung cancer deaths (Sethi et al. Citation2012). We are not aware of epidemiology studies contrasting radon effects with those of other indoor air pollutants, but Turner, Krewski, Chen, et al. (Citation2011) and Turner, Krewski, Pope et al. (Citation2011) analyzed county-level relationships in the ACS CPS-II between radon and LCM and interactions with airborne sulfate using data from Lipfert et al. (Citation1988). They reported a radon RR of 1.08 (1–1.15) at the mean Ra level, with some indication of a threshold. They found these estimates to be independent of county level sulfate concentrations but did not report relationships with the PM2.5 data that are also available from Lipfert et al. (Citation1988). The use of county-level rather than individual exposure data may have biased the risk estimates low. Victorin et al. (Citation1993) compared radon and air pollution risks in Sweden: 1100 annual cases for radon and 100 for all air pollutants (not specified).
Note that Ra levels tend to remain steady over time and thus radon studies intrinsically consider latency and exposure duration. Turner, Krewski, Chen, et al. (Citation2011) and Turner, Krewski, Pope et al. (Citation2011) addressed those issues by considering tenure of residence. Krewski et al. (Citation2005) considered latencies from 5 to 30 y and reported RRs of 1.11 and 1.12. Bräuner et al. (Citation2012) traced Danish residential addresses back to 1971 but did not find statistical significance among 589 lung cancer cases, albeit at much lower Ra levels.
3.7.3. Nickel
Hammond and Horn (Citation1958) presented LCMs for nickel in four residential categories: cities with populations >50,000; between 10,000 and 50,000, “towns”, and rural. We combined the last two categories to define three groupings corresponding to the NASN air quality data for nickel from 1953 to 57 (US HEW Citation1958): urban, suburban, and rural. We used OLS regressions to evaluate carcinogen relationships across these three categories and found an essentially perfect fit with the nickel content of TSP. While health effects of airborne nickel may have existed in the 1950s, they have since diminished to trivial levels as a result of the major improvements in ambient air quality that have been achieved.
3.7.4. Benzo(alpha)pyrene
Effects of hydrocarbon compounds were suspected at the beginning of concerns about environmental causes of lung cancer (Hueper Citation1951). Early studies in the U.K. focused on B(a)P in part because of previous experiences with tarry chimney deposits from coal combustion and experiments with mice. Ambient monitoring of B(a)P in the U.S. was discontinued in the 1970s; Lipfert (Citation1980) reported no significant relationships in early cross-sectional analyses. B(a)P has not been considered in recent epidemiology studies. The highest B(a)P levels ca. 1970 occurred in the Southeast, which also showed higher lung cancer rates ca. 1990.
In the 1950s, the prevailing opinions in the U.K. focused on air pollution as a “known” cause of air pollution and debated the importance of smoking (Stocks Citation1960). His paper presented cross-sectional male lung cancer standardized mortality ratios (SMR), population density, socioeconomic status (SES), BS, and several hydrocarbon species, but not smoking. B(a)P was highly correlated with BS: B(a)P = 0.145*BS, R2 = 0.81. Stocks’ analysis was limited to bivariate correlations, but we performed multiple regressions using the log of population density. We used the log of population density (LPD) and derived two alternative dose-response functions for the SMR without controlling for smoking and found significant associations with BS and B(a)P (). Nickel was not significant in this dataset.
More recently, Guerreiro et al. (Citation2016) estimated B(a)P concentrations and lung cancer risks in Europe. B(a)P levels were highest in eastern Europe at about >1.5 ng/m3 and around 0.3 ng/m3 in western Europe. They estimated 370 additional lung cancers per year, corresponding to an RR of about 1.001, roughly consistent with . Residential combustion sources contributed 85% of the total EU emissions.
3.7.5. Summary of effects of other established carcinogens
We conclude that at current conditions in the United States, ETS and radon may pose significant non-occupational risks of LCM; trace metals do not.
3.8. Occupational studies
Occupational exposures are also relevant for LCM, as discussed by Hammond and Wynder (Citation1960). Most of the studies we found were either based on a defined cohort or as cases vs. controls. Forastiere et al. (Citation1994) found no excess lung cancer in conjunction with duration of employment as traffic police. Breugelmans et al. (Citation2013) found no increased lung cancer associated with past PAH or Cd emissions from a large steel factory. Kachuri et al. (Citation2017) reported that both male and female Canadian agricultural workers had statistically significantly lower lung cancer risks, with RRs from 0.58 to 0.75. Clapp et al. (Citation2008) reported occupational LCM risks associated with pesticides, certain solvents, nickel, and hexavalent chromium. Neuberger and Field (Citation2003) reviewed occupational effects for nonsmokers and noted a preponderance of smokers in occupational studies. Chang et al. (Citation2018) showed the importance of considering radon in conjunction with miners’ exposure to underground diesel exhaust fumes. IARC (Citation2013) cited an occupational relative risk of 1.2 per 100 μg/m3-years cumulative exposure to B(a)P, which corresponds to 1.0015 at the mean level for 1956 after 70 y. Li et al. (Citation2012) reported on 7 years of follow-up of workers from the 2001 World Trade Center disaster and found no excess lung cancers. They remarked that this follow-up period may have been insufficient, given the expected latency period. Additional cancers associated with that disaster are now being reported (Brawley Citation2018; Singh et al. Citation2018)
Those lung cancer studies did not consider risks associated with previous exposures. However, Navaranjan et al. (Citation2016), Villeneuve et al. (Citation2014, Citation2012, Citation2011), and Kachuri et al. (Citation2014) found significant relationships with lifetime exposures to radon, VOCs, silica, asbestos, diesel emissions, and silica. By contrast, Wilcox et al. (Citation2007) did not find a significant lung cancer relationship with single-year residential radon exposures. Sorahan et al. (Citation2001) found no associations between lung cancer and occupational to carbon black for workers employed before 1975.
Exposure to diesel engine exhaust has been studied extensively with respect to lung cancer, beginning with the American Cancer Society CPS-II (Boffetta Citation2012), who reported an RR of 1.18 based on duration of employment. Control of confounding by smoking was based on the CPS-II smoking histories. Parent et al. (Citation2007) reported “limited” support for lung cancer and emissions from diesel but not gasoline engines. Olsson et al. (Citation2011) developed an exposure-response relationship with RR = 1.31, based on 11 case-control studies from Europe and Canada, using cumulative exposures. Gamble et al. (Citation2012) reported a latency of about 20 y and showed cumulative responses of about 1%/y. Moolgavkar et al. (Citation2015) considered diesel exhaust exposure in miners using elemental carbon (EC) as a surrogate measure. They found that duration of exposure was important and noted effect modifications by age. Crump et al. (Citation2015) found that relationships between lung cancer were sensitive to adjustment for radon exposure.
All told, evidence for occupational lung cancer appears mixed, perhaps because larger samples and extended exposure periods were required.
4. Discussion
4.1. Exposure-response functions
Protection of public health depends on quantitative relationships between doses (causes) and responses (effects). In epidemiology, effects are derived from public health statistics but the applicable doses must often be estimated from overall exposures and are subject to error. Here “applicable” means agents having known or plausible health effects and “dose” should be estimated in terms of concentration and exposure time. Defining the appropriate dose is usually a major issue; here, we refer to “exposure” rather than dose to the lung.
Doses in studies of smoking effects involve several different types of particulate matter (Pryor et al. Citation1983). Directly inhaled particulate matter from tobacco combustion, sometimes referred to as tar, differs from the sidestream smoke inhaled between puffs. ETS ages in the atmosphere, implying further changes in composition, as with smoke deposits on interior surfaces and clothing that has been referred to as “third-hand” smoke (Walley et al. Citation2015; Acuff et al. Citation2016).
By contrast, ambient air particulates are solely defined by the sampling methodology and not by chemical composition. They are complex mixtures emitted from outdoor and indoor sources and differ fundamentally from tobacco combustion products in terms of particle size and composition. Ambient particles may include miniscule amounts of carcinogenic species that could impose only minimal risks at the low concentrations currently experienced (). Smokers are exposed to all of these types of particles; nonsmokers may be exposed to ETS and indoor and outdoor ambient particles. These types of particles may differ in terms of underlying carcinogenicity but such specific information is seldom available.
Exposure times also differ. Active smoke is delivered directly to the lung for relatively brief intermittent periods; dose depends on smoking intensity (cigarettes/d). ETS and ambient PM concentrations are orders of magnitude lower than active smoke, but with longer and continuous exposures including childhood.
In our analyses of cohorts, the exposure to active smoke particles is defined by age at death and smoking intensity at recruitment. Following widespread information on the health effects of smoking in the 1970s, mean intensity (packs/d) is likely to have decreased during cohort follow-up; overstating exposure would lengthen the x-axis and bias the ERF downward, resulting in a concave downward ERF thus understating a linearized ERF. Cross-sectional studies tend to estimate air pollution exposures for the entire population at risk and provide little or no information on exposures of subgroups such as nonsmokers.
shows that a large part of the variability in LCM for nonsmokers is proportional to age, as it is with smokers. Age effects on LCM may be interpreted as either diminished ability to defend against inhaled carcinogens and/or effects of accumulating deposits in the respiratory tract. Extrapolating the ERF trend shown in downward to younger ages indicates that the LCM for nonsmokers may reach unity at about age 35, notwithstanding lifelong exposures to ETS and ambient air pollution (but shorter occupational exposures). Minimal LCM risks for the young may result from latency of the agents involved or absence of adverse effect and suggest similar temporal behavior for all of the various inhaled carcinogens. In addition to tobacco smoke, those carcinogens may include various combinations of radon, ETS, occupational exposures, or ambient air pollution. Distinguishing among them would require exogenous data and consideration of temporal dependence.
4.2. Modeling effects of (active) smoking
4.2.1. Latency and duration
To illustrate the importance of smoking on LCM, a typical smoking relative risk of 10 corresponds to an age increase of about 12 y (), whereas a relative risk of 1.13 for air pollution corresponds to about 9 months. Thus, a small error in smoking effects could lead to a much larger error in estimated air pollution effects, depending on the correlation between smoking and air pollution and the accuracy of the smoking model. An LCM model must thus demonstrate its ability to adequately predict risks of smoking in order to establish the validity of other risk estimates.
Figure 9. Dependence of British lung cancer mortality rates on age at death and time period. (a) males. (b) females (Doll Citation1978).
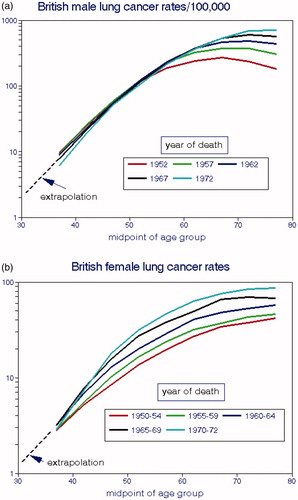
Figure 10. Lung cancer mortality rates as a function of cumulative cigarettes smoked. (a) UK data are averages of male and female cohort data from Doll (Citation1978); US data are from Haenszel and Shimkin (Citation1956). (b) separate analyses by gender.
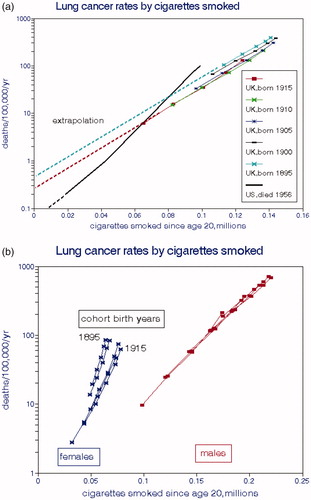
Figure 11. Male lung cancer mortality rates as functions of exposure to national average BS without controlling for cigarette consumption. (a) as coincident with year of death. (b) as cumulative lifetime exposures (Doll Citation1978; QUARG Citation1996).
Our analysis demonstrates the importance of appropriate models of smoking effects: latency as applied to age-adjusted populations and duration as applied to age-specific groups. Latency affects all members of an age-adjusted population and requires that exposure precede diagnosis in the same way for all members (Lubin Citation1984). Latency shifts responses to later ages in a cohort, and the appropriate duration of smokers’ exposures may extend to lifetime. Consideration of latency and duration affects the design of an epidemiology study; merely “controlling” for smoking accounts for neither.
Ideally, smoking “controls” in population-based epidemiological studies should include per-capita cigarette sales in a given area and area-based survey data such as percent current smokers. Smoking controls for a cohort study might include smoking status (yes, no; current, ever, never), smoking rate (1–14, 15–24, or 25+ average cigarettes smoked per day), smoking duration, CCS. However, few studies have been able to use the most specific measures in part because individual ages at death are seldom provided.
With age-specific LCM data, we assume that each smoker in the group began smoking around age 20. The first indications of lung cancer generally appear in the late 30s, consistent with a latency period of about 20 years. We defined duration as age at death less 20 y. Data on temporal trends in smoking rates would be desired for individual cohort members but are seldom available.
LCM in nonsmokers may be associated with ETS, radon, and indoor and outdoor air pollution. Other studies have also identified the duration of smoking (i.e. age) as more important than intensity (packs/d) (Speizer et al. Citation1999; Hazelton et al. Citation2012). Raaschou-Nielsen et al. (Citation2010) and McCarthy et al. (Citation2012) linked duration with age. Flanders et al. (Citation2003) presented detailed relationships of LCM with age using ACS CPS-II data, but apparently did not test the hypothesis that the CCS is a good predictor of LCM.
Hazelton et al. (Citation2005) studied lung cancer as a multistage process beginning with initiation and followed by promotion and malignant conversion, based on observations from the American Cancer and British Doctors cohorts. They concluded that although smoking can influence any of these biological processes, promotion is the most important mechanism through clonal expansion of numbers of mutated cells. This expansion process is part of the rationale for latency.
These considerations support the inability to define a safe threshold for smoking (Darby et al. Citation2005; Markowitz Citation2015; Modin et al. Citation2017; Malinovsky et al. Citation2018). Firstly, it would be difficult to find enough cohort members for statistical analysis with extremely low but well-defined CCS values. Smoking one cigarette per day for, say 50 y, produces a CCS of only 18,250 that is clearly in the noise level in , corresponding to an LCM that is indistinguishable from a nonsmoker for which there are competing risks from ETS and radon. Suffice it to say, thresholds are unlikely for established carcinogens but not for pollutant mixtures such as PM2.5.
4.2.2. Summary of linearized model results
Our model of cohort lung cancer and smoking comprises a slope (ln[LCM] vs. CCS), a y-intercept (ln[LCM] for nonsmokers) = ln[LCM0]), and a statistical measure of fit (R2). compares these parameters. CCS is expressed in millions; according to this relationship, smoking 2 packs/d for 40 y would yield an LCM rate of 188 deaths per 100,000, of which 20 would be associated with nonsmoking effects.
Table 7. Summary of smoking model results ().
The y-intercept (ln[LCM0)]) is of particular interest here since it represents all of the nonsmoking sources of LCM including air pollution. The corresponding mean LCM0 is 20 deaths per 100,000, considerably higher than the estimates in .
4.3. Interpretation of existing studies of lung cancer and air pollution
4.3.1. Spatial relationships
A cross-sectional (spatial) analysis basically describes places including high-traffic locations and greenspaces but not necessarily the exposures of inhabitants. Such analyses may not include the underlying bases for spatial gradients at that particular time or the temporal relevance to the endpoint of interest. A purely spatial model is thus fundamentally inappropriate for establishing causality stemming from temporal change. The longitudinal studies used here to describe average rates of change for an entire population, but provide no information as to whether those changes may be dominated by specific locations, subpopulations or age groups. For a cross-sectional cohort model to address longitudinal trends, individual smoking and air pollution exposures are needed from about age 20 at each location in the spatial analysis.
Spatial analyses may encounter various anomalies. For example, Cakmak et al. (Citation2018) subdivided Canada into 7 synoptic weather patterns zones; LCM risks associated with PM2.5 varied significantly among them. Most of the LCM risk was in the most populated zone (Ottawa, Toronto, and Montreal). LCM risks were significantly lower in 5 of the 6 other regions. When the population was stratified by residential stability, the RR for “movers” was 1.29 (1.04–1.54), while it was only 1.11(0.78–1.59) for the nonmovers, who would have experienced longer exposures. The average difference in LCM was 16% (p = 0.01) across all pollutants and endpoints in their analysis. This unexpected heterogeneity suggests uncontrolled confounding; smoking was only indirectly controlled rather than measured, and latency and historical exposures were not considered.
4.3.2. Personal exposures
Regulated ambient air pollutants reflect outdoor rather than indoor or personal exposures, but adults tend to be indoors ∼85% of the time. Perez-Padilla (Citation2019) discussed the need for lifelong data on personal exposures to indoor air pollution. Hart et al. (Citation2018) showed that EC is a better predictor of health effects with respect to indoor rather than outdoor exposures. Suh and Zanobetti (Citation2010) reported mixed temporal relationships (for which smoking was not an issue) with cardiovascular endpoints ambient vs. personal exposures to EC (BS), NO2, PM2.5, and O3, and reported the strongest relationships with personal EC.
Ramifications of this indoor–outdoor disconnect were discussed by Lipfert (Citation2015) and Chang et al. (Citation2014), but ETS and radon intrinsically relate to personal exposures as do occupational exposures. Home heating with solid fuels and gas stoves are likely to contribute to personal exposures of PM, CO, SO2, NOx, and personal care products to VOCs. Thus, a causal lung cancer relationship limited to traditional outdoor air pollutants is problematic for any exposure time.
Residential mobility has also been considered in this regard. Hystad et al. (Citation2013) showed nonsignificant lung cancer relationships with time spent living near major highways, and their 2012 paper (Hystad et al. Citation2012) showed that residents typically spend only a few years living near highways. Note that if highway exposures and residence location and thus indoor air pollution remain essentially constant during the entire period of interest, the requirements for latency and cumulative exposures are moot.
4.3.3. Exposure timing
The extant cross-sectional studies have been based on spatial variations in ambient air quality at the year of death or averaged over the period of follow-up. However, the exposure history of each cohort member is required to predict a long-term end-point (Moolgavkar et al. Citation2015) as shown above for lung cancer. Spontaneous tumor developments (i.e. tumors that cannot be attributed to any known cause) have mainly been considered in a clinical context and found to be rare (Venitt Citation1996).
To illustrate application of the smoking model to LCM and ambient air pollution, we postulate a latency period of 20 y and an exposure accumulation period of 30 y. We apply it to the difference between a hypothetical “clean” city that had maintained a PM2.5 level of 10 μg/m3 since 1970 and a “dirty” city that had improved PM2.5 levels by 6%/y from 125 μg/m3 in 1970 down to 20 μg/m3 in 2000, the year of cancer diagnosis. We assume constant PM2.5 levels before 1970 and increased pollution abatement began in 2000. shows the corresponding timelines for these two hypothetical cities.
By the year 2000, the ratio between accumulated exposures in the two cities was 5.7, whereas the ratio between air concentrations in 2000 was 2.0. Thus, if the RR based on current concentrations was 1.13 as stated above, the RR based on accumulated exposures would only be 1.022. More importantly, the full effect of abatement at 10%/y would not be experienced until 2036. If PM2.5 in the dirty city decreased to 10 μg/m3 in 2001 and thereafter, exposure parity could be attained in 2030. Note that these situations would not occur during periods of static air quality relationships among cities, as may have been the case in previous decades.
These relationships also affect the identification of response thresholds, which remains an unresolved issue in air pollution epidemiology. The fact that adverse responses continue to be observed at low concentrations at death rather than defining a threshold could be due to accumulated previous higher exposures.
The current situation is mainly concerned with decreasing risk factors, including smoking cessation and air pollution abatement. However, a scenario of increasing risks may also be of interest, for example, resulting from new industrial or domestic air pollution sources (Lin et al. Citation2019) or new hazardous occupations. Assuming a step function in increased risk followed by constant exposures, the latency concept posits that additional mortality would not appear until the end of the latency period. The relative magnitude of the additional risk coefficient would depend on the length of the appropriate cumulative exposure period relative to the latency period; this source of variation would be minor for realistic timing assumptions. Thus, the cumulative exposure preceding air pollution abatement is the most important factor.
4.4. Use of historical data and latency
This analysis depends heavily on data from previous decades, as pointed out by Cohen et al. (Citation1997). Interest in air pollution and lung cancer began in the 1950s when air pollution was at least an order of magnitude worse than currently and cigarette smoking and LCM had not yet reached their peaks. Coal was the dominant fuel east of the Mississippi in 1950 and presumably earlier but was not used in California (Haagen-Smit Citation1970). By ∼1960 the domestic coal burning region had been reduced to a strip along the Appalachian Mountains and fuel oil dominated along the eastern seaboard by ∼1970. These changes had major effects on local air quality and historic exposures thus differ markedly across the nation, more so than current exposures. Appendix A illustrates some of these timelines.
Several cross-sectional papers featured historical exposures, the most comprehensive of which is probably that of Hystad et al. (Citation2012) who used a “spatiotemporal” model for Canadian cohort subjects from 1975 onward for PM2.5, NO2, and O3. Validation R2s were around 0.5. Hystad et al. (Citation2013) then used this model to predict lung cancer risks from 1994 to 1997 and compared those risks with those based on concentrations measured after 1984. The risk difference across all estimates for 1984 exceeded those with the spatio-temporal model (p = 0.01), but the risks estimated with alternative exposures to PM2.5, O3, and NO2 varied. Only the LCM association with NO2 was statistically significant. Hystad’s regression model included radon exposures and several smoking metrics including pack-years smoked and time since quitting; it represents the most comprehensive analysis of this type we have seen.
Although it has not been a part of long-term air pollution studies, the latency issue has been recognized by many authors (Stocks and Campbell Citation1955; Kotin et al. Citation1958; Stocks Citation1966; Sterling and Pollack Citation1972; Lubin Citation1984; Temple and Burkitt Citation1991; Wingo et al. Citation2003). Lall et al. (Citation2004) commented on latency and developed an historical data base for PM2.5 based on relationships with other pollutants including TSP. This model was presumably intended for use with the American Cancer Society CPS-II cohort but we were unable to find published ACS risk analyses based on historical ambient air quality. Similarly, Hart et al. (Citation2009) estimated national spatial distributions of PM10 and NO2 from 1985 to 2000 that also have apparently not been used in their subsequent risk analyses.
Substantial improvements in ambient air quality have been achieved since the 1950s but corresponding benefits in reduced lung cancer rates have not been demonstrated. Possible rationales include the following:
lung cancers caused by other agents associated with the regulated pollutants.
benefits lagging air quality improvements by several decades (latency).
LCM associated with cumulative rather than contemporary exposures (duration).
B(a)P may be a candidate for the “other agent” since it is a constituent of internal combustion engine exhaust and an established carcinogen. Unfortunately, routine ambient monitoring of B(a)P was discontinued in the 1970s, perhaps because it is not regulated as a community air pollutant. Additional information on B(a)P is provided in Appendix C.
4.5. Causality
Epidemiology is intended to identify causes of adverse acute or chronic health effects. Here “cause” implies progression from healthy to diseased or compromised, which ipso facto implies a temporal change. Relocating from city A to city B within a given time frame, i.e. a spatial change, will likely not result in untimely death from congestive heart failure, COPD, or tumor metastasis, regardless of adverse climate, inadequate medical care, or worse air quality in city B. For such a chronic condition to develop, considerable periods of time are required that might be shortened by extended residence and exposure under adverse conditions. We conclude that time rather than space is the appropriate vector for analyzing incidence of chronic conditions; long-term exposures to predisposing conditions are required to reach a chronic endpoint prematurely.
Ideally, such risk factors should be investigated under clinical or laboratory conditions by application of the harmful agent, observing the response, removing the agent, and observing return to normalcy, i.e. trend reversal. However, investigating chronic endpoints in humans in this way is clearly unethical and is impractical because of the extensive exposure time required to observe truly long-term effects. Acute conditions such as heart attacks, strokes, or respiratory failure have been shown to follow heat waves or air pollution episodes with brief excursions, often with a lag of several days or more, followed by recovery of the population. Time-series studies have shown that such victims had also suffered from predisposing conditions leading to extreme frailty (Murray and Nelson Citation2000; Murray and Lipfert Citation2013). We thus conclude that causal relationships cannot be derived from purely spatial (cross-sectional) analyses including our own, with the exception of a recent study that also considered timing (Lipfert and Wyzga Citation2018).
5. Conclusions
This paper reviewed observational studies of LCM and smoking as a means of increasing understanding of LCM relationships with air pollution. Our analysis of 8 cohorts shows that LCM is well predicted by cumulative lifetime cigarettes smoked (), consistent with occupational studies of LCM based on duration of employment. These data also provide consistent LCM estimates for nonsmokers whose exposures include ETS, radon, and ambient air pollution. Our longitudinal population analysis of trend reversals () shows the importance of latency in which cancer incidence lags exposure by 10–30 y. We found stable LCM rates for never-smoking females over a wide range of time periods and locations despite substantial differences in the corresponding levels of ambient air quality.
Figure 12. Comparison of trends in annual cigarette sales, estimated PM2.5, and lung cancer mortality 18-y later (deaths/10,000 population).
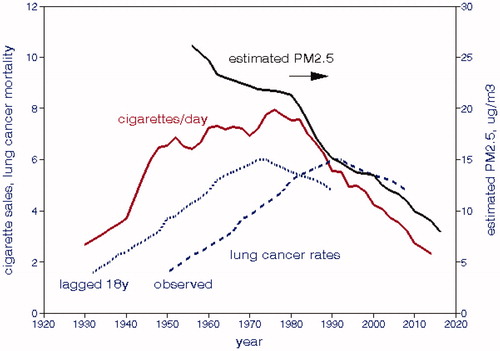
Figure 13. Trends in lung cancer mortality rates for male and female nonsmokers in the CPS cohorts.
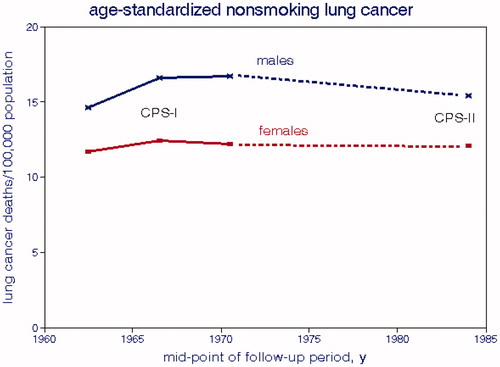
Figure 14. Relative risks of estimated lung cancer risks associated with exposure to environmental tobacco smoke. Data from Hackshaw et al. (Citation1997).
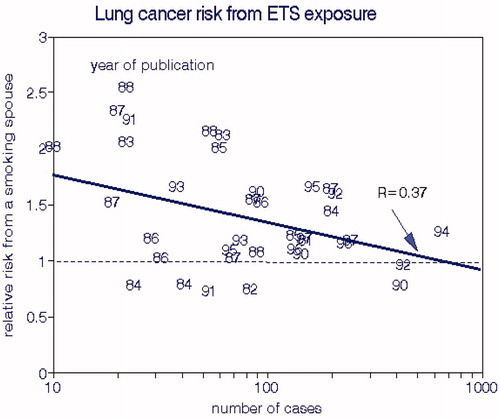
Figure 15. Geographic distribution of British male lung cancer risks by mean BS and benzo(a)pyrene levels. Cross-sectional data from Stocks (Citation1960).
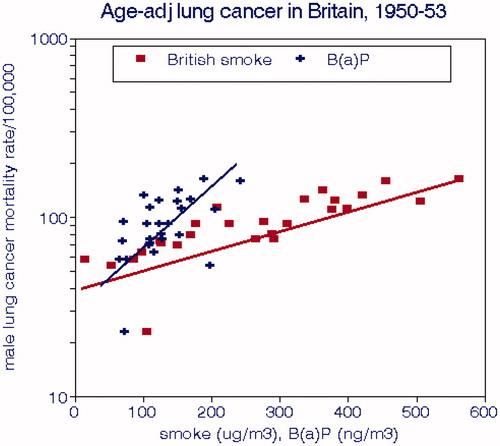
LCM risks were significantly associated with the much higher ambient air pollution levels prior to the Clean Air Act but risks associated with the current and more relevant levels are correspondingly reduced. Carcinogenicity of these regulated pollutants has not been established experimentally. The extant studies of LCM risks of air pollution did not demonstrate adequate controls for potentially confounding carcinogens, notably smoking. They were based on spatial gradients without considering the important temporal factors: delay between exposure and response, accumulation of lung deposits, effects of previous high exposures. We thus question the validity of current estimates of LCM risks associated with conventional ambient air pollution.
The lung cancer risks associated with long-term current and previous ambient air quality levels may become relatively more important to public health as smoking prevalence continues to decrease. New epidemiology studies that consider latency and cumulative exposure are needed to assess those risks. Such studies should be designed to estimate the incremental risks of current and future air pollution exposures contingent upon past exposures. Such assessments will require spatio-temporal study designs that consider trends of lung cancer and pollution exposure. They must recognize that cities having experienced previous elevated exposures had greater LCM risks than those that had previously maintained exposures at current levels.
Ramifications of our findings include the need for long-term monitoring of established airborne carcinogens such as B(a)P and the realization that any benefits from reduced exposures will likely be delayed for decades, thus affecting assessment of progress on the “war on cancer” (Temple and Burkitt Citation1991).
Figure 16. Timelines for a hypothetical air pollution abatement scenario.
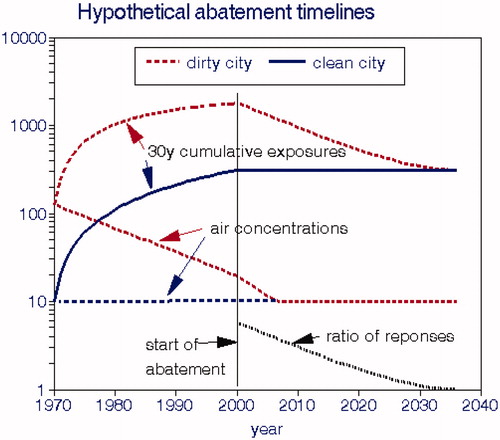
Declaration of interest
This research was performed as an independent self-funded effort; we declare no conflicts of interest. All data were obtained from public sources. Dr. Wyzga was formerly employed by EPRI part-time, retired in April 2019, and participated in this project on his own behalf.
Authors’ contributions
FWL extracted the data, performed the calculations, and wrote the initial draft. REW edited subsequent drafts and provided additional information.
| Abbreviations | ||
| AIC | = | Akaike Information Criterion |
| As | = | arsenic content of PM |
| B(a)P | = | benzo(alpha)pyrene |
| BS | = | British smoke |
| CCS | = | cumulative cigarettes smoked |
| Cigs | = | cigarettes |
| Cr | = | chromium content of PM |
| EC | = | elemental carbon content of PM |
| EPA | = | US Environmental Protection Agency |
| ERF | = | exposure-response function |
| ETS | = | environmental tobacco smoke |
| Fe | = | iron content of PM |
| LCM | = | lung cancer mortality rate |
| NASN | = | National Air Sampling Network |
| Ni | = | nickel content of PM |
| NO2 | = | nitrogen dioxide |
| O3 | = | ozone |
| OLS | = | ordinary least squares |
| Pb | = | lead content of PM |
| PM2.5 | = | particulate matter with mass median diameter < 2.5 µm |
| PM10 | = | particulate matter with mass median diameter < 10 µm |
| RR | = | relative risk |
| SO2 | = | sulfur dioxide |
| SO2−4 | = | sulfate ion content of PM |
| STN | = | Speciation Trends Network (EPA) |
| TSP | = | total suspended particulate matter |
| U.K. | = | United Kingdom |
| U.S. | = | United States |
| V | = | vanadium content of PM |
| VOC | = | volatile organic carbon air pollutant |
Acknowledgements
The authors extend a note of appreciation to the reviewers selected by the editor and anonymous to the authors. Their comments helped improve the paper. The Open Access fee was supported by EPRI, who had no role in the analysis or preparation of the manuscript.
References
- Acuff L, Fristoe K, Hamblen J, Smith M, Chen J. 2016. Third-hand smoke: old smoke, new concerns. J Community Health. 41(3):680–687.
- Alberg AJ, Brock MV, Ford JG, Samet JM, Spivack SD. 2013. Epidemiology of lung cancer: diagnosis and management of lung cancer, 3rd ed: American College of Chest Physicians evidence-based clinical practice guidelines. Chest. 143(5):e1S–e29S.
- Albert RE, Upton AC, Carnow BW, Wynder EL. 1978. Panel discussion: sources of carcinogens. Bull N Y Acad Med. 54:435–441.
- Barrera-Rodriguez R, Morales-Fuentes J. 2012. Lung cancer in women. Lung Cancer. 3:79–89.
- Beelen R, Hoek G, van den Brandt PA, Goldbohm RA, Fischer P, Schouten LJ, Jerrett M, Hughes E, Armstrong B, Brunekreef B, et al. 2008a. Long-term effects of traffic-related air pollution on mortality in a Dutch cohort (NLCS-AIR study). Environ Health Perspect. 116(2):196–202.
- Beelen R, Hoek G, van den Brandt PA, Goldbohm RA, Fischer P, Schouten LJ, Armstrong B, Brunekreef B. 2008b. Long-term exposure to traffic-related air pollution and lung cancer risk. Epidemiology. 19(5):702–710.
- Beeson WL, Abbey DE, Knutsen SF. 1998. Long-term concentrations of ambient air pollutants and incident lung cancer in California adults: results from the AHSMOG study. Adventist Health Study on Smog. Environ Health Perspect. 106(12):813–822.
- Beverland IJ, Cohen GR, Heal MR, Carder M, Yap C, Robertson C, Hart CL, Agius RM. 2012. A comparison of short-term and long-term air pollution exposure associations with mortality in two cohorts in Scotland. Environ Health Perspect. 120(9):1280–1285.
- Boer R, Moolgavkar SH, Levy DT. 2012. Chapter 15: Impact of tobacco control on lung cancer mortality in the United States over the period 1975–2000–summary and limitations. Risk Anal. 32(1):S190–S201.
- Boffetta P. 2012. A review of cancer risk in the trucking industry, with emphasis on exposure to diesel exhaust. G Ital Med Lav Ergon. 34(3):365–370.
- Bräuner EV, Andersen CE, Sørensen M, Jovanovic Andersen Z, Gravesen P, Ulbak K, Hertel O, Pedersen C, Overvad K, Tjønneland A, et al. 2012. Residential radon andlung cancer incidence in a Danish cohort. Environ Res. 118:130–136.
- Brawley OW. 2018. Some thoughts on exposure to the World Trade Center wreckage and cancer. JAMA Oncol. 4(6):775–776.
- Breugelmans O, Ameling C, Marra M, Fischer P, van de Kassteele J, Lijzen J, Oosterlee A, Keuken R, Visser O, Houthuijs D, et al. 2013. Lung cancer risk and past exposure to emissions from a large steel plant. J Environ Public Health. 2013:1.
- Brucker N, Moro AM, Charão MF, Durgante J, Freitas F, Baierle M, Nascimento S, Gauer B, Bulcão RP, Bubols GB, et al. 2013. Biomarkers of occupational exposure to air pollution, inflammation and oxidative damage in taxi drivers. Sci Total Environ. 463–464:884–893.
- Brunekreef B, Beelen R, Hoek G, Schouten L, Bausch-Goldbohm S, Fischer P, Armstrong B, Hughes E, Jerrett M, van den Brandt P. 2009. Effects of long-term exposure to traffic-related air pollution on respiratory and cardiovascular mortality in the Netherlands: the NLCS-AIR study. Res Rep Health Eff Inst. 139:5–71.
- Burns DM, Lee L, Shen LZ, Gilpin E, Tolley HD, Vaughn J, Shanks TG. 1996. Cigarette Smoking Behavior in the United States, Smoking and Tobacco Control Monograph No. 8, US Dept Agriculture.
- Cakmak S, Hebbern C, Pinault L, Lavigne E, Vanos J, Crouse DL, Tjepkema M. 2018. Associations between long-term PM(2.5) and ozone exposure and mortality in the Canadian Census Health and Environment Cohort (CANCHEC), by spatial synoptic classification zone. Environ Int. 111:200–211.
- Carey IM, Atkinson RW, Kent AJ, van Staa T, Cook DG, Anderson HR. 2013. Mortality associations with long-term exposure to outdoor air pollution in a national English cohort. Am J Respir Crit Care Med. 187(11):1226–1233.
- Carnow BW. 1978. The “urban factor” and lung cancer: cigarette smoking or air pollution? Environ Health Perspect. 22:17–21.
- Cesaroni G, Badaloni C, Gariazzo C, Stafoggia M, Sozzi R, Davoli M, Forastiere F. 2013. Long-term exposure to urban air pollution and mortality in a cohort of more than a million adults in Rome. Environ Health Perspect. 121(3):324–331.
- Chang ET, Adami H-O, Bailey WH, Boffetta P, Krieger RI, Moolgavkar SH, Mandel JS. 2014. Validity of geographically modeled environmental exposure estimates. Crit Rev Toxicol. 44(5):450–466.
- Chang ET, Lau EC, Van Landingham C, Crump KS, McClellan RO, Moolgavkar SH. 2018. Reanalysis of diesel engine exhaust and lung cancer mortality in the diesel exhaust in miners study cohort using alternative exposure estimates and radon adjustment. Am J Epidemiol. 187(6):1210–1219.
- Chen H, Goldberg MS, Villeneuve PJ. 2008. A systematic review of the relation between long-term exposure to ambient air pollution and chronic diseases. Rev Environ Health. 23(4):243–297.
- Chinn S, Florey CD, Baldwin IG, Gorgol M. 1981. The relation of mortality in England and Wales 1969–1973 to measurements of air pollution. J Epidemiol Community Health. 35(3):174–179.
- Clapp RW, Jacobs MM, Loechler EL. 2008. Environmental and occupational causes of cancer: new evidence 2005–2007. Rev Environ Health. 23(1):1–37.
- Cohen AJ, Pope CA, III. 1995. Lung cancer and air pollution. Environ Health Perspect. 103(8):219–224.
- Cohen AJ, Pope C II, Speizer FE. 1997. Ambient air pollution as a risk factor for lung cancer. Salud Pública Méx. 39(4):346–355.
- Cohen AJ. 2000. Outdoor air pollution and lung cancer. Environ Health Perspect. 108(4):743–750.
- Cold Spring Harbor Laboratory. 1979. Banbury Report 3, A Safe Cigarette? Proceedings of a meeting held at the Banbury Center, Cold Spring Harbor, NY.
- Consonni D, Carugno M, De Matteis S, Nordio F, Randi G, Bazzano M, Caporaso NE, Tucker MA, Bertazzi PA, Pesatori AC, et al. 2018. Outdoor particulate matter (PM10) exposure and lung cancer risk in the EAGLE study. PLoS One. 13:e0203539.
- Costa S, Ferreira J, Silveira C, Costa C, Lopes D, Relvas H, Borrego C, Roebeling P, Miranda AI, Paulo Teixeira J, et al. 2014. Integrating health on air quality assessment–review report on health risks of two major European outdoor air pollutants: PM and NO2. J Toxicol Environ Health B Crit Rev. 17(6):307–340.
- Couraud S, Zalcman G, Milleron B, Morin F, Souquet PJ. 2012. Lung cancer in never smokers – a review. Eur J Cancer. 48(9):1299–1311.
- Crump KS, Van Landingham C, Moolgavkar SH, McClellan R. 2015. Reanalysis of the DEMS nested case-control study of lung cancer and diesel exhaust: suitability for quantitative risk assessment. Risk Anal. 35(4):676–700.
- Darby S, Hill D, Auvinen A, Barros-Dios JM, Baysson H, Bochicchio F, Deo H, Falk R, Forastiere F, Hakama M, et al. 2005. Radon in homes and risk of lung cancer: collaborative analysis of individual data from 13 European case-control studies. BMJ. 330(7485):223.
- Darby SC, Pike MC. 1988. Lung cancer and passive smoking: predicted effects from a mathematical model for cigarette smoking and lung cancer. Br J Cancer. 58(6):825–831.
- Davey Smith G. 2003. Effect of passive smoking on health. BMJ. 326(7398):1048–1049.
- De Matteis S, Consonni D, Bertazzi PA. 2008. Exposure to occupational carcinogens and lung cancer risk. Evolution of epidemiological estimates of attributable fraction. Acta Biomed. 79(1):34–42.
- Dean G. 1966. Lung cancer and bronchitis in Northern Ireland, 1960-2. Br Med J. 1(5502):1506–1514.
- Demetriou CA, Raaschou-Nielsen O, Loft S, Møller P, Vermeulen R, Palli D, Chadeau-Hyam M, Xun WW, Vineis P. 2012. Biomarkers of ambient air pollution and lung cancer: a systematic review. Occup Environ Med. 69(9):619–627.
- Demetriou CA, Vineis P. 2015. Carcinogenicity of ambient air pollution: use of biomarkers, lessons learnt and future directions. J Thorac Dis. 7(1):67–95.
- Dockery DW, Pope CA, Xu X, Spengler JD, Ware JH, Fay ME, Ferris BG, Speizer FE. 1993. An association between air pollution and mortality in six U.S. cities. N Engl J Med. 329(24):1753–1759.
- Doll R. 1978. Atmospheric pollution and lung cancer. Environ Heath Perspect. 22:23–31.
- Doll R, Hill AB. 1952. A study of the aetiology of carcinoma of the lung. Br Med J. 2(4797):1271–1286.
- Doll R, Hill AB. 1956. Lung cancer and other causes of death in relation to smoking; a second report on the mortality of British doctors. Br Med J. 2(5001):1071–1081.
- Doll R, Hill AB. 1964. Mortality in relation to smoking: ten years' observations of British doctors. Br Med J. 1(5395):1399–1410.
- Doll R, Hill AB. 1999. Smoking and carcinoma of the lung. Preliminary report. 1950. Bull World Health Organ. 77:84–93.
- Doll R, Peto R. 1976. Mortality in relation to smoking: 20 years' observations on male British doctors. Br Med J. 2(6051):1525–1536.
- Doll R, Peto R. 1978. Cigarette smoking and bronchial carcinoma: dose and time relationships among regular smokers and lifelong nonsmokers. J Epidemiol Community Health. 32(4):303–313.
- Doll R, Peto R, Boreham J, Sutherland I. 2005. Mortality from cancer in relation to smoking: 50 years observations on British doctors. Br J Cancer. 92(3):426–429.
- Doll R, Peto R, Wheatley K, Gray R, Sutherland I. 1994. Mortality in relation to smoking: 40 years' observations on male British doctors. BMJ. 309(6959):901–911.
- Dorn HF. 1959. Tobacco consumption and mortality from cancer and other diseases. Public Health Rep. 74(7):581–593.
- Eckel SP, Cockburn M, Shu Y-H, Deng H, Lurmann FW, Liu L, Gilliland FD. 2016. Air pollution affects lung cancer survival. Thorax. 71(10):891–898.
- Elliott P, Shaddick G, Wakefield JC, Hoogh CD, Briggs DJ. 2007. Long-term associations of outdoor air pollution with mortality in Great Britain. Thorax. 62(12):1088–1094.
- Enomoto M, Tierney WJ, Nozaki K. 2008. Risk of human health by particulate matter as a source of air pollution--comparison with tobacco smoking. J Toxicol Sci. 33(3):251–267.
- Enstrom JE, Kabat GC. 2003. Environmental tobacco smoke and tobacco related mortality in a prospective study of Californians, 1960-98. BMJ. 326(7398):1057.
- Filleul L, Rondeau V, Vandentorren S, Le Moual N, Cantagrel A. 2005. Twenty five year mortality and air pollution: results from the French PAARC survey. Occup Environ Med. 62(7):453–460.
- Fischer PH, Marra M, Ameling CB, Hoek G, Beelen R, de Hoogh K, Breugelmans O, Kruize H, Janssen NAH, Houthuijs D, et al. 2015. Air pollution and mortality in seven million adults: The Dutch Environmental Longitudinal Study (DUELS). Environ Health Perspect. 123(7):697–704.
- Flanders WD, Lally CA, Zhu BP, Henley SJ, Thun MJ. 2003. Lung cancer mortality in relation to age, duration of smoking, and daily cigarette consumption: results from Cancer Prevention Study II. Cancer Res. 63(19):6556–6562.
- Forastiere F, Perucci CA, di Pietro A, Miceli M, Rapiti E, Bargagli A, Borgia P. 1994. Mortality among urban policemen in Rome. Am J Ind Med. 26(6):785–798.
- Friberg L, Cederlöf R. 1978. Late effects of air pollution with special reference to lung cancer. Environ Health Perspect. 22:45–66.
- Friedman GD, Tekawa I, Sadler M, Sidney S. 1997. Smoking and mortality: the kaiser permanente experience. Smoking Tobacco Control Monograph. (8):477–490.
- Gallus S, Negri E, Boffetta P, McLaughlin JK, Bosetti C, La Vecchia C. 2008. European studies on long-term exposure to ambient particulate matter and lung cancer. Eur J Cancer Prev. 17(3):191–194.
- Gamble JF, Nicolich MJ, Boffetta P. 2012. Lung cancer and diesel exhaust: an updated critical review of the occupational epidemiology literature. Crit Rev Toxicol. 42(7):549–598.
- García-Esquinas E, Jiménez A, Pastor-Barriuso R, Jones MR, Perez-Gomez B, Navas-Acien A, Tellez-Plaza M. 2018. Impact of declining exposure to secondhand tobacco smoke in public places to decreasing smoking-related cancer mortality in the US population. Environ Int. 117:260–267.
- Gardner MJ, Waller RE. 1970. Environmental factors in the aetiology of lung cancer and bronchitis. Br J Prev Soc Med. 24(1):58–60.
- Garfinkel L. 1981. Time trends in lung cancer mortality among nonsmokers and a note on passive smoking. J Natl Cancer Inst. 66(6):1061–1066.
- Gharibvand L, Lawrence Beeson W, Shavlik D, Knutsen R, Ghamsary M, Soret S, Knutsen SF. 2017. The association between ambient fine particulate matter and incident adenocarcinoma subtype of lung cancer. Environ Health. 16:71.
- Gillis CR, Hole DJ, Boyle P. 1988. Cigarette smoking and male lung cancer in an area of very high incidence. I. Report of a case-control study in the West of Scotland. J Epidemiol Commun Health. 42(1):38–43.
- Gillis CR, Hole DJ, Hawthorne VM. 1988. Cigarette smoking and male lung cancer in an area of very high incidence. II. Report of a general population cohort study in the West of Scotland. J Epidemiol Commun Health. 42(1):44–48.
- Gore AT, Shaddick CW. 1958. Atmospheric pollution and mortality in the County of London. Brit J Prev Soc Med. 12:104–113.
- Guerreiro CBB, Horálek J, de Leeuw F, Couvidat F. 2016. Benzo(a)pyrene in Europe: ambient air concentrations, population exposure and health effects. Environ Pollut. 214:657–667.
- Guo Y, Zeng H, Zheng R, Li S, Barnett AG, Zhang S, Zou X, Huxley R, Chen W, Williams G, et al. 2016. The association between lung cancer incidence and ambient air pollution in China: a spatiotemporal analysis. Environ Res. 144(Pt A):60–65.
- Guo Y, Zeng H, Zheng R, Li S, Pereira G, Liu Q, Chen W, Huxley R. 2017. The burden of lung cancer mortality attributable to fine particles in China. Sci Total Eviron. 579:1460–1466.
- Haagen-Smit AJ. 1970. A lesson from the smog capital of the world. Proc Nat Acad Sci. 67(2):887–897.
- Hackshaw AK, Law MR, Wald NJ. 1997. The accumulated evidence on lung cancer and environmental tobacco smoke. BMJ. 315(7114):980–988.
- Haenszel W, Shimkin MB. 1956. Smoking patterns and epidemiology of lung cancer in the United States; are they compatible? J Natl Cancer Inst. 16(6):1417–1441.
- Hales S, Blakely T, Woodward A. 2012. Air pollution and mortality in New Zealand: cohort study. J Epidemiol Community Health. 66(5):468–473.
- Hammond EC. 1962. Air pollution, smoking, and health. Tex State J Med. 58:639–647.
- Hammond EC, Garfinkel L. 1980. General air pollution and cancer in the United States. Prev Med. 9(2):206–211.
- Hammond EC, Horn D. 1958. Smoking and death rates: report on forty-four months of follow-up of 187,783 men. 2. Death rates by cause. JAMA. 166(11):1294–1308.
- Hammond EC, Wynder EL. 1960. Cigarette smoking and lung cancer in Canada. Can Med Assoc J. 82:372–377.
- Hamra GB, Laden F, Cohen AJ, Raaschou-Nielsen O, Brauer M, Loomis D. 2015. Lung cancer and exposure to nitrogen dioxide and traffic: a systematic review and meta-analysis. Environ Health Perspect. 123(11):1107–1112.
- Harrison RM, Smith DJ, Kibble AJ. 2004. What is responsible for the carcinogenicity of PM2.5? Occup Environ Med. 61(10):799–805.
- Hart CL, Hole DJ, Gillis CR, Smith GD, Watt GC, Hawthorne VM. 2001. Social class differences in lung cancer mortality: risk factor explanations using two Scottish cohort studies. Int J Epidemiol. 30(2):268–274.
- Hart CL, Smith GD, Hole DJ, Hawthorne VM. 2006. Carboxyhaemoglobin concentration, smoking habit, and mortality in 25 years in the Renfrew/Paisley prospective cohort study. Heart. 92:321–324.
- Hart JE, Grady ST, Laden F, Coull BA, Koutrakis P, Schwartz JD, Moy ML, Garshick E. 2018. Effects of indoor and ambient black carbon and PM2.5 on pulmonary function among individuals with COPD. Environ Health Perspect. 126(12):127008–127008.
- Hart JE, Spiegelman D, Beelen R, Hoek G, Brunekreef B, Schouten LJ, van den Brandt P. 2015. Long-term ambient residential traffic-related exposures and measurement error-adjusted risk of incident lung cancer in the Netherlands cohort study on diet and cancer. Environ Health Perspect. 123(9):860–866.
- Hart JE, Yanosky JD, Puett RC, Ryan L, Dockery DW, Smith TJ, Garshick E, Laden F. 2009. Spatial modeling of PM10 and NO2 in the continental United States, 1985-2000. Environ Health Perspect. 117(11):1690–1696.
- Hazelton WD, Clements MS, Moolgavkar SH. 2005. Multistage carcinogenesis and lung cancer mortality in three cohorts. Cancer Epidemiol Biomarkers Prev. 14:1171–1181.
- Hazelton WD, Goodman G, Rom WN, Tockman M, Thornquist M, Moolgavkar S, Weissfeld JL, Feng Z. 2012. Longitudinal multistage model for lung cancer incidence, mortality, and CT detected indolent and aggressive cancers. Math Biosci. 240(1):20–34.
- Hecht SS, Szabo E. 2014. Fifty years of tobacco carcinogenesis research: from mechanisms to early detection and prevention of lung cancer. Cancer Prev Res. 7(1):1–8.
- Heinrich J, Thiering E, Rzehak P, Krämer U, Hochadel M, Rauchfuss KM, Gehring U, Wichmann H-E. 2013. Long-term exposure to NO2 and PM10 and all-cause and cause-specific mortality in a prospective cohort of women. Occup Environ Med. 70(3):179–186.
- Hemminki K, Pershagen G. 1994. Cancer risk of air pollution: epidemiological evidence. Environ Health Perspect. 102(4):187–192.
- Higgins IT. 1984. Air pollution and lung cancer: diesel exhaust, coal combustion. Prev Med. 13(2):207–218.
- Higgins IT. 1976. Epidemiological evidence on the carcinogenic risk of air pollution. IARC Sci Publ. (13):41–52.
- Hill AB. 1965. The environment and disease: association or causation. Proc Royal Soc Med. 58(5):295–300.
- Hoek G, Raaschou-Nielsen O. 2014. Impact of fine particles in ambient air on lung cancer. Chin J Cancer. 33(4):197–203.
- Hueper WC. 1951. Environmental lung cancer. Ind Med Surg. 20(2):49–62.
- Husgafvel-Pursiainen K. 2004. Genotoxicity of environmental tobacco smoke: a review. Mutat Res. 567(2-3):427–445.
- Hystad P, Demers PA, Johnson KC, Brook J, van Donkelaar A, Lamsal L, Martin R, Brauer M. 2012. Spatiotemporal air pollution exposure assessment for a Canadian population-based lung cancer case-control study. Environ Health. 11(1):22.
- Hystad P, Demers PA, Johnson KC, Carpiano RM, Brauer M. 2013. Long-term residential exposure to air pollution and lung cancer risk. Epidemiology. 24(5):762–772.
- [IARC] International Agency for Research on Cancer. Air Pollution and Cancer. IARC Scientific Publication No. 161; 2013.
- Jerrett M, Burnett RT, Beckerman BS, Turner MC, Krewski D, Thurston G, Martin RV, van Donkelaar A, Hughes E, Shi Y, et al. 2013. Spatial analysis of air pollution and mortality in California. Am J Respir Crit Care Med. 188(5):593–599.
- Jerrett M, Burnett RT, Ma R, Pope CA, Krewski D, Newbold KB, Thurston G, Shi Y, Finkelstein N, Calle EE, et al. 2005. Spatial analysis of air pollution and mortality in Los Angeles. Epidemiology. 16(6):727–736.
- Jung KH, Liu B, Lovinsky-Desir S, Yan B, Camann D, Sjodin A, Li Z, Perera F, Kinney P, Chillrud S, et al. 2014. Time trends of polycyclic aromatic hydrocarbon exposure in New York City from 2001 to 2012: assessed by repeat air and urine samples. Environ Res. 131:95–103.
- Kachuri L, Harris MA, MacLeod JS, Tjepkema M, Peters PA, Demers PA. 2017. Cancer risks in a population-based study of 70,570 agricultural workers: results from the Canadian census health and Environment cohort (CanCHEC). BMC Cancer. 17(1):343.
- Kachuri L, Villeneuve PJ, Parent MÉ, Johnson KC; Canadian Cancer Registries Epidemiology Group, Harris SA. 2014. Occupational exposure to crystalline silica and the risk of lung cancer in Canadian men. Int J Cancer. 135:138–148.
- Katanoda K, Sobue T, Satoh H, Tajima K, Suzuki T, Nakatsuka H, Takezaki T, Nakayama T, Nitta H, Tanabe K, et al. 2011. An association between long-term exposure to ambient air pollution and mortality from lung cancer and respiratory diseases in Japan. J Epidemiol. 21(2):132–143.
- Kotin P, Falk HL, McCammon CJ. 1958. Pulmonary cancer with special reference to air pollution and pathogenesis. CA Cancer J Clin. 8(2):62–65.
- Krewski D, Jerrett M, Burnett RT, Ma R, Hughes E, Shi Y, Turner MC, Pope CA, Thurston G, Calle EE, et al. 2009. Extended follow-up and spatial analysis of the American Cancer Society study linking particulate air pollution and mortality. Res Rep Health Eff Inst. (140):5–114. discussion 115-36.
- Krewski D, Lubin JH, Zielinski JM, Alavanja M, Catalan VS, Field RW, Klotz JB, Létourneau EG, Lynch CF, Lyon JI, et al. 2005. Residential radon and risk of lung cancer: a combined analysis of 7 North American case-control studies. Epidemiology. 16(2):137–145.
- Lall R, Kendall M, Ito K, Thurston GD. 2004. Estimates of historical annual PM2.5 exposures or health effects assessment. Atmos Environ. 38(31):5217–5226.
- Li J, Cone JE, Kahn AR, Brackbill RM, Farfel MR, Greene CM, Hadler JL, Stayner LT, Stellman SD. 2012. Association between World Trade Center exposure and excess cancer risk. JAMA. 308:2479–2488.
- Li R, Zhou R, Zhang J. 2018. Function of PM2.5 in the pathogenesis of lung cancer and chronic airway inflammatory diseases. Oncol Lett. 15(5):7506–7514.
- Lin CK, Lin RT, Chen T, Zigler C, Wei Y, Christiani DC. 2019. A global perspective on coal-fired power plants and burden of lung cancer. Environ Health. 18(1):9.
- Lipfert FW, Malone RG, Daum ML, Mendell NR, Yang C-C. 1988. A statistical study of the macroepidemiology of air pollution and total mortality. Brookhaven National Laboratory Report BNL 52122.
- Lipfert FW, Wyzga RE, Baty JD, Miller JP. 2006. PM2.5 constituents and related air quality variables as predictors of survival in a cohort of U.S. military veterans. Inhalation Toxicol. 18(9):645–657.
- Lipfert FW, Wyzga RE. 2018. Revisiting the veterans cohort mortality study: new results and synthesis. J Air Waste Manag Assoc. 68(11):1248–1268.
- Lipfert FW. 2015. An assessment of air pollution exposure information for health studies. Atmosphere. 6(11):1736–1752.
- Lipfert FW. 1980. Statistical studies of mortality and air pollution: multiple regression analyses by cause of death. Science of the Total Envir. 16(2):165–183.
- Lipfert FW, Wyzga RE, Baty JD, Miller JP. 2009. Air pollution and survival within the Washington University-EPRI Veterans Cohort: risks based on modeled estimates of ambient levels of hazardous and criteria air pollutants. J Air Waste Manag Assoc. 59:473–489.
- Loomis D, Huang W, Chen G. 2014. The International Agency for Research on Cancer (IARC) evaluation of the carcinogenicity of outdoor air pollution: focus on China. Chin J Cancer. 33(4):189–196.
- Lubin JH. 1984. Modifying risk of developing lung cancer by changing habits of cigarette smoking. Br Med J (Clin Res Ed). 289(6449):921.
- Malinovsky G, Yarmoshenko I, Zhukovsky M. 2018. Radon, smoking and HPV as lung cancer risk factors in ecological studies. Int J Radiat Biol. 94(1):62–69.
- Mannino DM, Ford E, Giovino GA, Thun M. 2001. Lung cancer mortality rates in birth cohorts in the United States from 1960 to 1994. Lung Cancer. 31:91–99.
- Markowitz S. 2015. Asbestos-related lung cancer and malignant mesothelioma of the pleura: selected current issues. Semin Respir Crit Care Med. 36(3):334–346.
- McCarthy WJ, Meza R, Jeon J, Moolgavkar SH. 2012. Chapter 6: Lung cancer in neversmokers: epidemiology and risk prediction models. Risk Anal. 32(1):S69–S84.
- Mills CA. 1946. Respiratory tract cancer deaths in relation to atmospheric pollution in Cincinnati. Cinci J Med. 27:692–695.
- Mills CA. 1960. Motor exhaust gases and lung cancer in Cincinnati. Am J Med Sci. 239(3):316–319.
- Mills CA, Porter MM. 1957. Tobacco smoking, motor exhaust fumes, and general air pollution in relation to lung cancer incidence. Cancer Res. 17(10):981–990.
- Modin HE, Fathi JT, Gilbert CR, Wilshire CL, Wilson AK, Aye RW, Farivar AS, Louie BE, Vallières E, Gorden JA, et al. 2017. Pack-year cigarette smoking history for determination of lung cancer screening eligibility. comparison of the electronic medical record versus a shared decision-making conversation. Annals ATS. 14(8):1320–1325.
- Moolgavkar SH, Chang ET, Luebeck G, Lau EC, Watson HN, Crump KS, Boffetta P, McClellan R. 2015. Diesel engine exhaust and lung cancer mortality: time-related factors in exposure and risk. Risk Anal. 35(4):663–675.
- Moolgavkar SH, Chang ET, Watson HN, Lau EC. 2018. An assessment of the cox proportional hazards regression model for epidemiologic studies. Risk Anal. 38(4):777–794.
- Murray CJ, Lipfert FW. 2013. Inferring frail life expectancies in Chicago from daily fluctuations in elderly mortality. Inhal Toxicol. 25(8):461–479.
- Murray CJ, Nelson CR. 2000. State-space modeling of the relationship between air quality and mortality. J Air Waste Manag Assoc. 50:1075–1080.
- Naess Ø, Nafstad P, Aamodt G, Claussen B, Rosland P. 2007. Relation between concentration of air pollution and cause-specific mortality: four-year exposures to nitrogen dioxide and particulate matter pollutants in 470 neighborhoods in Oslo, Norway. Am J Epidemiol. 165(4):435–443.
- Nafstad P, Håheim LL, Oftedal B, Gram F, Holme I. 2003. Lung cancer and air pollution: a 27 year follow up of 16 209 Norwegian men. Thorax. 58(12):1071–1076.
- Navaranjan G, Berriault C, Do M, Villeneuve PJ, Demers PA. 2016. Cancer incidence and mortality from exposure to radon progeny among Ontario uranium miners. Occup Environ Med. 73(12):838–845.
- Neuberger JS, Field RW. 2003. Occupation and lung cancer in nonsmokers. Rev Environ Health. 18(4):251–267.
- Olsson AC, Gustavsson P, Kromhout H, Peters S, Vermeulen R, Brüske I, Pesch B, Siemiatycki J, Pintos J, Brüning T, et al. 2011. Exposure to diesel motor exhaust and lung cancer risk in a pooled analysis from case-control studies in Europe and Canada. Am J Respir Crit Care Med. 183(7):941–948.
- O'Neil ME, Henley SJ, Rohan EA, Ellington TD, Gallaway MS. 2019. Lung Cancer Incidence in Nonmetropolitan and Metropolitan Counties – United States, 2007-2016. MMWR Morb Mortal Wkly Rep. 68:993–998.
- Parent ME, Rousseau MC, Boffetta P, Cohen A, Siemiatycki J. 2007. Exposure to diesel and gasoline engine emissions and the risk of lung cancer. Am J Epidemiol. 165(1):53–62.
- Perera F. 1981. Carcinogenicity of airborne fine particulate benzo(a)pyrene: an appraisal of the evidence and the need for control. Environ Health Perspect. 42:163–185.
- Perez-Padilla R. 2019. Household air pollution: consider lifelong exposure. Am J Respir Crit Care Med. 199(5):553–555.
- Peto R, Darby S, Deo H, Silcocks P, Whitley E, Doll R. 2000. Smoking, smoking cessation, and lung cancer in the UK since 1950: combination of national statistics with two case-control studies. BMJ. 321(7257):323–329.
- Pike MC, Henderson BE. 1975. Clustering of cancer. CA Cancer J Clin. 25(4):230–234.
- Pope CA, III, Burnett RT, Thun MJ, Calle EE, Krewski D, Ito K, Thurston GD. 2002. Lung cancer, cardiopulmonary mortality, and long-term exposure to fine particulate air pollution. JAMA. 287(9):1132–1141.
- Pope CA, Burnett RT, Turner MC, Cohen A, Krewski D, Jerrett M, Gapstur SM, Thun MJ. 2011. Lung cancer and cardiovascular disease mortality associated with ambient air pollution and cigarette smoke: shape of the exposure-response relationships. Environ Health Perspect. 119(11):1616–1621.
- Pope CA, Thun MJ, Namboodiri MM, Dockery DW, Evans JS, Speizer FE, Heath CW. 1995. Particulate air pollution as a predictor of mortality in a prospective study of U.S. adults. Am J Respir Crit Care Med. 151(3_pt_1):669–674.
- Pryor WA, Prier DG, Church DF. 1983. Electron-spin resonance study of mainstream and sidestream cigarette smoke: nature of the free radicals in gas-phase smoke and in cigarette tar. Environ Health Perspect. 47:345–355.
- Puett RC, Hart JE, Yanosky JD, Spiegelman D, Wang M, Fisher JA, Hong B, Laden F. 2014. Particulate matter air pollution exposure, distance to road, and incident lung cancer in the nurses' health study cohort. Environ Health Perspect. 122(9):926–932.
- [QUARG] Quality of Urban Air Review Group. 1996. Airborne Particulate Matter in the United Kingdom. Department of the Environment.
- Raaschou-Nielsen O, Andersen ZJ, Beelen R, Samoli E, Stafoggia M, Weinmayr G, Hoffmann B, Fischer P, Nieuwenhuijsen MJ, Brunekreef B, et al. 2013. Air pollution and lung cancer incidence in 17 European cohorts: prospective analyses from the European Study of Cohorts for Air Pollution Effects ESCAPE. Lancet Oncol. 14(9):813–822.
- Raaschou-Nielsen O, Andersen ZJ, Hvidberg M, Jensen SS, Ketzel M, Sørensen M, Hansen J, Loft S, Overvad K, Tjønneland A, et al. 2011. Air pollution from traffic and cancer incidence: a Danish cohort study. Environ Health. 10(1):67.
- Raaschou-Nielsen O, Bak H, Sorensen M, Jensen SS, Ketzel M, Hvidberg M, Schnohr P, Tjonneland A, Overvad K, Loft S, et al. 2010. Air pollution from traffic and risk for lung cancer in three Danish cohorts. Cancer Epidemiol Biomarkers Prev. 19(5):1284–1291.
- Raaschou-Nielsen O, Beelen R, Wang M, Hoek G, Andersen ZJ, Hoffmann B, Stafoggia M, Samoli E, Weinmayr G, Dimakopoulou K, et al. 2016. Particulate matter air pollution components and risk for lung cancer. Environ Int. 87:66–73.
- Risch HA, Howe GR, Jain M, Burch JD, Holowaty EJ, Miller AB. 1993. Are female smokers at higher risk for lung cancer than male smokers? A case-control analysis by histologic type. Am J Epidemiol. 138(5):281–293.
- Rodriguez C, Patel AV, Calle EE, Jacobs EJ, Chao A, Thun MJ. 2001. Body mass index, height, and prostate cancer mortality in two large cohorts of adult men in the United States. Cancer Epidemiol Biomarkers Prev. 10(4):345–353.
- Schulz M, Gerber A, Groneberg DA. 2016. Are filter-tipped cigarettes still less harmful than non-filter cigarettes? A laser spectrometric particulate matter analysis from the nonsmokers point of view. Int J Environ Res Public Health. 13:429.
- Sethi TK, El-Ghamry MN, Kloecker GH. 2012. Radon and lung cancer. Clin Adv Hematol Oncol. 10(3):157–164.
- Shen H, Huang Y, Wang R, Zhu D, Li W, Shen G, Wang B, Zhang Y, Chen Y, Lu Y, et al. 2013. Global atmospheric emissions of polycyclic aromatic hydrocarbons from 1960 to 2008 and future predictions. Environ Sci Technol. 47(12):6415–6424.
- Shen H, Tao S, Liu J, Huang Y, Chen H, Li W, Zhang Y, Chen Y, Su S, Lin N, et al. 2015. Global lung cancer risk from PAH exposure highly depends on emission sources and individual susceptibility. Sci Rep. 4(1):6561.
- Shen H, Tao S, Wang R, Wang B, Shen G, Li W, Su S, Huang Y, Wang X, Liu W, et al. 2011. Global time trends in PAH emissions from motor vehicles. Atmos Environ (1994). 45(12).
- Singh A, Zeig-Owens R, Moir W, Hall CB, Schwartz T, Vossbrinck M, Jaber N, Webber MP, Kelly KJ, Ortiz V, et al. 2018. Estimation of future cancer burden among rescue and recovery workers exposed to the World Trade Center Disaster. JAMA Oncol. 4(6):828–831.
- Sorahan T, Hamilton L, van Tongeren M, Gardiner K, Harrington JM. 2001. A cohort mortality study of U.K. carbon black workers, 1951-1996. Am J Ind Med. 39(2):158–170.
- Speizer FE. 1983. Assessment of the epidemiological data relating lung cancer to air pollution. Environ Health Perspect. 47:33–42.
- Speizer FE, Colditz GA, Hunter DJ, Rosner B, Hennekens C. 1999. Prospective study of smoking, antioxidant intake, and lung cancer in middle-aged women (USA). Cancer Causes Control. 10(5):475–482.
- Sterling TD, Pollack SV. 1972. The incidence of lung cancer in the U.S. since 1955 in relation to the etiology of the disease. Am J Public Health. 62(2):152–158.
- Stocks P. 1959. Cancer and bronchitis mortality in relation to atmospheric deposit and smoke. Br Med J. 1:74–79.
- Stocks P. 1952 Endemiology of cancer of the lung in England and Wales. Br J Cancer. 6:99–111.
- Stocks P. 1960. On the relations between atmospheric pollution in urban and rural localities and mortality from cancer, bronchitis and pneumonia, with particular reference to 3:4 benzopyrene, beryllium, molybdenum, vanadium and arsenic. Br J Cancer. 14(3):397–418.
- Stocks P. 1966. Recent epidemiological studies of lung cancer mortality cigarette smoking and air pollution, with discussion of a new hypothesis of causation. Br J Cancer. 20(4):595–623.
- Stocks P, Campbell JM. 1955. Lung cancer death rates among nonsmokers and pipe and cigarette smokers; an evaluation in relation to air pollution by benzpyrene and other substances. Br Med J. 2(4945):923–929.
- Suh HH, Zanobetti A. 2010. Exposure error masks the relationship between traffic-related air pollution and heart rate variability. J Occup Environ Med. 52(7):685–692.
- Taylor R, Najafi F, Dobson A. 2007. Meta-analysis of studies of passive smoking and lung cancer: effects of study type and continent. Int J Epidemiol. 36(5):1048–1059.
- Temple NJ, Burkitt DP. 1991. The war on cancer–failure of therapy and research: discussion paper. J R Soc Med. 84(2):95–98.
- Thun MJ, Day-Lally CA, Myers DG, Calle EE, Flanders WD, Zhu BP, Namboodiri MM, Heath CW Jr. 1996. Trends in cigarette smoking and mortality from cigarette use in Cancer Prevention Studies I (1959 through 1965) and II (1982 through 1988). Cigarette Smoking Behavior in the United States. Smoking and Tobacco Control Monograph No. 8. United States Department of Agriculture.
- Thun MJ, Hannan LM, Adams-Campbell LL, Boffetta P, Buring JE, Feskanich D, Flanders WD, Jee SH, Katanoda K, Kolonel LN et al. 2008. Lung cancer occurrence in never-smokers: an analysis of 13 cohorts and 22 cancer registry studies. PLoS Med.;5:e185.
- Thun MJ, Heath CW Jr. 1997. Changes in mortality from smoking in two American Cancer prospective studies since 1959. Prev Med. 26:422–426.
- Thun MJ, Henley SJ, Burns D, Jemal A, Shanks TG, Calle EE. 2006. Lung cancer death rates in lifelong nonsmokers. J Natl Cancer Inst. 98(10):691–699.
- To T, Feldman L, Simatovic J, Gershon AS, Dell S, Su J, Foty R, Licskai C. 2015. Health risk of air pollution on people living with major chronic diseases: a Canadian population-based study. BMJ Open. 5(9):e009075.
- To T, Zhu J, Villeneuve PJ, Simatovic J, Feldman L, Gao C, Williams D, Chen H, Weichenthal S, Wall C, et al. 2015. Chronic disease prevalence in women and air pollution – a 30-year longitudinal cohort study. Environ Int. 80:26–32.
- Tobacco Tax Council. 2014. The Tax Burden on Tobacco, Historical Compilation. Vol 49.
- Tomczak A, Miller AB, Weichenthal SA, To T, Wall C, van Donkelaar A, Martin RV, Crouse DL, Villeneuve PJ. 2016. Long-term exposure to fine particulate matter air pollution and the risk of lung cancer among participants of the Canadian National Breast Screening Study. Int J Cancer. 139(9):1958–1966.
- Trichopoulos D, Mollo F, Tomatis L, Agapitos E, Delsedime L, Zavitsanos X, Kalandidi A, Katsouyanni K, Riboli E, Saracci R. 1992. Active and passive smoking and pathological indicators of lung cancer risk in an autopsy study. JAMA. 268(13):1697–1701.
- Turner MC, Krewski D, Chen Y, Pope CA, Gapstur S, Thun MJ. 2011. Radon and lung cancer in the American Cancer Society cohort. Cancer Epidemiol Biomarkers Prev. 20(3):438–448.
- Turner MC, Krewski D, Pope CA, Chen Y, Gapstur SM, Thun MJ. 2011. Long-term ambient fine particulate matter air pollution and lung cancer in a large cohort of never-smokers. Am J Respir Crit Care Med. 184(12):1374–1381.
- US Department of Health and Human Services. 1986. The Health Consequences of Involuntary Smoking. A Report of the Surgeon General.
- [US HEW] US Department of Health Education and Welfare. 1958. Public Health Service. Air Pollution Measurements of the National Air Sampling Network, Analysis of Suspended Particulate Samples Collected 1953–1957.
- Venitt S. 1996. Mechanisms of spontaneous human cancers. Environ Health Perspect. 104(3):633–637.
- Victorin K, Valentin J, Wahlberg K. 1993. Risk comparisons between limit values for ionizing radiation, PAH, and benzene in Sweden. Regul Toxicol Pharmacol. 18(3):381–391.
- Villeneuve PJ, Jerrett M, Brenner D, Su J, Chen H, McLaughlin JR. 2014. A case-control study of long-term exposure to ambient volatile organic compounds and lung cancer in Toronto, Ontario, Canada. Am J Epidemiol. 179(4):443–451.
- Villeneuve PJ, Mao Y. 1994. Lifetime probability of developing lung cancer, by smoking status, Canada. Can J Public Health. 85(6):385–388.
- Villeneuve PJ, Parent MÉ, Harris SA, Johnson KC. 2012. Canadian Cancer Registries Epidemiology Research Group. Occupational exposure to asbestos and lung cancer in men: evidence from a population-based case-control study in eight Canadian provinces. BMC Cancer. 12(1):595.
- Villeneuve PJ, Parent MÉ, Sahni V, Johnson KC. 2011. Canadian Cancer Registries Epidemiology Research Group. Occupational exposure to diesel and gasoline emissions and lung cancer in Canadian men. Environ Res. 111(5):727–735.
- Vineis P, Hoek G, Krzyzanowski M, Vigna-Taglianti F, Veglia F, Airoldi L, Autrup H, Dunning A, Garte S, Hainaut P, et al. 2006. Air pollution and risk of lung cancer in a prospective study in Europe. Int J Cancer. 119(1):169–174.
- Vineis P, Hoek G, Krzyzanowski M, Vigna-Taglianti F, Veglia F, Airoldi L, Overvad K, Raaschou-Nielsen O, Clavel-Chapelon F, Linseisen J, et al. 2007. Lung cancers attributable to environmental tobacco smoke and air pollution in nonsmokers in different European countries: a prospective study. Environ Health. 6(1):7.
- Walley SC, Chime C, Powell J, Walker K, Burczyk-Brown J, Funkhouser E. 2015. A brief inpatient intervention using a short video to promote reduction of child tobacco smoke exposure. Hosp Pediatr. 5(10):534–541.
- Weichenthal S, Crouse DL, Pinault L, Godri-Pollitt K, Lavigne E, Evans G, van Donkelaar A, Martin RV, Burnett RT. 2016. Oxidative burden of fine particulate air pollution and risk of cause-specific mortality in the Canadian Census Health and Environment Cohort (CanCHEC). Environ Res. 146:92–99.
- Weiss W. 1978. Lung cancer mortality and urban air pollution. Am J Public Health. 68(8):773–775.
- Whitrow MJ, Smith BJ, Pilotto LS, Pisaniello D, Nitschke M. 2003. Environmental exposure to carcinogens causing lung cancer: epidemiological evidence from the medical literature. Respirology. 8(4):513–521.
- Wilcox HB, Al-Zoughool M, Garner MJ, Jiang H, Klotz JB, Krewski D, Nicholson WJ, Schoenberg JB, Villeneuve PJ, Zielinski JM, et al. 2007. Case-control study of radon and lung cancer in New Jersey. Radiat Prot Dosimetry. 128(2):169–179.
- Wingo PA, Cardinez CJ, Landis SH, Greenlee RT, Ries LAG, Anderson RN, Thun MJ. 2003. 1930-1998. Cancer. 97(S12):3133–3275.
- Wollf GT, Klimisch RL. 1982. Particulate carbon, atmospheric life cycle. New York: Plenum Press.
- Xu ZY, Brown L, Pan GW, Li G, Feng YP, Guan DX, Liu TF, Liu LM, Chao RM, Sheng JH, et al. 1996. Lifestyle, environmental pollution and lung cancer in cities of Liaoning in northeastern China. Lung Cancer. 14 Suppl 1(1):S149–S60.
- Yang D, Liu Y, Bai C, Wang X, Powell CA. 2020. Epidemiology of lung cancer and lung cancer screening programs in China and the United States. Cancer Lett. 468:82–87.
- Yorifuji T, Kashima S. 2013. Air pollution: another cause of lung cancer. Lancet Oncol. 14(9):788–789.
- Zhang J, Li J, Wang P, Chen G, Mendola P, Sherman S, Ying Q. 2017. Estimating population exposure to ambient polycyclic aromatic hydrocarbon in the United States – part I: model development and evaluation. Environ Int. 99:263–274.
- Zhang J, Wang P, Li J, Mendola P, Sherman S, Ying Q. 2016. Estimating population exposure to ambient polycyclic aromatic hydrocarbon in the United States – part II: source apportionment and cancer risk assessment. Environ Int. 97:163–170.
Appendix A. Time-lines of lung cancer mortality rates, smoking, and air pollution in the United States
Appendix B. Summary of studies of lung cancer and air pollution.
Table B1. Lung cancer papers by smoking (Mills Citation1946; Doll and Peto Citation1978; Thun et al. Citation2006).
Table B2. Multi-cause papers (Katanoda et al. Citation2011; To, Feldman, et al. Citation2015).
Table B3. Papers lacking direct smoking controls (Hart et al. Citation2006).
Table B4. Review papers (Weiss Citation1978; Davey Smith Citation2003; Shen et al. Citation2011; Couraud et al. Citation2012; Demetriou et al. Citation2012; Costa et al. Citation2014; Hoek and Raaschou-Nielsen Citation2014; Loomis et al. Citation2014).
Appendix C. More on benzo(alpha)pyrene (B[a]P)
Benzo(alpha)pyrene is a common thread through our discussion of air pollution and lung cancer beginning with Stocks and Campbell (Citation1955) through to Zhang et al. (Citation2017) and is the only airborne carcinogen to do so. B(a)P has also been referred to as “3,4 benzpyrene”. It is produced from incomplete combustion, notably from biomass fuels, coke ovens, and diesel engines, and is one of many polycyclic aromatic hydrocarbon (PAH) compounds that have also been denoted as polycyclic organic matter (POMs). POM was described in detail by the Agency for Toxic Substances and Disease Registry (ATSDR) in 1995 who noted that B(a)P was “one of the more commonly monitored PAHs”. At that time B(a)P was measured at 0.6 ng/m3 in urban areas and 0.3 ng/m3 in rural areas; current ambient levels are likely lower. Shen et al. (Citation2013) estimated global PAH emission trends, showing developed countries peaking around 1975 and decreasing at ∼3.3%/y thereafter. Jung et al. (Citation2014) discussed PAH trends in New York City.
Although B(a)P has long been considered a carcinogenic component of tobacco smoke, it was essentially neglected in a 1979 conference Banbury Report on “A Safe Cigarette” that focused on cigarette “tar” (Cold Spring Harbor Laboratory Citation1979). B(a)P is emitted as a gas and adsorbs onto fine particles that may travel long distances and can be deposited and retained deep in the lung.
Perera (Citation1981) reviewed chemical properties, metabolic processes, sources, and ambient levels of B(a)P. At that time, the main stationary sources were refuse burning (47%), residential coal furnaces (33%), and coke production (16%). Coal-fired steam power plants contributed <1% and mobile source contributions were estimated at 2%. However, Perera limited her discussion of B(a)P emission controls to coal-fired power plants and she quoted an EPA official as stating that no ambient standards were being considered for B(a)P as of 1981. Perera’s mean ambient values for urban areas decreased from 6.6 ng/m3 in 1958 to 0.6 ng/m3 in 1972. New York City mean B(a)P was 3 ng/m3 in 1970. By comparison, B(a)P in London in 1968 was about 50 ng/m3 and European mean values are now around 0.2 ng/m3. The logarithmic rate of decrease was about 6%/y.
Dose-response functions for B(a)P have been based on occupational exposures. Pike and Henderson (Citation1975) proposed a rate of 0.4 deaths/100,000 population per ng/m3 B(a)P. The U.S. baseline lung cancer mortality rate was about 55 deaths/100,000 in 1960 and B(a)P was about 19 ng/m3 20 y earlier; the RR would have been about 1.15. In 2010, the baseline rate was about 35 deaths per 100,000 and the 1990 B(a)P level was about 0.7 ng/m3, for an RR of 1.008. Brucker et al. (Citation2013) showed higher PAH exposures for taxi drivers.
Zhang et al. (Citation2016, Citation2017) used dispersion modeling to estimate U.S. PAH concentrations for 2011. They used the sum of 8 nonvolatile PAH compounds, including B(a)P, and predicted a maximum lifetime risk of all cancers of 1.1 10−4. Since the baseline lifetime cancer risk is about 20%, the RR would be 1.0006. The largest LCM risks are seen east of the Mississippi River, especially in Appalachia. Zhang et al. did not present ambient levels nor did they account for latency. The largest contributors to B(a)P were “other” industrial point sources (54%), non-road engines (18%), and motor vehicles (10%). Electricity generation contributed 0.2%. Shen et al. (Citation2015) estimated global lung cancer risks from PAHs at about 3.1 deaths per 100,000. The major sources were biomass and residential fuels. Wollf and Klimisch (Citation1982) also have useful data on B(a)P.
We know of two mortality studies that considered POMs. Lipfert (Citation1980) used the NASN B(a)P data (mean = 3.5 ng/m3) to predict mortality in 136 U.S. cities. For lung cancer (mean = 42 deaths/100,000), the B(a)P effect was 0.34 deaths/100,000, but was not statistically significant. POMs based on county emissions were considered in the Veterans Cohort Study (Lipfert et al. Citation2009) with respect to all-cause mortality, with a significant RR of 1.0005 per ng/m3. If all of these deaths were in fact due to lung cancer the RR would increase to about 1.006 or about 0.3 deaths per 100,000 population.
All told, B(a)P does not appear to pose significant risks to current U.S. LCM rates.
Appendix D. Bibliography of Additional Air Quality Sources
D1. Ambient air quality
Faoro RB, Manning JA. 1981. Trends in benzo(a)pyrene, 1966-77. J Air Pollution Control Agency, 62–64.
Haagen-Smit AJ. 1970. A lesson from the smog capital of the world. Proc Nat Acad Sci U S A. 67:887–897.
Ostro B. 1984. A search for a threshold in the relationship of air pollution to mortality: a reanalysis of data on London winters. Env Health Perspect 58:397–399.
Power AL, Worsley AT. 2009. Using urban man-made ponds to reconstruct a 150-year history of air pollution in northwest England. Environ Geochem Health. 31:327–338.
Quality of Urban Air Review Group. 1996. Airborne particulate matter in the United Kingdom. Department of the Environment.
Sasco AJ, Secretan MB, Straif K. 2004. Tobacco smoking and cancer: a brief review of recent epidemiological evidence. Lung Cancer. 45 :S3–S9.
Sawicki E, Hauser TR, Elbert WC, Fox FT, Meeker JE. 1962. Polynuclear aromatic hydrocarbon composition of the atmosphere in some large American cities. Am Ind Hyg Assoc J. 23:137–144.
US Department of Health, Education and Welfare (US HEW), Public Health Service. 1958. Air pollution measurements of the national air sampling network, analysis of suspended particulate samples collected 1953–1957.
U.S. Environmental Protection Agency. 1974. Special Report: Trends in concentrations of benzene-soluble suspended particulate fraction and benzo(a)pyrene. EPA-450/2-74-022.
US HEW, Public Health Service. 1962. Air pollution measurements of the national air sampling network, analysis of suspended particulates, 1957–1961.
Wolff GT, Klimisch RL. 1982. Particulate carbon, atmospheric life cycle. New York: Plenum Press; p. 303.
D2. Radon
Bräuner EV, Andersen CE, Sørensen M, Andersen ZJ, Gravesen P. 2012. Residential radon and lung cancer incidence in a Danish cohort. Environ Res. 118:130–136.
Bukowski JA, Wartenberg D. 1997.An alternative approach for investigating the carcinogenicity of indoor air pollution: pets as sentinels of environmental cancer risk. Environ Health Perspect. 105:1312–1319.
Darby S, Hill D, Auvinen A, Barros-Dios JM, Baysson H. 2005. Radon in homes and risk of lung cancer: collaborative analysis of individual data from 13 European case-control studies. BMJ. 330:223.
Darby S, Hill D, Deo H, Auvinen A, Barros-Dios JM. 2006. Residential radon and lung cancer–detailed results of a collaborative analysis of individual data on 7148 persons with lung cancer and 14,208 persons without lung cancer from 13 epidemiologic studies in Europe. Scand J Work Environ Health. 32:1–83. Erratum in: Scand J Work Environ Health. 33(1):80.
Kreuzer M, Heinrich J, Kreienbrock L, Rosario AS, Gerken M, Wichmann HE. 2002. Risk factors for lung cancer among nonsmoking women. Int J Cancer. 100:706–713.
Krewski D, Lubin JH, Zielinski JM, Alavanja M, Catalan VS. 2005. Residential radon and risk of lung cancer: a combined analysis of 7 North American case-control studies. Epidemiology. 16:137–145.
Lagarde F, Pershagen G. 1999. Parallel analyses of individual and ecologic data on residential radon, cofactors, and lung cancer in Sweden. Am J Epidemiol. 149:268–274.
Marcinowski F, Lucas RM, Yeager WM. 1994. National and regional distributions of airborne radon concentrations in U.S. homes. Health Phys. 66:699–706.
Turner MC, Krewski D, Chen Y, Pope CA 3rd, Gapstur S, Thun MJ. 2011. Radon and lung cancer in the American Cancer Society cohort. Cancer Epidemiol Biomarkers Prev. 20:438–448.
Victorin K, Valentin J, Wahlberg K. 1993. Risk comparisons between limit values for ionizing radiation, PAH, and benzene in Sweden. Regul Toxicol Pharmacol. 18:381–391.
Villeneuve PJ, Jerrett M, Brenner D, Su J, Chen H, McLaughlin JR. 2014. A case-control study of long-term exposure to ambient volatile organic compoundsand lung cancer in Toronto, Ontario, Canada. Am J Epidemiol. 179:443–451.
Wilcox HB, Al-Zoughool M, Garner MJ, Jiang H. 2008. Case-control study of radon and lung cancer in New Jersey. Radiat Prot Dosimetry. 128:169–179.
D3. Diesel engine exhaust
Boffetta P. 2012. A review of cancer risk in the trucking industry, with emphasis on exposure to diesel exhaust. G Ital Med Lav Ergon. 34:365–370.
Gamble JF, Nicolich MJ, Boffetta P. 2012. Lung cancer and diesel exhaust: an updated review. 42:549–598.
Moolgavkar SH, Chang ET, Luebeck G. 2015. Diesel engine exhaust and lung cancer mortality: time-related factors in exposure and risk. Risk Anal. 35:663–675.
Olsson AC, Gustavsson P, Kromhout H. 2011. Exposure to diesel motor exhaust and lung cancer risk in a pooled analysis from case-control studies in Europe and Canada. Am J Respir Crit Care Med. 183:941–948.
Parent ME, Rousseau MC, Boffetta P, Cohen A, Siemiatycki J. 2007. Exposure to diesel and gasoline engine emissions and the risk of lung cancer. Am J Epidemiol. 165:53–62.
D4. Indoor air quality
Schulz M, Gerber A, Groneberg DA. 2016. Are filter-tipped cigarettes still less harmful than non-filtetr cigarettes? A laser spectrometric particulate matter analysis from the nonsmokers point of view. Int J Environ Res Public Health. 13:429.
Simoni M, Carrozzi L, Baldacci S, Scognamiglio A, Di Pede F. 2002.The Po River Delta (north Italy) indoor epidemiological study: effects of pollutant exposure on acute respiratory symptoms and respiratory function in adults. Arch Environ Health. 57:130–136.
Simoni M, Scognamiglio A, Carrozzi L, Baldacci S, Angino A. 2004. Indoor exposures and acute respiratory effects in two general population samples from a rural and an urban area in Italy. J Expo Anal Environ Epidemiol. 14 :S144–S152.
Sureda X, Fernández E, López MJ, Nebot M. 2013. Secondhand tobacco smoke exposure in open and semi-open settings: a systematic review. Environ Health Perspect. 121:766–773.