
Abstract
We utilized a practical, transparent approach for systematically reviewing a chemical-specific evidence base. This approach was used for a case study of ozone inhalation exposure and adverse metabolic effects (overweight/obesity, Type 1 diabetes [T1D], Type 2 diabetes [T2D], and metabolic syndrome). We followed the basic principles of systematic review. Studies were defined as “Suitable” or “Supplemental.” The evidence for Suitable studies was characterized as strong or weak. An overall causality judgment for each outcome was then determined as either causal, suggestive, insufficient, or not likely. Fifteen epidemiologic and 33 toxicologic studies were Suitable for evidence synthesis. The strength of the human evidence was weak for all outcomes. The toxicologic evidence was weak for all outcomes except two: body weight, and impaired glucose tolerance/homeostasis and fasting/baseline hyperglycemia. The combined epidemiologic and toxicologic evidence was categorized as weak for overweight/obesity, T1D, and metabolic syndrome,. The association between ozone exposure and T2D was determined to be insufficient or suggestive. The streamlined approach described in this paper is transparent and focuses on key elements. As systematic review guidelines are becoming increasingly complex, it is worth exploring the extent to which related health outcomes should be combined or kept distinct, and the merits of focusing on critical elements to select studies suitable for causal inference. We recommend that systematic review results be used to target discussions around specific research needs for advancing causal determinations.
1. Introduction
The Clean Air Act requires the US Environmental Protection Agency (EPA; Agency) to set National Ambient Air Quality Standards (NAAQS) for six air pollutants, including ozone. The standards must be reviewed every five years to ensure that they protect human health and the environment with a sufficient margin of safety. As part of the review process, EPA assesses causal relationships between air pollutant exposures and human health effects using a framework developed specifically for this purpose. The completed reviews are referred to as Integrated Science Assessments (ISAs) (https://www.epa.gov/isa/learn-about-isas).
In the 2013 ISA for ozone (US EPA 2013), EPA conducted a review of the scientific literature on ozone and various health outcomes. EPA did not evaluate metabolic outcomes as an independent endpoint, but rather considered metabolic effects in the context of a mode of action (MOA) for cardiovascular effects (US EPA 2013). In contrast, in the most recent NAAQS review cycle for ozone, EPA (Citation2020a) evaluated metabolic effects as an independent endpoint. The 2020 ozone ISA concluded that there is a likely causal relationship between short-term ozone exposure (e.g. hourly, daily, weekly) and metabolic outcomes and a suggestive, but not sufficient-to-infer, causal relationship for long-term ozone exposure (e.g. months or years) and metabolic outcomes. These conclusions were based on assessments of overall metabolic effects rather than on individual specific outcomes (e.g. diabetes, obesity, metabolic syndrome). Other than the EPA ISA, we are aware of only one other review that explored associations between ozone exposure and metabolic effects (Shore Citation2019), but this study was a narrative review with a primary focus on a few toxicologic studies. Additional research on ozone exposure and metabolic outcomes has been published since the time of the EPA assessment and the Shore review and it is timely to consider the enhanced body of literature in the context of a revised review.
While the systematic review framework used by EPA in the ISA offers one method for assessing causality for criteria air pollutants and health effects, new approaches for systematic review have been developed. These concepts are worth exploring in the context of ozone and metabolic outcomes as well as for other chemical/outcome pairs. For example, Goodman et al. (Citation2020) proposed modifications to the EPA framework, including a more comprehensive set of criteria for assessing study quality, detailed methods for integrating evidence that consider individual study quality and relevance, and methods for assessing the coherence of results across studies both within and across scientific disciplines. Overall, within and outside of the Agency, processes for conducting systematic reviews are numerous, varied, and evolving (e.g. Guyatt et al. Citation2008; Moher et al. Citation2009; Money et al. Citation2013; US EPA Citation2018, Citation2020b; Morgan et al. Citation2019; NTP Citation2019; Mengist et al. Citation2020; WHO Citation2020).
The approaches differ in terms of the type of evaluative elements as well as in style (e.g. narrative, scoring systems, heat maps). In addition, the number of elements to evaluate vary widely from concise to expansive (Wells et al. Citation2013; Goodman et al. Citation2014; US EPA Citation2018; Morgan et al. Citation2019; Goodman et al. Citation2020). In fact, there is no single established “best” approach for conducting systematic reviews within environmental disciplines.
There is, however, general agreement that important features of any systematic review should include a comprehensive literature search and a structured, transparent evaluation of individual study quality (Shea et al. Citation2007, Citation2017). These processes are resource-intensive; concerns that the systematic review process has become unduly onerous have been expressed (Wallace et al. Citation2013; Westgate and Lindenmayer Citation2017; Collins et al. Citation2019; National Academies of Sciences Engineering and Medicine Citation2021). An efficient approach would be especially useful in situations where resources are limited or there are recurring regulatory deadlines. Savitz et al. (Citation2019) suggested that assessments should be focused on identifying the sources of bias most likely to be influential, categorizing each study according to how well it addressed each potential bias, and determining whether results differ across studies in relation to susceptibility to each examined source of bias. This reduces what the authors refer to as “procedural repeatability” and could in fact render the review more transparent and reproducible. While there is no “correct” list of review elements applicable to all exposures and outcomes, inclusion of a large, all-encompassing set of review elements is not necessarily the best approach to systematic review, especially if the elements are not used to support assessments of causality. In this review, we use a practical, transparent approach for systematically reviewing a chemical-specific evidence base.
The goal of this systematic review is to address the question: does ozone inhalation exposure cause adverse metabolic effects (overweight/obesity, Type 1 diabetes [T1D], Type 2 diabetes [T2D], and metabolic syndrome) in humans?
2. Methods
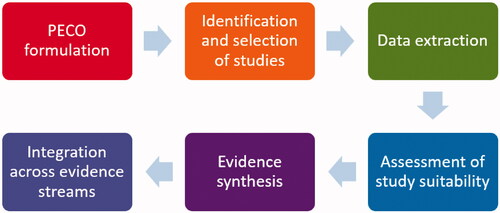
In this review, we used a six-step process () based on the basic features and principles of systematic reviews (Shea et al. Citation2017; NTP Citation2019; US EPA Citation2020b). Each step is discussed in detail below.
Figure 1. Steps in this review of ozone and metabolic outcomes.
2.1. PECO formulation
An essential feature of a systematic review is the identification and grouping of studies according to a clearly stated research question (Rooney et al. Citation2014). This approach to grouping studies enables a structured assessment of inter-study consistency (LaKind et al. Citation2017). We therefore developed a distinct PECO question for each risk factor/metabolic outcome pair, rather than combining outcomes. We organized our framework to have different PECO questions for human studies (apical outcomes) and for in vivo/in vitro animal studies (related non-apical metabolic outcomes) (). Further, there is a distinct PECO question for each apical outcome: overweight/obesity, T1D, T2D, and metabolic syndrome. Metabolic syndrome is considered to be a constellation of interrelated risk factors for cardiovascular disease and T2D (Tune et al. Citation2017). A recent consensus definition for metabolic syndrome requires at least three of the five following risk factors to be present: elevated waist circumference, elevated triglycerides (TG), reduced high density lipoprotein cholesterol (HDL), elevated blood pressure, and/or elevated fasting glucose (e.g. Alberti et al. Citation2009).
Table 1. PECO formulation addressing: does ozone inhalation exposure cause overweight/obesity, T1D, T2D, or metabolic syndrome?
2.2. Identification and selection of studies
PubMed and Web of Science were used to conduct literature searches for human, animal, and in vitro studies. In addition, we examined the bibliographies of retrieved articles to identify publications not previously captured by the electronic searches. We also searched the bibliography of the 2020 Ozone ISA (US EPA Citation2020a) for any additional publications that may not have been identified by previous searches.
Publications identified by the literature searches were analyzed for duplicates and then screened by title and/or abstract according to the inclusion/exclusion criteria for either human or in vivo/in vitro studies (see below). The remaining publications then underwent a full-text screen to identify the studies for final inclusion. All screenings were conducted independently by at least two authors; differences in screening results were resolved by consensus. PRISMA diagrams were used to track the literature search and inclusion/exclusion counts. Complete MeSH terms and lists of the citations considered for inclusion along with reasons for exclusion are provided in the Supplementary Material.
2.2.1. Human studies
We identified publications evaluating the metabolic health effects shown in associated with short- and long-term ozone exposures in humans. We further conducted a search for literature from January 2018 to May 2020 to capture recent articles that used “air pollution” along with “ozone” as a key word (Supplementary Material).
PECO questions related to human studies included overweight/obesity, T1D, T2D, and metabolic syndrome. Research on mortality associated with these diseases was excluded as mortality may be due to other related factors, such as cardiovascular disease. In addition, mortality data have known reliability issues (McGivern et al. Citation2017; Falci et al. Citation2018). For metabolic syndrome, individual components of the definition, such as blood pressure, are often used as diagnostic criteria for other apical outcomes; a diagnosis of metabolic syndrome requires at least three of the five elements noted above and therefore we only included studies that incorporated at least three of these diagnostic criteria.
The inclusion criteria were:
The study was conducted with humans (epidemiology or experimental study).
Exposure was determined by measurements or models of ozone concentrations.
Comparison groups were included in the study (e.g. controls in experimental study, lower ozone levels in comparator population).
Outcomes included diagnoses of T1D, T2D, and/or obesity or at least three of five metabolic syndrome elements (elevated waist circumference, elevated triglycerides (TG), reduced high density lipoprotein cholesterol (HDL), elevated blood pressure, and/or elevated fasting glucose).
The publication appeared in English prior to 25 May 2020 (end date of the literature search).
Publications were excluded for the following reasons:
The design was a case study, with no controls.
The publication was a review, editorial, commentary, or guideline, with no de novo data.
The study was only in vitro (e.g. cells and tissues).
Ozone was not used as the explanatory variable.
The outcome was a biochemical change only (e.g. fatty acid and amino acid metabolism, oxidative stress, C-reactive protein), with the change not used to diagnose disease.
Gestational diabetes or mortality of any outcome.
Studies that looked at single factors for metabolic syndrome (e.g. blood pressure) rather than at least three of the five factors that constitute the metabolic syndrome definition.
2.2.2. In vivo/in vitro animal studies
We identified toxicologic studies that investigated ozone exposure and the metabolic effects shown in . MeSH terms for these searches are provided in the Supplementary material. In addition, to cast the search more broadly, we conducted searches of the literature from January 2018 to 24 June 2020 using “air pollution” and “ozone” as key words.
The inclusion criteria were:
The study was conducted using a standard mammalian animal model or an in vitro mammalian cell model of ozone exposure.
Exposure to ozone in animals was through inhalation or, for in vitro studies, through an inhalation-mimicking (air-liquid interface/internal ozone dose) system.
Animal models were standard (wild-type) strains.
The study outcomes included metabolic effects, such as those related to glucose or insulin homeostasis (glucose intolerance, insulin resistance, fasting hyperglycemia, changes to hepatic gluconeogenesis, serum/plasma hormone analytes), dyslipidemia (changes in plasma cholesterol, TG, high-density lipoprotein [HDL], or low-density lipoprotein [LDL]), and body weight (adiposity, elevated body weight, obesity, body mass index [BMI], changes in eating patterns, thyroid effects/changes in thyroid hormones/body temperature).
The study design utilized a control (air-exposed) animal group or in vitro control exposure experimental paradigm.
The publication appeared in English prior to 24 June 2020 (the end date of the literature search).
Publications were excluded for the following reasons:
The publication was an abstract only, review, editorial, commentary, or guideline.
The study was conducted in humans, a non-mammalian species (e.g. birds), or plants.
The study used only susceptible animal models (e.g. obese mice) and/or special conditions (e.g. running wheel and special diet).
The study included ozone data but only as part of an exposure mixture (e.g. PM2.5 plus ozone).
The study outcomes of interest were not related to the metabolic effects or PECO questions.
2.3. Data extraction
The following data were extracted from each epidemiology publication: cohort name or study population, age group, country, sample size, exposure characterization method, exposure duration (short-term [ST], <30 days exposure; long-term [LT], 1 month and longer), exposure level, outcome(s), funding source, model covariates, and effect estimates. For publications that reported results for both a primary model and stratified models, results from the primary model were extracted. For approaches addressing covariate interactions, we included the result from the main model but noted whether any of the results from the interaction models differed in terms of statistical significance or direction.
The following data were extracted from each toxicology publication: animal model, species/strain, age, sample size, exposure method, exposure level, exposure duration and frequency, ozone generation and monitoring methodology, control exposure, PECO outcomes measured, statistical methods applied, funding source, and outcome results. The outcome results of suitable studies were tabulated by denoting directionality (compared with controls) by using up or down arrows, with underlining denoting a statistically identified change.
2.4. Assessment of study suitability for evidence synthesis
There are many published examples of methods for conducting a quality review of research (Klimisch et al. Citation1997; Schneider et al. Citation2009; Woodruff and Sutton Citation2014; NTP Citation2019). Some methods include numerous evaluative criteria. Comprehensive inclusion of numerous criteria does not necessarily increase the overall confidence in the review, especially when the quality results are not carried forward into evidence synthesis. Furthermore, quality elements that do not have clear cut definitions, but rather lean heavily on professional judgment, may reduce the review’s transparency and reproducibility. For these reasons, rather than enumerate quality elements this review included a focused set of elements that are generally considered to be essential to study suitability for evidence synthesis. Further, only those studies meeting the element(s) were included in evidence synthesis and integration.
Thus, based on the results of the assessment, studies were judged as either being “Suitable” for the subsequent step of evidence synthesis (examining the body of epidemiology literature or toxicology/mechanistic literature for a specific PECO question) or “Supplemental.” Supplemental studies were not excluded entirely. Results from these studies were examined to ascertain the concordance of results with Suitable studies but were not formally carried forward to the evidence synthesis step. This suitability review was conducted by at least two authors for each publication.
For the epidemiologic studies, evidence of exposure preceding the effect (i.e. temporality) was identified as the single criterion for use in determining whether a study was Suitable for evidence synthesis. Temporality is considered an indisputable property of a study when considering a causal link (Potischman and Weed Citation1999; Kundi Citation2007; Adami et al. Citation2011; Goodman et al. Citation2014), and can also be consistently and transparently applied across studies. Studies with designs that could not ensure that the outcome ascertainment followed the exposure (e.g. case-control studies with prevalent cases; cross-sectional studies) were categorized as Supplemental. Cohort studies that did not collect baseline information as part of the longitudinal design were also categorized as Supplemental.
For the toxicologic in vivo/in vitro animal studies, five elements were used to distinguish Suitable from Supplemental studies: (i) The study used standard (wild-type) animal strain(s); provided a normal diet; animals were not bred for any specific susceptibility or subjected to any special conditions; (ii) Exposure groups consisted of at least five animals; if not, an explanation or power calculation was required; (iii) The ozone generation and monitoring equipment were fully described; (iv) The study included room air/filtered air-exposed concurrent controls; and (v) The study used standard methods considered reliable and, if statistical results were reported, the associated methods were described. Studies that met all five criteria were considered Suitable for the evidence synthesis step. Studies for which one or more criterion was not met were categorized as “Supplemental.” Studies were excluded entirely (i.e. not considered as Supplemental information) if they were determined to have such critical deficiencies in either study details or design that an accurate review of their findings could not be achieved (this is described in greater detail in the Results section).
2.5. Evidence synthesis/confidence characterization
The Suitable studies formed the basis for characterizing confidence (“strong” vs. “weak”) in the evidence for each outcome from each discipline (in vivo/in vitro animal or human studies). The evidence synthesis/confidence characterization step was carried out by at least two authors. Differences were discussed until consensus was achieved.
To determine whether the evidence was “strong” or “weak,” we employed a modified definition of existing tools for robust, strong bodies of evidence (Guyatt et al. 2008; Deener et al. Citation2018; Goodman et al. Citation2020; US EPA Citation2020b; US Preventive Services Taskforce Citation2021). In general, a body of evidence for a given outcome was categorized as strong if it consisted of at least three studies (Treadwell et al. Citation2006; Goodman et al. Citation2010) and exhibited consistency of results across similar exposures and evidence of a monotonic dose-response relationship, based on previous ozone-induced toxicity data (Nishikawa et al. Citation1990; Holland et al. Citation2015).
For the human studies, beyond the number of studies, we also considered study components that contributed to the overall confidence assessment. Weak bodies of evidence were assigned if the results were inconsistent based upon the directionality of results with no explanatory reasons; there was limited or inadequate control of confounding factors and co-exposures; and evaluation of exposure was semi-ecologic or with no accounting for spatial or temporal variability. We did not formally evaluate the strength of associations. While evaluation of a body of evidence by comparing strength of associations across publications is desirable, risk estimates were not always reported by the authors, and beta values were often based on different units, making direct comparison across studies impossible. The issue of lack of comparability of outcomes and its effect on weight of evidence assessment has been discussed in depth by Goodman et al. (Citation2010). For the in vivo/in vitro animal studies, strong evidence also demonstrated an increasing effect with increasing exposure duration/frequency, considering both exposure hours and repeated exposures (e.g. episodic exposures over many weeks). The evidence was considered weak if two or fewer studies were available, if the results across studies were not consistent (e.g. no discernible pattern compared with control measurements), or if no clear exposure-response relationship could be discerned (e.g. either across exposure levels or across exposure duration/frequency) to support the hypothesis that ozone induced the outcome in question. The experimental animal evidence could include several experimental outcomes; thus, the animal streams of evidence could include a series of mixed confidence characterizations.
It should be noted that information from animal and mechanistic studies (including any in vitro data) was combined in this review into a single stream of experimental animal evidence. Regarding the role of mode of action (MOA), one approach used in reviews is to begin by developing a hypothetical MOA for the outcomes of interest. In this review, however, we first assessed the experimental animal evidence stream to determine whether it supported a causal role for ozone for any of the outcomes of interest, and then, if so, considered what the MOA might be for such outcome(s).
2.6. Evidence integration
Evidence integration has been defined as making “judgments regarding the strength of evidence for exposure or health effect developed by looking across evidence streams” (National Academies of Sciences Engineering and Medicine Citation2021). For ozone and each of the human health effects (T1D, T2D, overweight/obesity, and metabolic syndrome), we examined the conclusions of the evidence synthesis step for the human and in vivo/in vitro evidence streams. An overall causality judgment for each PECO statement was then determined using an adaptation of EPA approaches (US EPA Citation2020a, Citation2020b). As shown in , we employed four causality determinations: causal, suggestive, insufficient, and not likely.
Figure 2. Evidence integration for causality determination, adapted from EPA (US EPA Citation2020b).
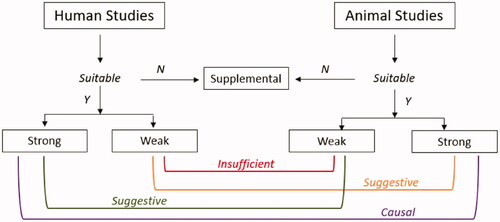
Causal: A causal determination would be based on strong positive evidence from both human and animal/mechanistic data streams.
Suggestive: A conclusion of suggestive would be based on evidence streams that include some studies showing associations with health effects, but with uncertainties in the overall evidence from inconsistent inter- or intra-study results or other limitations.
Insufficient: If the bodies of evidence were categorized as weak for both streams, we concluded that the evidence was insufficient for a causal determination. This mirrors EPA’s “Inadequate” category which was defined as bodies of evidence with studies “of insufficient quantity, quality, consistency or statistical power to permit a conclusion regarding the presence or absence of an effect.”
Not likely: This conclusion would be based on strong evidence from both human and animal/in vitro data streams that is null OR significant in the direction opposite to the hypothesized direction.
3. Results
3.1. Literature search and overview of studies and data sources
3.1.1. Human studies
The literature searches identified 2789 unique publications (). Screening of the publication titles and abstracts reduced this number to 94. These 94 studies underwent a full-text screen, from which 34 publications were identified for final inclusion in the review. No additional studies were identified from a bibliography review of these publications. Study descriptions, design, approach to exposure assessment, and results are summarized for each of the 34 studies in . Of the 34 studies, nine (27%) were conducted in the US (Hathout et al. Citation2006; Chen et al. Citation2016; White et al. Citation2016; Miller et al. Citation2016a; Jerrett et al. Citation2017; Hernandez et al. Citation2018; Li et al. Citation2018; Toledo-Corral et al. Citation2018; Starling et al. Citation2020), nine in China (Dong et al. Citation2014; Li et al. Citation2015; Song et al. Citation2018; Yang et al. Citation2018a, Citation2018b, Citation2019a, Citation2019b; Li et al. Citation2019; Zhang et al. Citation2019), six in Europe (Malmqvist et al. Citation2015; Di Ciaula Citation2016; Tamayo et al. Citation2016; Lanzinger et al. Citation2018; Orioli et al. Citation2018; Renzi et al. Citation2018), three in Taiwan (Chuang et al. Citation2010, Citation2011; Chin et al. Citation2018), three in South Korea (Kim and Hong Citation2012; Kim et al. Citation2018; Shin et al. Citation2019), two in Canada (To et al. Citation2015; Elten et al. Citation2020), one in Chile (Dales et al. Citation2012), and one in Malaysia (Wong et al. Citation2020).
Figure 3. PRISMA diagram for human studies.
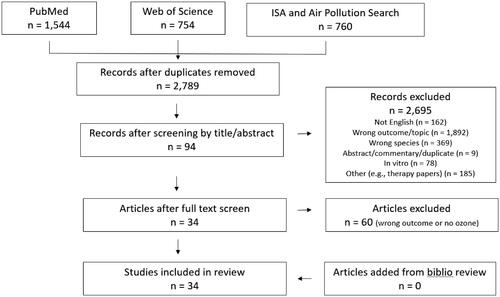
Table 2. Synopsis of human studies used in this review.
Several investigators used the same data source but reported on different outcomes; these included publications from the 33 Communities Chinese Health Study (Li et al. Citation2015; Yang et al. Citation2018a, Citation2018b, Citation2019a), the China Health and Retirement Longitudinal Study (CHARLS) (Zhang et al. Citation2019; Yang et al. Citation2019b), and the US Black Women’s Health Study (BWHS) (White et al. Citation2016; Jerrett et al. Citation2017).
3.1.2. In vivo/in vitro animal studies
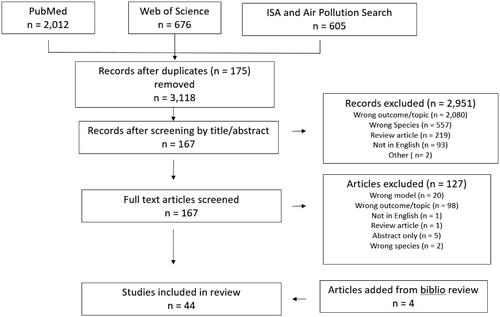
The literature searches identified 3118 toxicologic publications (). Screening of the titles and abstracts reduced this number to 167. From the 167 publications that underwent a full-text screen, 40 studies were identified for inclusion. An additional four studies were identified and included after a review of the bibliographies of these publications. Of the 44 in vivo/in vitro animal studies identified, 35 were performed in rats (Hathaway and Terrill Citation1962; Clemons and Garcia Citation1980a, Citation1980b; Clemons and Wei Citation1984; Mole et al. Citation1985; ErkenBrack and Clemons Citation1988; Mautz and Bufalino Citation1989; Sen et al. Citation1993; Watkinson et al. Citation1993, Citation1995; Huffman et al. Citation2001, Citation2006; Creţu et al. Citation2010; Martrette et al. Citation2011; Bass et al. Citation2013; Gordon et al. Citation2013, Citation2014, Citation2016a, Citation2016b, Citation2017a, Citation2017b; Wagner et al. Citation2014; Miller et al. Citation2015, Citation2016b, Citation2016c; Ramot et al. Citation2015; Vella et al. Citation2015; Thomson et al. Citation2016, Citation2018; Cestonaro et al. Citation2017; Henriquez et al. Citation2018, Citation2019, Citation2020; Snow et al. Citation2019) including one pregnant rat model (Miller et al. Citation2017). The remaining studies included seven in mice (Graham et al. Citation1982; Umezu et al. Citation1993; Slade et al. Citation1997; Last et al. Citation2005; Johnston et al. Citation2006; Aibo et al. Citation2010; Mathews et al. Citation2017), one in guinea pigs (Vaughan et al. Citation1984), and one in vitro study (Peters et al. Citation1993).
Figure 4. PRISMA diagram for in vivo/in vitro animal studies.
3.2. Assessment of study suitability for evidence synthesis
Of the 34 epidemiologic studies and 44 animal studies, those that met the suitability criteria formally moved forward to the evidence synthesis step. The remainder were considered Supplemental. While Supplemental studies were not included in evidence synthesis in this review, it is useful to be aware of the full body of literature.
3.2.1. Human studies
As described in the Methods section, the element of temporality, i.e. the demonstration that exposure preceded the outcome, was used to distinguish Supplemental studies from Suitable ones. Results from studies categorized as Supplemental are discussed in the following sections; however, they were not used in evidence synthesis. Of the 34 publications identified, 19 were determined to be Supplemental. Sixteen studies employed a cross-sectional design (Chuang et al. Citation2010, Citation2011; Dong et al. Citation2014; Li et al. Citation2015; Chen et al. Citation2016; Tamayo et al. Citation2016; Hernandez et al. Citation2018; Orioli et al. Citation2018; Toledo-Corral et al. Citation2018; Yang et al. Citation2018a, Citation2018b; Shin et al. Citation2019; Zhang et al. Citation2019; Yang et al. Citation2019a, Citation2019b; Wong et al. Citation2020). Three studies did not collect baseline data for temporal comparison data (Lanzinger et al. Citation2018; Li et al. Citation2018), or relied upon prevalent cases (Di Ciaula Citation2016). Detailed information for both Suitable and Supplemental studies can be found in .
Five studies evaluated associations between ozone exposure and complications from diabetes (Dales et al. Citation2012; To et al. Citation2015; Chin et al. Citation2018; Kim et al. Citation2018; Song et al. Citation2018). On examination, these investigations were found to not directly address the PECO questions and so were not considered further.
3.2.2. Toxicologic studies
The five criteria described in the Methods section were used to categorize the 44 publications as Suitable for evidence synthesis or Supplemental. Thirty-three studies were considered Suitable for evidence synthesis. Included were two studies that did not fully meet all five criteria. Miller et al. (Citation2016c) met four criteria for the control (SHAM) group but met the required five criteria for the exposure group. Mautz and Bufalino (Citation1989) did not provide a description of statistical tests but did provide p values for the core body temperature (BT) results.
Four studies were categorized as Supplemental. Three reported on ozone exposure and effects on thyroid hormones and had only one critical deficiency (Clemons and Garcia Citation1980a; Clemons and Wei Citation1984; Sen et al. Citation1993). The fourth publication (Last et al. Citation2005) did not meet the criteria as the numbers of animals in the groups were not defined, although the reported effects of ozone on body weight [BW] were statistically significant, which is suggestive of an adequate sample size.
Excluded from further evaluation and discussion were seven papers with critical deficiencies. These deficiencies included missing information on the generation and monitoring of ozone for exposure groups (Hathaway and Terrill Citation1962; ErkenBrack and Clemons Citation1988), missing or inadequate sample size (Peters et al. Citation1993; Slade et al. Citation1997), and no control groups (Peters et al. Citation1993; Slade et al. Citation1997). The publication by Clemons and Garcia (Citation1980b) was excluded because the authors reported the same data as in Clemons and Garcia (Citation1980a). Creţu et al. (Citation2010) was excluded because, although it met the suitability criteria, it was not possible to determine which treatment group the reported data represented, therefore it was impossible to determine ozone-related effects. Wagner et al. (Citation2014) was excluded because, upon further review, the study did not include PECO outcomes relevant to this review. Note that only one of the 44 publications identified was an in vitro study (Peters et al. Citation1993), but it had no information regarding the methodology of ozone exposure, the use of control groups, n values, or statistical analyses methods. Accordingly, the remaining sections will discuss only the in vivo animal studies.
3.3. Evidence synthesis/confidence characterization
Confidence in the literature for ozone exposure being associated with metabolic outcomes was categorized as either strong or weak (see Section 2.5). General observations regarding strengths and weaknesses of the associations in the reviewed literature were followed by an assessment of the outcome-specific literature (Sections 3.3.1 and 3.3.2 cover human and animal studies, respectively).
3.3.1. Human studies
For the outcomes of interest in this review (T1D, T2D, overweight/obesity, and metabolic syndrome), all 34 studies relied upon robust ascertainment approaches, such as physician diagnosis and standard laboratory results from fasting blood tests. In addition, where relevant, all the studies reported participant fasting, except for one experimental study (Miller et al. Citation2016a). However, a few of the reviewed studies were not able to distinguish between T1D vs. T2D (To et al. Citation2015; Di Ciaula Citation2016; Hernandez et al. Citation2018; Orioli et al. Citation2018). Only one study, from the 33 Communities Chinese Health Study, defined and evaluated “metabolic syndrome” (Yang et al. Citation2018b), but the authors utilized a cross-sectional approach, so this paper could not be used to evaluate causality.
In the following subsections, we characterize the confidence in the subsets of studies related to each outcome, noting that the general issues (See Section 4.2) for exposure assessment cut across the literature.
3.3.1.1. Studies of overweight/obesity
Eight publications evaluated associations between ozone and effects on weight. Only two studies (White et al. Citation2016; Starling et al. Citation2020), both conducted in the US, were considered Suitable for evidence synthesis (). These cohort studies could not be directly compared as the authors examined different populations, outcomes, and exposures. The Healthy Start Study (Starling et al. Citation2020) assessed birth weight and adiposity at birth and at five months, whereas the Black Women’s Health Study (White et al. Citation2016) focused on weight change over several years in adult women. In addition, Starling et al. characterized ozone exposure using monitors within 50 km of a residence, whereas White et al. relied upon a smaller spatial scale of within 12 km of the residence. The results of these studies were not statistically significant, with the exception of adiposity at five months related to maternal exposure during the third trimester (Starling et al. Citation2020); as shown in , the directionality of the results related to the trimester(s) of ozone measurement was not consistent.
Table 3. Summary of associations between ozone exposure and effects on weight in human (Suitable studies).
White et al. (Citation2016) also examined a subset of the cohort that did not change residence during the study period. Among these women (n = 10 307), weight changes per interquartile range were slightly but statistically significantly greater (0.49, 95% CIs: 0.05, 0.93) compared to the overall cohort, although these women were also slightly older, heavier, and less likely to be nulliparous.
The remaining publications related to overweight/obesity were cross-sectional and categorized as Supplemental (Dong et al. Citation2014; Li et al. Citation2015; Shin et al. Citation2019; Zhang et al. Citation2019; Yang et al. Citation2019a, Citation2019b). These studies were conducted in China and Korea and focused on adults, with one exception (Dong et al. Citation2014). The publications by Yang et al. (Citation2019b) and Zhang et al. (Citation2019) were from the same study but evaluated slightly different outcomes and populations. As shown in , most of the odds ratios (ORs) for these publications were >1.0, with some statistically significant positive results (Dong et al. Citation2014; Li et al. Citation2015; Shin et al. Citation2019; Yang et al. Citation2019b). Two publications reported null results (Zhang et al. Citation2019; Yang et al. Citation2019a).
The strength of the epidemiology evidence associating ozone exposure with overweight/obesity was considered weak. Only two publications were considered Suitable for evidence synthesis and the results did not indicate a consistent association between ozone exposure and effects on weight (). Neither population (one on infants and the other on adults) nor the outcomes (adiposity, birth weight, and weight change) allowed for direct comparisons.
3.3.1.2. Studies of T2D and measures of glucose metabolism
Fifteen studies evaluated associations between ozone exposure and diagnosis or indicators of T2D, with five of these categorized as Suitable for evidence synthesis (). These studies fell into two groups: those that examined the relationship between short-term exposures (i.e. <30 days) to ozone and indicators of T2D, including glucose levels, HOMA-IR (Homeostatic Model Assessment for Insulin Resistance), and insulin levels, and those that assessed long-term exposures to ozone and examined associations with T2D incidence.
Table 4. Summary of associations between ozone exposure and T2D (Suitable studies).
The two short-term studies were conducted in South Korea and the US (Kim and Hong Citation2012; Miller et al. Citation2016a), and used different designs. Miller et al. was a controlled study of 24 exercising adults exposed to 300 ppb ozone. This level is substantially higher than typical ambient levels (Vingarzan Citation2004). In contrast, Kim and Hong (Citation2012) conducted a larger (n = 560) cohort study of adults > 60 years of age; the mean ambient ozone concentration in this study was 19.38 ppb. The results across these studies were not consistent. While Miller et al. (Citation2016a) reported statistically non-significant results for the endpoints of interest, Kim and Hong (Citation2012) reported positive and statistically significant results for glucose, insulin, and HOMA-IR. The directionality of the results across the two studies could not be compared because only qualitative results were given by Miller et al. (Citation2016a).
The three long-term studies evaluating T2D incidence were conducted in the US (Jerrett et al. Citation2017), China (Li et al. Citation2019), and Italy (Renzi et al. Citation2018). The direction of the associations within and across studies was not consistent. For example, Li et al. (Citation2019) reported a relative risk (RR) of 1.45 (95% CI 0.80, 2.31) when controlling for PM10, but reported a significant inverse result for the overall single pollutant model (RR = 0.79, 95% CIs: 0.68, 0.90). In contrast Jerrett et al. (Citation2017) observed a statistically significant hazard ratio (HR) (1.18, 95% CIs: 1.04, 1.34) in their single pollutant model, with attenuation after controlling for PM2.5 and NO2 (HR = 1.13, 95% CIs: 0.97, 1.31). The statistical significance of the results for Renzi et al. (Citation2018) varied depending on the model structure and covariates. The RR values of these associations ranged from 0.99 and 1.05, making the direction of these small associations difficult to interpret (see ). In addition, the use of covariates differed across the three studies, complicating cross-study comparisons. For example, Jerrett et al. (Citation2017) included lifestyle covariates related to diet and smoking, Renzi et al. (Citation2018) controlled for basic demographic data including socioeconomic factors, and Li et al. (Citation2019) only included meteorologic data, such as temperature, humidity, and wind speed.
Nine of the remaining epidemiologic studies related to T2D were cross-sectional and thus categorized as Supplemental (Chuang et al. Citation2010, Citation2011; Chen et al. Citation2016; Hernandez et al. Citation2018; Orioli et al. Citation2018; Yang et al. Citation2018a, Citation2019a; Shin et al. Citation2019; Wong et al. Citation2020); one was a cohort design but without baseline data (Li et al. Citation2018). The directionality of the results of these studies for T2D prevalence was positive for the preponderance of the studies, although not consistently statistically significant. Shin et al. (Citation2019) reported an inverse association for male participants (OR = 0.93, 95% CIs: 0.85, 1.02). There was no consistency of direction or statistical significance for blood measures of glucose and insulin (see ).
For the following reasons, the epidemiology literature on associations between ozone exposure and T2D was categorized as weak for the short-term studies: (i) only two studies were identified that were considered Suitable for evidence synthesis; (ii) the studies were not directly comparable as they examined different populations and used different study designs and ozone concentrations. The epidemiology literature on associations between long-term ozone exposure and T2D was also categorized as weak. Despite having three studies that evaluated the same outcome, the results were inconsistent both in direction and statistical significance with no clear reason for these differences.
3.3.1.3. Studies of T1D
Seven studies evaluated associations between ozone exposure and T1D (). Some studies were specific to T1D, while other study investigators assumed that all pediatric cases were T1D based on age (Elten et al. Citation2020).
Three studies were considered Suitable for evidence synthesis (Hathout et al. Citation2006; Malmqvist et al. Citation2015; Elten et al. Citation2020) (); these were conducted in Canada, the US, and Sweden, respectively. The studies addressed different time periods of exposure (in utero and childhood) and yielded mixed results (). Elten et al. (Citation2020) observed statistically significant positive associations for T1D and in utero ozone exposure in trimester 1 (HR = 2.00; 95% CIs: 1.04, 3.86), positive but null associations for exposure in trimester 3 (HR = 1.43; 95% CI 0.72, 2.83), but an inverse null association related to exposure in trimester 2 (HR = 0.59; 95% CIs: 0.30, 1.18). Malmqvist et al. (Citation2015) reported a statistically significant increased OR at the highest ozone exposure level in trimester 2 (OR = 1.56; 95% CIs: 1.04, 2.35) but not for trimesters 1 or 3 (directionality not reported by the authors). With respect to exposure during childhood, Elten and colleagues reported a non-significant inverse association (HR = 0.89, 95% CIs: 0.69, 1.14), while a statistically significant positive association was observed by Hathout et al. (OR = 1.73, 95% CIs: 1.08, 2.77) (Hathout et al. Citation2006; Elten et al. Citation2020).
Table 5. Summary of associations between LT ozone exposure and T1D (Suitable studies).
The remaining four T1D studies were categorized as Supplemental because none was designed to evaluate whether exposure preceded diagnosis due to either the cross-sectional design (Tamayo et al. Citation2016; Toledo-Corral et al. Citation2018), reliance on prevalent cases (Di Ciaula Citation2016), or use of a single HbA1c (hemoglobin A1c) measurement without a baseline comparison (Lanzinger et al. Citation2018). Statistically significant inverse associations of ozone exposure and HbA1c were reported by Tamayo et al. (Citation2016) and Lanzinger et al. (Citation2018). Di Ciaula (Citation2016) reported no correlation of annual T1D hospitalizations and annual ozone levels. No significant adverse associations were reported for blood levels of fasting insulin, HOMA-IR, fasting glucose, or 2-h glucose testing by Toledo-Corral et al. (Citation2018).
The epidemiology literature on associations between ozone exposure and T1D was categorized as weak. The results by exposure period were not consistent within or across studies and there were no discernable reasons for these differences. The findings were based on different exposure periods (in utero and childhood exposure) (Malmqvist et al. Citation2015; Elten et al. Citation2020), and it is unclear whether these two time periods are comparable, particularly for the inhalation route of exposure. All three studies collected and evaluated accepted confounders related to T1D. The exposure assessment scale varied across studies. For example, one study used monitoring data within postal codes for monthly averages (Hathout et al. Citation2006), another relied on monitoring results during the warm seasons for areas within 25 km of a monitoring station (Elten et al. Citation2020), and a third used measurements within 32 km of a residence (Malmqvist et al. Citation2015).
3.3.1.4. Studies of metabolic syndrome
Five studies evaluated associations between ozone and metabolic syndrome (). As described previously, metabolic syndrome is defined by the presence of at least three of five risk factors (elevated waist circumference, elevated TG, reduced HDL cholesterol, elevated blood pressure, and/or elevated fasting glucose). To be inclusive, we examined publications that specifically examined relationships between ozone exposure and metabolic syndrome, as well as those that assessed at least three of the five diagnostic factors.
The experimental short-term exposure study by Miller et al. (Citation2016a) was the only publication considered Suitable for evidence synthesis (). Miller et al. did not evaluate “metabolic syndrome” as an outcome, but rather assessed four of the five diagnostic factors (waist circumference was not included). Miller et al. did not observe any statistically significant associations between ozone exposure and the four measures associated with metabolic syndrome.
Table 6. Summary of association between ST ozone exposure and metabolic syndrome (Suitable studies).
The remaining four studies related to metabolic syndrome were cross-sectional and therefore were categorized as Supplemental (Chuang et al. Citation2010, Citation2011; Chen et al. Citation2016; Yang et al. Citation2018b). The 33 Communities Chinese Health Study (Yang et al. (Citation2018b) was the only study to formally assess “metabolic syndrome.” They found a positive, statistically significant association with long-term exposure (OR = 1.10, 95% CI 1.01, 1.18). As shown in detail in , the other three studies reported mixed results (Chuang et al. Citation2010, Citation2011; Chen et al. Citation2016). Statistically significant results were reported by Chuang et al. (Citation2010) for fasting glucose and blood pressure with year-long exposure estimates, while Chen et al. (Citation2016) found statistically non-significant results. It was not possible to compare the directionality of the results since both Chen et al. (Citation2016) and Miller et al. (Citation2016a) reported only qualitative results.
The strength of the evidence on associations between ozone exposure and metabolic syndrome was categorized as weak as only one Suitable study was identified. It is worth noting that the results from this controlled human study may not be generalizable since the study population was composed of 24 healthy adults and the ozone concentration was approximately an order of magnitude higher than ambient concentrations (Vingarzan Citation2004).
3.3.2. In vivo/in vitro animal toxicologic studies
In this section, we first offer perspective on key strengths and limitations of the overall body of literature. We then provide assessments of the in vivo experimental animal results according to each PECO endpoint. The experimental animal evidence and the conclusions for each experimental outcome are summarized in .
The studies categorized as Suitable generally used consistent methods and experimental designs (e.g. standard ozone generation and monitoring protocols). It is also worth noting that a variety of rat strains and ages were represented. In addition, while chronic studies were not identified, the studies did attempt to capture short-term exposures, repeated episodic exposures, and sub-chronic exposures. However, few of the toxicology studies evaluated exposure-response in the same study. Accordingly, the analyses in this review involved combining available exposure-response information from studies of different animal strains and sometimes species, with a variety of exposure durations and frequencies. While this approach can add to the strength of an evidence stream if the overall data are coherent, the only outcomes with consistency across studies were glucose tolerance and fasting hyperglycemia tests. The few studies with post-exposure recovery periods allowed for only 18 h or 1 week recovery and were not repeated to demonstrate whether the observed apparent recovery was reproducible following another set of exposures. In addition, the lack of chronic exposure data made it difficult to determine whether adaptation to ozone occurs in exposed animals such that any effect on glucose tolerance and/or hyperglycemia may be considered transient or long-lasting. Finally, it should be noted that the animal exposures were carried out at relatively high levels of ozone, which may not be relevant to typical human exposures.
3.3.2.1. Experimental animal toxicologic studies of glucose-related effects
Potential glucose-related effects of ozone exposure, including impaired glucose tolerance, insulin resistance, fasting hyperglycemia, changes in hepatic gluconeogenesis (GNG), and changes in serum hormone analytes related to glucose homeostasis were evaluated across 18 studies (all 18 were categorized as Suitable for evidence synthesis). Results are discussed below by outcome, with glucose tolerance and fasting glucose levels measured by the glucose tolerance test (GTT, 11 studies), insulin sensitivity by the insulin tolerance test (ITT, two studies), and hepatic GNG by the pyruvate tolerance test (PTT, two studies). Data on serum hormone analytes related to glucose homeostasis, including glucagon, insulin, leptin, and corticosterone (CORT), are also discussed (18 studies).
3.3.2.1.1. Glucose tolerance
In the GTT, glucose is administered to fasted animals and blood samples are taken at various time-points to measure blood glucose concentration, generally over the course of 2 h. Similar to humans, the GTT is used in toxicologic studies to assess the competence of the regulatory mechanisms that determine blood glucose concentration; it provides a physiological overview of any changes in glucose tolerance. Eleven studies evaluated associations between ozone exposure and effects on glucose homeostasis and glucose tolerance as measured by fasting blood glucose concentration and the GTT (). Rats of various strains were used as the animal model, including Brown Norway (Bass et al. Citation2013), Long-Evans (Gordon et al. Citation2017a, Citation2017b; Snow et al. Citation2019), Wistar (Vella et al. Citation2015), Wistar Kyoto (Miller et al. Citation2015, Citation2016b, Citation2016c; Henriquez et al. Citation2019, Citation2020), and F344 (Thomson et al. Citation2018).
Table 7. Glucose tolerance testing (GTT) analysis results after inhalation ozone exposure in rats (Suitable studies).
The eleven studies represented a total of 48 study groups. Within each study group, fasting blood glucose measurements were taken prior to/at 0 min (baseline) and after glucose injection at 30, 60, 90, and 120 min time-points. Ozone exposure concentrations ranged from 0.25 to 1.0 ppm.
Four studies evaluated glucose homeostasis following ozone exposure at 0.25 ppm (Bass et al. Citation2013; Miller et al. Citation2015; Gordon et al. Citation2017b). For all study groups at 0.25 ppm ozone, baseline blood glucose concentrations (0 min time-point) in ozone-exposed animals were approximately equal to those of air control animals. This was true regardless of rat age, exposure duration, or exposure frequency. Results at the post-glucose GTT time-points (i.e. 30, 60, 90, and 120 min) were mixed, with none of the differences considered statistically significant.
Two studies evaluated ozone exposure at 0.5 ppm (Miller et al. Citation2015; Gordon et al. Citation2017b) (). Miller et al. (Citation2015) included two study groups of Wistar Kyoto rats (n = 6 each); for both groups, baseline glucose concentrations in ozone-exposed animals were higher than those of air controls; however, the differences were not statistically significant. In Gordon et al. (Citation2017b), female Long-Evans rats (n = 10) exposed to 0.5 ppm ozone demonstrated baseline glucose concentrations approximately equal to air controls; however, a consistent trend of higher blood glucose concentrations at the post-glucose time-points of the GTT was observed, with the majority (7/12) demonstrating statistical significance.
Six studies evaluated ozone exposure at 0.8 ppm (Vella et al. Citation2015; Gordon et al. Citation2017a; Thomson et al. Citation2018; Henriquez et al. Citation2019; Snow et al. Citation2019; Henriquez et al. Citation2020). Across these studies, there were ten total study groups composed of various rat strains (). In seven of the groups, ozone-exposed animals demonstrated significant fasting hyperglycemia at baseline compared with air controls. The remaining three study groups had mixed results, with none of the differences considered statistically significant. For the post-glucose injection time-points of the GTT, a consistent trend of elevated blood glucose concentrations (about 50:50 significant vs. non-significant), as well as significantly higher area under the curve (AUC) values (5 out of 8), were observed in ozone-exposed animals compared with air controls (Vella et al. Citation2015; Henriquez et al. Citation2019, Citation2020).
Five studies evaluated ozone exposure at 1.0 ppm and glucose homeostasis/tolerance (Bass et al. Citation2013; Miller et al. Citation2015, Citation2016b; Gordon et al. Citation2017b). Among them, there was a total of 21 study groups (). In 18 of these study groups, the GTT was administered immediately after ozone exposure, and fasting hyperglycemia was observed in 15 of the ozone-exposed groups, with the majority considered statistically significant. In addition, at all post-glucose time-points of the GTT, ozone-exposed animals in the 18 study groups demonstrated blood glucose concentrations that were consistently higher than air controls, with the vast majority statistically significant.
Three studies (Bass et al. Citation2013; Miller et al. Citation2015, Citation2016b) included study groups in which the animals were allowed to recover post-exposure for 18 h or 1 week before the GTT was administered. Among these studies, substantial differences in glucose homeostasis and glucose tolerance were observed. In Bass et al. (Citation2013), a study group of Brown Norway rats (n = 4–10) was allowed to recover for 18 h after 1.0 ppm ozone exposure (6 h/d × 2 d) before the administration of the GTT. In this recovery group, blood glucose concentrations were not statistically different from air controls at any time-point. In contrast, the animals not allowed a recovery period had significantly higher blood glucose concentrations than air controls for every post-glucose GTT time-point studied (Bass et al. Citation2013). Similar results were obtained in Miller et al. (Citation2015), in which a study group of Wistar Kyoto rats (n = 8) allowed to recover for 18 h after 1.0 ppm exposure (6 h/d × 2 d) had substantially improved glucose tolerance at all but one GTT time-point. In Miller et al. (Citation2016b), Wistar Kyoto rats (n = 8–10) were exposed to 1.0 ppm ozone for 5 h/d × 3 d/week for 13 weeks, with one study group allowed to recover for one week prior to the administration of the GTT. Animals subjected to the GTT immediately following ozone exposure with no recovery period demonstrated blood glucose concentrations that were significantly higher than air controls, including at baseline and all post-glucose time-points of the GTT and AUC (Miller et al. Citation2016b). In contrast, animals allowed the 1-week recovery period demonstrated baseline and post-glucose blood glucose concentrations that were approximately equal to air controls at all but one time-point, with no differences considered statistically significant.
Among the eleven studies, two (Bass et al. Citation2013; Miller et al. Citation2016b) included groups at 1.0 ppm ozone in which the GTT was administered after sub-chronic episodic ozone exposure. The effects on glucose homeostasis from sub-chronic episodic exposures (e.g. 5 h/d × 3 d/week for 12 weeks) were similar to those observed in animals subjected to single short-term exposures (e.g. 6 h/d × 1 day) ().
The results across the studies indicate a consistent association between ozone exposure at concentrations ≥0.8 ppm and impaired glucose tolerance/homeostasis in rats. The toxicologic evidence was therefore categorized as strong. There were eleven publications representing a total of 48 study groups comprised of various rat strains and ages, with experiments conducted in several different laboratories (). In addition, the studies had similar methodologies for ozone exposure and GTT administration, thus allowing for direct comparisons. Moreover, there is good evidence of a dose-response relationship between ozone exposure and perturbations in glucose homeostasis. For instance, at 0.25 ppm ozone exposure, no significant changes in glucose tolerance or fasting blood glucose were observed in any of the study groups. This was true regardless of rat strain, age, or exposure duration/frequency. At 0.5 ppm ozone, 7 out of 15 time points showed statistically significant impairment in glucose tolerance out of the three groups. In addition, while fasting blood glucose concentrations were not significantly affected at 0.5 ppm ozone, significant fasting hyperglycemia and greater impairment of glucose tolerance were observed in study groups exposed to 0.8 or 1.0 ppm ozone. Among these groups, greater than half demonstrated significant fasting hyperglycemia and/or ≥3 GTT time-points that were significantly affected.
From the eleven studies evaluated for glucose tolerance and fasting blood glucose, the greatest drivers affecting ozone-induced changes appear to be ozone exposure concentration and the timing of the GTT after exposure (i.e. whether a recovery period was allowed prior to the GTT). The substantial improvements in glucose homeostasis observed in animals allowed a recovery period after ozone exposure, even if only 18 h, suggest that the adverse effects of ozone may be transient and not long-lasting. However, the number of available studies with GTT data following a recovery period is extremely limited.
3.3.2.1.2. Insulin sensitivity
Two studies (Vella et al. Citation2015; Miller et al. Citation2016b) evaluated associations between ozone and effects on glucose homeostasis and insulin sensitivity as measured by fasting blood glucose concentration and the insulin tolerance test (ITT) (). In toxicologic studies, the ITT is used to assess whole-body sensitivity to insulin, specifically the ability of tissues to uptake glucose in response to insulin injection. KITT (% min−1) is the rate constant for plasma glucose disappearance.
Table 8. Insulin tolerance test (ITT) results analysis after ozone exposure in rats (Suitable studies).
Between the two studies, a total of 11 study groups were evaluated, with ozone exposure concentrations ranging from 0.25 to 1.0 ppm. In addition, Vella et al. (Citation2015) included a dose-response study group aimed at determining % plasma glucose decrease during the ITT. Among the study groups, the ITT was administered after short-term acute exposure (e.g. 5 h/d × 3 d/week) in eight groups and after sub-chronic exposure (5 h/d × 3 d/week) of 12 weeks in two groups. In addition, one study group (n = 7) in Vella et al. (Citation2015) was used to evaluate ozone exposure at 12 h/d for 4 days (considered sub-chronic exposure by the authors).
Vella et al. (Citation2015) and Miller et al. (Citation2016b) evaluated ozone exposure at 0.25 ppm (). Baseline blood glucose concentrations (0 min ITT time-point) in 0.25 ppm ozone-exposed animals were approximately equal to or lower than control (air)-exposed animals, with no differences considered statistically significant. Results at the post-insulin ITT time-points (i.e. 30, 60, 90, and 120 min) were mixed.
Vella et al. (Citation2015) evaluated a single short-term ozone exposure (16 h) at 0.8 ppm in five different study groups (n = 5 each). In this series of experiments, the ITT was administered immediately after exposure or after various assigned recovery periods ranging from 0 to 96 h. In all the study groups, baseline blood glucose concentrations were approximately equal to those of control (air)-exposed animals and none of the ITT glucose values were statistically increased. However, KITT values were significantly decreased, indicating decreased insulin sensitivity in the five study groups ().
In Miller et al. (Citation2016b), short-term (5 h/d × 3 d/week for 1 week) and subchronic ozone exposure (5 h/d × 3 d/week for 12 weeks) at 1.0 ppm (n = 8–10 each group) resulted in significantly increased baseline blood glucose concentrations compared with control (air)-exposed animals, but the ITT showed mixed results with 3 out of 10 statistically significantly increased ().
To determine plasma glucose decreases (%) during the ITT, Vella et al. (Citation2015) conducted a dose-response study in Wistar rats (n = 5–8) exposed overnight (16 h) to ozone at 0 to 0.8 ppm. Control animals (0 ppm) demonstrated a 68% decrease in plasma glucose in response to insulin injection during the ITT (). Animals exposed to 0.1 and 0.2 ppm ozone overnight demonstrated plasma glucose decreases (65 and 60%, respectively) during the ITT that were not significantly different from control (0 ppm) animals. However, animals exposed to 0.3, 0.5, and 0.8 ppm ozone overnight demonstrated plasma glucose % decreases during the ITT that were significantly lower (39, 33, and 39%, respectively) than those observed in control (0 ppm) animals, indicating significantly decreased insulin sensitivity in these animals.
Taken together, these results do not indicate a consistent association between ozone exposure and insulin sensitivity (). While one study (Vella et al. Citation2015) reported a consistent and significant decrease in the KITT rate constant across five study groups exposed to 0.8 ppm ozone, indicating that ozone exposure may adversely affect insulin sensitivity, additional reliable and reproducible data are needed to fully characterize this association. In addition, although data from the same study for the post-insulin ITT time-points appear to demonstrate a consistent trend in increased blood glucose concentrations at 0.8 ppm ozone, it is unclear whether statistical analyses were performed for these data, making a final determination of their significance difficult. Further, while the results from the dose-response study group in Vella et al. (Citation2015) indicate that an adverse dose-response relationship between ozone exposure concentration and insulin sensitivity may exist, a single study group is not adequate evidence, thus more data are needed.
Therefore, for this endpoint, the strength of the toxicologic evidence for an association between ozone exposure and insulin sensitivity was categorized as weak. First, the evidence is based upon only two publications and a limited number of study groups (). In addition, inconsistencies across the two studies in reporting ITT results further limit any direct comparisons that can be made, particularly regarding baseline (0 min ITT time-points) blood glucose measurements. For example, Vella et al. (Citation2015) reported the ITT results of their study as “glycemia, % of baseline,” indicating that all 0 min ITT time-points were normalized to 100% regardless of control or ozone exposure concentration. In contrast, Miller et al. (Citation2016b) reported the ITT results of their study as “blood glucose (mg/dL)”; thus, the 0 min ITT time-points in this study were reflective of the actual blood glucose concentration in that group of animals at the given ozone concentration. Furthermore, no data are available for female animals.
3.3.2.1.3. Hepatic gluconeogenesis (GNG) and the pyruvate tolerance test (PTT)
Two studies (Vella et al. Citation2015; Miller et al. Citation2016b) evaluated associations between ozone and effects on glucose homeostasis and hepatic GNG as measured by fasting blood glucose concentration and the PTT (). A third study (Aibo et al. Citation2010) qualitatively evaluated histopathological staining as an indirect measure of hepatic GNG following ozone exposure. During the fasting state, GNG is an important hepatic process that prevents hypoglycemia by generating glucose from non-carbohydrate substrates, including pyruvate. In the PTT, pyruvate is injected to fasted animals and the resulting glycemic response is reflective of the level of hepatic GNG.
Table 9. Pyruvate tolerance test (PTT) results analysis after ozone exposure in rats (Suitable studies).
Across the two studies, a total of seven study groups were evaluated, with ozone exposure concentrations ranging from 0.25 to 1.0 ppm. Among the study groups, the PTT was administered after short-term acute exposure (i.e. ≤2 weeks) or repeated, sub-chronic exposure (5 h/d × 3 d/week for 13 weeks).
Miller et al. (Citation2016b) evaluated ozone exposure at 0.25 ppm. For all study groups, baseline blood glucose concentrations (0 min PTT time-point) in ozone-exposed animals were approximately equal to those of control (air)-exposed animals. Results at the post-pyruvate PTT time-points (i.e. 30, 60, 90, and 120 min) and the AUC were mixed, with none statistically significant. Vella et al. (Citation2015) showed no significant effects on baseline blood glucose or hepatic GNG following a single (16 h) exposure to 0.8 ppm ozone. Miller et al. (Citation2016b) also examined short-term and subchronic ozone exposure at 1.0 ppm using three study groups (n = 8–10). Short-term ozone exposure (5 h/d × 3 d/week for 1 week) resulted in significantly increased baseline blood glucose concentrations compared with control (air)-exposed animals. In addition, hepatic GNG was significantly induced at all post-pyruvate PTT time-points and the AUC was significantly increased. However, the results were mixed for animals subjected to subchronic ozone exposure (5 h/d × 3 d/week for 13 weeks). One study group (d1 of week 13) demonstrated similar results to the short-term exposure group and the other (d3 of week 13) demonstrated baseline and post-pyruvate blood glucose concentrations that were approximately equal to control (air)-exposed animals, possibly indicating a rapid adaptive response to ozone exposure. In the third study identified, Aibo et al. (Citation2010) qualitatively evaluated liver glycogen staining in mice after ozone exposure (0, 0.25, 0.5 ppm ozone for 6 h) and found no changes.
Overall, the results do not indicate a consistent association between ozone exposure and hepatic GNG (). Thus, the strength of the toxicologic evidence was categorized as weak. First, the evidence is based on only two publications and a limited number of study groups. While the use of similar animal models and consistent methodology in administration of the PTT allow for direct comparisons, the results are inconsistent, and no data are available for female animals. In addition, while a dose-response relationship may be present (e.g. significant changes in hepatic GNG were observed at 1.0 ppm ozone compared with 0.25 and 0.8 ppm ozone), the data are limited.
3.3.2.1.4. Serum/plasma hormone analytes related to glucose homeostasis
Seventeen studies evaluated certain glucose-related hormonal serum/plasma analytes, including glucagon, insulin, leptin, and corticosterone (CORT), across 47 study groups () (Martrette et al. Citation2011; Bass et al. Citation2013; Gordon et al. Citation2013, Citation2016b, Citation2017a, Citation2017b; Miller et al. Citation2015, Citation2016b, Citation2016c, Citation2017; Vella et al. Citation2015; Thomson et al. Citation2016, Citation2018; Mathews et al. Citation2017; Henriquez et al. Citation2018, Citation2019, Citation2020; Snow et al. Citation2019). Forty-six of the study groups used various rat strains as the animal model (Brown Norway, Fischer 344, Long-Evans, Wistar, Wistar-Kyoto) and one used a mouse model (C57BL/6J). Eleven study groups were comprised of female animals (two with pregnant rats; Miller et al. Citation2017), while 36 were comprised of male animals. The data cover a range of ozone exposure levels (from 0.12 to 2.0 ppm ozone), durations (3–16 h), and frequencies (single acute exposures to 1–3 d/week for up to 17 weeks).
Table 10. Animal studies: blood/serum/plasma hormone analytes after ozone inhalation exposure (Suitable studies).
Close review of the results () indicates no obvious patterns of change for most of the hormonal data, with no clear associations with ozone exposure concentration or acute vs. repeated exposure, duration, or frequency. Glucagon showed both increases and decreases, along with roughly equivalent values and non-significant results. While there were some statistically significant changes in leptin values, there was a similar pattern of both increases and decreases and several data points were roughly equivalent to controls. Acute exposure to ozone at 0.8 ppm ozone demonstrated some increased CORT values (both statistically significant and non-significant) compared with controls; however, the expected similar effect following acute and repeated exposures to 1.0 ppm ozone was not present. In addition, two studies by Henriquez et al. (Citation2019, Citation2020) reported CORT data from four study groups of identical ozone exposure; however, the results were inconsistent. Two study groups demonstrated increased (non-significantly) CORT values, one study group had decreased (non-statistically) CORT values, and one study group had CORT values approximately equal to control (air)-exposed animals. For insulin, there appeared to be a trend for increasing levels, although non-significantly, following 13 weeks of exposure to 0.25 ppm ozone. In contrast, insulin levels were decreased, although not statistically significantly, following 13 weeks of exposure to 1.0 ppm ozone. However, since none of these changes were statistically significant compared with control (air)-exposed animals, it is difficult to draw any conclusions on how insulin levels may be affected by acute or repeated exposure to ozone.
There were no obvious patterns or associations related to changes in serum/plasma values for glucagon, insulin, leptin, or CORT in response to acute or repeated exposure to ozone at concentrations ranging from 0.12 to 2.0 ppm, and for up to 17 weeks of repeated exposures. The possible pattern for insulin is not sufficiently supported with the available data to have confidence in its potential association with ozone exposure. Therefore, the strength of this body of evidence was categorized as weak.
3.3.2.1.5. Glucose-related outcomes summary
Overall, the strength of the evidence was categorized as strong for the outcome related to glucose intolerance, including the related outcome of fasting/baseline hyperglycemia (). For the remaining glucose-related outcomes, including insulin resistance, hepatic GNG, and related serum hormone analytes, the strength of the evidence was categorized as weak ().
3.3.2.2. Dyslipidemia
Fifteen publications were identified that reported serum lipid values in mammalian animal models following inhalation exposure to ozone, comprising 68 study groups (). The studies reported on six different rat strains (BN, F344, L-E, SD, WIS, and WIS-KY) (Mole et al. Citation1985; Bass et al. Citation2013; Miller et al. Citation2015, Citation2016b, Citation2016c; Ramot et al. Citation2015; Vella et al. Citation2015; Thomson et al. Citation2016, Citation2018; Gordon et al. Citation2016b, Citation2017a, Citation2017b; Snow et al. Citation2019) and one guinea pig strain (Hartley) (Vaughan et al. Citation1984). One study used pregnant Long-Evans rats (Miller et al. Citation2017). Nine of the rat study groups were female and two of the guinea pig study groups were female; all the remaining study groups were comprised of males. Several datasets included dose-response data, ranging from 0.25 ppm ozone up to 3.0 ppm ozone, with the exposure duration varying from a single 4-h exposure up to 22 h/d. Several studies included repeated exposures, from 1 d/week for 4 weeks to 3 d/week for 13 weeks.
Table 11. Animal studies: serum lipids results after ozone inhalation exposures (Suitable studies).
In analyzing the results on serum lipids, it is important to recognize that while increases in cholesterol (CHOL), triglycerides (TG), and low-density lipoprotein (LDL) are considered detrimental, increases in high density lipoprotein (HDL) are typically considered beneficial. Thus, it is important to not merely consider the directionality (i.e. the “up” or “down”) of the results, but rather whether the direction correlates with a health benefit.
Close review of the available results did not reveal any clear patterns to demonstrate potential consistent effects of ozone inhalation exposure, either acute or repeated, on serum lipids in exposed rats or guinea pigs compared with controls. For example, while there were more increases in CHOL values (11 out of 19, but only two study groups with statistically significant increases) than other responses (e.g. decreases or roughly equivalent) in rats acutely exposed to 1.0 ppm ozone, this possible pattern of ozone-induced increased CHOL was contradicted by the results for repeated exposures to 1.0 ppm ozone, where only two CHOL values (only one statistically significant) showed increases. Similar mixed results were found for the three study groups of rats exposed to 1.0 ppm ozone in a repeated exposure paradigm, where the number of roughly equivalent CHOL values (3) matched the number of increased CHOL values (3; one statistically increased). In addition, following a 1-week recovery, CHOL values were reported to be statistically significantly decreased for one study group at 1.0 ppm in the repeated exposure group. Similarly, neither TG, LDL, nor HDL showed any clear pattern in terms of changes, whether up or down, following ozone exposure.
Overall, these study results did not indicate any reproducible pattern of significant association between inhalation ozone exposure and effects on the serum lipids studied. These findings indicate no consistent or coherent evidence of increased CHOL, TG, or LDL values following inhalation exposure to ozone. Similarly, no consistent or coherent evidence was found for decreased HDL values following ozone exposure. With no consistent pattern in changes demonstrated for any of the serum lipids analyzed, the strength of the toxicologic evidence was categorized as weak; it provides no evidence for ozone-induced dyslipidemia in rats or guinea pigs ().
3.3.2.3. Effects on body weight, food consumption, body temperature, and thyroid hormone homeostasis
It is well-understood that thyroid hormones regulate body temperature. In addition, it is known that reduced body temperature is associated with decreased metabolic function, which can lead to bodyweight increases and obesity.
Sixteen publications evaluated potential associations between inhalation exposure to ozone and effects on body weight (BW; occasionally expressed as body mass), body composition (BC), and food consumption (FC) (). Not all studies evaluated all three parameters, but every study assessed at least one. In the 16 studies, rats, mice, and guinea pigs of various strains were used as the animal model, including the following rat strains: Brown Norway (Gordon et al. Citation2013, Citation2016b), Long-Evans (Miller et al. Citation2017), Wistar (Martrette et al. Citation2011; Cestonaro et al. Citation2017), Wistar-Kyoto (Miller et al. Citation2016c; Henriquez et al. Citation2018, Citation2019, Citation2020), Sprague-Dawley (Mole et al. Citation1985; Gordon et al. Citation2016a), and Fisher 344 (Watkinson et al. Citation1995). The mouse strains used were ICR (Umezu et al. Citation1993), CD-1 (Graham et al. Citation1982), and C57BL/6J (Johnston et al. Citation2006). Hartley guinea pigs were used in one study (Vaughan et al. Citation1984).
Table 12. Animal studies: outcomes of body weight, body composition, and food consumption after ozone inhalation exposure (Suitable studies).
There were 42 study groups, organized in according to ozone exposure level, duration, and frequency. BW and FC data generally corresponded to the end of exposure or following a recovery time; some data were provided for interim time points. Of the 42 study groups, 34 were comprised of male animals and eight of females. Ozone exposure levels ranged from 0.05 to 3 ppm, with exposure durations ranging from 3–24 h/d and exposure frequency from a single 1-d exposure up to 28 consecutive days. Seven study groups had exposures that were repeated over 4 to 17 weeks; for two study groups there were also 7-d recovery periods. Eleven datasets reported on 0.8 ppm ozone exposures and eight on exposures at 1.0 ppm ozone. Four studies included a dose-response assessment (Mole et al. Citation1985; Umezu et al. Citation1993; Gordon et al. Citation2016a; Miller et al. Citation2016b).
Overall, acute (1 or 2 d) exposure to ozone concentrations ranging from 0.05 to 0.1 ppm appeared to have minimal effect on BW; data are not available to address acute exposure and effects on BC or FC. However, based on the limited data, BW effects were not observed to be consistent across species following acute exposures to 0.8 or 1.0 ppm ozone. For example, in Wistar-Kyoto male rats, one 4-h/d, 2-d exposure to 0.8 ppm ozone showed a statistical decrease in BW (Henriquez et al. Citation2018) and one 4-h/d 1-d exposure to 1.0 ppm ozone showed a non-statistical decrease in BW (Miller et al. Citation2016c), while another 5-h, 1-d exposure to 1.0 ppm ozone in male CD-1 mice showed a statistical increase in BW (Graham et al. Citation1982). A single 5-h exposure to 3 ppm ozone did not affect BW (roughly equivalent) compared with control (air)-exposed Sprague-Dawley rats (Mole et al. Citation1985). Therefore, acute exposures of rats and mice to ozone up to 3.0 ppm did not appear to affect BW consistently.
Repeated inhalation exposures to ozone showed some indications of dose-response in its effect on BW based on duration and frequency, with little effect seen for exposures from 0.05 to 0.8 ppm for durations of 6 h or less. Three studies “continuously” exposed the animals to ozone, with a duration of 22–24 h/d, and reported roughly equal BW at 0.1 ppm ozone but decreased BW from 0.2 to 1.0 ppm ozone, with 7 to 14 d of exposure [ICR mice: (Umezu et al. Citation1993); Fischer 344 rats: (Watkinson et al. Citation1995); Hartley guinea pigs: (Vaughan et al. Citation1984)]. However, the decrease in BW recovered to control values during the repeated exposures for the 22 h/d, 7-d exposures in mice, except for the 0.8 ppm ozone exposures. Thus, repeated lengthy (22–24 h) exposures to 0.2 ppm ozone and above seemed to result in decreased BW, with recovery during exposures for some subgroups, but not all, despite continued exposure.
There was only a single study group where BW increased following ozone exposure. As mentioned above, a 5-h, 1-d exposure to 1.0 ppm ozone in male CD-1 mice showed a statistically significant increase in BW (Graham et al. Citation1982). However, in general, at ozone exposures below 0.8 ppm, it was observed that exposures must be lengthy (e.g. 22–24 h) in order to produce any effect on BW or BC (limited data).
For the remaining 41 study groups, including those comprised of rats, mice, and guinea pigs, when there was a change observed with ozone exposure compared with controls, it was a decrease in BW. This result is the opposite to the hypothesized direction of body weight and ozone exposure in terms of metabolic syndrome and diabetes. This observation is echoed in the limited BC data, where % fat was consistently either unchanged or decreased compared with controls. A consistent response of BW loss in animal models following inhalation exposure to ozone was observed across several laboratories and in different species. It should be noted that the study groups were subjected to high exposures of ozone. The recovery demonstrated by the limited number of study groups that included data after the termination of ozone exposure or even while the exposure continued in some cases indicated that this BW loss was likely a transitory effect. The available FC data were limited, and the results were mixed, with no obvious pattern related to ozone exposure level or duration/frequency.
Overall, there is no evidence to support an association between inhalation exposure to ozone and increased BW. Limited data on female animals and the lack of any long-term data on BW/BC/FC also hinders the analysis and any confidence in a conclusion on a possible association with increased BW/BC. However, there is evidence to support an association between ozone exposure and decreased BW. This is considered a more expected toxicologic outcome of inhalation exposure to high levels of a reactive gas, such as ozone. Thus, while collectively, these results do not indicate any significant association between inhalation ozone exposure and increased BW, they strongly support an association between ozone inhalation exposure and decreased BW. Thus, the evidence was categorized as a strong inverse association, as the observed effect was opposite to the hypothesis ().
Five studies evaluated associations between ozone and effects on body temperature (BT) (Mautz and Bufalino Citation1989; Watkinson et al. Citation1993, Citation1995; Gordon et al. Citation2014; Henriquez et al. Citation2018) (). The studies evaluating ozone exposure and effects on BT exclusively used male rats, with various strains represented, including Sprague-Dawley, Fischer 344, Wistar Kyoto, and Brown Norway. Ozone concentrations ranged from 0.2 to 1.0 ppm. Single exposures (2–3 h) to 0.2 (n = 8), 0.25 (n = 4–6), or 0.4 ppm (n = 8) ozone (Mautz and Bufalino Citation1989; Watkinson et al. Citation1993) did not change BT as compared with control (air)-exposed animals. However, in two additional study groups, single exposures (2 h) to 0.37 (n = 4–6) or 0.5 ppm (n = 4–6) ozone resulted in significant decreases in BT in ozone-exposed animals during the second hour of exposure (Watkinson et al. Citation1993). BT measurements in these animals during the first hour of exposure were not different from control (air)-exposed animals. No changes in BT were observed in animals (n = 4–5) subjected to a longer exposure regimen of 6 h/day for 5 days to 0.5 ppm ozone (Watkinson et al. Citation1995). In the same study, continuous exposure of the animals (n = 4–5) to 0.5 ppm for 23 h/day for 5 days resulted in inconsistent results. BT in ozone-exposed animals was significantly decreased on exposure day 1 but was unchanged from control (air)-exposed animals at days 2–5.
Table 13. Thyroid and body temperature results analysis after ozone exposure in rats (Suitable studies).
At higher ozone concentrations, including 0.6, 0.8, and 1.0 ppm ozone, short-term exposure (<1 week) resulted in some significant decreases in BT in ozone-exposed animals, particularly during the latter half of the exposure period (e.g. 120–180 vs. 0–100 min), while other study groups remained unchanged compared with control (air)-exposed animals (Mautz and Bufalino Citation1989; Watkinson et al. Citation1993; Henriquez et al. Citation2018). Gordon et al. (Citation2014) evaluated longer-term ozone exposure (6 h/day × 2 day/week for 13 weeks) to 1.0 ppm ozone in both adult (9-month-old) and senescent (21-month-old) animals. BT measurements taken in the final 2-h of each exposure day, averaged across the two consecutive exposure days for each exposure week, indicated that ozone exposure resulted in some significant decreases in BT during the exposure, depending on the week, with more of an effect observed in adult animals (n = 5–6) compared with senescent animals (n = 6). For both age groups, BT measurements taken during the first 12 h of the first recovery day of each exposure week were increased (often significantly) compared with control (air)-exposed animals, indicating that the effects of ozone on BT may be transient (Gordon et al. Citation2014).
Collectively, the available data on BT are limited and, although the results do indicate a tendency toward a decrease in BT during inhalation exposure to ozone at or above 0.8 ppm, the limited recovery data (single dataset) show an increase in BT compared with control (air)-exposed animals during each early post-exposure recovery period following inhalation exposure to 1.0 ppm ozone. Thus, with such a limited dataset, there is not adequate evidence to support any association between ozone exposure and BT (). The strength of the toxicologic evidence was therefore categorized as weak, because it is inconsistent in direction and is based upon only five publications and a limited number of study groups (). In addition, no data were available for female animals.
Table 14. Summary of animal toxicological PECOS evidence.
Six studies (Clemons and Garcia Citation1980a; Clemons and Wei Citation1984; Sen et al. Citation1993; Huffman et al. Citation2001, Citation2006; Martrette et al. Citation2011) evaluated associations between ozone and effects on thyroid hormone homeostasis (). Three (Huffman et al. Citation2001, Citation2006; Martrette et al. Citation2011) were considered Suitable for evidence synthesis, while data from the remaining three studies (Clemons and Garcia Citation1980a; Clemons and Wei Citation1984; Sen et al. Citation1993) were included as Supplemental only (see above). Aside from Martrette et al. (Citation2011), which used female Wistar rats, all the studies used male Sprague-Dawley rats as the animal model. Among them, ozone concentrations ranged from 0.12 to 3.0 ppm. At 0.12 ppm ozone, Martrette et al. (Citation2011) reported that ozone exposures of 6 h/day for 15 days resulted in significantly increased free T3 (FT3) levels in female rats. While not statistically significant, an increase in free T4 (FT4) levels was also reported for ozone-exposed animals. Huffman et al. (Citation2006) reported a non-significant decrease in T4 levels (n = 5–6) after exposure to ozone at 1.0 ppm for 4 h. In addition, Huffman et al. (Citation2001) reported no change in T4 levels (n = 5–6) after exposure to ozone at 3.0 ppm for 3 h. From the studies in which the data were included as Supplemental, Clemons and Garcia (Citation1980a), Clemons and Wei (Citation1984), and Sen et al. (Citation1993) reported that ozone exposure at 1.0 ppm resulted in significant decreases in various thyroid hormones, including TSH, T4, T3, FT4, and FT3, in ozone-exposed animals compared with control (air)-exposed animals. However, as noted, these studies omitted critical information (e.g. missing n values, no information on ozone generation or exposure methods).
Overall, the toxicologic evidence is quite limited and inconsistent, and therefore the information available was categorized as weak ().
3.4. Evidence integration
In this section, judgments are presented about the strength of the combined human and animal evidence, as derived from the evidence synthesis step, for the association between ozone inhalation exposure and each PECO statement health outcome (overweight/obesity, T1D, T2D, and metabolic syndrome) (see , Methods section).
3.4.1. Ozone inhalation exposure and overweight/obesity
The strength of the epidemiology evidence was categorized as weak based on the limited number of studies (two) with different study designs, and inconsistent results. The animal studies related to this outcome were those that addressed effects on body weight, temperature increase, thyroid effects, and dyslipidemia. The available data on body temperature and thyroid hormone changes were quite limited and there was insufficient evidence to support an association between ozone exposure and these outcomes. The available data on body weight, based on 16 publications, comprising 42 study groups evaluated in three species, demonstrated a strong inverse effect (decreased body weight), which may have been transient; the strength of the body weight evidence was categorized as strongly inverse, associating inhalation exposure to ozone with a decrease in body weight. Finally, for dyslipidemia, the study results collectively did not indicate any significant association between inhalation ozone exposure and effects on serum lipids, and the strength of the toxicologic evidence was categorized as weak. Thus, the overall strength of the experimental animal evidence stream in supporting increased body weight with ozone exposure was characterized as weak.
Because the evidence streams for both epidemiology and toxicologic studies were categorized as weak, we concluded that there is insufficient evidence to draw conclusions regarding a causal association for ozone inhalation and overweight/obesity ().
Figure 5. Integration of the human and animal streams of evidence for assessing causality for the four metabolic outcomes. *For T2D, the glucose tolerance test/fasting hyperglycemia toxicology evidence was strong and the other toxicology evidence was weak. There was no definitive basis for concluding that the combined toxicology evidence was strong or weak. Therefore, the strength of the toxicology evidence for T2D is considered unresolved. This led to an overall conclusion of insufficient or suggestive for T2D.
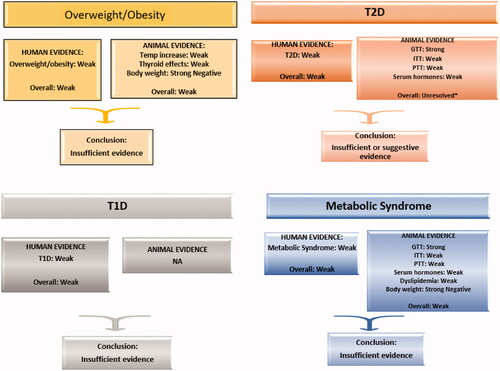
3.4.2. Ozone inhalation exposure and T2D
Both short-term human exposure studies, which examined biochemical indicators of T2D, and long-term human studies for which T2D was the assessed outcome, were categorized as weak due to the limited number of studies (short-term) and inconsistent results with no clear reasons for discrepancies (both short-term and long-term). In contrast, for the experimental animal studies, the strength of the evidence was categorized as strong for outcomes related to glucose intolerance and related fasting/baseline hyperglycemia. However, for animal studies of insulin resistance, hepatic gluconeogenesis, and glucose-related serum hormone analytes, the strength of the evidence was categorized as weak. Reasons for these outcome-specific differences are not apparent and there is no clear approach for determining whether this combined toxicology evidence should be categorized as weak or strong. Until further research clarifies this issue, the evidence is considered unresolved.
These mixed conclusions regarding the strength of the evidence for the two evidence streams (and across the toxicologic endpoints) led to the conclusion that the association between inhalation exposure to ozone and T2D is insufficient or suggestive ().
3.4.3. Ozone inhalation and pediatric diabetes (T1D)
The epidemiology literature on associations between ozone exposure and pediatric diabetes was categorized as weak due to inconsistent results and inter-study exposure periods that may not be comparable. There were no toxicologic endpoints that were considered specific to T1D so only one evidence stream was considered. From this, it was concluded that there is insufficient evidence from which to draw conclusions regarding whether ozone inhalation causes T1D ().
3.4.4. Ozone inhalation exposure and metabolic syndrome
The epidemiology research on associations between ozone exposure and metabolic syndrome was categorized as weak based on null results from a single study. Similar to the overweight/obesity outcome, the experimental animal studies’ outcomes related to some aspects of metabolic syndrome (e.g. dyslipidemia) were limited and categorized as weak. For dyslipidemia, the study results did not indicate any significant association between ozone inhalation and effects on serum lipids and the strength of the experimental animal evidence was again categorized as weak. Evidence from animal body weight data was considered strong for the association between decreased body weight and ozone exposure, which is opposite of the hypothesized direction (i.e. strong inverse association). However, evidence from studies examining ozone exposure and glucose intolerance in animals was considered strong, although other glucose-related outcomes (insulin sensitivity, hepatic GNG, and serum hormone analytes) were considered weak. In summary, two lines of evidence were strong, but one was strongly supporting while the other was strongly opposing; the remaining four lines of evidence were weak. Further, the clinical definition of metabolic syndrome requires that three of five specific criteria be met. Thus, it was concluded that the overall animal evidence is weak.
The combination of weak epidemiology and animal evidence resulted in a conclusion of insufficient evidence regarding a causal association for ozone inhalation and metabolic syndrome ().
4. Discussion
This review had the goal of conducting a systematic review of the evidence for associations between ozone exposure and metabolic effects in humans. Here we offer perspectives on the lessons learned from the framework used here, common human study considerations, our findings in comparison to past reviews, the relationship of our results to other mechanistic information, and data gaps.
4.1. Framework lessons
In this review we followed the now-standard approach of PECO formulation, the use of robust methods for identifying and selecting studies, and the extraction of key data from studies to enhance side-by-side comparisons (Liberati et al. Citation2009; NTP Citation2019; US EPA Citation2020b). For evidence synthesis and confidence characterization, we utilized a more concise and less algorithmic approach compared to other systematic review approaches. For example, we began this process by identifying elements considered to be essential for evaluating whether the identified epidemiologic and in vitro/in vivo animal studies were of sufficient suitability to be carried forward to evidence synthesis and integration. This approach essentially incorporated a “bright line” by dividing Suitable from Supplemental studies. While possible signals from the Supplemental studies were described, these studies were not incorporated into the final body of evidence for causal inference. With respect to the epidemiologic literature, the Supplemental studies could not discern if the exposure preceded that health outcome and are better suited for hypothesis-generation. The toxicological papers that were judged to be Supplemental were deficient in at least one of the five required elements (already fairly minimal) and some were deficient in several elements. Thus, any dataset missing even just one of these critical five elements was not considered reliable enough to use to support extrapolation of any results for causality. We acknowledge that excluding studies can result in reducing the breadth and depth of the literature. In fact, using our approach, 19 of the 34 epidemiologic studies and 11 of 44 of the in vitro/in vivo studies were determined to be Supplemental. However, we emphasize that certain aspects of a study render it inappropriate for causal inference and that this should be recognized. In fact, for several of the papers reviewed here, the primary authors themselves noted the inappropriateness of using their results for evidence integration (e.g. Yang et al. Citation2019b).
We further argue that completing an extensive rubric of quality elements but then treating all studies equally in evidence synthesis regardless of their limitations is not an efficient use of resources nor does it provide a clear understanding regarding how the different studies were used in evidence synthesis. In addition, including only those quality elements considered to be essential reduces the need for a “scoring” type approach, which becomes necessary when large numbers of quality elements are included; the limitations of scoring approaches have been discussed previously (Jüni et al. Citation1999; Whiting et al. Citation2005; LaKind et al. Citation2014).
4.2. Common human study considerations
Generally, an assessment of a body of literature for its suitability for evidence synthesis would include an evaluation of the quality of the exposure assessments in each study. For example, EPA (Citation2020b) considered the following: Does the exposure measure capture the variability in exposure among the participants, considering intensity, frequency, and duration of exposure? Does the exposure measure reflect a relevant time window? If not, can the relationship between measures in this time window and the relevant time window be estimated reliably?
For ozone and metabolic health outcomes, these questions present a challenge. First, when considering the temporal relationship between exposure and outcome, it is important that the study design includes an appropriate duration of exposure and lag time to support a biologically plausible association between exposure and outcome. This issue was noted in the ISA (US EPA Citation2020a) as follows: “Inference is stronger when the duration or lag of the exposure metric corresponds with the time course for physiological changes in the outcome (e.g. up to a few days for symptoms) or latency of disease (e.g. several years for cancer).” However, at issue for the ozone exposure/metabolic outcome association is that neither the necessary, i.e. “correct,” duration nor the latency period was well-established. A review of air pollution studies and chronic disease found no consistent relationship between exposure duration (ranging from 60 days to 35 years) and outcomes including diabetes (Lipfert Citation2018). For another review of studies on air pollution, smoking, and lung cancer mortality, Lipfert and Wyzga (Citation2019) found that studies did not include latency, exposure duration, or temporal trends; similar issues impact the ozone/metabolic outcome literature. Further complicating the determination of appropriate exposure assessment time and duration is the proposed link between prenatal/postnatal exposures and later development of obesity, diabetes, and metabolic syndrome (Wang et al. Citation2014). These exposure windows were, for the most part, not included in the studies reviewed here. In general, as noted by McKone (Citation2009), “[s]electing an optimum measurement or modeling-based exposure prediction strategy has to be based on consideration of the timescale over which the biological effect occurs.”
Second, the exposure assessments (with the exception of the single experimental study by Miller et al. Citation2016a) were generally based on data from one or more monitoring stations, with the assumption that ozone concentrations can serve as an exposure proxy for an individual (or population) (Bravo and Bell Citation2011). It is also often assumed that ozone concentrations are relatively homogenous over large areas, except for locations near roadways (US EPA Citation2020a). However, numerous studies have described temporal and spatial variability in outdoor ozone concentrations for both short-term and long-term exposures (Liu et al. Citation1997; US EPA Citation2001; Bell Citation2006; Bravo and Bell Citation2011; Bravo et al. Citation2012; Cheadle et al. Citation2017; Sadighi et al. Citation2018; Wells et al. Citation2019; Liu et al. Citation2020). Further, monitoring locations can introduce bias as they may over- or under-represent some populations, particularly if they do not consider peak concentrations (Bravo and Bell Citation2011; Wells et al. Citation2019). Liu (Citation1997) observed that personal ozone exposures may be markedly different from outdoor stationary ozone measurements, and that personal ozone exposure is not well-predicted by outdoor measurements. Spatial and temporal variability is further complicated by indoor ozone exposures, as indoor and outdoor levels differ, and many people spend most of their time indoors. For example, in a recent study examining the relationship between indoor and outdoor exposures to ozone, Barkjohn et al. (Citation2020) reported that “[a]verage personal exposures to O3 ranged from below the limit of detection (6 ppb) to 22 ppb with a median exposure of 10 ppb (average = 11 ppb); the median outdoor O3 during this period was 34 ppb (average = 37 ppb).” They also observed large variations in indoor/outdoor ozone concentrations when examining different microenvironments, with 1-h levels ranging from the limit of detection (<6 ppb) to 69 ppb. Daily inhalation intakes of indoor ozone have been estimated at around 25–60% of total daily ozone intake (Weschler Citation2006) and studies have shown wide ranges of indoor ozone exposure in schools and offices (Salonen et al. Citation2018) that are unaccounted for in the studies reviewed here. Further, the studies included in this review did not account for movement of people throughout the day (e.g. between home and work).
Additional issues may impact the strength of the exposure assessment, including whether co-pollutants are correlated with ozone (e.g. NO2) (Kerckhoffs et al. Citation2015), the extent to which meteorological data were included in the assessment, and the spatial unit (i.e. granularity) of the measurement data. It is also worth noting that the combined effect of air pollution exposure and exercise on health outcomes warrants study and was generally not considered in most of the reviewed publications (Qin et al. Citation2019).
For all 33 observational studies and their relevant outcomes reviewed here, there was clear potential for exposure misclassification, reducing the overall confidence in the results. Moreover, none of the papers included a quantitative characterization of the error in their exposure assessments due to spatial or temporal variability. Thus, the extent to which these issues introduced the likelihood of exposure misclassification is not known. Finally, whether inter- or intra-study consistency or inconsistency of the results was related to the temporal or geographic scale of measurements, averaging times, exposure model used, latency times, or co-pollutant considerations cannot be discerned for the studies included in this review.
4.3. Conclusions in this review in comparison to other reviews
In this review, the human and the experimental animal literature were examined to determine the strength of the evidence regarding associations between ozone inhalation and four outcomes related to metabolic effects. For three of the four PECO questions relating to T1D, overweight/obesity and metabolic syndrome, we concluded that the evidence is currently insufficient for causal determination. Interestingly, for T2D, a single conclusion could not be easily drawn from the evidence because the animal evidence was mixed and the authors differed on whether a single strong stream of evidence, coupled with four weak streams and a strong inverse stream, yielded an overall strong or weak signal. This, in combination with weak epidemiology evidence, led to a finding of either insufficient or suggestive evidence for the combined animal and human streams.
In contrast, the recent EPA ISA review concluded that there is a likely causal relationship with short-term ozone exposure and a suggestive, but not sufficient to infer, causal relationship with long-term ozone exposure and metabolic effects. There are important differences in this current approach to the review of the literature as compared to the EPA (Citation2020a) review.
First, EPA treated metabolic outcomes as an overall category but considered exposure duration separately. In the current review, we developed PECO questions to differentiate the literature associated with each of the four outcomes and reviewed the duration of exposure within each PECO (we recognize that some reviews are designed to support short- vs. long-term limits on pollutants and for those, the PECO statements may need to formally evaluate exposure duration). This is in concordance with the importance of a well-formulated research question (Morgan et al. Citation2019). By considering apical outcomes separately, we could carefully consider the strengths, weaknesses, and comparability of the literature. The concept of combining vs. separating outcomes for PECO questions in the systematic review process warrants further discussion not just for metabolic outcomes but for a wide range of outcomes (e.g. this issue was briefly described for neurodevelopmental outcomes in LaKind et al. Citation2017).
Second, EPA conducted its quality assessment with many review elements using a narrative approach (https://hawcprd.epa.gov/study/assessment/100500031/). EPA stated that it sought high quality studies for assessing causal relationships between ozone and adverse health effects, but it is not clear how the judgment of high quality was made or used. While it appears that EPA considered all study results equally, our review applied a “bright line”; evidence integration was limited to those studies considered “Suitable” based on fundamental quality criteria. Several studies used by EPA in evidence integration were not determined to be Suitable for causal inference in this review.
Similarities between this review and the EPA ISA (US EPA Citation2020a) should be noted. Specifically, regarding the experimental animal data, EPA stated: “…animal toxicologic studies demonstrate that ozone exposure impaired glucose tolerance, increased triglycerides in serum, fasting hyperglycemia, and increased hepatic gluconeogenesis” (US EPA Citation2020a). The results of the current review agree that there is strong evidence of an association between ozone exposure at high concentrations (≥0.8 ppm) and greater incidence of glucose intolerance and fasting hyperglycemia. These findings were true regardless of whether the ozone exposure was short-term or subchronic; however, increasing duration and/or repeated exposure did not result in an increased effect. Still, our conclusions differed from the EPA findings for the other related outcomes in the toxicology studies; we concluded that the evidence was weak for any association between ozone exposure and changes to serum triglycerides and/or hepatic gluconeogenesis. Collectively, the data regarding these outcomes were either extremely limited or the results were inconsistent across studies and exposure levels/durations, with no clear pattern.
The difference in overall conclusions between the current review and EPA is likely due to a combination of factors. The literature search in this review was inclusive of publications appearing in 2020 and included additional publications beyond those reviewed in the ISA, some of which conflicted with prior data (e.g. Li et al. Citation2019; Elten et al. Citation2020; Starling et al. Citation2020). As mentioned above, studies labeled as Supplemental in the quality evaluation were not part of the evidence integration for the current review. Using distinct outcomes in the PECO statement rather than combining the literature across outcomes under the umbrella of “metabolic outcomes” clearly results in differences in conclusions as this review was able to draw distinct conclusions for four health effects. Further, we cannot predict with any certainty the impact on EPA’s conclusions had it combined studies of short-term and long-term exposures. We note that our conclusions would not have changed had we treated short-term and long-term exposure epidemiology studies independently. Perhaps most importantly, we raise the question: while our overall conclusions differ from the EPA's, are these differences important? Neither review concluded there was sufficient evidence for causality nor was there evidence to state that ozone is not likely causal for long-term exposure to ozone. EPA did conclude that there was sufficient evidence to support a likely causal relationship between short-term ozone exposure and metabolic effects, but in this review, we did not examine these exposure durations separately.
4.4. Relationship of the results of this review to mechanistic information
An MOA analysis, including a detailed review of available mechanistic data, can be helpful for determining the biological plausibility of evidence streams that demonstrate a possible association. In addition, qualitative and/or quantitative MOA differences between experimental species and humans can be evaluated to provide important insights into the human relevance of experimental animal data. However, given the lack of any conclusions supporting a causal role for ozone-induced effects related to the PECO statements in this review, there was no obvious hypothesis to drive such an MOA analysis. Nonetheless, our findings indicate a strong association between ozone exposure and certain glucose-related effects in experimental animals. Glucose intolerance and hyperglycemia increased with increasing exposure level beginning consistently at 0.8 ppm ozone and above; however, there was less confidence that increased duration of exposure or longer exposure frequency resulted in consistently increased ozone-induced metabolic effects. While limited, the available experimental animal evidence suggests that these acute metabolic effects may be short-lived, with homeostasis restored shortly (18 h) after cessation of exposure. In addition, repeated episodic exposures may result in an attenuation of the ozone-induced effects, possibly due to the initiation of an adaptive response.
Some evidence indicates that neurohumoral sympathetic modulation may be involved in the mechanism of ozone-induced fasting hyperglycemia and glucose intolerance (Bass et al. Citation2013; Kodavanti et al. Citation2015; Kodavanti Citation2019). In particular, the hypothesis suggests that ozone induces a neuroendocrine stress response, activating the hypothalamic-pituitary-adrenal (HPA) and sympathetic-adrenal-medullary (SAM) axes, which can lead to increased circulating epinephrine and glucocorticoids, including corticosterone, although the available data are not consistent (Miller et al. Citation2015; Snow et al. Citation2018; Henriquez et al. Citation2019, Citation2020). In this process, increased epinephrine and glucocorticoid release would upregulate hepatic GNG and glycogenolysis, likely leading to an increase in blood glucose and an inhibition of beta cell insulin secretion and impaired glucose uptake through the glucocorticoid receptors (Kuo et al. Citation2015; Miller et al. Citation2016b). In support of this notion, while some studies have shown that high concentrations of ozone can induce systemic metabolic effects in rats, such as fasting hyperglycemia and glucose intolerance, sometimes also with increased circulating levels of epinephrine and corticosterone, these effects are partially or fully blocked in rats subjected to bilateral adrenal demedullation or total bilateral adrenalectomy (Miller et al. Citation2016c). In addition, exacerbation of ozone-induced systemic effects has been reported in rats treated with β2-adrenergic and glucocorticoid receptor agonists, whereas these effects are mitigated in rats treated with adrenergic and glucocorticoid receptor antagonists (Snow et al. Citation2018; Henriquez et al. Citation2019, Citation2020). Emerging evidence suggests that the tissue distribution of these receptors, along with the presence of individual variability, may represent a critical factor in these specific ozone-induced metabolic effects (Kodavanti Citation2019). Although some data report that ozone has been shown to activate the HPA and SAM axes, the initiating events of autonomic activation remain unclear, particularly the role of vagal sensory nerves and/or circulating mediators that may act on different brain regions, such as the hypothalamus. However, we did not find consistent evidence of increased corticosterone following ozone exposure, nor consistent evidence of increased hepatic GNG, to support this proposed MOA.
4.5. Data gaps
As stated above, certain gaps in the toxicology and epidemiology literature likely contributed to the conclusions reached in this review. We describe a few of these gaps here.
The animal toxicologic studies lacked data related to chronic ozone exposure and only a limited number of datasets were available to evaluate whether the effects of ozone were transient or long-lasting. The few studies with post-exposure recovery periods allowed for only 18 h or 1 week recovery and were not repeated to demonstrate whether the apparent recovery was reproducible following another set of exposures. As a result, future research that includes chronic exposure data will assist in the understanding of whether adaptation to ozone occurs in exposed animals such that any effect on glucose tolerance and/or hyperglycemia may be considered transient or long-lasting.
Within the epidemiologic research, issues around properly characterizing short- and long-term exposures are well-known (and were described earlier in this paper). Improved information on temporal and spatial variability and indoor vs. outdoor exposures is needed. Information on critical windows of exposure would improve researchers’ ability to obtain biologically relevant exposure information. Additionally, while difficult to accomplish, future studies would be improved by the collection of information on study subjects that may correlate with both exposure and disease risk. At present, it is not known whether the lack of this information would result in an over- or under-estimate of risk.
5. Conclusions
We evaluated the epidemiology and toxicology literature on ozone and metabolic outcomes using a streamlined systematic review approach. For T1D, overweight/obesity, and metabolic syndrome, the available evidence is insufficient for causal assessment. For T2D, the evidence is conflicting and the overall conclusion unresolved, with the authors of this paper supporting a conclusion of insufficient evidence or suggestive evidence. The differences in these conclusions compared to those of the US EPA are likely explained by differences in the approach to developing PECO statements, the literature included in the review, and the process used for evidence integration.
The growing body of systematic review guidelines is becoming increasingly complex. As systematic review processes continue to evolve, it is worth exploring the following challenging questions:
To what extent should related health outcomes be combined or kept distinct?
Can the elements used to select studies suitable for causal inference be tightly focused to enhance transparency in the evaluation?
How fine a gradation should be included in evidence integration tiers and what purposes do additional categories serve?
Acknowledgments
Our thanks to Josh Naiman, LaKind Associates, LLC, for literature database management and assistance with quality assurance. We also appreciate Jon Hotchkiss’ (Inhalation Toxicology Consultants) insights into inhalation toxicology. In addition, we thank Wenchao Li and Jieqiong Zhou (both with Gradient Corporation) for valuable discussions and assistance with quality assurance. Finally, we thank the three anonymous reviewers for their careful reviews of the manuscript. API was given a courtesy copy of the draft manuscript but made no comments. The review, synthesis, and conclusions reported in this paper are the exclusive professional work product of the authors and do not necessarily represent the views of the API or the member companies.
Declaration of interest
Judy LaKind, Carol Burns, Lynn Pottenger, Satori Marchitti, and Julie Goodman consult to governmental and/or private sectors. Dr. Burns and Dr. Pottenger were previously employed by The Dow Chemical Company; Dr. Pottenger was also employed by Olin Corporation. Dr. Marchitti was previously employed by the US EPA. Currently, Drs. Burns and Pottenger have established independent consulting practices. Dr. Goodman has reviewed and commented on EPA evaluations of ozone as part of the NAAQS process with funding from API. She has also published several papers on ozone funded by API and TCEQ.
This work was supported by the American Petroleum Institute (API), which issued an RFP requesting proposals to conduct this research. DQN was supported through a contract with the Johns Hopkins University; funding was from API via a contract with LaKind Associates, LLC. API is the major trade association of corporations in the petroleum sector, from discovery through production and refining. API was not involved in the design, collection, management, analysis, or interpretation of the data, or in the preparation or approval of the manuscript. The API was given a courtesy copy of the draft manuscript but made no comments. The authors retain sole responsibility for the writing and content of this paper, which represent the professional opinions of the authors and not necessarily those of API or its member companies. The review, synthesis, and conclusions reported in this paper are the exclusive professional work product of the authors and do not necessarily represent the views of the API or the member companies.
Supplemental material
Supplemental material for this article is available online here.
References
- Adami H-O, Berry SCL, Breckenridge CB, Smith LL, Swenberg JA, Trichopoulos D, Weiss NS, Pastoor TP. 2011. Toxicology and epidemiology: improving the science with a framework for combining toxicological and epidemiological evidence to establish causal inference. Toxicol Sci. 122(2):223–234.
- Aibo DI, Birmingham NP, Lewandowski R, Maddox JF, Roth RA, Ganey PE, Wagner JG, Harkema JR. 2010. Acute exposure to ozone exacerbates acetaminophen-induced liver injury in mice. Toxicol Sci. 115(1):267–285.
- Alberti KGMM, Eckel RH, Grundy SM, Zimmet PZ, Cleeman JI, Donato KA, Fruchart J-C, James WPT, Loria CM, Smith SC, et al. 2009. Harmonizing the metabolic syndrome: a joint interim statement of the International Diabetes Federation Task Force on Epidemiology and Prevention; National Heart, Lung, and Blood Institute; American Heart Association; World Heart Federation; International Atherosclerosis Society; and International Association for the Study of Obesity. Circulation. 120(16):1640–1645.
- Barkjohn KK, Norris C, Cui X, Fang L, He L, Schauer JJ, Zhang Y, Black M, Zhang J, Bergin MH, et al. 2020. Children's microenvironmental exposure to PM2.5 and ozone and the impact of indoor air filtration. J Expo Sci Environ Epidemiol. 30(6):971–980.
- Bass V, Gordon CJ, Jarema KA, MacPhail RC, Cascio WE, Phillips PM, Ledbetter AD, Schladweiler MC, Andrews D, Miller D, et al. 2013. Ozone induces glucose intolerance and systemic metabolic effects in young and aged brown Norway rats. Toxicol Appl Pharmacol. 273(3):551–560.
- Bell ML. 2006. The use of ambient air quality modeling to estimate individual and population exposure for human health research: a case study of ozone in the Northern Georgia Region of the United States. Environ Int. 32(5):586–593.
- Bravo MA, Bell ML. 2011. Spatial heterogeneity of PM10 and O3 in Sao Paulo, Brazil, and implications for human health studies. J Air Waste Manage Assoc. 61(1):69–77.
- Bravo MA, Fuentes M, Zhang Y, Burr MJ, Bell ML. 2012. Comparison of exposure estimation methods for air pollutants: ambient monitoring data and regional air quality simulation. Environ Res. 116:1–10.
- Cestonaro LV, Marcolan AM, Rossato-Grando LG, Anzolin AP, Goethel G, Vilani A, Garcia SC, Bertol CD. 2017. Ozone generated by air purifier in low concentrations: friend or foe? Environ Sci Pollut Res Int. 24(28):22673–22678.
- Cheadle L, Deanes L, Sadighi K, Gordon Casey J, Collier-Oxandale A, Hannigan M. 2017. Quantifying neighborhood-scale spatial variations of ozone at open space and urban sites in Boulder, Colorado using low-cost sensor technology. Sensors. 17(9):2072.
- Chen Z, Salam MT, Toledo-Corral C, Watanabe RM, Xiang AH, Buchanan TA, Habre R, Bastain TM, Lurmann F, Wilson JP, et al. 2016. Ambient air pollutants have adverse effects on insulin and glucose homeostasis in Mexican Americans. Diabetes Care. 39(4):547–554.
- Chin WS, Chang YK, Huang LF, Tsui HC, Hsu CC, Guo YL. 2018. Effects of long-term exposure to CO and PM2.5 on microalbuminuria in type 2 diabetes. Int J Hyg Environ Health. 221(4):602–608.
- Chuang KJ, Yan YH, Cheng TJ. 2010. Effect of air pollution on blood pressure, blood lipids, and blood sugar: a population-based approach. J Occup Environ Med. 52(3):258–262.
- Chuang KJ, Yan YH, Chiu SY, Cheng TJ. 2011. Long-term air pollution exposure and risk factors for cardiovascular diseases among the elderly in Taiwan. Occup Environ Med. 68(1):64–68.
- Clemons GK, Garcia JF. 1980a. Changes in thyroid function after short-term ozone exposure in rats. J Environ Pathol Toxicol. 4(1):359–369.
- Clemons GK, Garcia JF. 1980b. Endocrine aspects of ozone exposure in rats. Arch Toxicol Suppl. 4:301–304.
- Clemons GK, Wei D. 1984. Effect of short-term ozone exposure on exogenous thyroxine levels in thyroidectomized and hypophysectomized rats. Toxicol Appl Pharmacol. 74(1):86–90.
- Collins AM, Coughlin D, Randall N. 2019. Engaging environmental policy-makers with systematic reviews: challenges, solutions and lessons learned. Environ Evid. 8(1):2.
- Creţu DI, Sovrea A, Ignat RM, Filip A, Bidian C, Creţu A. 2010. Morpho-pathological and physiological changes of the brain and liver after ozone exposure. Rom J Morphol Embryol. 51(4):701–706.
- Dales RE, Cakmak S, Vidal CB, Rubio MA. 2012. Air pollution and hospitalization for acute complications of diabetes in Chile. Environ Int. 46:1–5.
- Deener KCK, Sacks JD, Kirrane EF, Glenn BS, Gwinn MR, Bateson TF, Burke TA. 2018. Epidemiology: a foundation of environmental decision making. J Expo Sci Environ Epidemiol. 28(6):515–521.
- Di Ciaula A. 2016. Type I diabetes in paediatric age in Apulia (Italy): incidence and associations with outdoor air pollutants. Diabetes Res Clin Pract. 111:36–43.
- Dong G-H, Qian ZM, Liu M-M, Wang D, Ren W-H, Flick LH, Fu J, Wang J, Chen W, Simckes M, et al. 2014. Ambient air pollution and the prevalence of obesity in Chinese children: the seven northeastern cities study. Obesity. 22(3):795–800.
- Elten M, Donelle J, Lima I, Burnett RT, Weichenthal S, Stieb DM, Hystad P, van Donkelaar A, Chen H, Paul LA, et al. 2020. Ambient air pollution and incidence of early-onset paediatric type 1 diabetes: a retrospective population-based cohort study. Environ Res. 184:109291.
- ErkenBrack DE, Clemons GK. 1988. Modulation of thyroid hormone receptors by non-thyroidal stimuli. J Recept Res. 8(6):839–852.
- Falci L, Lee Argov EJ, Van Wye G, Plitt M, Soto A, Huynh M. 2018. Examination of cause-of-death data quality among New York City deaths due to cancer, pneumonia, or diabetes from 2010 to 2014. Am J Epidemiol. 187(1):144–152.
- Goodman JE, Prueitt RL, Harbison RD, Johnson GT. 2020. Systematically evaluating and integrating evidence in National Ambient Air Quality Standards reviews. Glob Epidemiol. 2:100019.
- Goodman M, Squibb K, Youngstrom E, Anthony LG, Kenworthy L, Lipkin PH, Mattison DR, Lakind JS. 2010. Using systematic reviews and meta-analyses to support regulatory decision making for neurotoxicants: lessons learned from a case study of PCBs. Environ Health Perspect. 118(6):727–734.
- Goodman M, Lakind JS, Mattison DR. 2014. Do phthalates act as obesogens in humans? A systematic review of the epidemiological literature. Crit Rev Toxicol. 44(2):151–175.
- Gordon CJ, Jarema KA, Lehmann JR, Ledbetter AD, Schladweiler MC, Schmid JE, Ward WO, Kodavanti UP, Nyska A, MacPhail RC, et al. 2013. Susceptibility of adult and senescent Brown Norway rats to repeated ozone exposure: an assessment of behavior, serum biochemistry and cardiopulmonary function. Inhal Toxicol. 25(3):141–159.
- Gordon CJ, Johnstone AF, Aydin C, Phillips PM, MacPhail RC, Kodavanti UP, Ledbetter AD, Jarema KA. 2014. Episodic ozone exposure in adult and senescent Brown Norway rats: acute and delayed effect on heart rate, core temperature and motor activity. Inhal Toxicol. 26(7):380–390.
- Gordon CJ, Phillips PM, Beasley TE, Ledbetter A, Aydin C, Snow SJ, Kodavanti UP, Johnstone AF. 2016a. Pulmonary sensitivity to ozone exposure in sedentary versus chronically trained, female rats. Inhal Toxicol. 28(7):293–302.
- Gordon CJ, Phillips PM, Johnstone AFM, Beasley TE, Ledbetter AD, Schladweiler MC, Snow SJ, Kodavanti UP. 2016b. Effect of high-fructose and high-fat diets on pulmonary sensitivity, motor activity, and body composition of brown Norway rats exposed to ozone. Inhal Toxicol. 28(5):203–215.
- Gordon CJ, Phillips PM, Johnstone AFM, Schmid J, Schladweiler MC, Ledbetter A, Snow SJ, Kodavanti UP. 2017a. Effects of maternal high-fat diet and sedentary lifestyle on susceptibility of adult offspring to ozone exposure in rats. Inhal Toxicol. 29(6):239–254.
- Gordon CJ, Phillips PM, Ledbetter A, Snow SJ, Schladweiler MC, Johnstone AF, Kodavanti UP. 2017b. Active vs. sedentary lifestyle from weaning to adulthood and susceptibility to ozone in rats. Am J Physiol Lung Cell Mol Physiol. 312(1):L100–l109.
- Graham JA, Miller FJ, Gardner DE, Ward R, Menzel DB. 1982. Influence of ozone and nitrogen dioxide on hepatic microsomal enzymes in mice. J Toxicol Environ Health. 9(5–6):849–856.
- Guyatt GH, Oxman AD, Vist GE, Kunz R, Falck-Ytter Y, Alonso-Coello P, Schünemann HJ, GRADE Working Group. 2008. GRADE: an emerging consensus on rating quality of evidence and strength of recommendations. BMJ. 336(7650):924–926.
- Hathaway JA, Terrill RE. 1962. Metabolic effects of chronic ozone exposure on rats. Am Ind Hyg Assoc J. 23:392–395.
- Hathout EH, Beeson WL, Ischander M, Rao R, Mace JW. 2006. Air pollution and type 1 diabetes in children. Pediatr Diabetes. 7(2):81–87.
- Henriquez AR, Snow SJ, Schladweiler MC, Miller CN, Dye JA, Ledbetter AD, Richards JE, Hargrove MM, Williams WC, Kodavanti UP, et al. 2018. Beta-2 adrenergic and glucocorticoid receptor agonists modulate ozone-induced pulmonary protein leakage and inflammation in healthy and adrenalectomized rats. Toxicol Sci. 166(2):288–305.
- Henriquez AR, Snow SJ, Schladweiler MC, Miller CN, Dye JA, Ledbetter AD, Hargrove MM, Richards JE, Kodavanti UP. 2019. Exacerbation of ozone-induced pulmonary and systemic effects by β2-adrenergic and/or glucocorticoid receptor agonist/s. Sci Rep. 9(1):17925.
- Henriquez AR, Snow SJ, Schladweiler MC, Miller CN, Kodavanti UP. 2020. Independent roles of beta-adrenergic and glucocorticoid receptors in systemic and pulmonary effects of ozone. Inhal Toxicol. 32(4):155–169.
- Hernandez AM, de Porras DGR, Marko D, Whitworth KW. 2018. The association between PM2.5 and ozone and the prevalence of diabetes mellitus in the United States, 2002 to 2008. J Occup Environ Med. 60(7):594–602.
- Holland N, Dave V, Venkat S, Wong H, Donde A, Balmes JR, Arjomandi M. 2015. Ozone inhalation leads to a dose-dependent increase of cytogenetic damage in human lymphocytes. Environ Mol Mutagen. 56(4):378–387.
- Huffman LJ, Beighley CM, Frazer DG, McKinney WG, Porter DW. 2006. Increased susceptibility of the lungs of hyperthyroid rats to oxidant injury: specificity of effects. Toxicology. 225(2–3):119–127.
- Huffman LJ, Judy DJ, Brumbaugh K, Frazer DG, Reynolds JS, McKinney WG, Goldsmith WT. 2001. Hyperthyroidism increases the risk of ozone-induced lung toxicity in rats. Toxicol Appl Pharmacol. 173(1):18–26.
- Jerrett M, Brook R, White LF, Burnett RT, Yu J, Su J, Seto E, Marshall J, Palmer JR, Rosenberg L, et al. 2017. Ambient ozone and incident diabetes: a prospective analysis in a large cohort of African American women. Environ Int. 102:42–47.
- Johnston RA, Theman TA, Shore SA. 2006. Augmented responses to ozone in obese carboxypeptidase E-deficient mice. Am J Physiol Regul Integr Comp Physiol. 290(1):R126–R133.
- Jüni P, Witschi A, Bloch R, Egger M. 1999. The hazards of scoring the quality of clinical trials for meta-analysis. JAMA. 282(11):1054–1060.
- Kerckhoffs J, Wang M, Meliefste K, Malmqvist E, Fischer P, Janssen NAH, Beelen R, Hoek G. 2015. A national fine spatial scale land-use regression model for ozone. Environ Res. 140:440–448.
- Kim H, Kim W, Choi JE, Kim C, Sohn J. 2018. Short-term effect of ambient air pollution on emergency department visits for diabetic coma in Seoul, Korea. J Prev Med Public Health. 51(6):265–274.
- Kim JH, Hong YC. 2012. GSTM1, GSTT1, and GSTP1 polymorphisms and associations between air pollutants and markers of insulin resistance in elderly Koreans. Environ Health Perspect. 120(10):1378–1384.
- Klimisch HJ, Andreae M, Tillmann U. 1997. A systematic approach for evaluating the quality of experimental toxicological and ecotoxicological data. Regul Toxicol Pharmacol. 25(1):1–5.
- Kodavanti UP. 2019. Susceptibility variations in air pollution health effects: incorporating neuroendocrine activation. Toxicol Pathol. 47(8):962–975.
- Kodavanti UP, Ledbetter AD, Thomas RF, Richards JE, Ward WO, Schladweiler MC, Costa DL. 2015. Variability in ozone-induced pulmonary injury and inflammation in healthy and cardiovascular-compromised rat models. Inhal Toxicol. 27(Suppl 1):39–53.
- Kundi M. 2007. Causality and the interpretation of epidemiologic evidence. Cien Saude Colet. 12(2):419–428.
- Kuo T, McQueen A, Chen T-C, Wang J-C. 2015. Regulation of glucose homeostasis by glucocorticoids. Adv Exp Med Biol. 872:99–126.
- LaKind JS, Sobus JR, Goodman M, Barr DB, Fürst P, Albertini RJ, Arbuckle TE, Schoeters G, Tan Y-M, Teeguarden J, et al. 2014. A proposal for assessing study quality: biomonitoring, environmental epidemiology, and short-lived chemicals (BEES-C) instrument. Environ Int. 73:195–207.
- LaKind JS, Anthony LG, Goodman M. 2017. Review of reviews on exposures to synthetic organic chemicals and children's neurodevelopment: methodological and interpretation challenges. J Toxicol Environ Health B Crit Rev. 20(8):390–422.
- Lanzinger S, Rosenbauer J, Sugiri D, Schikowski T, Treiber B, Klee D, Rathmann W, Holl RW. 2018. Impact of long-term air pollution exposure on metabolic control in children and adolescents with type 1 diabetes: results from the DPV registry. Diabetologia. 61(6):1354–1361.
- Last JA, Gohil K, Mathrani VC, Kenyon NJ. 2005. Systemic responses to inhaled ozone in mice: cachexia and down-regulation of liver xenobiotic metabolizing genes. Toxicol Appl Pharmacol. 208(2):117–126.
- Li H, Duan D, Xu J, Feng X, Astell-Burt T, He T, Xu G, Zhao J, Zhang L, You D, et al. 2019. Ambient air pollution and risk of type 2 diabetes in the Chinese. Environ Sci Pollut Res. 26(16):16261–16273.
- Li M, Qian Z, Vaughn M, Boutwell B, Ward P, Lu T, Lin S, Zhao Y, Zeng X-W, Liu R-Q, et al. 2015. Sex-specific difference of the association between ambient air pollution and the prevalence of obesity in Chinese adults from a high pollution range area: 33 Communities Chinese Health Study. Atmos Environ. 117:227–233.
- Li W, Dorans KS, Wilker EH, Rice MB, Kloog I, Schwartz JD, Koutrakis P, Coull BA, Gold DR, Meigs JB, et al. 2018. Ambient air pollution, adipokines, and glucose homeostasis: the Framingham Heart Study. Environ Int. 111:14–22.
- Liberati A, Altman DG, Tetzlaff J, Mulrow C, Gøtzsche PC, Ioannidis JPA, Clarke M, Devereaux PJ, Kleijnen J, Moher D, et al. 2009. The PRISMA statement for reporting systematic reviews and meta-analyses of studies that evaluate healthcare interventions: explanation and elaboration. BMJ. 339:b2700.
- Lipfert FW. 2018. Long-term associations of morbidity with air pollution: a catalog and synthesis. J Air Waste Manage Assoc. 68(1):12–28.
- Lipfert FW, Wyzga RE. 2019. Longitudinal relationships between lung cancer mortality rates, smoking, and ambient air quality: a comprehensive review and analysis. Crit Rev Toxicol. 49(9):790–818.
- Liu L, Leech JA, Urch RB, Silverman FS. 1997. In vivo salicylate hydroxylation: a potential biomarker for assessing acute ozone exposure and effects in humans. Am J Respir Crit Care Med. 156(5):1405–1412.
- Liu T, Wang C, Wang Y, Huang L, Li J, Xie F, Zhang J, Hu J. 2020. Impacts of model resolution on predictions of air quality and associated health exposure in Nanjing, China. Chemosphere. 249:126515.
- Malmqvist E, Larsson HE, Jönsson I, Rignell-Hydbom A, Ivarsson S-A, Tinnerberg H, Stroh E, Rittner R, Jakobsson K, Swietlicki E, et al. 2015. Maternal exposure to air pollution and type 1 diabetes-accounting for genetic factors. Environ Res. 140:268–274.
- Martrette JM, Thornton SN, Trabalon M. 2011. Prolonged ozone exposure effects behaviour, hormones and respiratory muscles in young female rats. Physiol Behav. 103(3–4):302–307.
- Mathews JA, Kasahara DI, Cho Y, Bell LN, Gunst PR, Karoly ED, Shore SA. 2017. Effect of acute ozone exposure on the lung metabolomes of obese and lean mice. PLoS One. 12(7):e0181017.
- Mautz WJ, Bufalino C. 1989. Breathing pattern and metabolic rate responses of rats exposed to ozone. Respir Physiol. 76(1):69–77.
- McGivern L, Shulman L, Carney JK, Shapiro S, Bundock E. 2017. Death certification errors and the effect on mortality statistics. Public Health Rep. 132(6):669–675.
- McKone TE, Ryan PB, Özkaynak H. 2009. Exposure information in environmental health research: current opportunities and future directions for particulate matter, ozone, and toxic air pollutants. J Expo Sci Environ Epidemiol. 19(1):30–44.
- Mengist W, Soromessa T, Legese G. 2020. Method for conducting systematic literature review and meta-analysis for environmental science research. Methods. 7:100777.
- Miller CN, Dye JA, Ledbetter AD, Schladweiler MC, Richards JH, Snow SJ, Wood CE, Henriquez AR, Thompson LC, Farraj AK, et al. 2017. Uterine artery flow and offspring growth in Long-Evans rats following maternal exposure to ozone during implantation. Environ Health Perspect. 125(12):127005.
- Miller DB, Karoly ED, Jones JC, Ward WO, Vallanat BD, Andrews DL, Schladweiler MC, Snow SJ, Bass VL, Richards JE, et al. 2015. Inhaled ozone (O3)-induces changes in serum metabolomic and liver transcriptomic profiles in rats. Toxicol Appl Pharmacol. 286(2):65–79.
- Miller DB, Ghio AJ, Karoly ED, Bell LN, Snow SJ, Madden MC, Soukup J, Cascio WE, Gilmour MI, Kodavanti UP, et al. 2016a. Ozone exposure increases circulating stress hormones and lipid metabolites in humans. Am J Respir Crit Care Med. 193(12):1382–1391.
- Miller DB, Snow SJ, Henriquez A, Schladweiler MC, Ledbetter AD, Richards JE, Andrews DL, Kodavanti UP. 2016b. Systemic metabolic derangement, pulmonary effects, and insulin insufficiency following subchronic ozone exposure in rats. Toxicol Appl Pharmacol. 306:47–57.
- Miller DB, Snow SJ, Schladweiler MC, Richards JE, Ghio AJ, Ledbetter AD, Kodavanti UP. 2016c. Acute ozone-induced pulmonary and systemic metabolic effects are diminished in adrenalectomized rats. Toxicol Sci. 150(2):312–322.
- Moher D, Liberati A, Tetzlaff J, Altman DG, Group P, PRISMA Group. 2009. Preferred reporting items for systematic reviews and meta-analyses: the PRISMA statement. J Clin Epidemiol. 62(10):1006–1012.
- Mole ML Jr., Stead AG, Gardner DE, Miller FJ, Graham JA. 1985. Effect of ozone on serum lipids and lipoproteins in the rat. Toxicol Appl Pharmacol. 80(3):367–376.
- Money CD, Tomenson JA, Penman MG, Boogaard PJ, Jeffrey Lewis R. 2013. A systematic approach for evaluating and scoring human data. Regul Toxicol Pharmacol. 66(2):241–247.
- Morgan RL, Thayer KA, Santesso N, Holloway AC, Blain R, Eftim SE, Goldstone AE, Ross P, Ansari M, Akl EA, et al. 2019. A risk of bias instrument for non-randomized studies of exposures: a users' guide to its application in the context of GRADE. Environ Int. 122:168–184.
- National Academies of Sciences Engineering and Medicine. 2021. The use of systematic review in EPA's toxic substances control act risk evaluations. Washington (DC): The National Academies Press.
- Nishikawa M, Suzuki S, Ikeda H, Fukuda T, Suzuki J, Okubo T. 1990. Dose-response relationship of ozone-induced airway hyperresponsiveness in unanesthetized guinea pigs. J Toxicol Environ Health. 30(2):123–134.
- NTP. 2019. Handbook for conducting a literature-based health assessment using OHAT approach for systematic review and evidence integration. Durham (NC): National Toxicology Program.
- Orioli R, Cremona G, Ciancarella L, Solimini AG. 2018. Association between PM10, PM2.5, NO2, O-3 and self-reported diabetes in Italy: a cross-sectional, ecological study. PLoS One. 13(1):e0191112.
- Peters RE, Inman C, Oberg L, Mudd JB. 1993. Effect of ozone on metabolic activities of rat hepatocytes and mouse peritoneal macrophage. Toxicol Lett. 69(1):53–61.
- Potischman N, Weed DL. 1999. Causal criteria in nutritional epidemiology. Am J Clin Nutr. 69(6):1309S–1314s.
- Qin F, Yang Y, Wang ST, Dong YN, Xu MX, Wang ZW, Zhao JX. 2019. Exercise and air pollutants exposure: a systematic review and meta-analysis. Life Sci. 218:153–164.
- Ramot Y, Kodavanti UP, Kissling GE, Ledbetter AD, Nyska A. 2015. Clinical and pathological manifestations of cardiovascular disease in rat models: the influence of acute ozone exposure. Inhal Toxicol. 27(Suppl 1):26–38.
- Renzi M, Cerza F, Gariazzo C, Agabiti N, Cascini S, Di Domenicantonio R, Davoli M, Forastiere F, Cesaroni G. 2018. Air pollution and occurrence of type 2 diabetes in a large cohort study. Environ Int. 112:68–76.
- Rooney AA, Boyles AL, Wolfe MS, Bucher JR, Thayer KA. 2014. Systematic review and evidence integration for literature-based environmental health science assessments. Environ Health Perspect. 122(7):711–718.
- Sadighi K, Coffey E, Polidori A, Feenstra B, Lv Q, Henze DK, Hannigan M. 2018. Intra-urban spatial variability of surface ozone in Riverside, CA: viability and validation of low-cost sensors. Atmos Meas Tech. 11(3):1777–1792.
- Salonen H, Salthammer T, Morawska L. 2018. Human exposure to ozone in school and office indoor environments. Environ Int. 119:503–514.
- Savitz DA, Wellenius GA, Trikalinos TA. 2019. The problem with mechanistic risk of bias assessments in evidence synthesis of observational studies and a practical alternative: assessing the impact of specific sources of potential bias. Am J Epidemiol. 188(9):1581–1585.
- Schneider K, Schwarz M, Burkholder I, Kopp-Schneider A, Edler L, Kinsner-Ovaskainen A, Hartung T, Hoffmann S. 2009. “ToxRTool”, a new tool to assess the reliability of toxicological data. Toxicol Lett. 189(2):138–144.
- Sen S, Dulchavsky SA, Dutta S. 1993. Effects of triiodothyronine (t3) supplementation upon ozone-induced lung injury. Free Radic Res Commun. 18(5):299–308.
- Shea BJ, Grimshaw JM, Wells GA, Boers M, Andersson N, Hamel C, Porter AC, Tugwell P, Moher D, Bouter LM, et al. 2007. Development of AMSTAR: a measurement tool to assess the methodological quality of systematic reviews. BMC Med Res Methodol. 7:10.
- Shea BJ, Reeves BC, Wells G, Thuku M, Hamel C, Moran J, Moher D, Tugwell P, Welch V, Kristjansson E, et al. 2017. AMSTAR 2: a critical appraisal tool for systematic reviews that include randomised or non-randomised studies of healthcare interventions, or both. Br Med J 358:j4008.
- Shin J, Choi J, Kim KJ. 2019. Association between long-term exposure of ambient air pollutants and cardiometabolic diseases: a 2012 Korean Community Health Survey. Nutr Metab Cardiovasc Dis. 29(2):144–151.
- Shore SA. 2019. The metabolic response to ozone. Front Immunol. 10:2890.
- Slade R, Watkinson WP, Hatch GE. 1997. Mouse strain differences in ozone dosimetry and body temperature changes. Am J Physiol. 272(1 Pt 1):L73–77.
- Snow SJ, Cheng W-Y, Henriquez A, Hodge M, Bass V, Nelson GM, Carswell G, Richards JE, Schladweiler MC, Ledbetter AD, et al. 2018. Ozone-induced vascular contractility and pulmonary injury are differentially impacted by diets enriched with coconut oil, fish oil, and olive oil. Toxicol Sci. 163(1):57–69.
- Snow SJ, Phillips PM, Ledbetter A, Johnstone AFM, Schladweiler MC, Gordon CJ, Kodavanti UP. 2019. The influence of maternal and perinatal high-fat diet on ozone-induced pulmonary responses in offspring. J Toxicol Environ Health A. 82(2):86–98.
- Song J, Liu Y, Zheng LH, Gui LH, Zhao XM, Xu DQ, Wu WD. 2018. Acute effects of air pollution on type II diabetes mellitus hospitalization in Shijiazhuang, China. Environ Sci Pollut Res Int. 25(30):30151–30159.
- Starling AP, Moore BF, Thomas DSK, Peel JL, Zhang W, Adgate JL, Magzamen S, Martenies SE, Allshouse WB, Dabelea D, et al. 2020. Prenatal exposure to traffic and ambient air pollution and infant weight and adiposity: the Healthy Start study. Environ Res. 182:11.
- Tamayo T, Rathmann W, Stahl-Pehe A, Landwehr S, Sugiri D, Krämer U, Hermann J, Holl RW, Rosenbauer J. 2016. No adverse effect of outdoor air pollution on HbA1c in children and young adults with type 1 diabetes. Int J Hyg Environ Health. 219(4–5):349–355.
- Thomson EM, Pal S, Guénette J, Wade MG, Atlas E, Holloway AC, Williams A, Vincent R. 2016. Ozone inhalation provokes glucocorticoid-dependent and -independent effects on inflammatory and metabolic pathways. Toxicol Sci. 152(1):17–28.
- Thomson EM, Pilon S, Guenette J, Williams A, Holloway AC. 2018. Ozone modifies the metabolic and endocrine response to glucose: reproduction of effects with the stress hormone corticosterone. Toxicol Appl Pharmacol. 342:31–38.
- To T, Feldman L, Simatovic J, Gershon AS, Dell S, Su J, Foty R, Licskai C. 2015. Health risk of air pollution on people living with major chronic diseases: a Canadian population-based study. BMJ Open. 5(9):e009075.
- Toledo-Corral CM, Alderete TL, Habre R, Berhane K, Lurmann FW, Weigensberg MJ, Goran MI, Gilliland FD. 2018. Effects of air pollution exposure on glucose metabolism in Los Angeles minority children. Pediatr Obes. 13(1):54–62.
- Treadwell JR, Tregear SJ, Reston JT, Turkelson CM. 2006. A system for rating the stability and strength of medical evidence. BMC Med Res Methodol. 6:52.
- Tune JD, Goodwill AG, Sassoon DJ, Mather KJ. 2017. Cardiovascular consequences of metabolic syndrome. Transl Res. 183:57–70.
- Umezu T, Suzuki AK, Miura T, Koizumi A. 1993. Effects of ozone and nitrogen dioxide on drinking and eating behaviors in mice. Environ Res. 61(1):51–67.
- US EPA. 2001. Spatial variation in ozone concentrations in Phoenix, AZ for 1997. Research Triangle Park (NC): National Center for Environmental Assessment.
- US EPA. 2015. Preamble to the integrated science assessments. Research Triangle Park (NC): National Center for Environmental Assessment. U.S. Environmental Protection Agency, Office of Research and Development, National Center for Environmental Assessment, RTP Division.
- US EPA. 2018. Application of systematic review in TSCA risk evaluations. Office of Chemical Safety and Pollution Prevention [accessed 2020 Oct 28]. https://www.epa.gov/sites/production/files/2018-06/documents/final_application_of_sr_in_tsca_05-31-18.pdf
- US EPA. 2020a. Integrated science assessment (ISA) for ozone and related photochemical oxidants (final report, Apr 2020). Washington (DC): U.S. Environmental Protection Agency.
- US EPA. 2020b. ORD staff handbook for developing IRIS assessments (public comment draft, Nov 2020), Vol. EPA/600/R-20/137. Washington (DC): Integrated Risk Information System, National Center for Environmental Assessment, Office of Research and Development, U.S. Environmental Protection Agency.
- US Preventive Services Taskforce. 2021. Grade definitions. U.S. Preventive Services Task Force. October 2018 [accessed 2021 Jan 11]. https://www.uspreventiveservicestaskforce.org/uspstf/grade-definitions#:∼:text=The%20U.S.%20Preventive%20Services%20Task%20Force%20%28USPSTF%29%20assigns,suggestions%20for%20practice%20for%20the%20grade%20C%20recommendation
- Vaughan WJ, Adamson GL, Lindgren FT, Schooley JC. 1984. Serum lipid and lipoprotein concentrations following exposure to ozone. J Environ Pathol Toxicol Oncol. 5:165–173.
- Vella RE, Pillon NJ, Zarrouki B, Croze ML, Koppe L, Guichardant M, Pesenti S, Chauvin M-A, Rieusset J, Géloën A, et al. 2015. Ozone exposure triggers insulin resistance through muscle c-Jun N-terminal kinase activation. Diabetes. 64(3):1011–1024.
- Vingarzan R. 2004. A review of surface ozone background levels and trends. Atmos Environ. 38(21):3431–3442.
- Wagner JG, Allen K, Yang H-y, Nan B, Morishita M, Mukherjee B, Dvonch JT, Spino C, Fink GD, Rajagopalan S, et al. 2014. Cardiovascular depression in rats exposed to inhaled particulate matter and ozone: effects of diet-induced metabolic syndrome. Environ Health Perspect. 122(1):27–33.
- Wallace BC, Dahabreh IJ, Schmid CH, Lau J, Trikalinos TA. 2013. Modernizing the systematic review process to inform comparative effectiveness: tools and methods. J Comp Eff Res. 2(3):273–282.
- Wang G, Chen Z, Bartell T, Wang X. 2014. Early life origins of metabolic syndrome: the role of environmental toxicants. Curr Environ Health Rep. 1(1):78–89.
- Watkinson WP, Aileru AA, Dowd SM, Doerfler DL, Tepper JS, Costa DL. 1993. Acute effects of ozone on heart rate and body temperature in the unanesthetized, unrestrained rat maintained at different ambient temperatures inhalation toxicology. Inhalation Toxicol. 5(1):129–147.
- Watkinson WP, Wiester MJ, Highfill JW. 1995. Ozone toxicity in the rat. I. Effect of changes in ambient temperature on extrapulmonary physiological parameters. J Appl Physiol. 78(3):1108–1120.
- Wells B, Simon H, Luben TJ, Pekar Z, Jenkins SM. 2019. Uncertainty associated with ambient ozone metrics in epidemiologic studies and risk assessments. Air Qual Atmos Health. 12(5):585–595.
- Wells G, Shea B, O'Connell D, Peterson J, Welch V, Losos M, Tugwell P. 2013. The Newcastle-Ottawa Scale (NOS) for assessing the quality of nonrandomised studies in meta-analyses [accessed 2021 Apr 1]. http://www.ohri.ca/programs/clinical_epidemiology/oxford.asp
- Weschler CJ. 2006. Ozone's impact on public health: contributions from indoor exposures to ozone and products of ozone-initiated chemistry. Environ Health Perspect. 114(10):1489–1496.
- Westgate MJ, Lindenmayer DB. 2017. The difficulties of systematic reviews. Conserv Biol. 31(5):1002–1007.
- White LF, Jerrett M, Yu J, Marshall JD, Rosenberg L, Coogan PF. 2016. Ambient air pollution and 16-year weight change in African-American Women. Am J Prev Med. 51(4):e99–e105.
- Whiting P, Harbord R, Kleijnen J. 2005. No role for quality scores in systematic reviews of diagnostic accuracy studies. BMC Med Res Methodol. 5:19.
- WHO 2020. Risk of bias assessment instrument for systematic reviews informating WHO global air quality guidelines [accessed 2020 Feb 16]. https://www.euro.who.int/en/health-topics/environment-and-health/air-quality/publications/2020/risk-of-bias-assessment-instrument-for-systematic-reviews-informing-who-global-air-quality-guidelines-2020
- Wong SF, Yap PS, Mak JW, Chan WLE, Khor GL, Ambu S, Chu WL, Mohamad MS, Ibrahim Wong N, Ab Majid NL, et al. 2020. Association between long-term exposure to ambient air pollution and prevalence of diabetes mellitus among Malaysian adults. Environ Health. 19(1):37
- Woodruff TJ, Sutton P. 2014. The Navigation Guide systematic review methodology: a rigorous and transparent method for translating environmental health science into better health outcomes. Environ Health Perspect. 122(10):1007–1014.
- Yang B-Y, Qian Z(M), Li S, Chen G, Bloom MS, Elliott M, Syberg KW, Heinrich J, Markevych I, Wang S-Q, et al. 2018a. Ambient air pollution in relation to diabetes and glucose-homoeostasis markers in China: a cross-sectional study with findings from the 33 Communities Chinese Health Study. Lancet Planet Health. 2(2):e64–e73.
- Yang B-Y, Qian Z(M), Li S, Fan S, Chen G, Syberg KM, Xian H, Wang S-Q, Ma H, Chen D-H, et al. 2018b. Long-term exposure to ambient air pollution (including PM1) and metabolic syndrome: the 33 Communities Chinese Health Study (33CCHS). Environ Res. 164:204–211.
- Yang B-Y, Guo Y, Markevych I, Qian ZM, Bloom MS, Heinrich J, Dharmage SC, Rolling CA, Jordan SS, Komppula M, et al. 2019a. Association of long-term exposure to ambient air pollutants with risk factors for cardiovascular disease in China. JAMA Netw Open. 2(3):e190318
- Yang Z, Song Q, Li J, Zhang Y. 2019b. Air pollution as a cause of obesity: micro-level evidence from Chinese cities. Int J Environ Res Public Health. 16(21):4296.
- Zhang N, Wang L, Zhang M, Nazroo J. 2019. Air quality and obesity at older ages in China: the role of duration, severity and pollutants. PLoS One. 14(12):e0226279.