
Abstract
The Amphibian Metamorphosis Assay (AMA) is used to identify substances that potentially interfere with the normal function of the hypothalamic-pituitary-thyroid (HPT) axis. Although numerous AMA studies have been performed since the establishment of this assay a decade earlier, a comprehensive, large-scale examination of histopathology data obtained from control larvae has not been performed. The current investigation reviewed 51 AMA experiments conducted at 7 different laboratories in Europe and North America. Dilution water control and/or solvent control specimens from each study (1,335 animals total) had been evaluated microscopically by one of eight anatomic pathologists. In order of descending frequency, the most common findings in prometamorphic Xenopus laevis controls were the core criteria of follicular cell (FC) hypertrophy, FC hyperplasia, thyroid hypertrophy, and thyroid atrophy, respectively. Less frequently recorded were non-core and ad hoc diagnoses, the toxicological relevance and utility of which were in some cases uncertain. As anticipated, the prevalence of FC hypertrophy and FC hyperplasia diagnoses were at least partially dependent on the Nieuwkoop and Faber (NF) stage at sacrifice. The recorded frequencies of each of the four core diagnoses also differed according to pathologist, which suggests that pathologist diagnostic interpretation is a potential source of variability across AMA study outcomes. Based on the current examination of the AMA historical data, and further hands-on experience with this assay, diagnostic approaches to evaluating the histopathology endpoint are discussed, and several recommendations are proposed for the refinement of core diagnostic criteria assessment.
Introduction
The Amphibian Metamorphosis Assay (AMA) is used to identify substances that potentially interfere with the normal function of the hypothalamic-pituitary-thyroid (HPT) axis. As described by the OECD and USEPA regulatory test guidelines (OECD Citation2009, Citation2012; USEPA Citation2009), the AMA is considered a Tier 1 test within USEPA’s Endocrine Disruption Screening Program (EDSP) framework, and occupies level 3 of the OECD Conceptual Framework for Testing and Assessment of Endocrine DisruptersFootnote1. Level 3 describes in vivo assays that provide data about selected endocrine mechanisms and/or pathways. The AMA is initiated when Nieuwkoop and Faber (Nieuwkoop and Faber Citation1994) Stage 51 Xenopus laevis larvae are exposed to three different concentrations of a test chemical plus a dilution water control (and a solvent control if required) for 21 days. Clinical signs and mortality are monitored daily, while apical growth and developmental endpoints are assessed at Day 7 (interim sampling) and Day 21 (terminal sampling). Apical endpoints include developmental stage (DS), hind limb length (HLL), snout to vent length (SVL), and wet body weight (OECD Citation2009). Thyroid gland histopathology is performed on a subset of stage-matched tadpoles (five per replicate vessel) at test termination on Day 21. Under some regulatory regimes, histopathology may be considered unnecessary if overt and significant changes in apical endpoints indicating developmental acceleration or asynchrony are observed (OECD Citation2018); however, in practice this endpoint is routinely evaluated in order to preempt potential requests and provide the most robust evaluation. The reliability and relevance of the AMA were validated via intra-laboratory and multi-laboratory testing, followed by an independent expert panel peer-review (OECD Citation2004, Citation2007b, Citation2008).
Thyroid histopathology as conducted via the AMA is thought to be very specific for detecting substances with thyroid agonist or antagonist activity (Coady et al. Citation2014), and in a recent review was found to be the most sensitive of all AMA endpoints (Dang Citation2019). Procedures for creating transverse histologic sections through the head/neck region of each tadpole, and detailed diagnostic pathology criteria were described originally in OECD Citation2007a (Parts I and II, respectively) and Grim et al. Citation2009. For convenience, these two references combined will be referred to as the original guidance documents (OGD). The OGD jointly identify four thyroid diagnoses that are considered to represent “core criteria”: follicular cell (FC) hypertrophy, FC hyperplasia, thyroid hypertrophy, and thyroid atrophy. OECD Citation2007a further outlines three “additional qualitative criteria”: follicular lumen area (increased or reduced), colloid quality, and follicular cell height/shape. The last of these, follicular cell height/shape, was omitted from Grim et al. Citation2009. Severity grading schemes based on increasing morphologic changes were described for each of the four core criteria, using a 0-3 scale (0 = not remarkable, 1 = mild, 2 = moderate, and 3 = severe), and it was stated that treatment-associated alterations in follicular lumen area, if present, should be recorded using a similar grading scheme. Conversely, it is apparent that changes in colloid quality and follicular cell height/shape were meant to be described qualitatively in narrative format (i.e. on a group-wise basis, if present), rather than recorded for each individual animal and scored for severity (OECD Citation2007a). The OGD provided detailed morphologic descriptions for each of the four core criteria. Accordingly, findings of FC hypertrophy and FC hyperplasia were described as representing increases in the size and number, respectively, of the colloid-producing epithelial cells that line the multiple thyroid follicles. Such increases typically occur as a result of augmented release of thyroid stimulating hormone (TSH) by the pituitary gland (Tietge et al. Citation2010). FC hypertrophy is characterized primarily by an increase in cell height, corresponding to a shift from a cuboidal to columnar conformation, while follicles with FC hyperplasia feature crowded epithelial cells that may display pseudostratification and/or papillary infolding. As opposed to the individual follicular cells, findings of thyroid hypertrophy and atrophy are terms that pertain to overall size of the thyroid glands, and represent enlargement and reduction in gland size, respectively. According to the OGD, FC hypertrophy and/or FC hyperplasia are diagnosed when at least 30% of the follicular cells or tissue are affected; therefore, these are absolute (as opposed to relative) criteria that are not dependent on comparison to controls. Conversely, diagnoses of thyroid hypertrophy and atrophy are entirely dependent on comparison to controls (i.e. each of these findings represents a 30% or greater change in size relative to controls), and accordingly, the OGD stated that the range of variability among controls needs to be appreciated before either of these two findings is recorded.
In the field of toxicologic pathology, concurrent study control (CC) data are generally considered to be more relevant than historical control (HC) data for determining if a causal relationship exists between chemical exposure and morphologic effects (Keenan et al. Citation2009). This concept may be especially applicable in the context of the AMA, because histopathological effects in that assay represent incremental changes in morphologic features (e.g. cell size and number) that are normally present in controls, as opposed to the de novo development of discrete lesions. For a variety of reasons, the use of HC data is currently far more common in mammalian pharmacologic toxicology as compared to ecotoxicology (Brooks et al. Citation2019). Notwithstanding, there are several reasons why understanding the frequency of findings in historical controls can be advantageous when interpreting the results of a bioassay such as the AMA. First, because the AMA study design most often consists of a single dilution water (negative) control group and three groups exposed to progressive concentrations of the test article, aberrant performance of the control group by chance can inordinately influence the study outcome, potentially leading to false positive or negative results. Evidence for such outlier effects may be supported by comparisons of the CC data to an HC data set. Second, HC data may be useful for interpreting the potential relationship between rare types of findings (which may be toxicologically important even though statistically insignificant) and test article exposure. Third, HC data may be useful for distinguishing test article effects from pseudo-effects caused by confounding variables (e.g. temperature differences that are within guideline allowance), or in the context of endocrine disruption research, discerning hormonal from non-hormonal effects. Fourth, under certain circumstances, it may be possible to use HC data as a proxy for CC data, or to increase the statistical power of the assay, although the applicability of those approaches for AMA studies would require validation. Finally, and of particular relevance to the present retrospective review, an examination of the HC data could enhance our current understanding of the variability and range of expected responses in AMA studies, while providing information that can be used to improve the evaluation and performance of the histopathology endpoint moving forward.
Previous articles have assessed the performance of the AMA (Coady et al. Citation2014; Schapaugh et al. Citation2015; Dang Citation2019), most of which was focused on non-histopathology endpoints. Although Coady et al. (Citation2014) specifically discussed aspects of the AMA histopathology data, their conclusions were based on 12 studies performed at a single laboratory. The goal of the current paper is to leverage historical control data to explore possible causes of inherent variability that can negatively affect the accuracy and consistency of histopathology results emanating from the AMA assay. To achieve this we performed an in-depth evaluation of histopathology HC data from 51 AMA studies that were conducted by multiple laboratories and evaluated by multiple pathologists. Forty-six of the 51 studies were implemented to fulfill USEPA EDSP Tier 1 requirements for the first list of substances. An additional 5 studies conducted more recently were graciously provided by the USEPA. All studies were performed according to OECD and USEPA test guidelines (OECD Citation2009; USEPA Citation2009) and associated histopathology guidance (OECD Citation2007a; Grim et al. Citation2009) and in accordance with the principles of Good Laboratory Practice (GLP). For convenience, the combined control data derived from the 51 AMA studies will henceforth be referred to as the “AMA Historical Control Data (AMAHCD)”. It is intended that the information obtained from the present review will be used to provide specific recommendations for pathologists, ecotoxicologists, and other scientists who participate in the conduct of AMA studies, or are involved in the assessment of these studies for regulatory purposes. Although the development of recommendations will rely primarily on information gleaned from the AMAHCD, these suggestions will be informed, to a lesser extent, by the experience of the authors, one of whom (JCW) has performed histopathologic evaluations for 84 AMA studies as of this writing, and has thereby examined thyroid glands from more than 2,000 dilution water and solvent control frogs. A review of AMAHCD pertaining to the remaining apical growth and development endpoints has been submitted for publication as a companion article (Bejarano et al. Citation2021).
Materials and methods
AMA data were obtained from Data Evaluation Records (DERs) made publicly available by the USEPA: https://www.epa.gov/endocrine-disruption/endocrine-disruptor-screening-program-tier-1-screening-determinations-and (accessed between May and October, 2020). These DERs were compiled from 46 GLP-compliant Test Guideline studies that were submitted by different companies as part of the EDSP Tier 1 Screening determinations for List 1 chemicals, and all studies were performed at commercial contract research or industry laboratories. The USEPA provided 5 additional GLP studies that were also conducted at commercial laboratories.
All studies were screened to ensure that they were conducted in general accordance with the test guidelines. Minor deviations from guideline are addressed in the companion article (Bejarano et al., Citation2021). It was not possible to verify all values independently, as the original study reports were not available for review. Data representing findings in test article-treated animals were not considered during this review. Also excluded from analysis were data from one study in which chemical contamination of the controls had occurred, and data representing the dilution water controls of another study in which there was an unacceptable degree of mortality in one replicate. The data extracted from the DERs included both dilution water controls and solvent controls, when the latter were included in the study design. Data from dilution water controls (51 samples) and solvent controls (16 samples) were ultimately combined into a single data set (67 samples total) based on statistical comparison of the AMA core criteria responses. Such comparisons were performed using the recommended non-parametric Wilcoxon Mann–Whitney test (OECD Citation2006), a statistic used to test the hypothesis of a zero-median difference between two independently sampled control populations. Analyses showed no statistically significant differences (p > 0.05) between dilution water and solvent control responses pooled across studies, which justified data pooling for use in subsequent analyses.
The histopathology data, including lesion severity scores, were extracted from the DER summaries or provided directly by the USEPA. The histopathology data were organized in the DERs according to study. For each study, these data included the total number of controls examined, and the number of controls that received each severity score (0–3) for each type of diagnostic finding (e.g. thyroid hypertrophy). The pathologist who evaluated each study was identified by contacting the performing laboratory or study sponsor. The identities of the studies, laboratories, and pathologists have been kept anonymous for the purposes of data analysis and reporting. During the present review, these data were transformed to percentages affected for each diagnosis and/or severity score, to facilitate comparisons across studies and pathologists.
Results
A combined total of 1,335 dilution water and solvent control frogs were originally examined in the 51 studies that comprise the AMAHCD (). Solvent control groups were included in 16 of the 51 studies, effectively doubling the overall number of control frogs in each case (generally from 20 to 40). Each of the 51 studies was performed by one of seven different laboratories (Labs A–G) located in Europe and North America, and the histologic specimens for each study were evaluated by one of eight different anatomic pathologists (Paths a–h). Each laboratory or sponsor did not necessarily rely on a single pathologist for all of their studies; for example, Lab F employed the services of four pathologists (Paths a, b, e, and f) and Lab G used two pathologists (Paths d and h). Meanwhile, one pathologist (Path d) evaluated studies for four different laboratories (Labs A, B, D, and G).
Table 1. Distribution of AMA studies among laboratories and pathologists.
The eight pathologists recorded a combined total of 823 diagnoses for the 1,335 control frogs. It is likely that multiple diagnoses were recorded for at least some frogs; however, that likelihood could not be confirmed due to the summarized nature of the AMAHCD. The four core diagnoses dominated the overall distribution, comprising 77% of the 823 total diagnoses. Listed in order of most to least common were FC hypertrophy, FC hyperplasia, thyroid hypertrophy, and thyroid atrophy, which respectively represented 59, 21, 13, and 6% of the 635 recorded core diagnoses. The overall prevalence of each of these diagnoses (i.e. number of diagnoses/1,335 frogs) was 28, 10, 6, and 3%, respectively, with prevalence in a given study that ranged from 0 to 100%, 0 to 60%, 0 to 70%, and 0 to 25%, respectively. The overall prevalence of each core diagnosis changed to 37, 13, 1, and 0%, respectively, when studies evaluated by one pathologist (Path h) were excluded from the analysis (the rationale for this exclusion is discussed subsequently). The percentage of studies in which at least a single diagnosis of FC hypertrophy was recorded was 76%, the percentage of studies in which a single diagnosis of FC hyperplasia was recorded was 59%, and the percentage of studies in which either diagnosis was recorded was 76%. These values rose to 92, 76, and 92%, respectively, when studies evaluated by Path h were excluded. Severity grades recorded for histopathologic findings ranged from 1 to 3, in accordance with guideline recommendations (OECD Citation2007a), in which grade 1 = mild, grade 2 = moderate, and grade 3 = severe. Throughout the AMAHCD, a large majority (85%) of the 635 core diagnoses were recorded as grade 1 severity. Only 1% of diagnoses were scored as grade 3, 90% of which were recorded by Path h.
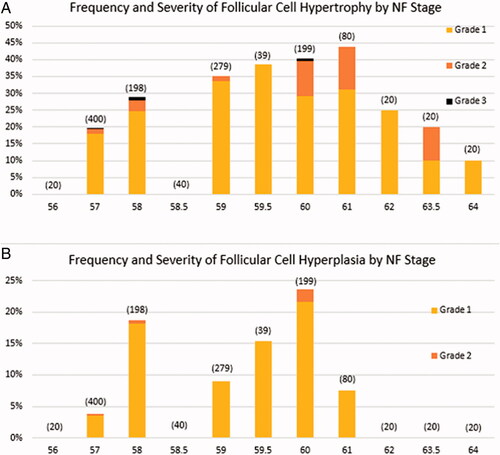
The frequency and severity of FC hypertrophy tended to increase progressively from NF Stage 57 to NF Stage 61, which was followed by a progressive decline to NF Stage 64 (). The pattern of occurrence for FC hyperplasia was less well-defined (), with biphasic peaks at NF Stages 58 and 60. Unlike FC hypertrophy, there were no diagnoses of FC hyperplasia at developmental stages more advanced than NF Stage 61. The tendency for diagnoses of FC hyperplasia to occur more commonly during early metamorphic climax (metamorphic climax is defined as NF Stages 57/58 to NF Stage 66 by Miyata and Ose Citation2012) is consistent with the anecdotal observation that follicle cell proliferation seems to precede the major increases in follicle cell size.
Figure 1. Frequency and severity of follicular cell (FC) hypertrophy and FC hyperplasia in control frogs by Nieuwkoop and Faber (NF) stage for the 51 reviewed AMA studies. Frequencies at each stage are calculated by dividing the number of diagnoses by the number of control frogs examined. Numbers of control frogs examined are indicated in parentheses. There were no recordings of Grade 3 FC hyperplasia in controls.
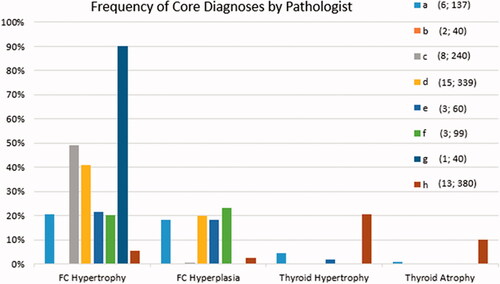
The frequency of the four core diagnoses in the AMAHCD as recorded by each of the eight pathologists is presented in . A visual examination of this figure leads to several observations. First, most pathologists recorded findings of FC hypertrophy and FC hyperplasia more frequently than those of thyroid hypertrophy or atrophy. Second, it is noteworthy that one pathologist (Path b) did not record any findings for either of the two studies evaluated by that person. Third, in the three studies evaluated by Path e, only diagnoses of FC hypertrophy were recorded, and FC hypertrophy was recorded at a far higher frequency relative to the other seven pathologists. And fourth, it is evident that Path h recorded a greater proportion of thyroid hypertrophy and atrophy diagnoses, and a lesser proportion of FC hypertrophy and FC hyperplasia diagnoses, when compared to the other pathologists. In fact, Path h was responsible for the vast majority (94%; 116/124) of thyroid hypertrophy and atrophy diagnoses, but only a small minority (6%; 30/511) of FC hypertrophy and FC hyperplasia diagnoses.
Figure 2. Frequency of core diagnoses by pathologist for the 51 reviewed studies. For each of the four core diagnoses, the frequency is the number of diagnoses recorded by the pathologist divided by the number of animals examined by that same pathologist. The eight pathologists are indicated by various color and letter combinations (i.e. a–h). Values in parentheses are the number of studies evaluated and the number of control frogs examined, respectively.
The AMAHCD contained a total of thirteen non-core diagnoses, which consisted of additional qualitative criteria as mentioned in the OGD (increased follicular lumen area, decreased follicular lumen area, increased follicular cell height, and decreased follicular cell height) plus various ad hoc diagnoses. Ad hoc diagnoses were those not described in the OGD, and these included [changes in] follicular cell shape, increased follicular size, decreased follicular size, increased gland symmetry, increased gland asymmetry, increased follicular asymmetry, decreased follicular asymmetry, follicular cell necrosis, and precocious gill resorption. Non-core diagnoses comprised 23% of the 823 total diagnoses and occurred in 43% of the 51 studies. At least one non-core diagnosis was recorded by five of the eight pathologists.
Discussion
Follicular cell hypertrophy and hyperplasia
Analysis of the AMAHCD suggests that most studies in which X. laevis frogs are sampled during metamorphosis (i.e. NF Stages 57–64) have baseline frequencies of FC hypertrophy and FC hyperplasia, the incidences of which are at least partially dependent on the NF stage at sacrifice. That outcome makes sense physiologically, as anuran metamorphosis is considered to be a thyroid-dependent process. For reasons that are not yet completely clear, the rapid elevation in TSH associated with metamorphic climax occurs despite a concomitant rise in circulating thyroid hormones (TH), which would otherwise be expected to suppress pituitary TSH production via the classic HPT negative feedback mechanism (Buckbinder and Brown Citation1993; Sternberg et al. Citation2011). As mentioned previously, the stimulus for both FC hypertrophy and FC hyperplasia is increased circulating levels of TSH (Tietge et al. Citation2010), concentrations of which are highest in the X. laevis pituitary between NF Stages 58–62 (Korte et al. Citation2011). Following metamorphic climax (e.g. NF Stage 66), levels of TSH and TH decrease, at which point the histological appearance of the thyroid glands becomes more quiescent (Grim et al. Citation2009).
The tendency for FC hypertrophy and FC hyperplasia to occur commonly in control frogs sacrificed at 21 days after NF stage 51 is not emphasized explicitly in the OGD (i.e. Grim et al. Citation2009 or OECD Citation2007a; however, within those documents, nearly all illustrated examples of control frog thyroids are described as having low grades of FC hypertrophy and/or FC hyperplasia in the figure legends. An example of these findings is illustrated in of the current report, which, when compared to , also demonstrates the degree of variability that can exist among controls within the same study. The common occurrence in controls of low-grade FC hypertrophy and FC hyperplasia was also reported by Coady et al. Citation2014 and Olker et al. Citation2018. This concept is important for two reasons. First, pathologists and non-pathologists should recognize that findings of low grade (e.g. mild to moderate) FC hypertrophy and/or FC hyperplasia in untreated controls are anticipated (i.e. are normal), and therefore a baseline occurrence of these findings should not be viewed as problematic for any AMA study. Second, the existence of baseline levels of FC hypertrophy/hyperplasia in controls may actually serve to enhance the utility of the AMA, because it allows for the possibility of a treatment-induced decrease in the prevalence and/or severity of these proliferative findings. Such decreases could potentially occur, for example, as a consequence of thyroid hormone agonist exposure leading to inhibited TSH release from the pituitary; such effects could be especially important for identifying test substances that may not be sufficiently potent, or tested at sufficient concentration, to cause thyroid atrophy. Unpublished results from several AMA studies tend to support this theory, based on pathologist experience.
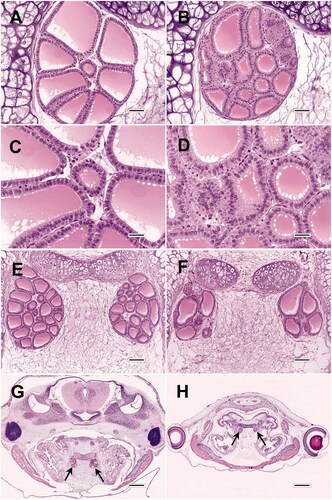
Figure 3. Morphologic variability of thyroid glands from AMA studies. (A, B) Thyroid glands of two control frogs from the same experiment (C and D are higher magnifications of A and B, respectively). While A was recorded as not remarkable, B displays mild follicular cell (FC) hypertrophy and mild FC hyperplasia. Note that despite the relative increase in cell proliferation, the overall gland size of B is actually smaller than A. The prevalence of mild to moderate FC hypertrophy may be as high as 100% in some control groups. (E, F) Variation in thyroid gland size, follicle size, and follicle shape in two control frogs from the same study. (G, H) Control and compound-exposed frogs, respectively, from the same study. Although the thyroids (arrows) in H are smaller than those of G, they are proportionally decreased in relation to body size, and therefore not necessarily atrophic. However, there does appear to be development delay in H compared to G, as evidenced by caudal migration of the thyroids and resorption of the internal gills in G. All images are hematoxylin and eosin. Bar sizes: A and B = 50 microns; C and D = 25 microns; E and F = 100 microns; G and H = 500 microns.
The specificity of changes in FC hypertrophy/hyperplasia for detecting thyroid active substances was highlighted recently, when a large-scale review of AMA studies revealed that the only false positive results generated by the histopathology data (10% false positive frequency) were based on morphologic changes other than FC hypertrophy or FC hyperplasia (Dang Citation2019).
Thyroid gland hypertrophy and atrophy
In the OGD, thyroid hypertrophy and atrophy were demonstrated in tadpoles that had been exposed experimentally to relatively high concentrations of potent thyroid hormone antagonists (e.g. perchlorate, methimazole) and agonists (i.e. thyroxine), respectively. Consequently, such exposures resulted in large magnitude changes (e.g. high degrees of FC hypertrophy and hyperplasia in response to thyroid antagonists). There are two likely explanations why most of the pathologists in the AMAHCD recorded few diagnoses of thyroid hypertrophy or atrophy in controls. First, the overall size of the thyroid glands in control frogs can be highly variable (). At least in part, this variability occurs because thyroid gland size in histologic sections is dependent on multiple anatomical and histo-technical factors, including the number, sizes, and shapes of follicles (which in turn are affected by the size and number of follicular epithelial cells, and the sizes and shapes of follicular lumina), the amount of interstitial tissue between the follicles, the precise plane of section achieved during microtomy, and the ability of the microtomist to consistently obtain thyroid gland profiles at their maximum cross-sectional diameter. Second, because the OGD indicates that diagnoses of thyroid hypertrophy/atrophy should be made in comparison to controls, and there can be a wide range of thyroid sizes among controls, it follows that the only controls that should receive such diagnoses would be the rare cases (essentially outliers) in which the glands are conspicuously larger than those of their cohorts.
A potentially important influence on thyroid gland size that is not addressed in the OGD is the effect of frog size. The OGD define thyroid hypertrophy and atrophy as increases and decreases, respectively, in the overall thyroid gland size of compound-treated frogs when compared to controls. Such changes are depicted in the OGD by photomicrographic figure examples. However, example images in the OGD (Figures 3 and 4 in Grim et al. Citation2009, and Figures 6–9 and 14–17 in OECD Citation2007a) actually appear to demonstrate primarily disproportionate changes in the size of the thyroid glands relative to body size. Thus, for exposures that result in either glandular hypertrophy or atrophy, the sizes of control and treated frogs (as much as can be ascertained from the selected figure examples) appear essentially similar, despite major changes in thyroid gland size. Similar disproportionate effects following exposure to thyroid active substances are consistently evident in photographic examples from other reports (e.g. Figure 2 in Opitz et al. Citation2006; Figure 5 in Coady et al. Citation2010; Figure 5 in Saka et al. Citation2012), and are further supported by the absence of substantial changes in measured wet weight or snout-vent length associated with such exposures (Coady et al. Citation2010; Oka et al. Citation2009). Unlike the process of metamorphosis, overall body growth is considered to be independent of thyroid hormone levels (Carlsson and Norrgren Citation2007; Coady et al. Citation2014). However, because body length and mass tend to decrease with tail resorption, body size may ultimately be influenced by the ability of thyroid-active substances to accelerate or delay metamorphosis, although such changes may manifest predominately at time points later than the 21-day duration of the AMA (Opitz et al. Citation2006; Carlsson Citation2019). Meanwhile, there is potential for certain chemical treatments to alter the size of the exposed frogs as a result of non-hormonal mechanisms, an example of which would be treatment-induced inappetence resulting in diminished intake of energy and other nutrients. It is reasonable to assume that reduced feed intake could produce smaller frogs relative to controls (Leips and Travis Citation1994), and that affected frogs would likely have proportionately smaller thyroid glands, (). Conceivably, a certain treatment might also cause accelerated body growth via a non-endocrine mechanism, which may result in increased thyroid size that is again proportional to body size. To label such proportional changes as either thyroid atrophy or hypertrophy may therefore be inappropriate, because those terms, and their underlying pathogenic processes, have been regarded as indicators of endocrine activity in the AMA.
The term atrophy itself may also be a misnomer in the context of the AMA. Atrophy is defined conventionally as the “reduced size of an organ or tissue resulting from a decrease in cell size and number” (Kumar et al. Citation2015). It is evident that this classic definition pertains to a reduction in organ size that occurs in an individual over time; in contrast, the OGD definition of thyroid atrophy involves decreased organ size in treated frogs relative to the control population. However, for developing frogs diagnosed with chemically-induced thyroid atrophy, it is possible, and perhaps more plausible, that their thyroids never attained the size of their cohort controls, and therefore did not experience a reduction in thyroid size caused by cell loss or shrinkage. If so, that particular pathogenesis would be more consistent with a diagnosis of “relative hypoplasia” or “delayed thyroid development” rather than true atrophy. Although seemingly minor, this definitional difference could confound the mechanistic interpretation of chemical effects in AMA studies.
Another issue may arise when the thyroid glands of a given frog appear inordinately small, but > 30% of the epithelial cells that line the follicles are enlarged. Based on OGD criteria, that animal should receive diagnoses of both thyroid atrophy and follicular cell hypertrophy. However, for the glands to be truly atrophic, the follicles should be lined by flattened (attenuated) epithelium, consistent with a state of comparative metabolic inactivity. Therefore, the simultaneous recording of those two seemingly contradictory findings is potentially confusing and challenging to justify. That particular scenario (which is not a rare occurrence based on experience) is not addressed in the OGD.
Non-core diagnoses
Although histopathologic guidance in the OGD focused primarily on the four core criteria, those documents did allow for some degree of diagnostic flexibility in the histopathologic assessment, maintaining that “novel findings that are exposure-related shall also be reported” (OECD Citation2007a). As mentioned in the current results, five of the eight pathologists elected to record 13 different non-core diagnoses, at least nine of which were ad hoc diagnoses that were not described in the OGD. From the AMAHCD alone, it is not possible to determine if any of these non-core diagnoses were associated with treatment-related effects in the studies in which they were recorded. However, analysis of the AMAHCD results suggests that the injudicious use of non-core criteria and creation of ad hoc diagnoses could have undesirable consequences on the study outcome, by potentially leading to false-positive or -negative results. For example, although follicular epithelial cells could potentially enlarge as a function of augmented height and/or width, TSH-induced follicular cell hypertrophy is typically characterized by increased cell height primarily, resulting in a columnar configuration (Grim et al. Citation2009). Conversely, diminished cell height, culminating in the flattened to cuboidal cell profile of inactive follicular epithelial cells, is recorded as “non-remarkable” according to the OGD. Consequently, additional terms used to describe alterations in follicular height or shape are essentially redundant. In the AMAHCD, one pathologist periodically recorded diagnoses of increased follicular cell height in lieu of recording FC hypertrophy, and altered follicular cell shape in addition to FC hypertrophy. The recording of these redundant diagnoses adds unnecessary complexity to the study findings and is a potential source of confusion for study reviewers. Additionally, such departures from standardized OGD criteria effectively diminish the utility of the historical control data.
It is important to remember that the core criteria provided in the OGD were validated by methodical empirical testing, in direct contrast to the wholly untested nature of ad hoc diagnoses. For a diagnostic finding to be of value in the AMA, common sense suggests that it should be clearly definable, capable of being applied consistently, and plausibly linked to some type of pathological or physiological process, whether endocrine or non-endocrine. Several of the ad hoc diagnoses in the AMAHCD do not fit these stipulations. These include increased gland symmetry, increased gland asymmetry, increased follicular asymmetry, and decreased follicular asymmetry. Although the concept of symmetry is readily understandable, defining semi-quantitative gradations of increased or decreased symmetry would be extremely challenging. It could not be determined during this review whether the ad hoc diagnosis of gland asymmetry referred to symmetrical differences between left and right thyroid glands, or to medial to lateral differences in symmetry within each gland. Additionally, because the sizes and shapes of thyroid follicles and glands in control X. laevis metamorphs vary considerably (), and these attributes can be affected by the plane of sectioning, it is difficult to envision how the term symmetry could be applied consistently from animal to animal. Finally, there is currently little evidence to suggest that changes in thyroid follicular or glandular symmetry per se are toxicologically relevant for developing tadpoles.
Sources of variability in the AMA HC data set
Consistency within and across studies should be a major goal for the performance of any bioassay. Within-study consistency is important for maintaining assay sensitivity and specificity, because it reduces the level of background “noise” that can negatively affect the clarity of study results. Meanwhile, a high degree of inter-study inconsistency suggests that some results may not accurately reflect the actual study outcomes, and diminishes confidence in the overall reliability of the assay. Examination of control data spanning multiple studies, facilities, and personnel may provide insights that can be used to fine-tune assay performance.
Enhanced consistency can be achieved by minimizing controllable sources of variability. For the histopathology endpoint, potential sources of variability include factors listed in . Some of these variables are more readily controlled than others. For example, with sufficient training it should be possible for all participating laboratories to produce histologic sections that are of adequate diagnostic quality, husbandry practices can be better standardized, and interpretation of the histopathology data can be adjusted in accordance with median NF Stage scores. Intra-pathologist variability can often be handled by blinded reevaluation of recorded diagnoses and severity scores. On the other hand, the ability to control an intrinsic factor such as animal-to-animal biological variability is limited. Although certain variables are readily manageable, their successful control should not be taken for granted. For example, the published literature contains examples from AMA-type studies in which the quality of the histologic sections (as assessed from the provided figure images) is poor enough to be considered non-diagnostic (e.g. see Wang et al. Citation2016). Review of the AMAHCD and experience to date suggest that factors likely to have a meaningful impact on the consistency of well-conducted AMA studies are animal-to-animal variability, variability associated with NF stage, variability associated with NF stage scoring, and inter-pathologist variability.
Table 2. Potential sources of variability for the histopathologic assessment of AMA studies.
Because each study in the AMAHCD was evaluated by a single pathologist, inter-study variability and inter-pathologist variability are essentially inseparable; therefore, the precise degree of variability attributable to inter-pathologist differences cannot be determined from these data. However, the distribution of data in does suggest that a few of the eight pathologists may have had diagnostic tendencies that caused their results to differ substantively from those of their colleagues. Such tendencies may stem from differences in prior training, experience, and/or interpretation of diagnostic criteria as outlined in the aforementioned guidance materials. For example, in the two studies evaluated by Path b, zero microscopic findings were recorded for control frogs. Although it is within the realm of possibility that none of the 40 control animals in those two studies displayed any degree of FC hypertrophy or FC hyperplasia, this is considered unlikely, especially given that for one of the two studies, the median NF stage of controls was 61, which typically represents the height of TSH-induced follicular cell activity. A more plausible explanation is that, a priori, Path b established a zero threshold for all findings in controls, and scored findings in treated frogs relative to that threshold. If that was the case, it might be attributed to a general reluctance of some pathologists to report salient findings in negative control animals, out of concern that such results might reflect poorly on the study performance. The relative proportions of core diagnoses made by Path h also differed markedly from those of her/his cohorts. As mentioned previously, Path h appeared to strongly favor recording findings of thyroid hypertrophy/atrophy, possibly in lieu of FC hypertrophy/hyperplasia diagnoses. Although these particular examples may seem benign because they are confined to control animals, it is reasonable to assume that pathologist-dependent bias can extend to treated frogs, and thereby alter study outcomes.
Recommendations for improving the reliability of AMA histopathology data
Following validation efforts, the final guidance documents for the AMA were published in 2009 (OECD Citation2009; USEPA Citation2009). Based on their experience of having performed 10 AMA studies in a single laboratory, Coady et al. (Citation2014) provided several excellent recommendations relevant to the histopathology endpoint. These included: adherence to procedures outlined in the OGD; a requirement that the thyroid sections be assessed by highly trained pathologists; the scoring of all slides within a single study by the same pathologist to maintain consistency; and emphasis on the importance of NF stage matching and stage awareness when interpreting morphologic changes. However, many dozens of additional AMA studies, featuring a wide variety of chemicals, have been conducted in various laboratories since 2014. Included among the tested substances are those suspected of having weak or no thyroid agonistic or antagonistic activity, and others that appeared to cause systemic toxicity. Consequently, a broader assessment of assay performance is possible at the present time. Some of the recommendations proposed in the current review () involve clarification of diagnostic criteria that already exist within the OGD, whereas other suggestions represent slight modifications based on the results of this AMAHCD analysis, as further informed by extensive hands-on slide evaluation experience with the AMA. Furthering these broader recommendations is part of a wider project to review the performance of the in vivo tools to identify endocrine activity and disruption in fish and amphibian models (Burden et al. Citation2021).
Table 3. Proposed diagnostic refinements for AMA core diagnostic criteria.
As stipulated in the OGD, it is recommended that each set of thyroid glands in control and test article-treated frogs be assessed carefully for the existence or absence of FC hypertrophy and FC hyperplasia, while recording the magnitude of these changes if present. For the most part, these findings should be scored according to the absolute criteria indicated in the OGD, which do not rely on relative comparisons between treated and control animals. Consequently, it is anticipated that control frogs sacrificed near the peak of metamorphosis will generally exhibit some frequency above zero of FC hypertrophy, with FC hyperplasia often (but not always) occurring to a lesser extent, and that the magnitude of these findings in controls will typically be mild, less often moderate, and rarely if ever severe. It is recommended that other diagnostic terms that refer to the size, shape, and number of follicular epithelial cells (e.g. increased cell height) should not be substituted for, or used in addition to, FC hypertrophy or FC hyperplasia. Not only are these non-standardized terms a potential source of confusion, they may also skew the historical control data, thus limiting their usefulness. One suggested refinement to the OGD involves the severity grading criteria used for FC hypertrophy. According to Table 4 in Grim et al. (Citation2009) and Table 3 in OECD Citation2007a, severity is based on the percentage of cells that exhibit hypertrophy. However, Grim et al. (Citation2009) also states that the severity of FC hypertrophy is “determined by the change in percentage of cells exhibiting tall columnar structure,” which is a subtly different approach to grading FC hypertrophy, because not all hypertrophic cells have a tall columnar appearance. Meanwhile it is clear from images in the OGD (e.g. Figure 5 in Grim et al. Citation2009, and Figures 22–29 in OECD Citation2007a), that increasing grades of FC hypertrophy are associated with progressive increases in cell size. These size increases result in shifts from primarily cuboidal (no FC hypertrophy) to low columnar (mild FC hypertrophy), to medium columnar (moderate FC hypertrophy), and finally to tall columnar (severe FC hypertrophy) shape configurations. Therefore, it is suggested that these qualitative changes in cell size/shape should be used in addition to the percentages of cells affected to help distinguish among the three severity grades recorded for FC hypertrophy. One purpose for this proposed adjustment is to prevent severe FC hypertrophy, which has been primarily associated with exposure to potent thyroid hormone antagonists (Opitz et al. Citation2006; Grim et al. Citation2009; Coady et al. Citation2010; Miyata and Ose Citation2012), from being diagnosed too readily, e.g. in untreated control frogs.
Grim et al. (Citation2009) described thyroid hypertrophy or atrophy as being “dependent on a comparison to thyroid glands from control animals,” and state that “it is necessary to establish the normal variability of thyroid gland sizes in control tadpoles prior to making determinations on thyroid gland size in treatment/dose groups.” Thus, in contrast to diagnoses of FC hypertrophy and FC hyperplasia, which are recorded when specified threshold percentages of cells are affected, it is clear that the authors intended diagnoses of thyroid glandular hypertrophy and atrophy to be based on relative comparison to the distribution of gland sizes in the control group(s). Consequently, it is expected that occurrences of thyroid hypertrophy or atrophy in untreated control frogs should be quite rare (e.g. usually zero, or at most, 1–2 animals per typical AMA study). A greater frequency of thyroid hypertrophy or atrophy in the control frogs of a given study suggests that the criteria for those findings were applied inappropriately. According to the OGD, diagnoses of thyroid hypertrophy and atrophy are based almost entirely on percent changes in overall gland size. Although convenient for scoring, experience suggests that this approach may be overly simplistic. As mentioned previously, a variety of microanatomical features contribute to overall thyroid gland size; however, OECD Citation2007a states that “increases (hypertrophy) or decreases (atrophy) in the overall size of the thyroid gland are consequent of changes in follicular cell size and number.” Therefore, it follows that each diagnosis of thyroid hypertrophy should be accompanied by diagnoses of FC hypertrophy and/or FC hyperplasia. Conversely, follicles in an atrophic thyroid should be lined by a single layer of flattened epithelial cells that have minimal cytoplasm, as compared to the cuboidal epithelial cells of glands recorded simply as “not remarkable.” Meanwhile, changes affecting other anatomical features (e.g. the number and sizes of follicles, amount of interfollicular interstitium) should not be the sole contributors to diagnoses of either thyroid hypertrophy or atrophy. Furthermore, to adjust for changes in body size that may not be endocrine-related, it is proposed that diagnoses of thyroid hypertrophy or atrophy should be based on disproportionate changes in thyroid size relative to body size. Body size is a valid denominator for comparison, because in X. laevis metamorphs, changes in somatic growth are considered to be thyroid independent (Fort et al. Citation2007). Body size differences are often apparent when using low microscopic magnification to view the transverse histologic sections that contain the thyroid glands (e.g. see ), and these rough approximations are often mirrored by group-related differences in snout-vent length and whole body wet weight at the day 21 sacrifice. Precedence for this type of growth compensation already exists in the OGD; for example, HLL measurements are “normalized” quantitatively by dividing those by SVL measurements, and asynchronous development is based on comparison of HLL to NF stage (OECD Citation2009; Pawlowski et al. Citation2019). Therefore, it is logical that analogous qualitative compensation for growth effects could be applied to histopathologic determinations of thyroid hypertrophy or atrophy.
Although the OGD considers FC hypertrophy, FC hyperplasia, thyroid hypertrophy, and thyroid atrophy to be the core diagnoses of the AMA, other types of morphologic findings may be the key determinants of endocrine activity in certain studies. For example, Opitz et al. Citation2006 found differences in follicle size and colloid depletion to be particularly sensitive for detecting the goitrogenic effects of ethylenethiourea (ETU) in X. laevis tadpoles. However, to minimize the potential for creating false-positive or -negative outcomes, and to maintain the integrity of the historical control data, it is recommended that non-core and ad hoc diagnoses be employed sparingly and judiciously. As stated earlier, such diagnoses should be clearly definable, capable of being applied consistently, and plausibly linked to some type of pathological or physiological process.
Conclusions
To decrease the number of animals used in AMA studies, it would be ideal if historical control data could be substituted for results obtained from concurrent study control frogs, in at least some instances. Unfortunately, a review of the AMAHCD confirms that this approach would not be feasible, because incidences of the two most common histopathologic diagnoses, FC hypertrophy and FC hyperplasia, ranged from 0-100% and 0-60%, respectively. This high degree of variability among control groups is consistent with anecdotal experience; from a pathologist’s perspective, the pattern of diagnostic findings for each AMA control group is very nearly unique. To a certain extent, this can be true even among control groups that have the same median NF stage. Therefore, as for most types of eco/toxicology bioassays, comparison to the concurrent study controls proves to be the most valid approach for the AMA. Consequently, the AMAHCD are more likely to be useful for interpreting the relationship to treatment for less common types of findings, such as thyroid atrophy and various non-core diagnoses.
Movement currently exists within the scientific community to potentially replace the AMA with one or more new approach methodologies (NAMs; e.g. in vitro/in silico assays), such as the recently validated Xenopus Eleutheroembryonic Thyroid Assay (XETA; OECD Citation2019), which ultimately might prove to be more rapid, less expensive, and less animal-reliant. Given the likely success of such initiatives in the long term, the relevance and utility of the AMAHCD moving forward could be questioned. However, the AMA is still routinely conducted and is the current standard for thyroid effect screening. Furthermore, certain conclusions based on examination of the AMAHCD may also be applicable to thyroid assessments performed in other tests, such as the Larval Amphibian Growth and Development Assay (LAGDA, OECD TG 241). The LAGDA is a Tier 2 test that evaluates gonad histopathology as a surrogate for reproductive endpoints, in addition to assessment of the thyroid that is similar (but not identical) to the approach used in the AMA. One substantive difference in the LAGDA is the termination of frogs at a fixed stage (NF 62), as opposed to the 21-day cutoff in the AMA. In order to mitigate the effect of NF stage variation on AMA results, a similar fixed-stage approach to study termination has been proposed as an enhancement to the current AMA study design (Ortego et al. Citation2021); the resulting test has been termed the Extended Amphibian Metamorphosis Assay (EAMA). If instituted, this modification may not affect the histopathology endpoint in most cases, since the OGD already prescribes that the subset of frogs selected for histopathologic evaluation should be matched to the median stage, as much as possible (OECD Citation2009). However, because stage-matching is not feasible for every study (e.g. experiments with treatment-related developmental delay or acceleration), variability in the histopathologic results attributable to stage differences could be eliminated entirely if all frogs were sacrificed at some pre-ordained fixed stage. Although NF 62 was selected as the terminal stage for the LAGDA and EAMA assays, it is possible that this may not be the optimal fixed stage for study termination; for example, based on the AMAHCD, NF 60 may be slightly superior, because FC hypertrophy and hyperplasia tend to peak at that stage. Conversely, stages prior to NF 60 may not be viable candidates, because recent research suggest earlier stages may be comparatively insensitive to certain thyroid disrupting mechanisms (Olker et al. Citation2018).
Although the current paper has focused on primarily on diagnostic criteria used in AMA studies, the utility of this and the LAGDA protocol would also be improved if further guidance was available concerning the toxicological interpretation of such histopathology data. One reason for the lack of additional guidance is that certain exposure scenarios have not yet been investigated, despite the robust number of AMA studies that have been conducted to date. Substances tested during assay validation and subsequent published studies have generally involved known disruptors of the HPT axis, and non-thyroid-active chemicals for which the toxicologic mechanisms (if any) are not necessarily clear (Dang et al. Citation2019). Persisting research gaps include the potential impacts of caloric or protein starvation, iodine restriction, various manifestations of systemic toxicity, and specific organ system (e.g. hepatobiliary or renal) toxicity on the histopathologic endpoint in the AMA assay. The effects of starvation are especially relevant because of the potential for certain chemical exposures to cause inappetence, the occurrence of which would not be appreciated otherwise because food consumption is not measured, nor necessarily even monitored, in AMA studies. At least one very early study conducted in Rana spp. (D'Angelo et al. Citation1941) indicated that starvation during metamorphic development can induce histologically-evident decrease in thyroid size; therefore treatment-induced inappetence could be a confounding factor for some AMA studies. Other ideas for future investigations might involve the conduct of AMA experiments using established liver or kidney toxicants.
This retrospective review has demonstrated the value of examining histopathology data from control animals used in AMA studies. Specific benefits include the ability to detect potential outlier results in future studies, and a better appreciation of the nature and causes of variability in the histopathology data. The latter can be used to suggest targeted refinements in AMA methodology, diagnostic criteria, and data analysis, all toward the goal of improved assay performance and interpretation.
| Abbreviations | ||
| AMA | = | Amphibian Metamorphosis Assay |
| AMAHCD | = | AMA historical control data |
| CC | = | concurrent study control |
| DERs | = | data evaluation records |
| DS | = | developmental stage |
| EAMA | = | Extended Amphibian Metamorphosis Assay |
| EDSP | = | Endocrine Disruption Screening Program |
| ETU | = | ethylenethiourea |
| FC | = | follicular cell |
| GLP | = | good laboratory practice |
| HC | = | historical control |
| HLL | = | hind limb length |
| HPT | = | hypothalamic-pituitary-thyroid |
| Lab | = | laboratory |
| LAGDA | = | Larval Amphibian Growth and Development Assay |
| NAMs | = | new approach methodologies |
| NF | = | Nieuwkoop and Faber |
| OECD | = | Organization for Economic Co-operation and Development |
| OGD | = | original guidance documents |
| Path | = | pathologist |
| SVL | = | snout to vent length |
| TH | = | thyroid hormones |
| TSH | = | thyroid stimulating hormone |
| USEPA | = | United States Environmental Protection Agency |
| X. laevis | = | Xenopus laevis |
| XETA | = | Xenopus Eleutheroembryonic Thyroid Assay |
Acknowledgements
The authors would like to thank Scott Lynn of USEPA for supplying data from the five USEPA studies. Data were originally provided and compiled under Battelle contracts 68HEOH18D0009 and 68HERH19F0326. We are also grateful to Raechel Puglisi of the Health and Environmental Sciences Institute (HESI) for providing in-kind support to collate the historical data. Additionally, the authors gratefully acknowledge comments submitted by two independent reviewers who were selected by the Editor and were anonymous to the authors. These comments were quite helpful for revising the manuscript. This research did not receive any specific grant from funding agencies in the public, commercial, or not-for-profit sectors.
Declaration of interest
The employment affiliation of the authors is listed on the cover page. No potential conflict of interest was reported by the author(s).
Notes
References
- Bejarano AC, Puglisi R, Wolf JC, Glaberman S, Lagadic LL, Gao Z, Mitchell C, Sewell F, Embry MR, Wheeler JR. 2021. Control Performance of Amphibian Metamorphosis Assays with Xenopus laevis. SETAC Latin America 14th Biennial Meeting, Virtual, 26–29 September, 2021.
- Brooks AC, Foudoulakis M, Schuster HS, Wheeler JR. 2019. Historical control data for the interpretation of ecotoxicity data: are we missing a trick? Ecotoxicology. 28(10):1198–1209.
- Buckbinder L, Brown DD. 1993. Expression of the Xenopus laevis prolactin and thyrotropin genes during metamorphosis. Proc Natl Acad Sci USA. 90(9):3820–3824.
- Burden N, Embry MR, Hutchinson TH, Lynn SG, Maynard SK, Mitchell CA, Pellizzato F, Sewell F, Thorpe L, Weltje L, et al. 2021. Investigating endocrine-disrupting properties of chemicals in fish and amphibians: opportunities to apply the 3Rs. Integr Environ Assess Manag. DOI:https://doi.org/10.1002/ieam.4497. Epub ahead of print
- Carlsson G. 2019. Effect-based environmental monitoring for thyroid disruption in Swedish amphibian tadpoles. Environ Monit Assess. 191(7):454.
- Carlsson G, Norrgren L. 2007. The impact of the goitrogen 6-propylthiouracil (PTU) on West-African clawed frog (Xenopus tropicalis) exposed during metamorphosis. Aquat Toxicol. 82(1):55–62.
- Coady KK, Lehman CM, Currie RJ, Marino TA. 2014. Challenges and approaches to conducting and interpreting the amphibian metamorphosis assay and the fish short-term reproduction assay. Birth Defects Res B Dev Reprod Toxicol. 101(1):80–89.
- Coady K, Marino T, Thomas J, Currie R, Hancock G, Crofoot J, McNalley L, McFadden L, Geter D, Klecka G. 2010. Evaluation of the amphibian metamorphosis assay: exposure to the goitrogen methimazole and the endogenous thyroid hormone L-thyroxine. Environ Toxicol Chem. 29(4):869–880.
- Dang ZC. 2019. Endpoint sensitivity in Amphibian Metamorphosis Assay. Ecotoxicol Environ Saf. 167:513–519.
- D′Angelo SA, Gordon AS, Charipper HA. 1941. The role of the thyroid and pituitary glands in the anomalous effect of inanition on amphibian metamorphosis. J Exp Zool. 87(2):259–277.
- Fort DJ, Degitz S, Tietge J, Touart LW. 2007. The hypothalamic-pituitary-thyroid (HPT) axis in frogs and its role in frog development and reproduction. Crit Rev Toxicol. 37(1–2):117–161.
- Grim KC, Wolfe M, Braunbeck T, Iguchi T, Ohta Y, Tooi O, Touart L, Wolf DC, Tietge J. 2009. Thyroid histopathology assessments for the amphibian metamorphosis assay to detect thyroid-active substances. Toxicol Pathol. 37(4):415–424.
- Keenan C, Elmore S, Francke-Carroll S, Kemp R, Kerlin R, Peddada S, Pletcher J, Rinke M, Schmidt SP, Taylor I, Wolf DC. 2009. Best practices for use of historical control data of proliferative rodent lesions. Toxicol Pathol. 37(5):679–693.
- Korte JJ, Sternberg RM, Serrano JA, Thoemke KR, Moen SM, Lillegard KE, Hornung MW, Tietge JE, Degitz SJ. 2011. Thyroid-stimulating hormone (TSH): measurement of intracellular, secreted, and circulating hormone in Xenopus laevis and Xenopus tropicalis. Gen Comp Endocrinol. 171(3):319–325.
- Kumar V, Abbas AK, Aster JC. 2015. Robbins and Cotran pathologic basis of disease (Ninth edition). Philadelphia (PA): Elsevier Saunders.
- Leips J, Travis J. 1994. Metamorphic responses to changing food levels in two species of hylid frogs. Ecology. 75(5):1345–1356.
- Miyata K, Ose K. 2012. Thyroid hormone-disrupting effects and the Amphibian Metamorphosis Assay. J Toxicol Pathol. 25(1):1–9.
- Nieuwkoop PD, Faber J. 1994. Normal table of Xenopus laevis. New York: Garland Publishing.
- Oka T, Miyahara M, Yamamoto J, Mitsui N, Fujii T, Tooi O, Kashiwagi K, Takase M, Kashiwagi A, Iguchi T. 2009. Application of metamorphosis assay to a native Japanese amphibian species, Rana rugosa, for assessing effects of thyroid system affecting chemicals. Ecotoxicol Environ Saf. 72(5):1400–1405.
- Olker JH, Haselman JT, Kosian PA, Donnay KG, Korte JJ, Blanksma C, Hornung MW, Degitz SJ. 2018. Evaluating iodide recycling inhibition as a novel molecular initiating event for thyroid axis disruption in amphibians. Toxicol Sci. 166(2):318–331.
- Opitz R, Hartmann S, Blank T, Braunbeck T, Lutz I, Kloas W. 2006. Evaluation of histological and molecular endpoints for enhanced detection of thyroid system disruption in Xenopus laevis tadpoles. Toxicol Sci. 90(2):337–348.
- Organization of Economic Cooperation and Development (OECD). 2004. Report of the validation of the Amphibian Metamorphosis Assay for the detection of thyroid active substances: phase 1 – optimisation of the test protocol. Environmental Health and Safety Publications. Series on Testing and Assessment. No. 77, OECD, Paris.
- Organization of Economic Cooperation and Development (OECD). 2006. Current approaches in the statistical analysis of ecotoxicity data: a guide to application. OECD Series on Testing and Assessment, No. 54, OECD, Paris.
- Organization of Economic Cooperation and Development (OECD). 2007a. Guidance document on amphibian thyroid histology, OECD Series on Testing and Assessment, No. 82, OECD, Paris.
- Organization of Economic Cooperation and Development (OECD). 2007b. Final report of the validation of the Amphibian Metamorphosis Assay: phase 2 - multi-chemical interlaboratory study. Environmental Health and Safety Publications. Series on Testing and Assessment. No. 76, OECD Paris.
- Organization of Economic Cooperation and Development (OECD). 2008. Report of the validation peer review for the Amphibian Metamorphosis Assay and agreement of the Working Group of the National Coordinators of the Test Guidelines Programme on the follow-up of this report. Environmental Health and Safety Publications. Series on Testing and Assessment. No. 92, OECD, Paris.
- Organization of Economic Cooperation and Development (OECD). 2009. Amphibian Metamorphosis Assay. OECD guideline for the testing of chemicals. No. 231, OECD, Paris, France.
- Organization of Economic Cooperation and Development (OECD). 2012. OECD conceptual framework for testing and assessment of endocrine disrupters (as revised in 2012). Accessed 19 April, 2021 at https://www.oecd.org/env/ehs/testing/OECD%20Conceptual%20Framework%20for%20Testing%20and%20Assessment%20of%20Endocrine%20Disrupters%20for%20the%20public%20website.pdf.
- Organization of Economic Cooperation and Development (OECD). 2018. Revised guidance document 150 on standardised test guidelines for evaluating chemicals for endocrine disruption, OECD Series on Testing and Assessment, OECD Publishing, Paris.
- Organization of Economic Cooperation and Development (OECD). 2019. Xenopus Eleutheroembryonic Thyroid Assay (XETA), test guideline No. 248, section 2, effects on biotic systems. OECD Guideline for the Testing of Chemicals, OECD, Paris.
- Ortego LS, Olmstead AW, Weltje L, Wheeler JR, Bone AJ, Coady KK, Banman CS, Burden N, Lagadic L. 2021. The Extended Amphibian Metamorphosis Assay (EAMA): a thyroid-specific and less animal-intensive alternative to the Larval Amphibian Growth and Development Assay (LAGDA, OECD TG 241). Environ Toxicol Chem. 40(8):2135–2144.
- Pawlowski S, Dammann M, Weltje L, Champ S, Mathis M, Fort DJ. 2019. Is normalized hindlimb length measurement in assessment of thyroid disruption in the amphibian metamorphosis assay relevant? J Appl Toxicol. 39(8):1164–1172.
- Saka M, Tada N, Kamata Y. 2012. Examination of an amphibian metamorphosis assay under an individual-separated exposure system using Silurana tropicalis tadpoles. Ecotoxicol Environ Saf. 86:86–92.
- Schapaugh AW, McFadden LG, Zorrilla LM, Geter DR, Stuchal LD, Sunger N, Borgert CJ. 2015. Analysis of EPA's endocrine screening battery and recommendations for further review. Regul Toxicol Pharmacol. 72(3):552–561.
- Sternberg RM, Thoemke KR, Korte JJ, Moen SM, Olson JM, Korte L, Tietge JE, Degitz SJ. Jr. 2011. Control of pituitary thyroid-stimulating hormone synthesis and secretion by thyroid hormones during Xenopus metamorphosis. Gen Comp Endocrinol. 173(3):428–437.
- Tietge JE, Butterworth BC, Haselman JT, Holcombe GW, Hornung MW, Korte JJ, Kosian PA, Wolfe M, Degitz SJ. 2010. Early temporal effects of three thyroid hormone synthesis inhibitors in Xenopus laevis. Aquat Toxicol. 98(1):44–50.
- United States Environmental Protection Agency (USEPA). 2009. Endocrine disruptor screening program test guidelines OPPTS 890.1100: Amphibian Metamorphosis Assay (Frog). EPA 740-C-09–002. October 2009. Available at https://www.regulations.gov/document/EPA-HQ-OPPT-2009-0576-0002
- Wang C, Liang G, Chai L, Wang H. 2016. Effects of copper on growth, metamorphosis and endocrine disruption of Bufo gargarizans larvae. Aquat Toxicol. 170:24–30.