
Abstract
Excessive exposure to manganese (Mn) is linked to its accumulation in the brain and adverse neurological effects. Paramagnetic properties of Mn allow the use of magnetic resonance imaging (MRI) techniques to identify it in biological tissues. A critical review was conducted to evaluate whether MRI techniques could be used as a diagnostic tool to detect brain Mn accumulation as a quantitative biomarker of inhaled exposure. A comprehensive search was conducted in MEDLINE, EMBASE, and PubMed to identify potentially relevant studies published prior to 9 May 2022. Two reviewers independently screened identified references using a two-stage process. Of the 6452 unique references identified, 36 articles were retained for data abstraction. Eligible studies used T1-weighted MRI techniques and reported direct or indirect T1 measures to characterize Mn accumulation in the brain. Findings demonstrate that, in subjects exposed to high levels of Mn, deposition in the brain is widespread, accumulating both within and outside the basal ganglia. Available evidence indicates that T1 MRI techniques can be used to distinguish Mn-exposed individuals from unexposed. Additionally, T1 MRI may be useful for semi-quantitative evaluation of inhaled Mn exposure, particularly when interpreted along with other exposure indices. T1 MRI measures appear to have a nonlinear relationship to Mn exposure duration, with R1 signal only increasing after critical thresholds. The strength of the association varied depending on the regions of interest imaged and the method of exposure measurement. Overall, available evidence suggests potential for future clinical and risk assessment applications of MRI as a diagnostic tool.
1. Introduction
Manganese (Mn) is an essential trace element; however, excess Mn exposure has been associated with neurological dysfunction, including cognitive impairment and effects on the motor system (Dobson et al. Citation2004; O’Neal and Zheng Citation2015). Excessive and prolonged Mn exposure may lead to extrapyramidal effects such as bradykinesia and involuntary muscle contractions that are similar to Parkinson’s disease, known as “manganism” (Chen et al. Citation2018). Mn can accumulate in the brain and lead to irreversible neurological effects, which have been observed in occupational groups with high levels of exposure, such as welders, ferroalloy workers, and miners (Takeda Citation2003). Mn can be inhaled or ingested, though inhalation is the primary route of exposure in occupational settings (Kim Citation2004).
Upon inhalation, there are three established pathways for Mn uptake into the brain: (1) through the lung vasculature to the blood–brain barrier, (2) through the choroid plexus of the blood–cerebrospinal fluid barrier, or (3) through the olfactory nerve within the nasal cavity (Crossgrove and Zheng Citation2004; Peres et al. Citation2016). Each of the three pathways avoids the liver’s regulatory elimination mechanisms (Kim Citation2004; Leggett Citation2011). Particularly at high levels of inhalation exposure, Mn accumulates in the brain where it bypasses elimination pathways leading to increased concentrations in brain tissue (Crossgrove and Zheng Citation2004; Kim Citation2004). As a result of bypassing the liver, Mn intake by methods other than ingestion impacts its pharmacokinetics and homeostasis, leading to increased accumulation in specific organs, such as the brain (Leggett Citation2011).
Building on previous work by Andersen et al. (Citation2010) and Schroeter et al. (Citation2012), Ramoju et al. (Citation2017) used a validated physiologically based pharmacokinetic (PBPK) model to describe the absorption, distribution, metabolism, and elimination of Mn following inhalation, oral, or dermal exposure in humans. This model was used to predict Mn deposition in different body tissues, and specifically in different regions of the brain, where higher Mn concentrations can result in neuronal injury that can affect motor and cognitive function through mechanisms such as oxidative stress (Martinez-Finley et al. Citation2013) or misfolding of proteins such as α-synuclein and amyloid (Harischandra et al. Citation2019). An important aspect of this model is the apparent nonlinear relationship between the concentrations of Mn in inhaled air and in neural tissues, with Mn concentrations in the globus pallidus increasing markedly when Mn air levels increase above 10–100 mg Mn/m3 (see Ramoju et al. (Citation2017, Figure 6). From a risk assessment perspective, the ability to identify neural tissues where Mn tends to concentrate in both qualitative and quantitative terms using MRI would be of great value in characterizing dose–response relationships for Mn neurotoxicity following inhalation exposure (O’Neal and Zheng Citation2015).
Due to the large magnetic moment of Mn, owing to its five unpaired electrons, the presence of Mn ions in the brain shortens the T1-relaxation time and increase T1-weighted signal intensity on magnetic resonance imaging (MRI) (Kim Citation2004). As such, the deposition of Mn in the brain can be detected with T1-weighted MRI, a noninvasive clinical test (Zheng et al. Citation2011; Kwakye et al. Citation2015). T1-weighted MRI is thought to be a useful noninvasive marker of Mn exposure (Zheng et al. Citation2011). The imaging process involves placing the object into an external static magnetic field which produces magnetization within it, the direction of this magnetization can be altered by pulses of radiofrequency radiation (Fitsanakis et al. Citation2006). The magnetization returns to the direction of the original static magnetic field after the pulse occurs, the time associated with this return is called the spin lattice relaxation time or T1 (Fitsanakis et al. Citation2006). As Mn is a paramagnetic substance, it shortens the T1 relaxation time and increases the intensity of the signal obtained on MRI (Fitsanakis et al. Citation2006).
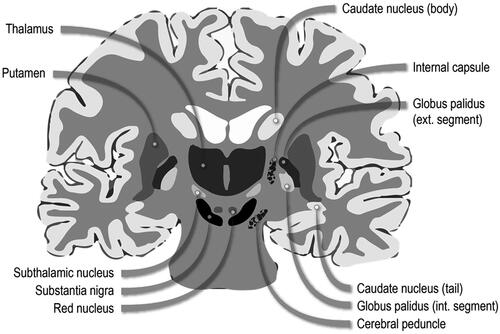
T1 intensity indices are calculated as ratios of the intensities of T1 signal in each brain region of interest to T1 signal intensity in the reference region, typically the frontal white matter (Fitsanakis et al. Citation2006). A standard parameter for determining Mn deposition is the pallidal index (PI). PI reflects a comparison of the intensity of the T1 signal in the globus pallidus, the main site of Mn accumulation, to that in the frontal white matter, which is thought to accumulate Mn at much lower levels (Fitsanakis et al. Citation2006). Following exposure, the resultant accumulation can be found in the basal ganglia of the brain, particularly in the globus pallidus, subthalamic nucleus, substantia nigra, and striatum (Kwakye et al. Citation2015; see ). The global prevalence of health effects following exposure to inhaled Mn is unknown (Kwakye et al. Citation2015). However, studies have shown correlations to an increased incidence in Mn-induced parkinsonian symptoms and associated mortality in both occupational groups with high exposure levels to Mn fumes and in geographic regions with high industrial Mn emissions (Kwakye et al. Citation2015).
Figure 1. Diagram of basal ganglia neuroanatomy. Adapted from Leisman, Melillo, and Carrick (Citation2013).
The objective of this critical review was to systematically gather evidence to evaluate whether T1 MRI signal intensities can be used as quantitative biomarkers to detect brain Mn accumulation as a result of inhaled Mn exposure. Biomarkers play a prominent role in current risk assessment frameworks, and a sensitive and specific biomarker of exposure can be utilized as a surrogate measure in the absence of direct measurements of external exposure (Krewski et al. Citation2014)—associations found between structural MRI biomarkers and external measures of Mn exposure could also inform clinical assessment, screening methodologies, and occupational health guidelines for Mn-exposed individuals, including populations of asymptomatic workers. In this review, the relationship between exposure to Mn fumes and structural imaging markers was evaluated, with the hypothesis that greater exposure to Mn would be positively associated with MRI T1 signal intensity. Whether T1 MRI measures can distinguish Mn-exposed from non-exposed subjects was also assessed.
2. Methods
2.1. Literature search
A comprehensive search was performed in three databases—MEDLINE, EMBASE, and PubMed—to identify all potentially eligible peer-reviewed studies published prior to 9 May 2022. Detailed search strategies for each database are provided in the Supplemental Material 1. To identify additional eligible studies, two clinical trials registers were searched (ClinicalTrials.gov and https://www.clinicaltrialsregister.eu/) in addition to manually searching the reference lists of relevant reviews.
2.2. Eligibility criteria and study selection
Two reviewers independently screened all identified references based on predefined eligibility criteria where only original peer-reviewed research and systematic reviews published in English were eligible for inclusion. Case reports, commentaries, editorials, conference abstracts, and grey literature were excluded. Studies must have assessed the distribution or accumulation of inhaled Mn in the brain using MRI. Studies were excluded if they examined ingested or injected Mn, as these routes of exposure greatly reduce rates of Mn clearance from the body (Fitsanakis et al. Citation2006). Similarly, populations with impaired liver function (such as chronic liver disease or cirrhosis) were excluded from this review since Mn clearance is significantly lower when liver function is impaired (Fitsanakis et al. Citation2006). Studies were excluded if they assessed Mn nanoparticles, organic Mn-containing compounds, Mn-containing fungicides or pesticides, used Mn solely as an enhancing or contrasting agent for MRI imaging of cells and tissues, or had little or no information on T1-weighted MRI as a marker of Mn deposition.
As the objective of this study was to measure accumulated Mn in the brain rather than effects of brain function, imaging techniques that measure neuronal activity were excluded. These techniques include functional MRI (fMRI), magnetic-source MRI (msMRI), activity-induced manganese-dependent MRI (AIM-MRI), nuclear magnetic resonance spectroscopy (NMR spectroscopy), and functional near-infrared spectroscopy (fNIRS).
Studies were also excluded if they represented protocol development or optimization of Mn enhanced MRI. Studies on humans or other mammals that assessed inhalation exposure were eligible for inclusion. Studies were excluded if neither a comparison group for exposure level nor a quantitative external Mn exposure level was reported. Complete eligibility criteria are presented in the Supplemental Material 1 (Table S4). Screening was performed using Covidence, a web-based software designed for streamlining systematic literature searches. A two-stage screening process was used: title and abstract screening of all identified references (Level 1), followed by full-text screening (Level 2) of studies advanced from Level 1. Disagreements between reviewers were resolved by consensus.
2.3. Data abstraction
Data from studies included in the review were extracted in Microsoft Excel using custom standardized extraction forms. The following data elements were extracted from each study: full citation, study design, participant characteristics (sample size, sex, and age), exposure characteristics (specific Mn salt, duration of exposure, and exposure concentration), results (statistically significant findings such as brain Mn levels, MRI instrumentation, region imaged, T1 image intensity, and pallidal index), and the authors’ summary of results and conclusions. Included studies were summarized and findings were discussed qualitatively highlighting key results reported. Condensed versions of the data extraction forms can be found in Supplemental Material 2. Limitations of included studies that may bias the reported findings were noted and qualitatively assessed.
3. Results
The electronic database searches identified 11,698 references in total. Following duplicate removal, 6452 citations were retained for Level 1 (title and abstract) screening. A total of 109 potentially relevant articles progressed to Level 2 (full text) screening, of which 36 studies met the eligibility criteria and underwent data abstraction (). No additional studies were identified through the reference list search of the one systematic review/meta-analysis article included in the review. Of the 36 included articles, 31 were observational human studies, 4 were experimental animal studies, and 1 was a meta-analysis. All human MRI studies included in this review were conducted in Mn-exposed workers, primarily welders (27 studies). No MRI studies among individuals environmentally exposed to Mn via inhalation route were identified. No clinical trials evaluating MRI as a diagnostic tool to detect brain Mn in occupationally exposed workers or healthy volunteers were identified in a search on US National Institutes of Health trials registry (ClinicalTrials.gov) or the EU Clinical Trials Register (https://www.clinicaltrialsregister.eu/). Experimental MRI studies included in this review were conducted in non-human primates (rhesus monkeys, cynomolgus monkeys). Most articles included in this review reported on T1 image intensity indices (e.g. pallidal index) and several articles measured T1 relaxation time/rate directly as MRI outcomes. Most MRI outcomes were measured in regions of the basal ganglia. Key findings are summarized in .
Figure 2. PRISMA diagram.
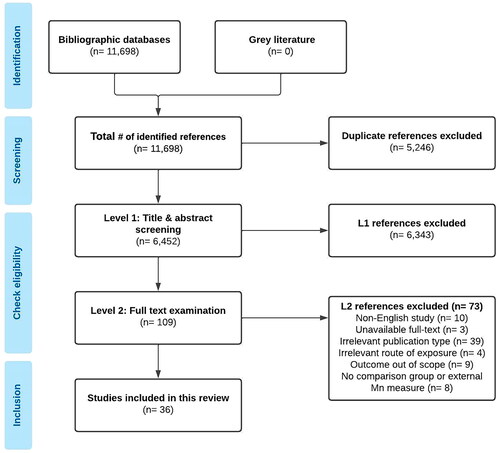
Table 1. Characteristics and findings from key studies that measured an association between T1 MRI indices and inhaled manganese exposure.
3.1. Human studies
All human MRI studies included in this review were conducted in Mn-exposed occupational groups, primarily welders, and matched controls. No MRI studies among individuals environmentally exposed to Mn via inhalation were identified. No clinical trials evaluating MRI as a diagnostic tool to detect brain Mn in occupationally exposed workers or healthy volunteers were found.
3.1.1. T1 signal intensity indices as an indicator of Mn accumulation in the brain
Fifteen observational studies and 1 meta-analysis on human subjects demonstrated that Mn exposure status was associated with significantly higher PI (Dietz et al. Citation2001; Dorman et al. Citation2006; Choi et al. Citation2007; Jiang et al. Citation2007; Kim et al. Citation2007; Chang et al. Citation2009; Chang et al. Citation2010; Dydak et al. Citation2011; Criswell et al. Citation2012; Nelson et al. Citation2012; Chang et al. Citation2013; Li et al. Citation2014; Long et al. Citation2014a; Long et al. Citation2014b; Lewis et al. Citation2016; Criswell et al. Citation2019). However, in some included studies, there were no statistically significant differences observed in PI between Mn-exposed workers and controls (Sen et al. Citation2011; Lee et al. Citation2015; Lewis et al. Citation2016). Furthermore, Dydak et al. (Citation2011) were unable to establish a cutoff value for the PI to discriminate between Mn-exposed and unexposed subjects.
Several included studies investigated correlations between the PI and other metrics of Mn exposure. Significant correlations between the PI and air Mn concentrations in the workplace were observed in four observational studies in Mn-exposed workers (Choi et al. Citation2007; Kim et al. Citation2007; Chang et al. Citation2009; Chang et al. Citation2010). While Baker et al. (Citation2015) observed no significant association between PI and predicted cumulative Mn dose, Choi et al. (Citation2007), Dietz et al. (Citation2001), and Kim et al. (Citation2007) observed significant correlations between cumulative exposure indices of Mn and PI. Additionally, estimated cumulative hours of welding was found to be significantly correlated with PI in studies by Criswell et al. (Citation2012) and Lewis et al. (Citation2016). A significant relationship between estimated cumulative Mn exposure and PI was observed by Criswell et al. (Citation2019). In some studies, statistically significant associations between PI and whole-blood Mn concentrations were reported in Mn-exposed workers (Dietz et al. Citation2001; Chang et al. Citation2009; Chang et al. Citation2010; Kim et al. Citation2011). Meanwhile, Choi et al. (Citation2007) found no significant correlation between blood Mn and PI, and Jiang et al. (Citation2007) found PI was not significantly associated with Mn whole blood or Mn plasma but was correlated with mean Mn in red blood cells (r = 0.55, p = .02). Finally, Lee et al. (Citation2015) observed no significant correlations between PI and any exposure metric (cumulative lifetime years welding, hours spent welding in 90-day period, blood Mn concentrations). However, the four studies by Lee et al. (Citation2015, Citation2016, Citation2017, Citation2019) and the Prado-Rico et al. (Citation2022) study did not include measured airborne Mn level in the workplace; they used questionnaires and occupational histories as proxy for exposure levels.
A meta-analysis by Li et al. (Citation2014) included eight studies of occupational exposure to Mn published up to April 2013. This meta-analysis shows (1) a significantly higher PI of workers occupationally exposed to Mn compared to controls with significant heterogeneity among the included studies and (2) a significant correlation between the PI and blood Mn (r = 0.42, 95% CI: 0.31–0.52). Their findings indicate that PI is an effective semi-quantitative indicator for Mn accumulation in the brain tissue. However, the authors note that these findings should be interpreted with caution as PI is calculated using the signal intensity ratio of the globus pallidus to the sub-cortical frontal white matter and the regions of interest chosen for measuring these signal intensities were determined subjectively by the operators with the use of computerized systems (Li et al. Citation2014). Further caution should be applied to interpretation of these findings as PI may also be impacted by pulse sequences in addition to Mn exposure (Li et al. Citation2014).
Different T1-weighted MRI techniques may have different sensitivity as markers of Mn accumulation in the brain. Specifically, Chang et al. (Citation2010) demonstrated that the PI obtained by the three-dimensional fast spoiled gradient-echo (FSPGR) is a better indicator of brain Mn accumulation and a better predictor of neurobehavioral performance than the PI obtained by the conventional spin-echo (SE) technique. Although many articles included in this review focus on the PI as an indicator of brain Mn accumulation from occupational exposures, some studies show that Mn deposition in the human brain is more widespread. Several included studies reported T1 signal intensity indices for regions other than the globus pallidus, including the caudate, putamen, thalamus, frontal cortex, hippocampus, posterior cingulate cortex, and a combined basal ganglia (Criswell et al. Citation2012; Chang et al. Citation2013; Long et al. Citation2014a; Baker et al. Citation2015; Criswell et al. Citation2019). Some suggest that T1 signal intensities in basal ganglia other than the globus pallidus may reflect Mn exposure equally well or better than the PI (Criswell et al. Citation2012; Baker et al. Citation2015), and “more inclusive sampling of basal ganglia regions appears to result in better markers of exposures” (Criswell et al. Citation2012). For instance, Baker et al. (Citation2015) observed significant increases in caudate, anterior and posterior putamen, and combined basal ganglia T1 indices among welders as cumulative Mn exposure increased. Similarly, Criswell et al. (Citation2012) reported strong correlations between hours of welding and T1 intensity indices in the following regions: combined basal ganglia (Spearman’s r = 0.610, p = .007), caudate (r = 0.645, p = .004), anterior putamen (r = 0.595, p = .009), and posterior putamen (r = 0.571, p = .013). The authors also conducted hierarchical linear regression analysis, which indicated that the caudate T1 intensity index was more predictive of welding exposure hours among the welder group (β = 0.485) compared to PI (β = 0.012). These findings, however, were not supported by Criswell et al. (Citation2019) who demonstrated that, although T1 intensity indices were increased in the globus pallidus and in extra-pallidal basal ganglia (caudate, anterior and posterior putamen) of Mn-exposed workers, the highest mean intensity was seen in the globus pallidus. In this study, the PI was shown to increase per 1 mg Mn/m3-year increase in cumulative Mn exposure (β = 2.33, 95% CI: 0.93 − 3.74). The PI was also associated with Unified Parkinson’s Disease Rating Scale (UPDRS3) scores, whereas the intensity indices in other brain regions were not. The authors concluded that the T1-weighted PI is “readily available, well-established, and easily acquired,” and their findings support its use as a biomarker of occupational Mn exposure.
Mn accumulation in the brain may be related not only to the intensity and duration of Mn exposure but also to characteristics of the inhaled aerosols. Long et al. (Citation2014a) studied two groups of workers occupationally exposed to Mn, welders, and smelting workers. Compared to the welders, the smelting workers were exposed to significantly higher levels of airborne Mn for significantly longer time, and the smelter group had higher Mn levels in erythrocytes and urine. Despite the higher intensity and duration of exposure in smelters, the T1 signal intensity index in this group was significantly increased (compared to controls) only in the globus pallidus whereas the welders had significantly increased T1 signal intensity indices in the globus pallidus, hippocampus, and thalamus. In addition, the T1 signal intensity index in the hippocampus of welders was significantly higher than that of smelters.
3.1.2. Direct T1 MRI measures as an indicator of Mn accumulation in the brain
Mn may also accumulate in the white matter; therefore, there is concern that T1 intensity indices (i.e. pallidal index) may be less accurate in reflecting the concentration of Mn in the brain as they are calculated relative to T1 signal intensity in the frontal white matter (Dorman et al. Citation2006; Lee et al. Citation2015; Bowler et al. Citation2018). In contrast, direct measures of T1 relaxation times or T1 relaxation rates (R1 = 1/T1) are not confounded by Mn in the frontal white matter (Bowler et al. Citation2018). In the past, studies assessing T1 relaxation times in human brain were sparse because older MRI sequences required long acquisition times to obtain T1. With recently developed fast T1 mapping imaging techniques, T1 images can be acquired in a short amount of time (Lee et al. Citation2015). MRI studies using direct T1 MRI measures suggest that Mn accumulation in the brain is widespread, with Mn accumulating both within and outside the basal ganglia (Sen et al. Citation2011; Chang et al. Citation2013; Baker et al. Citation2015; Lee et al. Citation2015; Lewis et al. Citation2016; Bowler et al. Citation2018; Ma et al. Citation2018). For instance, Sen et al. (Citation2011) concluded that Mn likely accumulates in the olfactory bulb, since they observed significantly higher T1 relaxation rates (R1) in the olfactory bulbs of welders when compared to controls.
Bowler et al. (Citation2018) demonstrated significantly shorter MRI T1 relaxation times in the globus pallidus, substantia nigra, caudate, and anterior prefrontal lobe of welders compared to controls; the difference between the exposure groups was greatest for the anterior prefrontal lobe. However, T1 relaxation times in any brain region were not correlated with the cumulative exposure index (CEI) calculated over the three months prior to testing, which, in the authors’ view, may be explained by small sample size and/or by “rather low-level exposure”. Choi et al. (Citation2007) observed significantly shorter T1 relaxation times among welders compared to controls and also found that T1 relaxation time was significantly correlated with Mn CEI (Spearman’s r = 0.41, p = .026), blood Mn concentrations (Spearman r = 0.54, p = .003), and recent Mn air concentration measures (Spearman r = 0.46, p = .012). Lee et al. (Citation2015) examined the PI and T1 R1 in the globus pallidus and in several other brain regions (amygdala, orbitofrontal grey matter, putamen, caudate nucleus) of welders and gender- and age-matched controls. This study suggests that R1 values in the globus pallidus and in other brain areas are more sensitive indicators of Mn accumulation than the PI. The R1 values more strongly correlated with measures of short-term exposure (90 days) than with measures of long-term (lifetime) exposure. R1 values in several brain regions (globus pallidus putamen and caudate nucleus) increased only after more than 300 h of welding in the 90-day period preceding MRI. This finding suggests that the relationship between Mn exposure and Mn accumulation in the brain may be nonlinear. Three studies used data from the WELDOX II study (Casjens et al. Citation2018; Pesch et al. Citation2018; Lotz et al. Citation2021). Casjens et al. (Citation2018), which focused on neurometabolites following Mn exposure, demonstrated higher median R1 values in the globus pallidus, substantia nigra and frontal lobe regions of interest in active welders compared to former welders, although they did not measure significance. The Lotz et al.’s (Citation2021) study focused on manganese exposure and fine motor skills, the authors found that high-exposed welders, defined as exposure to a concentration of respirable Mn greater than or equal to 20 µg/m3, had higher R1 values in the globus pallidus and substantia nigra compared to unexposed controls (Lotz et al. Citation2021). However, no significant difference in R1 values was found between study groups, this may be attributed to the smaller sample size of the Lotz et al. (Citation2021) study as only 78 of the 174 participants of the WELDOX II data were examined in this article due to the focus on motor tests. Pesch et al. (Citation2018) used the WELDOX II data to examine relaxation rates, the topic which best aligns with the focus of this critical review. The authors found significantly higher R1 values in the globus pallidus of active welders exposed to respirable Mn levels above 100 µg/m3, which, in the authors’ view, is consistent with the observation by Lee et al. (Citation2015) of a non-linear accumulation of Mn in the brain (Pesch et al. Citation2018). Lewis et al. (Citation2016) conducted a longitudinal study that included 29 of the 35 welders who participated in the cross-sectional study of Lee et al. (Citation2015). This longitudinal study supported the hypothesis that changes in R1 values but not changes in the PI were associated with changes in short-term welding exposure. This, in the authors’ view, may be due to the relatively low exposure levels in this cohort, to which the “traditional measures,” such as the PI, are not sensitive. The authors also noted that the associations were observed in brain regions both within and outside the basal ganglia. Prado-Rico et al. (Citation2022) estimated manganese exposure using a work history questionnaire and found no significant difference in the R1 values measured in the red nucleus, dentate nucleus, caudate nucleus, putamen, globus pallidus, and substantia nigra of welders compared to controls. Ma et al. (Citation2018) demonstrated significantly increased R1 values in the globus pallidus, substantia nigra, caudate nucleus, and the frontal cortex of welders compared to controls. However, there was no correlation between R1 values in any brain region and cumulative respirable (<4 µm) airborne Mn exposure in any exposure window (3 months, 12 months, or over the working lifetime). In the authors’ view, this suggests that, although brain Mn accumulation was observed, there is no straightforward quantitative relationship between inhaled Mn and brain Mn accumulation. Seventeen welders of the 39 welders who participated in the study reported by (Ma et al. Citation2018) agreed to participate in a follow-up study (Edmondson et al. Citation2019) and were imaged on two separate occasions approximately two years apart. This study suggests that R1 values in most brain regions decrease with decreasing Mn exposure, although the change is not linearly proportional to the change in Mn exposure. The relationship between current Mn levels and R1 values may be weaker at higher levels of cumulative lifetime exposure. In a re-analysis of the data originally collected by Ma et al. (Citation2018; Edmondson et al. Citation2020) further demonstrated that R1 was highly predictive of Mn levels in air above a threshold of 0.20 mg/m3 (accuracy of 88.8% and recall of 88.9%).
3.1.3. T1 signal intensity after cessation of Mn exposure
Two studies demonstrated increased signal intensity on T1-weighted MRI years after cessation of Mn exposure. One study (Pesch et al. Citation2018) was a cross-sectional study that compared MRI findings in active and former welders, and the other study described by Nelson et al. (Citation2012) involved ex vivo MRI of brain tissues collected at autopsy from deceased former Mn miners. The findings from these studies may be interpreted as indicative of “a persistent Mn accumulation in the brain”. An alternative explanation offered by the authors of the ex vivo study is a possible existence of a threshold above which increases in T1 signal become irreversible; the persistent signal increases may reflect the effects of Mn on surrounding tissues rather than Mn itself. It should be noted that neither of these studies was designed to investigate the time course of Mn accumulation and clearance.
3.1.4. Limitations of human studies
Common limitations of the worker studies include lack of data on air Mn levels to which study subjects were exposed. Mn exposures were assessed based on work duration or occupational groupings, such as welders vs. controls and welders vs. smelters. Few studies characterized Mn aerosols in the work environment.
3.1.5. Summary of human studies
Studies in Mn-exposed workers suggest that Mn deposition in the human brain is widespread; it accumulates both within and outside the basal ganglia. Human studies have shown that T1 signal intensities in brain areas other than the globus pallidus, particularly in the extra-pallidal basal ganglia, may reflect Mn exposure equally well or better than those measured in the globus pallidus. However, not all studies support this observation. Because direct T1 MRI measures, T1 relaxation time and T1 relaxation rate, are not confounded by T1 signal in the frontal white matter, they may be more accurate in reflecting brain Mn concentrations than T1 intensity indices. T1 relaxation rate appears to be more strongly correlated with measures of short-term occupational exposure (90 days) than with measures of long-term (lifetime) exposure. Mn accumulation in the brain may be non-linear, and the risk of Mn accumulation in the brain may be related not only to the intensity and duration of Mn exposure but also to characteristics of the inhaled aerosols. Finally, increased signal intensity on T1-weighted MRI may be seen years after cessation of Mn exposure. It is unclear, however, whether the increased signal reflects the effects of Mn on surrounding tissues rather than Mn itself.
3.2. Animal studies
3.2.1. T1 signal intensity indices as an indicator of Mn accumulation in the brain
One experimental animal study included in this review (Dorman et al. Citation2006) reported PI as an MRI outcome for Mn brain accumulation. In this study, the authors demonstrated that rhesus monkeys exposed to higher doses of Mn in air (0.3 mg Mn/m3, 1.5 mg Mn/m3) had significantly higher PI compared to control subjects and subjects exposed to lower doses of Mn (0.06 mg Mn/m3). Additionally, a statistically significant linear relationship was observed between whole-blood Mn concentrations and the PI (r2 = 0.45, p = .0011). The authors concluded that rhesus monkeys subchronically exposed to Mn show increased brain Mn concentrations—with corresponding hyperintense MRI images and increased PI.
3.2.2. Direct T1 MRI measures as an indicator of Mn accumulation in the brain
In the experimental animal study conducted by Dorman et al. (Citation2006), rhesus monkeys were exposed to various doses of manganese(II) sulfate monohydrate in an inhalation chamber for 6 h per day, 5 days per week, for a total of 65 days. Statistically significant linear relationships were found between the R1 and Mn concentrations in the following regions of interest: white matter, globus pallidus, and pituitary gland. The authors concluded that R1 may be a reliable biomarker of occupational Mn exposure and can be used to estimate brain Mn concentrations in regions of interest.
Three studies by the same group of authors examined a group of six cynomolgus monkeys exposed to high, low, and control doses of welding fumes (62 mg/m3 total suspended particulate (TSP), 31 mg/m3 TSP, and unexposed, respectively) for 2 h per day, 5 days per week, for 33 weeks, followed by a recovery period of 19 weeks (Park et al. Citation2007; Sung et al. Citation2007; Han et al. Citation2008). Sung et al. (Citation2007) demonstrated that T1 relaxation time decreased over the 180 days of welding-fume exposure for both the high- and low-exposed subjects. The authors found an association between high MRI T1 signal intensity and manganese distribution in the basal ganglia of the brain following exposure to welding fumes (Park et al. Citation2007). MRI during the exposure period revealed that T1 relaxation time was lowest after 230 days of Mn exposure and recovered rapidly after 10 weeks of cessation of Mn exposure (Park et al. Citation2007; Han et al. Citation2008). Furthermore, Mn concentrations in various regions of interest in the brain, including the globus pallidus, putamen, frontal and temporal lobes, hippocampus, and cerebellum, also decreased to levels observed in the unexposed group after 19 weeks of recovery (Han et al. Citation2008). The authors recognized their study was limited by its small sample size (n = 6) but ultimately concluded that there is potential for recovery from a high MRI T1 signal intensity induced by Mn exposure via welding fumes—even after prolonged exposure (Han et al. Citation2008). Through the elevated MRI T1 signal measurements, the globus pallidus region of the brain was identified in these subjects as a site where manganese accumulates in a dose-dependent manner (Park et al. Citation2007; Sung et al. Citation2007; Han et al. Citation2008).
3.2.3. Summary of animal studies
Small studies in experimental animals suggest that T1 MRI indices may be useful for exposure discrimination, but that plateaus in measurements occur after a certain level. Following prolonged exposure, there was a correlation between T1 relaxation times and Mn concentration in the globus pallidus. The experiments in cynomolgus monkeys found that the elevated T1 signals demonstrate dose-dependent Mn accumulation in the globus pallidus.
4. Discussion
It is well established that Mn can accumulate in the brain, which can lead to irreversible effects on neurocognition (Leggett Citation2011). Evidence from the last two decades on Mn have had profound impacts on the understanding of the transportation pathways following inhalation exposure (Leggett Citation2011). This critical review examined whether MRI techniques could be used to detect brain Mn accumulation as a quantitative biomarker of inhaled exposure. Currently available evidence suggests that T1 magnetic resonance imaging techniques may be a useful biomarker of Mn exposure, although the quantitative relationship between the dose of inhaled Mn and T1 MRI outcomes is not fully elucidated.
Studies on workers exposed to Mn indicate that Mn deposition is widespread in the human brain and accumulates both inside and outside the basal ganglia (Kim et al. Citation2011). Some research demonstrates that T1 signal intensities in brain regions other than the globus pallidus, particularly in the extra-pallidal basal ganglia, may indicate Mn exposure as well as or better than those evaluated in the globus pallidus (Kwakye et al. Citation2015). Additionally, direct T1 MRI measures—T1 relaxation time and T1 R1—may be more accurate at reflecting brain Mn concentrations than T1 intensity indices as they are measured independently from T1 signal intensity in the frontal white matter (Bowler et al. Citation2018).
Evaluating the ability for T1 MRI indices to discriminate exposure status or degree of exposure is an important consideration for evaluating MRI as a potential biomarker of Mn exposure. Several articles included in this review investigated associations between T1 MRI outcomes and cumulative Mn exposure indices, such as predicted cumulative dose of Mn, cumulative hours of welding, and cumulative exposure index of Mn (Nelson et al. Citation2012; Long et al. 2014; Ma et al. Citation2018). The majority of the studies that investigated these types of associations found significant correlations between exposure status and T1 MRI outcomes. Several studies demonstrated correlations between T1 intensity indices, such as PI, and increases in cumulative Mn exposure (Dietz et al. Citation2001; Choi et al. Citation2007; Kim et al. Citation2007; Criswell et al. Citation2012; Baker et al. Citation2015; Criswell et al. Citation2019). PI and other T1 intensity indices were also found to be correlated with blood Mn concentrations (Dietz et al. Citation2001; Kim et al. Citation2005; Dorman et al. Citation2006; Chang et al. Citation2009; Kim et al. Citation2011; Criswell et al. Citation2012) and concentrations of Mn in air (Kim et al. Citation2005; Choi et al. Citation2007; Kim et al. Citation2007; Shin et al. Citation2007; Chang et al. Citation2009) in many of the included studies. Chang et al. (Citation2010) found that measures of PI in study subjects correlated well with blood Mn levels; however, only PI measured using the three-dimensional FSPGR technique correlated with Mn concentrations in air. PI was significantly associated with Mn concentrations in erythrocytes in a study by Jiang et al. (Citation2007) but not with Mn concentration in whole blood or plasma. T1 relaxation time was statistically significantly associated with blood Mn, cumulative exposure index of Mn, and Mn levels in air according to a study by Choi et al. (Citation2007), and R1 was associated with Mn levels in air in a study by Edmondson et al. (Citation2020). R1 in the globus pallidus associated with blood Mn levels in study by Pesch et al. (Citation2018) and R1 was elevated in those exposed to higher doses of Mn in air. It is important to note that blood concentrations of Mn should likely only be used as indicators of recent Mn exposure, rather than cumulative Mn exposure or exposure history, due to liver clearance of Mn in the circulatory system Leggett (Citation2011).
Interestingly, Bowler et al. (Citation2018) noted an association between lower T1 relaxation times (specifically in the globus pallidus and anterior prefrontal lobe) and poorer performance on memory and verbal fluency and learning tests. Subjects in a study by Chang et al. (Citation2009) also underwent neurobehavioral and motor testing. PI was a better predictor of poor neurobehavioral test performance when compared to blood Mn. Criswell et al. (Citation2019) also noted a relationship between PI and UPDRS3 scores). Future applications of T1 MRI outcomes of Mn-exposed workers, when examined in tandem with neurobehavioral examinations, motor tests, and neurological exams could potentially be used to screen for manganism risk.
Many of the advancements and key findings highlighted in this study have been mentioned in earlier reviews on this topic. Zheng et al. (Citation2011), who examined human research using the PI as a measure of brain Mn, concluded that while the PI is a legitimate metric for subject comparisons within a single study, the numerical value of the PI is highly dependent on the precise imaging parameters and the reference brain area that were utilized in its development. The review notes that, in addition to the notable differences in PI levels between trials, results were not proportional to the brain Mn concentration. Furthermore, Li et al. (Citation2014) evaluated PI as a biomarker of occupational Mn exposure by conducting a meta-analysis that included results from 8 studies. The results support the use of PI as a feasible and sensitive semi-quantitative biomarker of Mn accumulation in the brain, though the authors noted that findings should be interpreted with caution due to possible selection and publication biases. PI is a valid measure for comparing study subjects as it can successfully distinguish between exposed and unexposed subjects; however, its numerical value strongly depends on the exact image parameters (which is not necessarily standardized) and the reference brain region used for calculation of the PI (Li et al. Citation2014).
Although inhaled Mn is known to accumulate in the brain following exposure, previous studies examining whether biological matrices, such as blood, urine, bone, hair, teeth, and nails, can be used to quantify Mn exposure and brain effects have not led to conclusive evidence of their performance as biomarkers of exposure (Liu et al. Citation2020). There is some evidence that MRI signal intensities may be useful as a biomarker of Mn exposure (Smith et al. Citation2007). Markers of exposure play a role in existing risk assessment frameworks, as T1 MRI outcomes examine accumulation in the target organ where health effects occur, it appears feasible that this noninvasive technique would be more indicative of current and future health implications than measures in other tissues or bodily fluids (Kim et al. Citation2005). Many studies have shown that T1 MRI intensity is expected to be reduced after cessation of exposure in asymptomatic workers (Jiang et al. Citation2007; Han et al. Citation2008). However, in asymptomatic active Mn-exposed workers, T1-weighted MRI appears to have use as an indicator of Mn exposure (Jiang et al. Citation2007). The possibility of permanent neurological damage in asymptomatic individuals further underscores the importance of validating alternative biomarkers to extrapolate the degree of exposure and establish clear exposure-effect relationships.
Individual studies included in this review had some limitations. A major limitation was that some studies used a reference group to compare exposed vs. unexposed populations, and no external Mn measurement was reported. Further to this, some studies calculated estimates of cumulative Mn exposure based on work duration or occupational groupings, such as welders vs. smelters). Current human evidence that met inclusion criteria was all based on occupational exposure settings. Another major limitation is that studies evaluating T1 MRI as a biomarker of environmental exposure are lacking.
Although inhaled Mn accumulates in several tissues with varying half-lives, the brain is the most sensitive, with Mn accumulation inducing neurological dysfunction similar to Parkinson’s Disease known as manganism (O’Neal and Zheng Citation2015). As neurological damage from Mn exposure is often irreversible upon symptom onset, a noninvasive tool to estimate the accumulation of Mn in the brain would be of particular use (O’Neal and Zheng Citation2015). Identification of Mn levels in the brain that accurately represent inhalation exposure could be useful for early diagnosis of Mn toxicity, setting occupational health guidelines, and clinical interventions. Biomarkers of effect measure the impacts to physiological processes and can provide insight into the risk of adverse health outcomes (Lowry Citation1995). Biomarkers of effect are often used to associate a causal chemical agent to the development of adverse clinical outcomes (Lowry Citation1995). Imaging techniques that measure neuronal activity, such as fMRI, magnetic resonance spectroscopy or positron emission tomography, in combination with neuromotor, behavioral or cognitive tests could theoretically be used to elucidate a biomarker of effect for inhaled manganese exposure (Zheng et al. Citation2011).
5. Conclusion
This critical review summarized findings from studies that assessed MRI T1 indices to quantitatively detect brain Mn accumulation. A systematic approach was followed, including a comprehensive search of relevant databases, independent screening of all identified references by two reviewers, and structured data abstraction.
Advancements in T1 MRI techniques have allowed researchers to measure brain Mn accumulation, particularly under conditions of high Mn exposures present with certain occupations (such as welders and smelters). T1 MRI may be a valuable semi-quantitative biomarker for Mn accumulation, and these imaging techniques could potentially be used in the context of occupational health risk assessment.
Acknowledgements
The authors would like to thank Dr. Athena Keene from Afton Chemical, a member company of the International Manganese Institute (IMnI), for helpful comments on preliminary drafts of this article; although Dr. Keene also serves as the Afton Chemical representative on the IMnI Health, Safety and Environment Committee, her comments were provided as an independent scientist with expertise in manganese toxicity. The authors gratefully acknowledge the comments of the three external reviewers selected by the editor and anonymous to the authors. As a result of their comments, we limited the scope of the paper and made a number of changes that improved the original draft of this paper.
Declaration of interest
This work was conducted under a research contract to review the recent scientific literature on manganese biomarkers between the International Manganese Institute (IMnI, www.manganese.org), an industry association representing the international manganese industry, and Risk Sciences International (RSI, www.risksciences.com), a Canadian company established in 2006 in partnership with the University of Ottawa. Additional financial support was provided by the Natural Sciences and Engineering Research Council of Canada (NSERC, www.nserc.ca) to D. Krewski, who holds the NSERC Chair in Risk Science at the University of Ottawa. N. Farhat, D. Krewski, N. Karyakina, D. Mattison, F. Momoli, S. Ramoju and N. Shilnikova were compensated by RSI for their contributions to the review. N. Farhat was also supported in part by postdoctoral fellowships from the McLaughlin Centre for Population Health Risk Assessment at the University of Ottawa and from Carleton University under the Mitacs Accelerate program (www.mitacs.ca), a peer-reviewed university-industry partnership program with RSI as the industrial partner. B. Cline contributed to this article as a senior scientist at IMnI. The authors, whose affiliations are shown on the title page, had sole responsibility for preparation of this paper, including determining the strategy for reviewing the scientific literature summarized in this article, synthesizing the findings, and drawing conclusions. Although Dr. Cline briefed the IMnI Health, Safety and Environment Committee on the results of the present review, the Committee did not provide input to this work. None of the authors have appeared before regulatory agencies on behalf of the sponsors or appeared as experts in legal proceedings concerning matters reviewed in this paper. The scientific opinions and conclusions expressed in the paper are exclusively those of the authors and are independent of the sources of financial support.
Supplemental material
Supplemental data for this article is available online at https://doi.org/10.1080/10408444.2022.2128719.
References
- Andersen ME, Dorman DC, Clewell HJ 3rd, Taylor MD, Nong A. 2010. Multi-dose-route, multi-species pharmacokinetic models for manganese and their use in risk assessment. J Toxicol Environ Health A. 73(2):217–234.
- Baker MG, Criswell SR, Racette BA, Simpson CD, Sheppard L, Checkoway H, Seixas NS. 2015. Neurological outcomes associated with low-level manganese exposure in an inception cohort of asymptomatic welding trainees. Scand J Work Environ Health. 41(1):94–101.
- Bowler RM, Yeh CL, Adams SW, Ward EJ, Ma RE, Dharmadhikari S, Snyder SA, Zauber SE, Wright CW, Dydak U. 2018. Association of MRI T1 relaxation time with neuropsychological test performance in manganese-exposed welders. Neurotoxicology. 64:19–29.
- Casjens S, Dydak U, Dharmadhikari S, Lotz A, Lehnert M, Quetscher C, Stewig C, Glaubitz B, Schmidt-Wilcke T, Edmondson D, et al. 2018. Association of exposure to manganese and iron with striatal and thalamic GABA and other neurometabolites - neuroimaging results from the WELDOX II study. NeuroToxicology. 64:60–67.
- Chang Y, Jin S-U, Kim Y, Shin KM, Lee HJ, Kim SH, Ahn J-H, Park S-J, Jeong KS, Weon YC, et al. 2013. Decreased brain volumes in manganese-exposed welders. Neurotoxicology. 37:182–189.
- Chang Y, Kim Y, Woo S-T, Song H-J, Kim SH, Lee H, Kwon YJ, Ahn J-H, Park S-J, Chung I-S, et al. 2009. High signal intensity on magnetic resonance imaging is a better predictor of neurobehavioral performances than blood manganese in asymptomatic welders. Neurotoxicology. 30(4):555–563.
- Chang Y, Woo S-T, Kim Y, Lee J-J, Song H-J, Lee HJ, Kim SH, Lee H, Kwon YJ, Ahn J-H, et al. 2010. Pallidal index measured with three-dimensional T1-weighted gradient echo sequence is a good predictor of manganese exposure in welders. J Magn Reson Imaging. 31(4):1020–1026.
- Chen P, Bornhorst J, Aschner M. 2018. Manganese metabolism in humans. Front Biosci (Landmark Ed). 23:1655–1679.
- Choi DS, Kim EA, Cheong H-K, Khang HS, Ryoo JW, Cho JM, Sakong J, Park I. 2007. Evaluation of MR signal index for the assessment of occupational manganese exposure of welders by measurement of local proton T1 relaxation time. Neurotoxicology. 28(2):284–289.
- Criswell SR, Nielsen SS, Warden MN, Flores HP, Lenox-Krug J, Racette S, Sheppard L, Checkoway H, Racette BA. 2019. MRI signal intensity and parkinsonism in manganese-exposed workers. J Occup Environ Med. 61(8):641–645.
- Criswell SR, Perlmutter JS, Huang JL, Golchin N, Flores HP, Hobson A, Aschner M, Erikson KM, Checkoway H, Racette BA. 2012. Basal ganglia intensity indices and diffusion weighted imaging in manganese-exposed welders. Occup Environ Med. 69(6):437–443.
- Crossgrove J, Zheng W. 2004. Manganese toxicity upon overexposure. NMR Biomed. 17(8):544–553.
- Dietz MC, Ihrig A, Wrazidlo W, Bader M, Jansen O, Triebig G. 2001. Results of magnetic resonance imaging in long-term manganese dioxide-exposed workers. Environ Res. 85(1):37–40.
- Dobson AW, Erikson KM, Aschner M. 2004. Manganese neurotoxicity. Ann N Y Acad Sci. 1012:115–128.
- Dorman DC, Struve MF, Wong BA, Dye JA, Robertson ID. 2006. Correlation of brain magnetic resonance imaging changes with pallidal manganese concentrations in rhesus monkeys following subchronic manganese inhalation. Toxicol Sci. 92(1):219–227.
- Dydak U, Jiang Y-M, Long L-L, Zhu H, Chen J, Li W-M, Edden RAE, Hu S, Fu X, Long Z, et al. 2011. In vivo measurement of brain GABA concentrations by magnetic resonance spectroscopy in smelters occupationally exposed to manganese. Environ Health Perspect. 119(2):219–224.
- Edmondson DA, Ma RE, Yeh C-L, Ward E, Snyder S, Azizi E, Zauber SE, Wells EM, Dydak U. 2019. Reversibility of neuroimaging markers influenced by lifetime occupational manganese exposure. Toxicol Sci. 172(1):181–190.
- Edmondson DA, Yeh C-L, Hélie S, Dydak U. 2020. Whole-brain R1 predicts manganese exposure and biological effects in welders. Arch Toxicol. 94(10):3409–3420.
- Fitsanakis VA, Zhang N, Avison MJ, Gore JC, Aschner JL, Aschner M. 2006. The use of magnetic resonance imaging (MRI) in the study of manganese neurotoxicity. Neurotoxicology. 27(5):798–806.
- Han JH, Chung YH, Park JD, Kim CY, Yang SO, Khang HS, Cheong HK, Lee JS, Ha CS, Song C-W, et al. 2008. Recovery from welding-fume-exposure-induced MRI T1 signal intensities after cessation of welding-fume exposure in brains of cynomolgus monkeys. Inhal Toxicol. 20(12):1075–1083.
- Harischandra DS, Ghaisas S, Zenitsky G, Jin H, Kanthasamy A, Anantharam V, Kanthasamy AG. 2019. Manganese-induced neurotoxicity: new insights into the triad of protein misfolding, mitochondrial impairment, and neuroinflammation [Review]. Front Neurosci. 13:654.
- Jiang Y, Zheng W, Long L, Zhao W, Li X, Mo X, Lu J, Fu X, Li W, Liu S, et al. 2007. Brain magnetic resonance imaging and manganese concentrations in red blood cells of smelting workers: search for biomarkers of manganese exposure. Neurotoxicology. 28(1):126–135.
- Kim E, Kim Y, Cheong H-K, Cho S, Shin YC, Sakong J, Kim KS, Yang JS, Jin Y-W, Kang S-K. 2005. Pallidal index on MRI as a target organ dose of manganese: structural equation model analysis. Neurotoxicology. 26(3):351–359.
- Kim EA, Cheong HK, Choi DS, Sakong J, Ryoo JW, Park I, Kang DM. 2007. Effect of occupational manganese exposure on the central nervous system of welders: 1H magnetic resonance spectroscopy and MRI findings. Neurotoxicology. 28(2):276–283.
- Kim Y. 2004. High signal intensities on T1-weighted MRI as a biomarker of exposure to manganese. Ind Health. 42(2):111–115.
- Kim Y, Jeong KS, Song H-J, Lee J-J, Seo J-H, Kim G-C, Lee HJ, Kim HJ, Ahn J-H, Park S-J, et al. 2011. Altered white matter microstructural integrity revealed by voxel-wise analysis of diffusion tensor imaging in welders with manganese exposure. Neurotoxicology. 32(1):100–109.
- Krewski D, Westphal M, Andersen ME, Paoli GM, Chiu WA, Al-Zoughool M, Croteau MC, Burgoon LD, Cote I. 2014. A framework for the next generation of risk science. Environ Health Perspect. 122(8):796–805.
- Kwakye GF, Paoliello MM, Mukhopadhyay S, Bowman AB, Aschner M. 2015. Manganese-induced parkinsonism and Parkinson’s disease: shared and distinguishable features. Int J Environ Res Public Health. 12(7):7519–7540.
- Lee E-Y, Eslinger PJ, Flynn MR, Wagner D, Du G, Lewis MM, Kong L, Mailman RB, Huang X. 2017. Association of neurobehavioral performance with R2* in the caudate nucleus of asymptomatic welders. Neurotoxicology. 58:66–74.
- Lee E-Y, Flynn MR, Du G, Lewis MM, Fry R, Herring AH, Van Buren E, Van Buren S, Smeester L, Kong L, et al. 2015. T1 relaxation rate (R1) indicates nonlinear Mn accumulation in brain tissue of welders with low-level exposure. Toxicol Sci. 146(2):281–289.
- Lee E-Y, Flynn MR, Du G, Lewis MM, Herring AH, Van Buren E, Van Buren S, Kong L, Mailman RB, Huang X. 2016. Editor’s highlight: lower fractional anisotropy in the globus pallidus of asymptomatic welders, a marker for long-term welding exposure. Toxicol Sci. 153(1):165–173.
- Lee E-Y, Flynn MR, Du G, Lewis MM, Kong L, Yanosky JD, Mailman RB, Huang X. 2019. Higher hippocampal mean diffusivity values in asymptomatic welders. Toxicol Sci. 168(2):486–496.
- Leggett RW. 2011. A biokinetic model for manganese. Sci Total Environ. 409(20):4179–4186.
- Leisman G, Melillo R, Carrick F. 2013. Clinical Motor and Cognitive Neurobehavioral Relationships in the Basal Ganglia. In Barrios F, Bauer C, editor(s). Basal Ganglia-An Integrative View. London, IntechOpen. Doi:10.5772/55227
- Lewis MM, Lee E-Y, Jo HJ, Du G, Park J, Flynn MR, Kong L, Latash ML, Huang X. 2016. Synergy as a new and sensitive marker of basal ganglia dysfunction: a study of asymptomatic welders. Neurotoxicology. 56:76–85.
- Li S-J, Jiang L, Fu X, Huang S, Huang Y-N, Li X-R, Chen J-W, Li Y, Luo H-L, Wang F, et al. 2014. Pallidal index as biomarker of manganese brain accumulation and associated with manganese levels in blood: a meta-analysis. PLoS One. 9(4):e93900.
- Liu W, Xin Y, Li Q, Shang Y, Ping Z, Min J, Cahill CM, Rogers JT, Wang F. 2020. Biomarkers of environmental manganese exposure and associations with childhood neurodevelopment: a systematic review and meta-analysis. Environ Health. 19(1):104.
- Long Z, Jiang Y-M, Li X-R, Fadel W, Xu J, Yeh C-L, Long L-L, Luo H-L, Harezlak J, Murdoch JB, et al. 2014a. Vulnerability of welders to manganese exposure – a neuroimaging study. Neurotoxicology. 45:285–292.
- Long Z, Li XR, Xu J, Edden RAE, Qin WP, Long LL, Murdoch JB, Zheng W, Jiang YM, Dydak U. 2014b. Thalamic GABA predicts fine motor performance in manganese-exposed smelter workers. PLoS One. 9(2):e88220.
- Lotz A, Pesch B, Casjens S, Lehnert M, Zschiesche W, Taeger D, Yeh C-L, Weiss T, Schmidt-Wilcke T, Quetscher C, et al. 2021. Association of exposure to manganese and fine motor skills in welders - results from the WELDOX II study. Neurotoxicology. 82:137–145.
- Lowry LK. 1995. Role of biomarkers of exposure in the assessment of health risks. Toxicol Lett. 77(1-3):31–38.
- Ma RE, Ward EJ, Yeh C-L, Snyder S, Long Z, Gokalp Yavuz F, Zauber SE, Dydak U. 2018. Thalamic GABA levels and occupational manganese neurotoxicity: association with exposure levels and brain MRI. Neurotoxicology. 64:30–42.
- Martinez-Finley EJ, Gavin CE, Aschner M, Gunter TE. 2013. Manganese neurotoxicity and the role of reactive oxygen species. Free Radic Biol Med. 62:65–75.
- Nelson G, Criswell SR, Zhang J, Murray J, Racette BA. 2012. Research capacity development in South African manganese mines to bridge exposure and neuropathologic outcomes. Neurotoxicology. 33(4):683–686.
- O’Neal SL, Zheng W. 2015. Manganese toxicity upon overexposure: a decade in review. Curr Envir Health Rpt. 2(3):315–328.
- Park JD, Chung YH, Kim CY, Ha CS, Yang SO, Khang HS, Yu IK, Cheong HK, Lee JS, Song C-W, et al. 2007. Comparison of high MRI T1 signals with manganese concentration in brains of cynomolgus monkeys after 8 months of stainless steel welding-fume exposure. Inhal Toxicol. 19(11):965–971.
- Peres TV, Schettinger MR, Chen P, Carvalho F, Avila DS, Bowman AB, Aschner M. 2016. Manganese-induced neurotoxicity: a review of its behavioral consequences and neuroprotective strategies. BMC Pharmacol Toxicol. 17(1):57.
- Pesch B, Dydak U, Lotz A, Casjens S, Quetscher C, Lehnert M, Abramowski J, Stewig C, Yeh C-L, Weiss T, et al. 2018. Association of exposure to manganese and iron with relaxation rates R1 and R2*- magnetic resonance imaging results from the WELDOX II study. Neurotoxicology. 64:68–77.
- Prado-Rico JM, Lee E-Y, Wang EW, Yanosky JD, Kong L, Chen H, Navas-Acien A, Du G, Lewis MM, Mailman RB, et al. 2022. Higher R2* in the red nucleus is associated with lead exposure in an asymptomatic welder cohort. Toxicol Sci. 187(2):345–354.
- Ramoju SP, Mattison DR, Milton B, McGough D, Shilnikova N, Clewell HJ, Yoon M, Taylor MD, Krewski D, Andersen ME. 2017. The application of PBPK models in estimating human brain tissue manganese concentrations. Neurotoxicology. 58:226–237.
- Schroeter JD, Dorman DC, Yoon M, Nong A, Taylor MD, Andersen ME, Clewell HJ. 2012. Application of a multi-route physiologically based pharmacokinetic model for manganese to evaluate dose-dependent neurological effects in monkeys. Toxicol Sci. 129(2):432–446.
- Sen S, Flynn MR, Du G, Tröster AI, An H, Huang X. 2011. Manganese accumulation in the olfactory bulbs and other brain regions of "asymptomatic" welders. Toxicol Sci. 121(1):160–167.
- Shin YC, Kim E, Cheong H-K, Cho S, Sakong J, Kim KS, Yang JS, Jin Y-W, Kang S-K, Kim Y. 2007. High signal intensity on magnetic resonance imaging as a predictor of neurobehavioral performance of workers exposed to manganese. Neurotoxicology. 28(2):257–262.
- Smith D, Gwiazda R, Bowler R, Roels H, Park R, Taicher C, Lucchini R. 2007. Biomarkers of Mn exposure in humans. Am J Ind Med. 50(11):801–811.
- Sung JH, Kim CY, Yang SO, Khang HS, Cheong HK, Lee JS, Song C-W, Park JD, Han JH, Chung YH, et al. 2007. Changes in blood manganese concentration and MRI t1 relaxation time during 180 days of stainless steel welding-fume exposure in cynomolgus monkeys. Inhal Toxicol. 19(1):47–55.
- Takeda A. 2003. Manganese action in brain function. Brain Res Brain Res Rev. 41(1):79–87.
- Zheng W, Fu SX, Dydak U, Cowan DM. 2011. Biomarkers of manganese intoxication. Neurotoxicology. 32(1):1–8.