
Abstract
Historically, benzene has been widely used in a large variety of applications. Occupational exposure limits (OELs) were set for benzene as it was found to be acutely toxic, causing central nervous system depression at high exposures. OELs were lowered when it was discovered that chronic exposure to benzene could cause haematotoxicity. After confirmation that benzene is a human carcinogen causing acute myeloid leukaemia and possibly other blood malignancies, OEL were further lowered. The industrial application of benzene as solvent is almost completely discontinued but it is still used as feedstock for the production of other materials, such as styrene. Occupational exposure to benzene may also occur since it is present in crude oil, natural gas condensate and a variety of petroleum products and because benzene can be formed in combustion of organic material. In the past few years, lower OELs for benzene in the range of 0.05–0.25 ppm have been proposed or were already established to protect workers from benzene-induced cancer. The skin is an important potential route of exposure and relatively more important at lower OELs. Consequently, human biomonitoring – which integrates all exposure routes – is routinely applied to control overall exposure to benzene. Several potential biomarkers have been proposed and investigated. For compliance check of the current low OELs, urinary S-phenylmercapturic acid (S-PMA), urinary benzene and blood benzene are feasible biomarkers. S-PMA appears to be the most promising biomarker but proper validation of biomarker levels corresponding to airborne benzene concentrations below 0.25 ppm are needed.
Introduction
Benzene is a ubiquitous chemical as it is produced in combustion processes of organic materials and also present in crude oil, natural gas, and a wide variety of lighter petroleum products, such as gasoline. As a consequence, benzene may be emitted in various industrial and transportation settings and presents an occupational and environmental hazard. Obviously, the adverse health effects that may be caused by benzene depends on both the level and the duration of exposure. Over time, exposure levels have dramatically decreased. At present, traffic and emissions from petrochemical industries are the most important sources for benzene in ambient air. For individuals, the major exposure to benzene may result from cigarette smoke (both direct or second-hand) and from tools with gasoline-powered engines, especially if these are stored in garages attached to homes.
Inhalation is the most common route of exposure, but benzene rapidly penetrates the skin (Paustenbach et al. Citation1992; Hanke et al. Citation2000; Williams and Paustenbach Citation2003; Bogen and Sheehan Citation2014; Jakasa et al. Citation2015). As a consequence, at lower airborne concentrations of benzene the relative contribution of dermal exposure gets more important. Occupational and environmental exposures to benzene have declined since regulations limit benzene in gasoline and smoking has been banned from public and working places in certain countries. The effectiveness of and compliance with the regulations is best controlled through biological monitoring (human biomonitoring). Human biomonitoring of benzene exposure involves the quantitative determination of the concentration of benzene or its metabolites in biological samples. It provides a reliable exposure metric for health risk assessment because it integrates all possible routes of exposure (inhalation, ingestion, dermal).
Human biomarkers of benzene exposure include benzene itself in exhaled breath, blood and urine, and a variety of its urinary metabolites. The low environmental levels of benzene and the increasingly lower occupational exposure limits (OELs) for benzene put very stringent demands on the various human biomarkers. The purpose of this review is to present an overview of the history of benzene as an occupational hazard and the associated OEL setting, and to discuss human biomonitoring of benzene exposure with a focus on the reliability and practicability of the various biomarkers.
History of benzene as (occupational) hazard and exposure limits setting
History of production and use
Benzene is a small and volatile single-ring aromatic hydrocarbon that occurs naturally in crude oil and natural gas and is formed in almost any combustion process of organic matter. Benzene was first isolated as a discrete substance in the early nineteenth century and halfway through the nineteenth century the first industrial production came about through fractional distillation of coal tar (Mansfield Citation1849). Initially, benzene was used in cosmetics and after-shave because of its pleasant smell, and it was even used as therapeutic agent to cure several types of leukaemia (Rolleston and Boyd Citation1914; Ross Citation1914; Weber Citation1914; Stolkind Citation1931). The use of benzene increased dramatically when it was recognised as an excellent solvent for many (organic) materials. Benzene was widely used in adhesives and in the rubber industry as it proved the ideal solvent for latex, but also in a wide variety of other applications, such as degreasing of metal surfaces and decaffeinating coffee. The use of benzene in industrial applications increased over time and until the second world war its production was almost entirely based on coal tar distillation. After the second world war benzene became more important as a starting material to produce other chemicals and the production from crude oil increased sharply. Nowadays, more than half of all benzene produced annually serves as building block for ethylbenzene to produce styrene and subsequently polystyrene. Other uses comprise the production of phenol, aniline and detergent feedstocks.
History of exposure and toxicity
In the late nineteenth and early twentieth century, along with its increasing production and widespread use, the toxicity of benzene became apparent. Next to its excellent properties as a solvent, one of the main reasons for the wide-spread use of benzene was its high volatility. In many applications, benzene was used to spread rubber, or some other material, over a surface or fabric, or to allow pouring a dissolved material into a mould because its rapid evaporation allowed faster production. As a consequence, high concentrations of benzene would be present in the ambient air in the working environment and pose a serious risk for causing toxicity. The acute toxicity of inhalation of high concentrations benzene (typically an hour at concentrations of 500–3000 ppm) was recognised early on because it caused – like many other organic solvents – drowsiness and dizziness, irregular heartbeat, and, at very high concentrations (5–10 min at concentrations greater than 10,000 ppm), even unconsciousness and death. Early reports on benzene poisoning also describe internal bleeding. One of the first reports on chronic benzene intoxication, including four fatal cases, also includes the description of a series of animal experiments in which rabbits are exposed to benzene to confirm the hematological effects observed in humans (Santesson Citation1897). Several other reports about benzene intoxications, some with a fatal outcome, followed and reported haematotoxicity with leucopoenia (Selling Citation1910; Hamilton Citation1922). Experiments in which rabbits were treated with benzene by injection or inhalation reproduced the toxic effects on the blood that were seen in humans exposed to benzene (Selling Citation1916; Weiskotten et al. Citation1920). Although already since the late nineteenth century case reports had associated exposure to benzene with leukaemia (Le Noir and Claude Citation1897), and more reports followed (Vigliani and Saita Citation1948, Citation1964), it took until the early 1970s that the association between acute leukaemia and benzene was sufficiently strong to trigger an evaluation as to its carcinogenicity by the WHO International Agency on the Research of Cancer (IARC) (Aksoy et al. Citation1972; Aksoy, Erdem, and DinCol Citation1974; Aksoy, Erdem, Erdogan, et al. Citation1974). In its first monograph on benzene, IARC concludes from the available animal data that “The data reported do not permit the conclusion that carcinogenic activity has been demonstrated” and for the epidemiological data “It is established that exposure to commercial benzene or benzene-containing mixtures may result in damage to the haematopoietic system. A relationship between such exposure and the development of leukaemia is suggested by many case reports, and this suggestion is strengthened by a case-control study from Japan” (IARC Citation1974). In the re-evaluation in 1982, IARC concludes that “There is sufficient evidence that benzene is carcinogenic to man” considering that “It is established that human exposure to commercial benzene or benzene-containing mixtures can cause damage to the haematopoietic system, including pancytopenia. The relationship between benzene exposure and the development of acute myeloid leukaemia (AML) has been established in epidemiological studies.” (IARC Citation1982). This conclusion was reconfirmed in the 1987 re-evaluation (IARC Citation1987). At its latest re-evaluations of the carcinogenicity of benzene in 2009 and 2017, IARC concluded that there was sufficient evidence for the carcinogenicity of benzene in both humans and animals. The relationship between benzene exposure and AML in adults was considered causal, increasing the risk when the life-time dose is in the vicinity of 25 to 400 ppm-years. For other blood cancers (non-Hodgkin lymphoma, chronic lymphoid leukaemia, multiple myeloma, chronic myeloid leukaemia, and acute myeloid leukaemia in children) positive correlations were observed without conclusive evidence (IARC Citation2012, Citation2018). In addition, the conclusion that benzene was a human carcinogen was reported to be “supported by mechanistic data demonstrating that benzene exhibits many of the key characteristics of carcinogens. In particular, there is strong evidence, including in exposed humans, that benzene: is metabolically activated to electrophilic metabolites; induces oxidative stress and associated oxidative DNA damage; is genotoxic, inducing DNA damage and chromosomal changes; is immunosuppressive; and causes haematotoxicity.” (IARC Citation2018). The recognition of the underlying mechanisms of toxicity, in particularly for carcinogenic substances, is important as it determines the type of OEL. For stochastic genotoxic carcinogens it is generally accepted that every exposure, regardless its magnitude, is associated with an increased cancer risk. As a consequence, OELs for genotoxic substances would be derived to correspond to an acceptable risk and essentially be risk numbers. However, non-stochastic genotoxic substances are considered to have a threshold of exposure below which there is no increased cancer risk. Therefore, OELs that reflect levels of exposure below which the increased risk of cancer is negligible can be derived for these substances.
History of occupational exposure limits (OELs)
The setting of OELs over time reflects the recognition of the various toxic effects of benzene (). The American Conference of Governmental Industrial Hygienists (ACGIH) initially set a threshold limit value (TLV) of 100 ppm in 1946, which was mainly directed towards prevention of acute toxicity, but this value was reduced to 50 ppm as an 8-h time weighted average (8-h TWA) a year later. Another year later, in 1948, the American Petroleum Institute (API) concluded, based on experiences in the oil industry, that the OEL should be lower than 50 ppm. That same year ACGIH halved their TLV to 25 ppm (8-hTWA), a value that was adopted by API in 1957. The ACGIH kept the TLV of 25 ppm, as it caused no signs of acute toxicity at this level, until 1977 when it was reduced to 10 ppm (8-h TWA). In 1997 the TLV (8-h TWA) was lowered to its current value of 0.5 ppm (8-h TWA). The USA OSHA set an PEL (Permissible Exposure Limit) of 1 ppm (8h TWA) with a STEL (Short-term Exposure Limit) of 5 ppm for 15 min in 1996. In Europe a similar trend was followed, especially after 1997 when a binding OEL of 1 ppm (8-h TWA) was adopted in the EU in a Council Directive that allowed for a gradual implementation by the individual Member States. In Germany, the Deutsche Forschungsgemeinchaft (DFG) proposed an OEL (8-h TWA) of 25 ppm in 1964, which was lowered to 8 ppm in 1979. In 1991 the OEL in Germany was lowered to 5 ppm in 1991, then to 2.5 ppm in 1994, and in 2003 to its current value of 1 ppm. Similarly, the UK HSE adopted an OEL of 25 ppm in 1967 and lowered it to 5 ppm in 1988, to 3 ppm in 2000 and finally to 1 ppm in 2003. In the Netherlands, the same trend was followed with OELs of 10 ppm, 2.5 ppm and 1 ppm, successively, until in 2014, the Health Council advised an OEL of 0.2 ppm (8-h TWA) which came into force in 2017. There is a fundamental difference between this value of 0.2 ppm and all other values as it is a Health-Based Recommended OEL (HBROEL), based on the assumption that benzene is a non-stochastic genotoxic substanceAll previous values that were set considering that benzene was a human carcinogen were in fact risk numbers since it was assumed that benzene was a stochastic genotoxicant. In contrast to these values, from which the expected additional cancer risk at the exposure level could theoretically be calculated, the HBROEL value is considered a safe value below which no additional health risks are expected (DECOS Citation2014). In 2018, the Committee for Risk Assessment (RAC) of the European Chemicals Agency (ECHA) issued an opinion suggesting an OEL of 0.05 ppm (RAC Citation2018). The RAC also concludes that this value is based on a threshold mode-of-action and can be considered to be associated with no significant residual cancer risk and will also avoid other adverse effects. More recently, an OEL for benzene of 0.25 ppm (8-h TWA) was proposed based on a systematic review using only quality-assessed human data on the genotoxic and haematotoxic effects of benzene (Schnatter et al. Citation2020). Like with the OEL proposed by DECOS and RAC, the proposed value of 0.25 ppm (8-h TWA) is considered a safe level.
Table 1. Historical overview of OEL setting by different authorities.
Human biomonitoring of benzene exposure
Exposure to benzene is routinely assessed by biological monitoring since the 1960. Over time, a large number of approaches have been developed and applied. Theoretically, benzene itself can be determined as a biomarker in exhaled breath, blood, or urine and, alternatively, one of its metabolites can be measured as a biomarker in blood or urine. Over time, most of the possible approaches have been tried and each has its distinct advantages and disadvantages. For most biomarkers the continuously lower exposure limits pose specific challenges and reference levels or biological limit values have only been set for a relatively small number of biomarkers.
Breath
Benzene is a highly volatile compound and upon inhalation about half the amount inhaled will be retained (ATSDR Citation2007). Benzene that has been taken up into the body, regardless whether the exposure was by inhalation, through the skin, or via ingestion, will be partially exhaled. Since the analytical techniques for detection of benzene in exhaled breath are very sensitive, exhaled benzene can reliably be measured after low levels of exposure to benzene (Kok and Ong Citation1994; Plebani et al. Citation1999; Amorim et al. Citation2008). Various studies have been conducted to investigate the potential of exhaled breath benzene as biomarker for exposure to low airborne concentrations of benzene (Perbellini et al. Citation1988; Hotz et al. Citation1997; Perbellini et al. Citation2003). Breath benzene concentrations typically were very well correlated with blood benzene levels, as expected, but also with urinary benzene levels. The methodology was also sensitive enough to differentiate between smokers and non-smokers. However, although in some of these studies statistically significant correlations were found between airborne levels of benzene and the concentrations of benzene in exhaled air, these correlations were not as robust as for urinary biomarkers such as S-phenylmercapturic acid (S-PMA) and even t,t-muconic acid (tt-MA). More importantly, the various available studies do not provide a consistent correlation between airborne benzene and exhaled breath benzene concentrations, which may be primarily due to the difficulties in sampling as well as to contaminations, and the lack of standardisation (Ong and Lee Citation1994; Ong et al. Citation1996; Hotz et al. Citation1997; Hays et al. Citation2012). An additional factor may be the very short apparent half-life of exhaled benzene and indeed, measurements of benzene in post-shift alveolar air measurements correlated reasonably well to 4-h TWA, but not 8-h TWA, measurements of benzene in air (Forsell et al. Citation2019). As a consequence, no formal biological limit values for benzene in expired air have been proposed (Arnold et al. Citation2013).
Blood
From a bio-analytical chemistry point of view, blood is an easy biological medium for analysis of volatile organic chemicals and benzene in blood has been widely investigated as biomarker for benzene exposure (Perbellini et al. Citation1988; Angerer et al. Citation1991; Brugnone et al. Citation1992; Brugnone et al. Citation1998; Brugnone et al. Citation1999; Perbellini et al. Citation2002; Alegretti et al. Citation2004; Forsell et al. Citation2019). Although variation amongst studies was reported, within studies typically good correlations were found between the concentrations in ambient air and concentrations of benzene in blood. A possible reason for the variation between studies may be that the biological half-life of benzene in blood is in the order of minutes and, consequently, transient exposures can easily be missed. Various physiologically-based kinetic models (PBK-models) were developed for benzene in humans (Travis et al. Citation1990; Bois et al. Citation1996; Brown et al. Citation1998; Sinclair et al. Citation1999; Yokley et al. Citation2006; Knutsen et al. Citation2013; Valcke and Haddad Citation2015) and allowed to set biological monitoring equivalent (BE) values for benzene (Hays et al. Citation2012), which may be helpful for interpretation of biomonitoring results (Hays et al. Citation2008; LaKind et al. Citation2008).
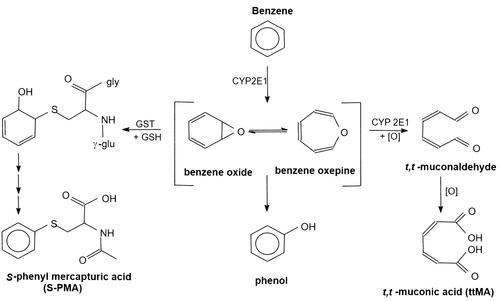
Apart for measuring benzene itself, blood has also been investigated as specimen for the analysis of protein adducts of benzene metabolites. Benzene undergoes oxidative metabolism to several electrophilic metabolites that can bind to blood proteins such as albumin and haemoglobin. The primary oxidative metabolite is benzene oxide, which is highly reactive and can bind to cysteine sulfhydryl residues and to N-terminal valine residues in proteins. S-Phenylcysteine could indeed be detected in both the haemoglobin and albumin of exposed individuals (Bechtold et al. Citation1992; Bechtold et al. Citation1992; Yeowell-O'Connell et al. Citation1996; Yeowell-O'Connell et al. Citation1998; Hanway et al. Citation2000). Benzene oxide is unstable and will re-arrange quickly to phenol that can be oxidised to 1,2- and 1,4-benzoquinone which can also bind to the cysteine residues in both haemoglobin and albumin in humans (Yeowell-O'Connell et al. Citation2001; Rappaport et al. Citation2002; Rappaport et al. Citation2005). It turned out, however, that the adduct levels did not correlate well with airborne exposure levels (Yeowell-O'Connell et al. Citation2001, Lin et al. Citation2006, Lin et al. Citation2007). This may be due to the instability of the adducts and is most likely also influenced by the relatively high backgrounds in humans of phenol and hydroquinones from the diet (McDonald et al. Citation2001; Johnson et al. Citation2007).
In contrast to benzene in blood, for which good correlations with the concentrations of benzene in ambient air were found, for benzene oxide and benzoquinone adducts in haemoglobin and albumin no reliable correlation with airborne concentrations of benzene could be established. The DFG established EKA values (i.e. exposure equivalent values for carcinogenic substances) for benzene in blood for airborne concentrations of benzene between 0.3 and 4 ppm, ranging from 0.9 to 38 µg benzene/L measured in blood samples collected at the end of the shift (DFG Citation2013). Nevertheless, benzene in blood is not widely applied as biomarker for benzene exposure since blood sampling is an invasive method, which triggers various ethical and medical issues (Knudsen et al. Citation2022) and the EKA values for benzene in blood were discontinued as of 2013.
Urine
Since collection of urine is non-invasive and relatively easy to conduct, urine is in most cases the specimen of choice for human biomonitoring and a host of methods have been developed for urinary biomarkers of benzene exposure. Both benzene itself and a series of its metabolites have been proposed as biomarkers of benzene exposure ().
Figure 1. Main urinary metabolites formed by oxidative metabolism of benzene and applied as biomarkers for benzene exposure.
Benzene in urine is, like benzene in blood, relatively easy to measure from a bio-analytical perspective but has an advantage over benzene in blood because the concentrations in urine essentially reflect the exposure since the last void. Therefore, benzene in urine potentially gives a better reflection of (transient) exposures to benzene during the working day than benzene in blood. Nevertheless, urinary benzene suffers from the same drawbacks as the other biomarkers that measure benzene directly: the inherent volatility of benzene makes it prone to evaporation from urinary samples and there is potential of contamination with benzene in the working place during collection.
Several studies have been published on the urinary excretion of benzene (Ghittori et al. Citation1993, Citation1995; Ong et al. Citation1996; Waidyanatha et al. Citation2001; Perbellini et al. Citation2003; Tolentino et al. Citation2003; Fustinoni et al. Citation2005; Manini et al. Citation2006, Citation2008; Campagna et al. Citation2012). For individual studies with airborne benzene concentrations greater than ∼0.2 ppm (∼0.65 mg/m3), reasonably good correlations between urinary benzene and benzene in air were found. However, between studies the correlations differed over an order of magnitude and made it impossible to derive a reliable BE value (Hays et al. Citation2012). For urinary benzene levels at benzene exposures less than 0.2 ppm, limited data are available (Fustinoni et al. Citation2005; Manini et al. Citation2006, Citation2008; Campagna et al. Citation2012). Manini et al. report a median airborne benzene concentration (in 24 individuals) of 6.1 μg/m3 with 25 and 75% percentile values of 0.3 and 9.5 μg/m3, respectively, and median urinary benzene concentrations (in 80 individuals) of 0.16 with 25 and 75% percentile values of 0.13 and 0.26 μg/L, respectively (Manini et al. Citation2008). However, no statistically significant correlation was found between airborne benzene and urinary benzene concentrations, which might be due that benzene concentrations in air were measured in less than a quarter of the individuals in the study. In addition, the airborne benzene concentrations levels measured varied more than 30-fold whereas the urinary benzene concentrations values only varied 2-fold (Manini et al. Citation2008). It’s noteworthy that a similar study by the same investigators for the same airborne benzene levels different values for urinary benzene concentrations were reported (Manini et al. Citation2006). Fustinoni et al. report airborne benzene concentrations for two groups of 49 and 46 non-smoking workers of 22 (range 9–361) and 61 (range 11–478) μg/m3, respectively, that correspond to urinary benzene concentrations of 151 (range 25–943) and 342 (range 42–2836) ng/L. For both groups, urinary benzene concentrations were higher in the pre-shift samples (256, range 98–846 ng/L and 459, range 147–2708 ng/L, respectively) than in the post-shift samples. A statistically significant correlation between airborne and urinary benzene levels was found after log-transformation of the values and this correlation was better for the pre-shift urine samples than for the post-shift urine samples (Fustinoni et al. Citation2005). In another Italian study on 19 non-smoking workers, a statistically significant correlation was also found between airborne and urinary concentrations of benzene with an average airborne benzene concentration of 30 (range 12–123) μg/m3 and an average urinary benzene concentration of 267 (range 151–557) ng/L (Campagna et al. Citation2012). Based on three (Fustinoni et al. Citation2005; Manini et al. Citation2008; Campagna et al. Citation2012) of the four studies mentioned above, the DFG calculated a correlation between airborne and urinary benzene concentrations which was extrapolated to set EKA values of 0.48 and 0.83 µg/L corresponding to 0.1 and 0.2 mg/m3 (8-h TWA) benzene (i.e. ∼0.03 and ∼0.06 ppm) (Kraus et al. Citation2018).
The available studies on correlations between airborne and urinary benzene concentrations showed no consistency at airborne concentrations higher than ∼0.06 ppm (∼0.2 mg/m3). Therefore, to calculate EKA values corresponding to higher concentrations, DFG relied on the correlation found between urinary benzene and two urinary metabolites of benzene: trans,trans-muconic acid (tt-MA) and S-phenylmercapturic acid (S-PMA) (Bader et al. Citation2014). The calculated values depend on whether the correlation between urinary benzene and tt-MA or between urinary benzene and S-PMA is used, and also on whether creatinine correction is applied. It is unclear (not reported) which data are finally used to calculate the published EKA values, but these are rather consistent with the extrapolated values for the lower concentrations of airborne benzene. In addition, the DFG set biological reference values (BAR values) based on the results obtained in the general population without occupational exposure to benzene and published a BAR of 300 ng/L for urinary benzene (Kraus et al. Citation2018).
Several urinary metabolites of benzene have been suggested as biomarkers of benzene exposure. The most abundant urinary metabolite of benzene, accounting for approximately half of the amount of absorbed benzene, is phenol that is present in the urine as its glucuronide and sulphate conjugates (predominantly as its sulphate conjugate, which may account for up to 85% of total urinary phenol). Urinary phenols could be determined by colorimetric methods for a long time (Folin and Denis Citation1915) and total urinary phenol was the first urinary biomarker for benzene exposure, introduced in the 1950s and initially also determined by colorimetric methods (Teisinger et al. Citation1955). However, the colorimetric methods were not adequate to determine occupational exposures and chromatographic methods were developed and introduced in occupational settings as a control measure as early as 1963 (van Haaften and Sie Citation1965). Urinary phenol has been used for decades as a biomarker for benzene exposure even though non-exposed individuals may have significant background levels of urinary phenol. This background is due to dietary intake of phenols and inherently highly variable and usually less than 10 mg/L but never higher than 20 mg/L. Based on a TLV of 10 ppm (as 8-h TWA), the ACGIH proposed a Biological Exposure Index (BEI) of 50 mg/g creatinine in end-of-shift urine samples in line with the relationship between airborne benzene concentrations and urinary phenol levels at the end of the 8-h working shift (Inoue et al. Citation1986). However, with OEL values lower than approximately 5 ppm phenol gets unreliable as biomarker of exposure although the increase in urinary phenol over the shift can still be used to indicate increased exposure levels. At an OEL value of 1 ppm urinary phenol can no longer be used as biomarker of exposure and when OEL values were lowered to this level, other urinary metabolites of benzene were investigated as biomarkers of exposure.
trans,trans-Muconic acid (tt-MA) is a relatively minor metabolite of benzene, accounting for approximately 5% of the absorbed dose (Boogaard and van Sittert Citation1995). Since tt-MA is relatively easily measured, it gained rapid popularity as a biomarker for benzene exposure (Ducos et al. Citation1990, Citation1992). Urinary concentrations of tt-MA in end of shift samples were found to correlate well with airborne concentrations of benzene (as 8-h TWA) and a biological limit value of 2 mg/l or 1.7 mg/g creatinine was found to correspond with exposure to 1 ppm (8-h TWA) benzene (Boogaard and van Sittert Citation1995, Citation1996; Scherer et al. Citation1998). However, it was also found that at airborne benzene concentrations lower than 0.5 ppm, tt-MA loses its specificity as certain food ingredients, such as sorbic acid which is used as a preservative, may be metabolised to tt-MA rendering it less suitable as a biomarker at lower benzene levels (Weaver et al. Citation2000). In addition, its relatively short half-life of approximately 5 h makes it less suitable to pick up intermittent exposures than longer lived metabolites like S-PMA (Boogaard and van Sittert Citation1995, Citation1996). In the general population the 95-percentile for urinary tt-MA is approximately 150 μg tt-MA/g creatinine, but urinary values as high as 700 μg/g creatinine were reported after dietary exposure to sorbic acid. As a consequence, it is not surprising that studies conducted to assess the correlation between urinary tt-MA and airborne low-level (<0.3 ppm) concentrations of benzene do not show any clear correlation (Carrer et al. Citation2000; Fustinoni et al. Citation2005; Manini et al. Citation2006, Citation2008, Carrieri et al. Citation2010; Fracasso et al. Citation2010; Campagna et al. Citation2012; Mansi et al. Citation2012). Although good correlations between tt-MA and other urinary biomarkers of benzene exposure, such as urinary benzene and S-PMA (vide infra), were found when considering a wide range of airborne benzene concentrations ranging from less than 0.1 ppm to well over 1 ppm, these cannot reliably be used to derive biological limit values corresponding to airborne levels of benzene below 0.3 ppm (Boogaard and van Sittert Citation1995, Citation1996; Bader et al. Citation2014).
S-PMA is a minor metabolite of benzene, accounting for ∼0.11% of the absorbed dose (Boogaard and van Sittert Citation1995) and was introduced as urinary biomarker of benzene exposure in the early 1990s (van Sittert et al. Citation1993). The original analytical methodology for determination of urinary S-PMA (methylation followed by GC-MS) was rather complicated and a number of ELISA methods was developed (Aston et al. Citation2002; Fustinoni et al. Citation2005; Fracasso et al. Citation2010). However, since these were validated at relatively high levels of S-PMA (corresponding to airborne levels of benzene of 0.5–1 ppm, as 8-H TWA) and are inherently not suitable for applications at lower levels, they won’t be discussed here. The original GC-MS method, which applied S-benzylmercapturic acid as internal standard, was well validated in a dozen of studies in a wide variety of occupational settings with benzene exposures ranging from <0.1 to 13.6 mg/m3 (8-h TWA) (van Sittert et al. Citation1993). However, the correlation between air-borne benzene and urinary S-PMA could not reliably be established in more concentrated urinary samples due to chromatographic problems, limiting quantification of exposure to approximately 1 mg/m3 (0.3 ppm, 8-h TWA) of benzene. Moreover, in many situations with benzene exposure there may be co-exposure to toluene which can be metabolised to S-benzylmercapturic acid to a minor extent as well which theoretically may also interfere (Inoue et al. Citation2002; Ukai et al. Citation2007; Kawai et al. Citation2008). Therefore, the methodology was improved by introducing perdeuterated S-PMA (d5-S-PMA) as internal standard which increased accuracy and allowed quantification down to approximately 0.3 mg/m3 (0.1 ppm, 8-h TWA). The improved method was validated again in a dozen studies in several occupational settings with airborne exposure from <0.1 to 211 mg/m3 (8-h TWA) (Boogaard and van Sittert Citation1995, Citation1996). No significant difference was found in percentage of benzene that was excreted as S-PMA or in urinary half-life (∼9 h) between the original and improved methodologies, but with the improved method the difference in urinary excretion of S-PMA by smokers and non-smokers could be demonstrated.
In 1995, the ACGIH proposed a BEI for urinary S-PMA of 45 μg/g creatinine, corresponding to the TLV of 1 ppm, based on the correlation between urinary S-PMA at the end-of-shift and the airborne concentrations benzene during the shift (8-h TWA) (Boogaard and van Sittert Citation1996). Based on this same correlation, the BEI was lowered to 25 μg/g creatinine when the TLV was lowered to 0.5 ppm.
S-PMA was applied in several studies as biomarker for low-level exposure to benzene. In a study in 50 non-smoking police men, a median exposure of 20.6 (range 14.0–32.5) μg/m3 was reported corresponding S-PMA levels of 0.35 (range 0.21–0.69) μg/g creatinine (Angelini et al. Citation2011). There were two studies in Italian taxi drivers and traffic policemen by the group of Manini and co-workers (Manini et al. Citation2006, Citation2008). For unknown reasons, the results of the first study (from 2006) do not match with those of the second study (from 2008) nor with the results of other studies with similar exposure levels. The last study reports an average airborne benzene concentration (in 24 individuals) of 6.1 μg/m3 with a range of 0.3–9.5 μg/m3 and median S-PMA concentrations (in 80 individuals) of 0.42 with 25 and 75% percentiles of 0.2 and 1.07 μg/g creatinine, respectively.
In another Italian study, airborne exposure to benzene and the corresponding urinary excretion of S-PMA was determined in 20 non-smoking petrochemical workers on 9 consecutive days. The benzene concentration averaged 0.0561 (median 0.0132, range <0.003–924) mg/m3 with corresponding urinary S-PMA values of 1.14 (median 0.48, range <0.06–18.63) μg/g creatinine (Carrieri et al. Citation2010). In a more extensive study, 231 non-smoking workers exposed to an airborne benzene exposure averaging 11.4 μg/m3 (range 0.4–220 μg/m3 as measured in 227 workers) had an average urinary S-PMA level of 1.2 (range 0.2–8.8) μg/g creatinine whilst in 102 non-smoking controls an average urinary S-PMA of 0.7 (range 0.1–4.0) μg/g creatinine was measured (Maestri et al. Citation2005). Following logarithmic transformation of the data, a weak correlation (r2=0.18) was found between airborne levels of benzene and the urinary levels of S-PMA.
The DFG established a correlation between low-level benzene exposure and urinary S-PMA, based on the studies by Manini et al. Citation2008, Carrieri et al. Citation2010, Angelini et al. Citation2011, and Mansi et al. Citation2012. However, it is unclear how they did this since the various studies report median and average values. In addition, the study by Mansi and co-workers (Mansi et al. Citation2012) is problematic since the reported airborne value of benzene of 0.0368 (range 0.004–0.292) mg/m3 were measured in both smokers and non-smokers and not necessarily on the same day as the urine samples for determination of S-PMA were collected. This is not surprising given the fact that the study was not designed to establish a correlation between airborne exposures to benzene and urinary excretion of S-PMA. Moreover, the most extensive study available (by Maestri et al. Citation2005) was not taken into account. A correlation was obtained that was not statistically significant but this relation was nevertheless used to calculate S-PMA values of 1.5 and 3 μg/g creatinine, corresponding to airborne concentrations of benzene of 0.1 and 0.2 mg/m3. For the higher airborne benzene concentrations (≥0.5 mg/m3), the DFG used the study by Van Sittert et al. (van Sittert et al. Citation1993). This is the first study that validated the correlation between airborne benzene concentrations and urinary S-PMA by combining data from 12 studies in 6 countries from 333 workers (613 samples) and 48 controls. A good correlation between airborne benzene and urinary S-PMA was found and this correlation was applied by the DFG to calculate their EKA values. However, as explained above, this method applied S-benzylmercapturic acid as internal standard which caused issues at lower concentrations where, especially in samples prepared from more concentrated urines, peaks may shift leading to failure to integrate the entire peaks for the selected mass fragments resulting in underestimation of the actual concentrations of S-PMA. In addition, interference of co-exposure to toluene may occur. For that reason the method was improved with as main alteration the use of a deuterated internal standard (ring-d5-S-PMA). With this improved method another validation study was performed comprising 12 studies in 5 countries with 434 samples of 133 workers in settings where previously the highest exposure levels had been found (Boogaard and van Sittert Citation1995, Citation1996). The new regression line for S-PMA versus airborne benzene is given by: [airborne benzene] (mg/m3, 8-h TWA) = 0.0758 × urinary [S-PMA] (μg/g creatinine) − 0.317 (r = 0.968). This regression line gives higher values for the lower concentrations than the original regression line. Using the “old” regression line (van Sittert et al. Citation1993), the values calculated for 0.1 and 0.2 mg/m3 would yield negative values, which indicates that the values proposed by the DFG do not fit the trend, i.e. the line is bent upwards at lower concentrations. Using the “new” regression line, which is not validated for airborne concentration below 0.3 mg/m3 (0.1 ppm, 8-h TWA), values of 5.5 and 6.8 μg/g creatinine are calculated. These values seem relatively high in view of the results of the studies with low airborne concentrations. The overall conclusion is that there is a strong need to reliably assess correlations between low concentrations of airborne benzene and urinary S-PMA. There doesn’t seem to be a background for urinary S-PMA and a BAR value of 0.3 μg/g creatinine was proposed.
Interpretation of benzene biomonitoring data
Interpretation of human biomonitoring data is often less straightforward than suggested by a simple comparison to a limit value. Depending on the biomarker used a series of factors need to be considered. Specificity and sensitivity are important factors, especially at low ambient exposure levels. Regarding specificity, as indicated, several of the biomarkers have confounding background levels which renders them unreliable to confirm exposure below certain levels. The exception would be benzene itself, measured in blood or urine. However, the application of benzene in blood as biomarker is limited since its biological half-life is in the order of minutes which makes unsuitable to detect transient or intermittent exposures. This probably also explains the lack of consistency in the reported correlations between airborne benzene concentration and the levels of benzene in blood. Using PBK-models, the Biomonitoring Equivalent (BE, i.e. the concentration of a chemical or its metabolite in a biological medium that is consistent with an existing health-based exposure guideline) can be calculated (Hays et al. Citation2008; Boogaard et al. Citation2011). For benzene BE values were derived for benzene in blood and for benzene in urine (Hays et al. Citation2012). However, these BE values assume a continuous stable exposure concentration and would not reflect transient or intermittent exposure.
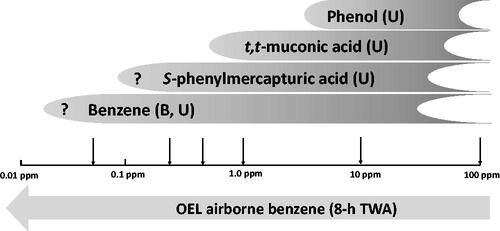
In the applicability of several biomarkers at varying airborne concentrations are depicted. Both urinary phenol and tt-MA are limited as biomarker for benzene exposure due to the potential background that may be caused by food stuffs. S-PMA is the notable exception since up till now no background levels have been observed that might confound interpretation. This makes S-PMA the biomarker of choice to assess exposure to benzene. It seems that sensitivity is not a problem either for the analytical determination of S-PMA. However, a solid correlation between airborne benzene concentrations below ∼0.25 ppm (8-h TWA) and urinary S-PMA has not yet been established.
Figure 2. Applicability of biomarkers of exposure with lowering occupational exposure limits (OELs).
As described previously, four specific elements can be identified which, dependent on the degree to which each is supported determine to what extent human biomonitoring data can be interpreted with respect to human risk assessment (Boogaard and Money Citation2008). These four elements are (1) analytical integrity, (2) the ability to describe the dose (i.e. toxicokinetics), (3) the ability to relate data to effects, and (4) the overall weight-of-evidence.
With regard to the human biomonitoring of benzene exposure using urinary S-PMA, the analytical integrity should pose no serious issues since the methodologies have been properly described and validated and external quality programmes are available. For S-PMA there is no background in urine and its toxicokinetics have been described sufficiently to interpret data, even from spot samples. However, a correlation between urinary S-PMA and effects is not available. As a consequence, the measurements of urinary S-PMA should be considered as mere monitoring of benzene exposure. Correlations between airborne concentrations of benzene and effects have been described and, theoretically, a correlation between urinary concentrations of S-PMA and effects could be gleaned from these in combination with the correlation between airborne concentrations of benzene and urinary S-PMA. However, this is not straightforward since the chronic health effects of benzene are associated with cumulative exposures which are typically modelled based on occupational history in combination with characteristic exposure levels estimated by trained occupational hygienists and epidemiologists.
As explained above, although there are correlations between urinary S-PMA (spot samples, collected at the end-of-the shift) and airborne benzene (8-h TWA), the correlation at concentrations of benzene below ∼0.25 ppm (8-h TWA) is not properly established. Overall, this implies that S-PMA in spot samples, collected at the end-of-the-shift, can be interpreted in terms of compliance to OELs of 0.25 ppm and higher. In terms of compliance, it should be borne in mind that OELs have been derived to reflect 8-h TWA exposures for 5 days per week during the working life (40 years). Therefore, occasional exceedance of the health-based OEL values does not necessarily imply an increased risk of haematological cancers since these are associated with cumulative exposures over a longer period of time (IARC Citation2018).
Implications of lower OELs for human biomonitoring and the way forward
The first occupational exposures limits for benzene were based on its potency to cause depression of the central nervous system and were similar to the limits applied for other organic solvents with narcotic properties. However, since it was recognised that benzene is a human leukaemogen, the occupational exposures limits have continuously been lowered. In most countries the OELs have been between 0.5 and 1 ppm (as 8-h TWA) for many years. Recently, a number of reports have been issued that propose a lower OEL for benzene. The Dutch Health Council proposed an OEL of 0.2 ppm which is almost identical to the value of 0.25 ppm that was more recently proposed as a result of an extensive systematic review of all available human data (DECOS Citation2014; Schnatter et al. Citation2020). ECHA proposed an even lower value of 0.05 ppm based on human and animal data combined (RAC Citation2018). The European Commission considered the ECHA proposal as well as an impact assessment for the proposed values and proposed in turn to the European Parliament and the Council of the EU to accept lower OEL values for benzene in a step-wise approach. In 2022, the Carcinogens and Mutagens Directive (2004/37/EC) was indeed amended in such a way that the existing OEL of 1 ppm will be lowered to 0.5 ppm as per 5 April 2024, and subsequently to 0.2 ppm as of 5 April 2026 (EC Citation2022). For proper OEL compliance control of exposure in occupational settings, it is essential to be able to measure airborne levels of less than 50% of the OEL and ideally as low as 20% of the OEL. Determination of airborne levels of benzene of 0.2 ppm (8-h TWA) and below is technically well feasible. However, with these low OEL values dermal exposure becomes relatively more important and can in many occupational settings outweigh the exposure by inhalation. To assess complete exposure to benzene via all routes, including dermal, human biomonitoring is undoubtedly the best option. Although a wide variety of human biomonitoring techniques have been developed, none of these has been properly validated for the proposed OEL values in the range of 0.05 to 0.25 ppm. As discussed above, it appears from the available data that only urinary S-PMA, urinary benzene, and benzene in blood may be useful biomarkers to assess exposure at these levels (). Since urine is the preferred specimen for occupational human biomonitoring, determination of S-PMA is the best option because urinary benzene seems inherently less reliable which may be due to the volatility of benzene. Despite the fact that biomarker levels for the proposed OEL values of 0.25 ppm and lower have not been properly validated, ECHA published a value of 2 µg/g creatinine for S-PMA corresponding to the proposed OEL of 0.05 ppm (RAC Citation2018). ECHA states they took the data from DFG, but apparently they have interpolated the data published by DFG (DFG Citation2017). As explained above, the values DFG reported for S-PMA corresponding to airborne concentrations of benzene of 0.03 and 0.06 ppm are not very well justified and differ slightly from the values DFG published later (DFG Citation2018) and, moreover, the values for S-PMA corresponding to airborne concentrations of benzene below 1 ppm are based on an outdated regression analysis as discussed above in the section on urinary biomarkers (Urine – S-PMA).
Another issue regarding the biomonitoring of benzene exposure less than ∼0.1 ppm is that it has been suggested that the metabolism of benzene would be non-linear at these low exposure levels (McHale et al. Citation2011; Thomas et al. Citation2014). This assumption of more efficient oxidative metabolism at concentration less than 0.1 ppm was based on the analysis of a large database obtained from a series of studies in workers with potential exposure to a wide range of benzene concentrations (Lan et al. Citation2004; Vermeulen et al. Citation2004; Kim et al. Citation2006). More recently, however, two independent analyses of the same dataset have shown that the data can be fully explained without any non-linearity in the metabolism of benzene (Cox et al. Citation2017; McNally et al. Citation2017). Moreover, there are methodological issues with the original analysis (Kim et al. Citation2006) because there might have been dermal exposure in some cases, and, more importantly, the benzene concentrations below 0.1 ppm were not actually measured but calculated from biomonitoring data (assuming linearity) because the available methodology did not allow determination of these low levels (Boogaard Citation2017). The currently available analytical methodology for measuring airborne concentrations of benzene allows determination of concentrations well below 0.1 ppm. The bottom line is that there is a strong need for further validation of urinary S-PMA as biomarker for benzene exposure at these low concentrations (0.01–0.25 ppm) to allow reliable compliance check of benzene exposure at the recently proposed OELs. Ideally, such a validation should entail a large work-force (at least a few dozen individuals) with potential exposure to airborne concentrations of benzene in the range of 0.01–0.5 ppm (8-h TWA) without a significant risk of dermal exposure. The benzene exposures of each individual should be assessed by personal air monitoring with a validated method during a number of consecutive days. Concomitantly, each individual should provide pre- and post-shift urine samples for the determination of S-PMA by a validated method. Finally, the individual human biomarker data should be linked to the corresponding airborne concentrations and evaluated statistically to obtain a correlation that can be used to derive limit values such as OELs (Boogaard and Money Citation2008).
Conclusions
The OELs for benzene have been lowered over more than 2 orders of magnitude since the first value of 100 ppm was proposed in 1946 to values between 0.05 and 0.25 ppm that have recently been proposed.
Although the determination of airborne benzene concentrations at these concentrations is technically well feasible, accurate determination of low and intermittent airborne exposure is difficult. Moreover at these low concentrations (<0.25 ppm) the contribution of dermal exposure to the total exposure, and consequently the potential health risk, becomes relatively more important.
Human biomonitoring of benzene exposure may solve the issues associated with intermittent airborne exposure and dermal exposure.
From the available human biomonitoring methodologies, urinary S-PMA seems to be the most promising biomarker for the assessment of low-level (i.e. <0.25 ppm) exposures.
Proper validation of urinary S-PMA for biomonitoring of benzene exposures lower than 0.25 ppm (8-h TWA) is currently lacking and would be required to allow compliance checking of benzene exposures at the recently proposed OELs in the range of 0.05–0.25 ppm (8-h TWA).
| Abbreviations | ||
| ACGIH | = | American Conference of Governmental Industrial Hygienists |
| AML | = | acute myeloid leukaemia |
| BAR | = | biological reference value (Biologische Arbeitsstoff‐Referenzwert) |
| BE | = | biomonitoring equivalent |
| BEI | = | Biological Exposure Index |
| DFG | = | Deutsche Forschungsgemeinschaft |
| ECHA | = | European Chemicals Agency |
| EKA | = | exposure equivalents for carcinogenic substances (Expositionsäquivalente für krebserzeugende Arbeitsstoffe) |
| HBROEL | = | health-based occupational exposure limit |
| IARC | = | International Agency for Research on Cancer |
| OEL | = | occupational exposure limit |
| OSHA | = | Occupational Safety and Health Administration |
| PBK-model | = | physiologically-based kinetic model |
| ppm | = | parts per million |
| PEL | = | permissible exposure limit |
| RAC | = | Risk Assessment Committee |
| S-PMA | = | S-phenyl mercapturic acid |
| STEL | = | short-term exposure limit |
| tt-MA | = | trans,trans-muconic acid |
| TLV | = | threshold limit value |
| TWA | = | time-weighted average |
| WHO | = | World Health Organisation |
Acknowledgements
Prior to submission, this paper was reviewed by Prof.Dr. Helmut Greim (Professor Emeritus of the Faculty of Medicine, Technische Universität München), Prof.Dr. Abdel-Razak M. Kadry (Adjunct Professor, Maryland Institute of Applied Environmental Health, University of Maryland, School of Public Health), and Dr. Debra A. Kaden (Principal Consultant, Environment & Health, Ramboll Group). In addition, four anonymous external reviewers, selected by the Editor, provided a series of remarks and recommendations. The valuable comments and suggestions by the seven reviewers have improved the paper which is gratefully acknowledged.
Declaration of interest
The author is retired from Shell International where he was employed as toxicologist for more than 30 years. He declares having no competing interests to disclose related to the submission of this manuscript and has not participated in and does not anticipate participation in any legal, regulatory, or advocacy proceedings related to the contents of the paper. This article has not received any external funding support.
References
- Aksoy M, Dincol K, Erdem S, Dincol G. 1972. Acute leukemia due to chronic exposure to benzene. Am J Med. 52(2):160–166.
- Aksoy M, Erdem S, DinCol G. 1974. Leukemia in shoe-workers exposed chronically to benzene. Blood. 44(6):837–841.
- Aksoy M, Erdem S, Erdogan G, Dincol G. 1974. Acute leukaemia in two generations following chronic exposure to benzene. Hum Hered. 24(1):70–74.
- Alegretti AP, Thiesen FV, Maciel GP. 2004. Analytical method for evaluation of exposure to benzene, toluene, xylene in blood by gas chromatography preceded by solid phase microextraction. J Chromatogr B Analyt Technol Biomed Life Sci. 809(1):183–187.
- Amorim LC, Carneiro JP, Cardeal ZL. 2008. An optimized method for determination of benzene in exhaled air by gas chromatography-mass spectrometry using solid phase microextraction as a sampling technique. J Chromatogr B Analyt Technol Biomed Life Sci. 865(1–2):141–146.
- Angelini S, Kumar R, Bermejo JL, Maffei F, Barbieri A, Graziosi F, Carbone F, Cantelli-Forti G, Violante FS, Hemminki K, et al. 2011. Exposure to low environmental levels of benzene: evaluation of micronucleus frequencies and S-phenylmercapturic acid excretion in relation to polymorphisms in genes encoding metabolic enzymes. Mutat Res. 719(1–2):7–13.
- Angerer J, Scherer G, Schaller KH, Mueller J. 1991. The determination of benzene in human blood as an indicator of environmental exposure to volatile aromatic compounds. Fresenius J Anal Chem. 339:740–742.
- Arnold SM, Angerer J, Boogaard PJ, Hughes MF, O'Lone RB, Robison SH, Schnatter AR. 2013. The use of biomonitoring data in exposure and human health risk assessment: benzene case study. Crit Rev Toxicol. 43(2):119–153.
- Aston JP, Ball RL, Pople JE, Jones K, Cocker J. 2002. Development and validation of a competitive immunoassay for urinary S-phenylmercapturic acid and its application in benzene biological monitoring. Biomarkers. 7(2):103–112.
- ATSDR. 2007. Toxicological profile for benzene. Atlanta, Georgia, USA: U.S. Department of Health and Human Services.
- Bader M, Van Weyenbergh T, Verwerft E, Van Pul J, Lang S, Oberlinner C. 2014. Human biomonitoring after chemical incidents and during short-term maintenance work as a tool for exposure analysis and assessment. Toxicol Lett. 231(3):328–336.
- Bechtold WE, Sun JD, Birnbaum LS, Yin SN, Li GL, Kasicki S, Lucier G, Henderson RF. 1992. S-phenylcysteine formation in hemoglobin as a biological exposure index to benzene. Arch Toxicol. 66(5):303–309.
- Bechtold WE, Willis JK, Sun JD, Griffith WC, Reddy TV. 1992. Biological markers of exposure to benzene: s-phenylcysteine in albumin. Carcinogenesis. 13(7):1217–1220.
- Bogen KT, Sheehan PJ. 2014. Dermal versus total uptake of benzene from mineral spirits solvent during parts washing. Risk Anal. 34(7):1336–1358.
- Bois FY, Jackson ET, Pekari K, Smith MT. 1996. Population toxicokinetics of benzene. Environ Health Perspect. 104(Suppl 6):1405–1411.
- Boogaard PJ. 2017. The low-dose benzene debate needs a sharp blade. Chem Biol Interact. 278:239–241.
- Boogaard PJ, Hays SM, Aylward LL. 2011. Human biomonitoring as a pragmatic tool to support health risk management of chemicals–examples under the EU REACH programme. Regul Toxicol Pharmacol. 59(1):125–132.
- Boogaard PJ, Money CD. 2008. A proposed framework for the interpretation of biomonitoring data. Environ Health. 7(Suppl 1):S12.
- Boogaard PJ, van Sittert NJ. 1995. Biological monitoring of exposure to benzene: a comparison between S-phenylmercapturic acid, trans,trans-muconic acid, and phenol. Occup Environ Med. 52(9):611–620.
- Boogaard PJ, van Sittert NJ. 1996. Suitability of S-phenyl mercapturic acid and trans-trans-muconic acid as biomarkers for exposure to low concentrations of benzene. Environ Health Perspect. 104(Suppl 6):1151–1157.
- Brown EA, Shelley ML, Fisher JW. 1998. A pharmacokinetic study of occupational and environmental benzene exposure with regard to gender. Risk Anal. 18(2):205–213.
- Brugnone F, Perbellini L, Maranelli G, Romeo L, Guglielmi G, Lombardini F. 1992. Reference values for blood benzene in the occupationally unexposed general population. Int Arch Occup Environ Health. 64(3):179–184.
- Brugnone F, Perbellini L, Romeo L, Bianchin M, Tonello A, Pianalto G, Zambon D, Zanon G. 1998. Benzene in environmental air and human blood. Int Arch Occup Environ Health. 71(8):554–559.
- Brugnone F, Perbellini L, Romeo L, Cerpelloni M, Bianchin M, Tonello A. 1999. Benzene in blood as a biomarker of low level occupational exposure. Sci Total Environ. 235(1–3):247–252.
- Campagna M, Satta G, Campo L, Flore V, Ibba A, Meloni M, Tocco MG, Avataneo G, Flore C, Fustinoni S, et al. 2012. Biological monitoring of low-level exposure to benzene. Med Lav. 103(5):338–346.
- Carrer P, Maroni M, Alcini D, Cavallo D, Fustinoni S, Lovato L, Visigalli F. 2000. Assessment through environmental and biological measurements of total daily exposure to volatile organic compounds of office workers in Milan, Italy. Indoor Air. 10(4):258–268.
- Carrieri M, Tranfo G, Pigini D, Paci E, Salamon F, Scapellato ML, Fracasso ME, Manno M, Bartolucci GB. 2010. Correlation between environmental and biological monitoring of exposure to benzene in petrochemical industry operators. Toxicol Lett. 192(1):17–21.
- Cox LA, Schnatter AR, Boogaard PJ, Banton M, Ketelslegers HB. 2017. Non-parametric estimation of low-concentration benzene metabolism. Chem Biol Interact. 278:242–255.
- DECOS. 2014. Benzene – health-based recommended occupational exposure limit. Den Haag: D. E. C. o. O. Safety. Health Council of the Netherlands.
- DFG. 2013. MAK- und BAT-Werte-Liste 2013. Weinheim (Germany): Wiley VCH.
- DFG. 2017. MAK-und BAT-Werte Liste 2017. Weinheim (Germany): Wiley VCH.
- DFG. 2018. Addendum zu Benzol. The MAK Collect Occup Health Safe. 3:262–294.
- Ducos P, Gaudin R, Bel J, Maire C, Francin JM, Robert A, Wild P. 1992. Trans-muconic acid, a reliable biological indicator for the detection of individual benzene exposure down to the ppm level. Int Arch Occup Environ Health. 64(5):309–313.
- Ducos P, Gaudin R, Robert A, Francin JM, Maire C. 1990. Improvement in HPLC analysis of urinary trans,trans-muconic acid, a promising substitute for phenol in the assessment of benzene exposure. Int Arch Occup Environ Health. 62(7):529–534.
- EC. 2022. Directive (EU) of the European Parliament and the Council of 9 March 2022 amending Directive 2004/37/EC on the protection of workers from the risks related to exposure to carcinogens and mutagens at work. Official Journal of the European Union L88/1: directive (EU) of the European Parliament and the Council of 9 March 2022 amending Directive 2004/37/EC on the protection of workers from the risks related to exposure to carcinogens and mutagens at work. European Parliament and the European Council of the European Union; Official Journal of the European Union, L158, p. 50.
- Folin O, Denis W. 1915. A colorimetric method for the determination of phenols (and phenol derivatives) in urine. J Biol Chem. 22(3):305–308.
- Forsell K, Liljelind I, Ljungkvist G, Nordlinder R, Andersson E, Nilsson R. 2019. Benzene exposure and biomarkers in alveolar air and urine among deck crews on tankers transporting gasoline. Ann Work Expo Health. 63(8):890–897.
- Fracasso ME, Doria D, Bartolucci GB, Carrieri M, Lovreglio P, Ballini A, Soleo L, Tranfo G, Manno M. 2010. Low air levels of benzene: correlation between biomarkers of exposure and genotoxic effects. Toxicol Lett. 192(1):22–28.
- Fustinoni S, Consonni D, Campo L, Buratti M, Colombi A, Pesatori AC, Bonzini M, Bertazzi PA, Foa V, Garte S, et al. 2005. Monitoring low benzene exposure: comparative evaluation of urinary biomarkers, influence of cigarette smoking, and genetic polymorphisms. Cancer Epidemiol Biomarkers Prev. 14(9):2237–2244.
- Ghittori S, Fiorentino ML, Maestri L, Cordioli G, Imbriani M. 1993. Urinary excretion of unmetabolized benzene as an indicator of benzene exposure. J Toxicol Environ Health. 38(3):233–243.
- Ghittori S, Maestri L, Fiorentino ML, Imbriani M. 1995. Evaluation of occupational exposure to benzene by urinalysis. Int Arch Occup Environ Health. 67(3):195–200.
- Hamilton A. 1922. The growing menace of benzene (benzol) poisoning in American industry. J Am Med Assoc. 78(9):627–630.
- Hanke J, Dutkiewicz T, Piotrowski J. 2000. The absorption of benzene through human skin. Int J Occup Environ Health. 6(2):104–111.
- Hanway R, Cavicchioli A, Kaur B, Parsons J, Lamb JH, Buckberry LD, Farmer PB. 2000. Analysis of S-phenyl-L-cysteine in globin as a marker of benzene exposure. Biomarkers. 5(4):252–262.
- Hays SM, Aylward LL, LaKind JS, Bartels MJ, Barton HA, Boogaard PJ, Brunk C, DiZio S, Dourson M, Goldstein DA, Biomonitoring Equivalents Expert Workshop, et al. 2008. Guidelines for the derivation of biomonitoring equivalents: report from the Biomonitoring Equivalents Expert Workshop. Regul Toxicol Pharmacol. 51(3 Suppl):S4–S15.
- Hays SM, Pyatt DW, Kirman CR, Aylward LL. 2012. Biomonitoring equivalents for benzene. Regul Toxicol Pharmacol. 62(1):62–73.
- Hotz P, Carbonnelle P, Haufroid V, Tschopp A, Buchet JP, Lauwerys R. 1997. Biological monitoring of vehicle mechanics and other workers exposed to low concentrations of benzene. Int Arch Occup Environ Health. 70(1):29–40.
- IARC. 1982. Some industrial chemicals and dyestuffs. IARC monographs on the evaluation of the carcinogenic risk of chemicals to humans, 29. Geneva (Switzerland): WHO Press.
- IARC. 2018. Benzene. IARC monographs on the evaluation of the carcinogenic risks to humans, 120. Geneva (Switzerland): WHO Press.
- IARC. 1974. Sorne anti-thyroid and related substances, nitrofurans and Indus trial chemicals. IARC Monogr Eval Carcinogenic Risk Chem Humans. 7:203–221.
- IARC. 1987. Overall evaluations of carcinogenicity: an updating of IARC monographs volumes 1–42. IARC Monogr Suppl. 7:120–122.
- IARC. 2012. Chemical agents and related occupations – a review of human carcinogens: benzene. IARC Monogr Eval Carcin Risks Human. 100F:248–294.
- Inoue O, Kanno E, Yusa T, Kakizaki M, Ukai H, Okamoto S, Higashikawa K, Ikeda M. 2002. Urinary benzylmercapturic acid as a marker of occupational exposure to toluene. Int Arch Occup Environ Health. 75(5):341–347.
- Inoue O, Seiji K, Kasahara M, Nakatsuka H, Watanabe T, Yin SG, Li GL, Jin C, Cai SX, Wang XZ. 1986. Quantitative relation of urinary phenol levels to breathzone benzene concentrations: a factory survey. Br J Ind Med. 43(10):692–697.
- Jakasa I, Kezic S, Boogaard PJ. 2015. Dermal uptake of petroleum substances. Toxicol Lett. 235(2):123–139.
- Johnson ES, Langard S, Lin YS. 2007. A critique of benzene exposure in the general population. Sci Total Environ. 374(2-3):183–198.
- Kawai T, Ukai H, Inoue O, Maejima Y, Fukui Y, Ohashi F, Okamoto S, Takada S, Sakurai H, Ikeda M. 2008. Evaluation of biomarkers of occupational exposure to toluene at low levels. Int Arch Occup Environ Health. 81(3):253–262.
- Kim S, Vermeulen R, Waidyanatha S, Johnson BA, Lan Q, Smith MT, Zhang L, Li G, Shen M, Yin S, et al. 2006. Modeling human metabolism of benzene following occupational and environmental exposures. Cancer Epidemiol Biomarkers Prev. 15(11):2246–2252.
- Knudsen LE, Tolonen H, Scheepers PTJ, Loots I, Vorkamp K, Hajeb P, Sepai O, Gilles L, Splanemann P, Weise P, et al. 2022. Implementation and coordination of an ethics framework in HBM4EU – experiences and reflections. Int J Hyg Environ Health. 248:114098.
- Knutsen JS, Kerger BD, Finley B, Paustenbach DJ. 2013. A calibrated human PBPK model for benzene inhalation with urinary bladder and bone marrow compartments. Risk Anal. 33(7):1237–1251.
- Kok PW, Ong CN. 1994. Blood and urinary benzene determined by headspace gas chromatography with photoionization detection: application in biological monitoring of low-level nonoccupational exposure. Int Arch Occup Environ Health. 66(3):195–201.
- Kraus T, Bader M, Klotz K, Weistenhöfer W, Drexler H, Hartwig A, MAK Commission. 2018. Addendum zu Benzol - BAT Value Documentation in German language. The MAK Collect Occup Health Safe. 3(1):262–294.
- LaKind JS, Aylward LL, Brunk C, DiZio S, Dourson M, Goldstein DA, Kilpatrick ME, Krewski D, Bartels MJ, Barton HA, Biomonitoring Equivalents Expert Workshop, et al. 2008. Guidelines for the communication of biomonitoring equivalents: report from the Biomonitoring Equivalents Expert Workshop. Regul Toxicol Pharmacol. 51(3 Suppl):S16–S26.
- Lan Q, Zhang L, Li G, Vermeulen R, Weinberg RS, Dosemeci M, Rappaport SM, Shen M, Alter BP, Wu Y, et al. 2004. Hematotoxicity in workers exposed to low levels of benzene. Science. 306(5702):1774–1776.
- Le Noir, MM, Claude H. 1897. Sur un cas de purpura attribué à l’intoxication par le benzène. Bull Mém Soc Hop Paris. 14:1251–1260.
- Lin YS, McKelvey W, Waidyanatha S, Rappaport SM. 2006. Variability of albumin adducts of 1,4-benzoquinone, a toxic metabolite of benzene, in human volunteers. Biomarkers. 11(1):14–27.
- Lin YS, Vermeulen R, Tsai CH, Waidyanatha S, Lan Q, Rothman N, Smith MT, Zhang L, Shen M, Li G, et al. 2007. Albumin adducts of electrophilic benzene metabolites in benzene-exposed and control workers. Environ Health Perspect. 115(1):28–34.
- Maestri L, Negri S, Ferrari M, Ghittori S, Imbriani M. 2005. Determination of urinary S-phenylmercapturic acid, a specific metabolite of benzene, by liquid chromatography/single quadrupole mass spectrometry. Rapid Commun Mass Spectrom. 19(9):1139–1144.
- Manini P, De Palma G, Andreoli R, Poli D, Mozzoni P, Folesani G, Mutti A, Apostoli P. 2006. Environmental and biological monitoring of benzene exposure in a cohort of Italian taxi drivers. Toxicol Lett. 167(2):142–151.
- Manini P, De Palma G, Andreoli R, Poli D, Petyx M, Corradi M, Mutti A, Apostoli P. 2008. Biological monitoring of low benzene exposure in Italian traffic policemen. Toxicol Lett. 181(1):25–30.
- Mansfield CB. 1849. Untersuchung des Steinkohlentheers. Justus Liebigs Annalen der Chemie. 69(2):162–180.
- Mansi A, Bruni R, Capone P, Paci E, Pigini D, Simeoni C, Gnerre R, Papacchini M, Tranfo G. 2012. Low occupational exposure to benzene in a petrochemical plant: modulating effect of genetic polymorphisms and smoking habit on the urinary t,t-MA/SPMA ratio. Toxicol Lett. 213(1):57–62.
- McDonald TA, Holland NT, Skibola C, Duramad P, Smith MT. 2001. Hypothesis: phenol and hydroquinone derived mainly from diet and gastrointestinal flora activity are causal factors in leukemia. Leukemia. 15(1):10–20.
- McHale CM, Zhang L, Lan Q, Vermeulen R, Li G, Hubbard AE, Porter KE, Thomas R, Portier CJ, Shen M, et al. 2011. Global gene expression profiling of a population exposed to a range of benzene levels. Environ Health Perspect. 119(5):628–634.
- McNally K, Sams C, Loizou GD, Jones K. 2017. Evidence for non-linear metabolism at low benzene exposures? A reanalysis of data. Chem Biol Interact. 278:256–268.
- Ong CN, Kok PW, Ong HY, Shi CY, Lee BL, Phoon WH, Tan KT. 1996. Biomarkers of exposure to low concentrations of benzene: a field assessment. Occup Environ Med. 53(5):328–333.
- Ong CN, Lee BL. 1994. Determination of benzene and its metabolites: application in biological monitoring of environmental and occupational exposure to benzene. J Chromatogr B Biomed Appl. 660(1):1–22.
- Paustenbach DJ, PS, Price W, Ollison C, Blank JD, Jernigan RD, Bass, HD, Peterson. 1992. Reevaluation of benzene exposure for the Pliofilm (rubberworker) cohort (1936–1976). J Toxicol Environ Health. 36(3):177–231.
- Perbellini L, Faccini GB, Pasini F, Cazzoli F, Pistoia S, Rosellini R, Valsecchi M, Brugnone F. 1988. Environmental and occupational exposure to benzene by analysis of breath and blood. Br J Ind Med. 45(5):345–352.
- Perbellini L, Pasini F, Romani S, Princivalle A, Brugnone F. 2002. Analysis of benzene, toluene, ethylbenzene and m-xylene in biological samples from the general population. J Chromatogr B Analyt Technol Biomed Life Sci. 778(1-2):199–210.
- Perbellini L, Princivalle A, Cerpelloni M, Pasini F, Brugnone F. 2003. Comparison of breath, blood and urine concentrations in the biomonitoring of environmental exposure to 1,3-butadiene, 2,5-dimethylfuran, and benzene. Int Arch Occup Environ Health. 76(6):461–466.
- Plebani C, Tranfo G, Salerno A, Panebianco A, Marcelloni AM. 1999. An optimized sampling and GC-MS analysis method for benzene in exhaled breath, as a biomarker for occupational exposure. Talanta. 50(2):409–412.
- RAC. 2018. Opinion of the Committee for Risk Assessment on the evaluation of the occupational exposure limits (OELs) for benzene (adopted 9 March 2018). Helsinki, Finland: E. C. Agency.
- Rappaport SM, Waidyanatha S, Qu Q, Shore R, Jin X, Cohen B, Chen LC, Melikian AA, Li G, Yin S, et al. 2002. Albumin adducts of benzene oxide and 1,4-benzoquinone as measures of human benzene metabolism. Cancer Res. 62(5):1330–1337.
- Rappaport SM, Waidyanatha S, Yeowell-O'Connell K, Rothman N, Smith MT, Zhang L, Qu Q, Shore R, Li G, Yin S. 2005. Protein adducts as biomarkers of human benzene metabolism. Chem Biol Interact. 153–154:103–109.
- Rolleston HD, Boyd EJ. 1914. Lymphocytic leukaemia under treatment by benzol. Proc R Soc Med 7(Sect Study Dis Child):71–73.
- Ross JN. 1914. Benzol in the treatment of lymphatic leukaemia. Proc R Soc Med 7(Sect Study Dis Child):129–132.
- Santesson CG. 1897. Ueber chronische Vergiftungen mit Steinkohlentheerbenzin; vier Totesfälle. Nach klinischen und pathologisch-anatomischen Beobachtungen mehrerer Collegen und mit beleuchtenden Thierexperimenten. Archiv für Hygiene. 31:336–376.
- Scherer G, Renner T, Meger M. 1998. Analysis and evaluation of trans, trans-muconic acid as a biomarker for benzene exposure. J Chromatogr B Biomed Sci Appl. 717(1–2):179–199.
- Schnatter AR, Rooseboom M, Kocabas NA, North CM, Dalzell A, Twisk J, Faulhammer F, Rushton E, Boogaard PJ, Ostapenkaite V, et al. 2020. Derivation of an occupational exposure limit for benzene using epidemiological study quality assessment tools. Toxicol Lett. 334:117–144.
- Selling L. 1910. A preliminary report of some cases of purpura haemorrhagica due to benzol poisoning. Bull Johns Hopkins Hosp. 21:33–36.
- Selling L. 1916. Benzol as leucotoxin. Studies on the degeneration and regeneration of the blood and haematopoietic system. John Hopkins Hosp Rep. 17:83–148.
- Sinclair GC, Gray CN, Sherwood RJ. 1999. Structure and validation of a pharmacokinetic model for benzene. Am Ind Hyg Assoc J. 60(2):249–258.
- Stolkind E. 1931. Polycythaemia vera (Vaquez’ disease) treated by benzol, Roentgen therapy and phenylhydrazine. Complications. Proc Royal Soc Med. 24:925–928.
- Teisinger J, Fiserova-Bergerova , Mensikova J. 1955. Valeur comparée de la détermination des sulfates et du phénol contenus dans l‘urine pour l‘évaluation de la concentration du benzène dans l‘air. Archives des maladies professionnelles de médicine du travail et de securité sociale 16(1):221–232.
- Thomas R, Hubbard AE, McHale CM, Zhang L, Rappaport SM, Lan Q, Rothman N, Vermeulen R, Guyton KZ, Jinot J, et al. 2014. Characterization of changes in gene expression and biochemical pathways at low levels of benzene exposure. PLOS One. 9(5):e91828.
- Tolentino D, Zenari E, Dall’Olio M, Ruani G, Gelormini A, Mirone G. 2003. Application of statistical models to estimate the correlation between urinary benzene as biological indicator of exposure and air concentrations determined by personal monitoring. AIHA J. 64(5):625–629.
- Travis CC, Quillen JL, Arms AD. 1990. Pharmacokinetics of benzene. Toxicol Appl Pharmacol. 102(3):400–420.
- Ukai H, Kawai T, Inoue O, Maejima Y, Fukui Y, Ohashi F, Okamoto S, Takada S, Sakurai H, Ikeda M. 2007. Comparative evaluation of biomarkers of occupational exposure to toluene. Int Arch Occup Environ Health. 81(1):81–93.
- Valcke M, Haddad S. 2015. Assessing human variability in kinetics for exposures to multiple environmental chemicals: a physiologically based pharmacokinetic modeling case study with dichloromethane, benzene, toluene, ethylbenzene, and m-xylene. J Toxicol Environ Health A. 78(7):409–431.
- van Haaften A, Sie ST. 1965. The measurement of phenol in urine by gas chromatography as a check on benzene exposure. Am Ind Hyg Assoc J. 26:52–58.
- van Sittert NJ, Boogaard PJ, Beulink GD. 1993. Application of the urinary S-phenylmercapturic acid test as a biomarker for low levels of exposure to benzene in industry. Br J Ind Med. 50(5):460–469.
- Vermeulen R, Li G, Lan Q, Dosemeci M, Rappaport SM, Bohong X, Smith MT, Zhang L, Hayes RB, Linet M, et al. 2004. Detailed exposure assessment for a molecular epidemiology study of benzene in two shoe factories in China. Ann Occup Hyg. 48(2):105–116.
- Vigliani EC, Saita G. 1948. Alcune considerazioni sulle leucemie da benzolo. Med Lav. 39(2):41–44.
- Vigliani EC, Saita G. 1964. Benzene and leukemia. N Engl J Med. 271:872–876.
- Waidyanatha S, Rothman N, Fustinoni S, Smith MT, Hayes RB, Bechtold W, Dosemeci M, Guilan L, Yin S, Rappaport SM. 2001. Urinary benzene as a biomarker of exposure among occupationally exposed and unexposed subjects. Carcinogenesis. 22(2):279–286.
- Weaver VM, Buckley T, Groopman JD. 2000. Lack of specificity of trans,trans-muconic acid as a benzene biomarker after ingestion of sorbic acid-preserved foods. Cancer Epidemiol Biomarkers Prev. 9(7):749–755.
- Weber FP. 1914. Chronic myelocytic leukaemia treated by benzol, &c. Proc R Soc Med. 7(Clin Sect):39–41.
- Weiskotten HG, Gibbs CB, Boggs EO, Templeton ER. 1920. The action of benzol: VI. benzol. J Med Res. 41(4):425–438.
- Williams PR, Paustenbach DJ. 2003. Reconstruction of benzene exposure for the Pliofilm cohort (1936–1976) using Monte Carlo techniques. J Toxicol Environ Health A. 66(8):677–781.
- Yeowell-O'Connell K, McDonald TA, Rappaport SM. 1996. Analysis of hemoglobin adducts of benzene oxide by gas chromatography-mass spectrometry. Anal Biochem. 237(1):49–55.
- Yeowell-O'Connell K, Rothman N, Smith MT, Hayes RB, Li G, Waidyanatha S, Dosemeci M, Zhang L, Yin S, Titenko-Holland N, et al. 1998. Hemoglobin and albumin adducts of benzene oxide among workers exposed to high levels of benzene. Carcinogenesis. 19(9):1565–1571.
- Yeowell-O'Connell K, Rothman N, Waidyanatha S, Smith MT, Hayes RB, Li G, Bechtold WE, Dosemeci M, Zhang L, Yin S, et al. 2001. Protein adducts of 1,4-benzoquinone and benzene oxide among smokers and nonsmokers exposed to benzene in China. Cancer Epidemiol Biomarkers Prev. 10(8):831–838.
- Yokley K, Tran HT, Pekari K, Rappaport S, Riihimaki V, Rothman N, Waidyanatha S, Schlosser PM. 2006. Physiologically-based pharmacokinetic modeling of benzene in humans: a Bayesian approach. Risk Anal. 26(4):925–943.