
 ?Mathematical formulae have been encoded as MathML and are displayed in this HTML version using MathJax in order to improve their display. Uncheck the box to turn MathJax off. This feature requires Javascript. Click on a formula to zoom.
Abstract
Terrestrial gamma radiation is mostly due to radionuclides in soil and rocks, primarily the 238U, 235U and 232Th radioactive families and 40K. This radiation contributes 15% to public exposure from all ionizing radiation sources, considering global population. Moreover, it can be used to estimate radon flux and included as one of the quantities relevant to the geogenic radon hazard model. Therefore, effort has been put into developing maps of terrestrial gamma dose rate at the regional, national or European scale, using different input data and methods. In the present work, two distinct approaches to map terrestrial gamma dose rate have been tested in the Euganean Hills district of NE Italy. The first one is based on 41 in situ measurements of ambient dose equivalent rates using a rate meter equipped with a NaI scintillator probe. The second one estimates terrestrial gamma dose rate from the U, Th and K activity concentrations in rock samples collected at the same locations of the dose rates measurements. The results obtained indicate good agreement between the two approaches, and as such suggest that the UNSCEAR 2008 prescription to derive ambient dose equivalent rate from laboratory gamma measurements produces reliable data, provided that cosmic and fall-out contributions are included. Moreover, the study proved that mapping the ambient dose equivalent rate (or terrestrial gamma dose rate) using only one database – i.e. either measured data or estimates derived from radionuclide activity concentration – yields valid results.
1. Introduction
Natural radioactivity represents the major contribution to the overall radiation dose to the population, accounting on average for 80% of it (Citation1, figure XXXVI).
Around 50% of natural radioactivity exposure is associated to radon (Citation1, figure XXXVI and table 12); owing to its gaseous state, inherent mobilization and high potential for indoor build-up, radon leads at times to excess exposure. The health risk associated with radon has been recognized for decades (Citation2), leading to consequent policies in monitoring and regulations aimed at population safety (Citation3).
There has been increasing awareness of the complexity of the physical, geochemical and structural factors and mechanisms involved in radon emission, suggesting the need for a multidisciplinary approach. During the last decade, radon hazard assessment has been the object of a comprehensive effort across the EU countries, based on strong interdisciplinarity, to define new monitoring parameterization and standards. This has led to the introduction of new concepts such as those of geogenic radon potential (Citation4–8) and geogenic radon hazard index (Citation9–12).
In the framework of the European Atlas of Natural Radiation (Citation13), and due to the heterogeneity of data sources across Europe and the need to develop models to estimate a harmonized quantity that would measure or classify adequately the radon potential (Citation14, Citation15), the Joint Research Centre of the European Commission has undertaken the mapping of a variable measuring ‘what the Earth delivers’ in terms of geogenic radon potential. The availability of such a map based on geogenic quantities will afford the possibility to characterize the radon risk also where indoor radon measurements are not yet available. This means that to characterize the site and assess the correct radon potential together with its inherent hazard a number of parameters needs to be measured such as U concentration in rock and soil, radon concentration in soil gas, soil permeability as well as gamma radiation from the ground.
Terrestrial gamma radiation accompanies invariably the presence of radon, since a ground rich in radioisotopes of the uranium series is a strong emitter of both gamma and radon. Much effort has been put into developing maps of terrestrial gamma dose rate at the regional, national or European scale using different input data and methods (Citation10, Citation16–19). Studies have been run to estimate radon flux using terrestrial gamma dose rate (Citation20, Citation21) and models based on radionuclides content (Citation22, Citation23).
The present work is part of a long, ongoing investigation aimed at defining a way to assess the occurrence of a radon priority area through geogenic radon parameters in the Euganean Hills district in NE Italy, an area of remarkable geological peculiarity and environmental concern. Though of limited extension, this area belongs to an important Tertiary Volcanic Province that produced submarine mafic lavas, volcanic breccias, tuffs and hyaloclastites, and lavas (intermediate to acidic) and sub-volcanic laccoliths, now emerging as hills from the Venetian alluvial plain (Citation24, Citation25). The area is densely populated and rich in economic activities, including tourism-based specifically on thermalism and spas connected to a tectonically controlled geothermal system (Citation26), the latter being traditionally and historically recognized among the situations most likely connected with excess radon exposure (Citation27, annex E, vol. II; Citation1, annex B).
In the present work, two distinct approaches to map terrestrial Gamma Dose Rate (TGDR) – i.e. the dose due to radiation from gamma-emitting radionuclides present in the soil – are presented. The first approach is based on in situ measurements of Ambient Dose Equivalent Rates (ADER) using a rate meter equipped with a NaI scintillator probe. The second approach estimates terrestrial gamma dose rate from the U, Th and K concentrations in rock samples collected from the same points where ADERs have been measured (Citation28). A comparison between the two approaches is then discussed, and field measurements used to produce a map of ambient dose equivalent rate for the area investigated.
While the results presented have intrinsic interest in terrestrial gamma dose rate mapping, this study provides input data for future work in the Euganean Hills district. The terrestrial gamma dose rate is planned to be included as one of the quantities in the geogenic radon hazard model and to be used to estimate radon flux.
2. Materials and methods
2.1. Sampling
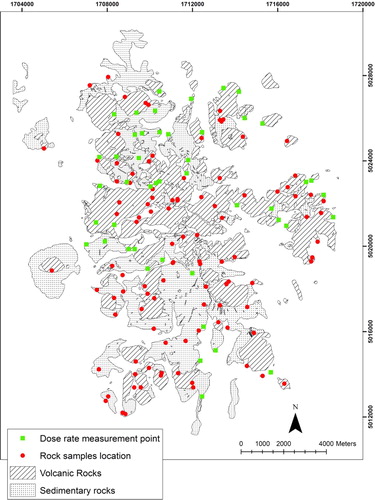
151 rock samples were collected aiming at covering a sufficiently wide area and sampling the most representative outcropping rock types, thus based on a ‘main local lithology' approach. Tositti et al. (Citation28) performed gamma spectrometry measurements, statistical and geostatistical analyses on these samples. Here a subset of 46 sampling locations was selected to perform field dose measurements (), and compare them with dose rate calculated from gamma emission measurements of rock samples.
Figure 1. Map displaying the 151 rock samples locations and the 46 dose rate measurement points superimposed over the simplified geological sketch. Coordinate system: International_1924_Transverse_Mercator.
2.2. Gamma spectrometry
Each rock sample was coarsely ground (maximum grain size: 2 mm) and weighed (about 40 g) in polystyrene containers of known fixed volume. The samples were subsequently measured by high resolution γ spectrometry using two different p-type coaxial HPGe detectors. The two detectors have relative efficiencies of 20% and 38%, and resolutions (FWHM) at 1332.5 keV of 1.9 and 1.8 keV, respectively. Both systems were calibrated for energy and efficiency using a Mixed Gamma Standard based on nine nuclides (Cd-109, Co-57, Ce-139, Hg-203, Sn-113, Cs-137, Y-88, Co-60, Co-60, Y-88 and Pb-210) liquid source in a jar geometry (diameter = 56 mm and thickness = 10 mm). Spectra were acquired for 86,000 s to optimize peak analysis. Spectra were subsequently processed and analysed using the Gamma Vision-32 software package (version 6.07, Ortec-Ametek). Uncertainty (defined here as one standard deviation) on peaks was calculated propagating the combined error over the efficiency fit previously determined with the counting error. Minimum detectable activity was determined using the Traditional ORTEC method (Citation29) with a peak cut-off limit of 40%. Analytical quality control was tested by the Certified Reference Materials Dh1-a and UTS-3, both provided by CANMET. Details on the methods and checks used for the determination of 238U and 232Th radionuclides are available elsewhere (Citation30). 238U and 232Th were determined using the emissions of their radioactive descendants 226Ra and 228Ac. The correction of the 226Ra peak at 186 keV for the 235U contribution at the same energy was carried out assuming secular equilibrium between 226Ra–238U and natural 235U/238U isotopic ratio (Citation31). Under these two hypotheses, the 226Ra peak was corrected dividing by 1.7337. Conversion from specific activity (Bq/kg) to bulk elemental weight fraction was obtained with the following conversion factors (Citation32):
1 % K = 309.7 Bq/kg
1 ppm U = 12.35 Bq/kg
1 ppm Th = 4.072 Bq/kg
2.3. Dose rate calculations
Once the concentrations of natural radioisotopes were determined from gamma spectrometry, as discussed above, and assuming the concentration of natural radionuclides in the loose soil to be essentially the same as that measured in the bedrock samples, the dose rate due to these isotopes at 1 m above the soil was estimated with the Terrestrial Gamma Dose Rate (TGDR) prescription proposed in Ref. (Citation1, table 1):
(1)
(1)
where
,
and
are the activity concentrations in the rocks in Bq/kg of 40K, 226Ra and 232Th, respectively, and the result is the absorbed dose rate expressed in nGy/h. The coefficient 1.2 Gy/Sv has been used to transform the estimates of absorbed dose in air to ambient dose equivalent rate H* (10) (Citation33), hereafter called TG-ADER.
2.4. Field dose measurements
In 46 out of the 151 locations, where the rock samples had been collected, the ambient dose equivalent rate (ADER) at 1 m from the ground was measured with an Atomtex rate meter, model AT 1117, equipped with a BDKG-05 40 mm × 40 mm NaI scintillator probe. The 46 measurement points are displayed in , together with the 151 points where rock samples were collected in (Citation28).
The ambient dose rate has several components that have to be assessed for a meaningful comparison with the estimated TG-ADER. Among these, there are the contribution of secondary cosmic rays and the 137Cs anthropogenic contribution. Since the Chernobyl accident, most areas in Italy present superficial contamination from 137Cs (Citation34), and this holds true also for the Euganean Hills.
Insofar, as cosmic radiation is concerned, a number of studies exist and report values (once reduced to effective dose rate) of about 30 nSv/h at sea level (Citation35–38); for the purpose of the present paper, the UNSCEAR recommended average value (Citation39) of 32 nSv/h will be adopted.
As for the contribution of 137Cs to external dose, gamma spectrometry data from the present project have been collected so far only on rock samples – which are unable to retain fallout – whereas soil data are not yet available. However extensive investigations were conducted in the whole Veneto region after the Chernobyl accident measuring the fall out 137Cs (Citation40), reporting for the area of interest a mean fallout deposition of 2–5 kBq/m2. Considering that the time elapsed corresponds to a half-life of 137Cs the present activity may be estimated at approximately 2 kBq/m2. Treating it as a contamination homogeneously distributed over the surface (worst case approach: actual residual fallout contamination is likely to be buried to a depth of a few tens of centimeters, yielding a lower dose than calculated as a surface contamination) the classic formula for surface sources can be used for the ambient dose equivalent rate (Citation41):
where Γ is the specific gamma constant (equal to 0.103 nSv/h/kBq @ 1 m for 137Cs), SA is the surface contamination (in kBq/m2), μ is the linear attenuation coefficient of air (for the 662 keV of 137Cs its value is approximately 0.01 m−1), h the height from the ground at which the value is sought (in the present case 1 m) and
is the exponential integral function (in the present case
). Introducing the above value of 2 kBq/m2 for the contamination the equation holds
which is one order of magnitude smaller than the contribution of cosmic radiation and is even smaller if the distribution in depth is considered assuming a uniform distribution of 137Cs over a depth of 20 cm (the tedious calculations are not reported). Overall, the contribution of 137Cs is marginal, and the value of 35–40 nSv/h, essentially due to cosmic radiation can be safely assumed, in terms of overall biasing effect.
2.5. Software and statistical tools
Surfer version 11 (Citation42) and the ArcGIS® Desktop version 10.0 software by ESRI (Citation43) have been used to estimate the variograms, develop and display the map.
The software SigmaPlot version 12 (Citation44) and the Microsoft software Excel 2010 were used for statistical analysis.
3. Results
reports the results of the ADER measured at each measurement point together with the U, Th and K activity concentration in rock sampled in the same point and the calculated TGDR as effective dose (TG-ADER).
Table 1. 232Th, 226Ra and 40K activity concentrations in the 46 rock samples; calculated (TG-ADER) and measured (ADER) ambient dose equivalent rate in the same sampling location. ADER values have been reported without decimal numbers.
Descriptive statistics of the content in radioisotopes and of the calculated and the measured values of the dose rate at 1 m from the ground for the sampling points are reported in .
Table 2. Descriptive statistics of the content in radioisotopes and of the calculated (TG-AGER) and measured dose rate (AGER) values.
The box plots in show the comparison between the distributions of measured dose rates and calculated terrestrial gamma dose rates.
Figure 2. Box plot for calculated (TG-ADER) and measured dose rates (ADER). Each box ranges between the 25th and 75th percentiles. The solid line within each box represents the median, the dashed line the mean, and the whiskers are the 10th and 90th percentiles, respectively, while the points are the 5th and 95th percentiles, respectively.
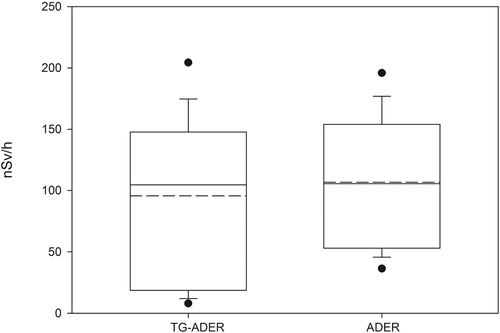
The box plots in show the lower variability of the ADER data compared to the values estimated with radionuclides contents. This could be attributed to the fact that the samples on which the TG_ADER is calculated are not fully representative of the area measured by the Atomtex rate meter.
For a more accurate comparison, a scatter plot of measured vs. calculated values is presented in : every point in the plot compares the calculated and measured values of one of the 46 locations sampled.
Figure 3. Rate of ambient dose equivalent: measured values (ADER) vs. calculated values (TG-ADER).
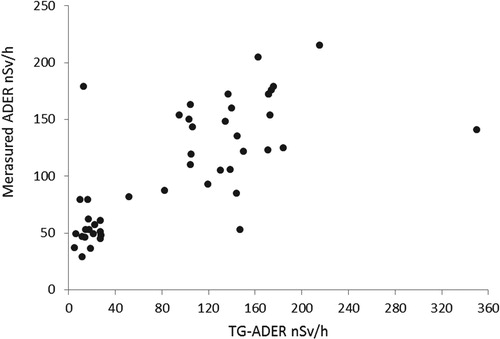
A few outliers can be observed in . To identify them, Tukey’s prescription was applied (Citation45): calling the lower quartile and the upper quartile
, an interval can be defined as
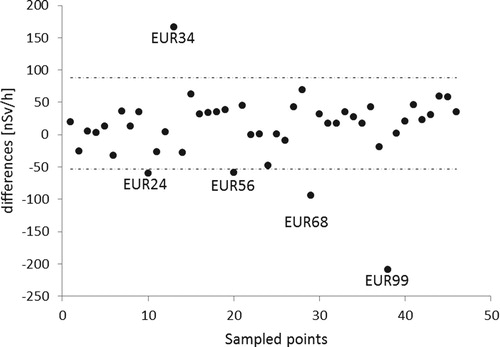
Tukey’s prescription considers all values falling out of the interval obtained with as outliers. Applying this prescription to the present data, 5 points, identified by the codes EUR24, EUR34, EUR56, EUR68 and EUR99, were found to be outliers, as shown in . With the exception of sample EUR34, all of them are rhyolites, which present the higher degree of weathering. The heterogeneous concentration of secondary clay minerals in these samples, which may cause variable secondary uptake of uranium, produces calculated gamma emissions higher than the corresponding terrestrial dose measurement. Sample EUR34 is a limestone collected in an area dominated by volcanic rocks. This might explain the lower gamma emission of the sample with respect to the terrestrial dose from soil or its parental volcanic rock.
Figure 4. Residuals. The dash-dot lines represent the limiting value of Tukey’s prescription.
A scatter plot of the remaining 41 points is presented in , along with the equation derived from the linear fitting.
Figure 5. Scatter plot of the 41 points.
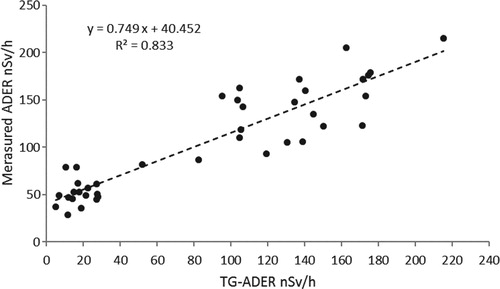
Whereas the slope slightly lower than 1 and the correlation R2 = 0.83 indicates very good agreement between the two measurements, the intercept approximately equal to 40 nSv/h indicates the presence of a large offset to be explained. As discussed in section II, this discrepancy might be largely explained by the effect of cosmic radiation and – to a lesser extent – of the presence of 137Cs on the ground.
3.1. Geostatistical analysis
Mapping is the final step to a comprehensive picture of the dose level from natural gamma radiation in an area.
In the present work, to verify the possibility to use the measured database of ADER for mapping purposes, the map obtained from all data was compared to that obtained excluding the outliers. It is worth recalling here that outliers were identified by comparing measured dose rates against those calculated from radionuclide concentration.
The variograms did not show any spatial correlation, so spatial modeling was obtained using the inverse distance squared weighted interpolation method on a 250 × 250 m grid using a maximum of seven neighboring points within a maximum distance of 5 km. shows the dose rate maps using all ADER measurements and the one excluding the outliers. The maps have been superimposed over a simplified geological map.
Figure 6. Maps of ambient dose equivalent rate in nSv/h using the entire database (a) and the database excluding outliers (b) superimposed over the simplified geological sketch. Coordinate system: International_1924_Transverse_Mercator.
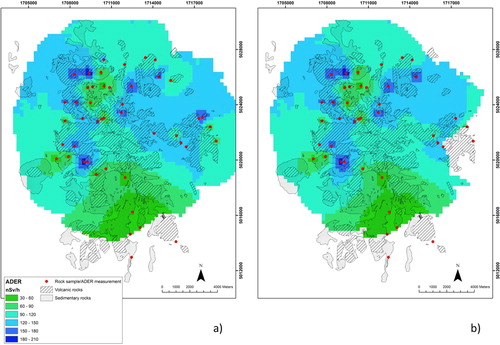
The raster calculator tool available in ArcGIS has been used for mathematical operations between the two maps in to compare them quantitatively. Results are reported in . The two maps show good agreement since, for the data between the 10th and 90th percentile, the difference is less than ± 8 nSv/h, i.e. less than 10%. This suggests that the outliers have a negligible effect on the mapping.
Table 3. Descriptive statistics obtained from the comparison between the two maps represented in .
Moreover, the maps developed in this work using measured ADER data show the same trend of the map developed using data of U, Th and K concentration of 151 rock samples (figure 10 in Citation28).
4. Conclusions
This work presents a comparison between the ambient dose equivalent rate values measured in situ and those from activity concentration of radionuclides in rock samples collected at the same measurement point. The results obtained indicate good agreement between the two approaches, and as such suggest that the (Citation1) prescription to derive ambient dose equivalent rate from laboratory gamma measurements produces reliable data, provided cosmic and fall-out contributions are included.
Moreover, a map of ambient dose equivalent rate has been developed using measured values and compared with the one obtained excluding outliers. The outliers have been identified through comparison of the two different datasets – measured ambient dose equivalent rate and dose rate calculated from activity concentration of radionuclides. The good agreement between the two maps suggests that mapping the ambient dose equivalent rate (or terrestrial gamma dose rate) using only one database, measured or estimated from radionuclide activity concentration, is reliable.
The results of this work provide input data for future work on the estimation of geogenic radon hazard index and radon flux map.
Disclosure statement
No potential conflict of interest was reported by the authors.
ORCID
D. Mostacci http://orcid.org/0000-0002-2466-9687
References
- UNSCEAR. Sources and Effects of Ionizing Radiation, I. Annex B ISBN 978-92-1-142274-0. 2008. http://www.unscear.org/docs/publications/2008/UNSCEAR_2008_Annex-B-CORR.pdf (accessed June 12, 2018).
- WHO (World Health Organization). WHO Handbook on Indoor Radon: A Public Health Perspective. WHO ISBN 978 92 4 154767 3. 2009. http://www.who.int/ionizing_radiation/env/radon/en/index1.html (accessed June 6, 2018).
- EC (European Council). Council Directive 2013/59/Euratom Laying Down Basic Safety Standards for Protection Against the Dangers Arising From Exposure to Ionising Radiation. Official J. Eur. Union 2014, 57 (L13), 1–73. https://eur-lex.europa.eu/legal-content/EN/ALL/?uri=OJ%3AL%3A2014%3A013%3ATOC (accessed June 12, 2018).
- Drolet, J.P.; Martel, R.; Poulin, P.; Dessau, J.C.; Lavoie, D.; Parent, M.; Lévesque, B. An Approach to Define Potential Radon Emission Level Maps Using Indoor Radon Concentration Measurements and Radiogeochemical Data Positive Proportion Relationships. J. Environ. Radioact. 2013, 124, 57–67. doi:10.1016/j.jenvrad.2013.04.006.
- Szabó, K.Z.; Jordan, G.; Horváth, Á; Szabó, C. Mapping the Geogenic Radon Potential: Methodology and Spatial Analysis for Central Hungary. J. Environ. Radioact. 2014, 129, 107–120. doi:10.1016/j.jenvrad.2013.12.009.
- Ciotoli, G.; Voltaggio, M.; Tuccimei, P.; Soligo, M.; Pasculli, A.; Beaubien, S.E.; Bigi, S. J. Environ. Radioact. 2017, 166 (Part 2), 355–375. doi: 10.1016/j.jenvrad.2016.05.010
- Garcia-Talavera, M.; Garcia-Perez, A.; Rey, C.; Ramos, L. Mapping Radon-prone Areas Using (Radiation Dose Rate and Geological Information. J. Radiol. Prot. 2013, 33, 605–620. doi:10.1088/0952-4746/33/3/605.
- Pásztor, L.; Szabó, K.Z.; Szatmári, G.; Laborczi, A.; Horváth, Á. Mapping Geogenic Radon Potential by Regression Kriging. Sci. Total Environ. 2016, 544, 883–891. doi:10.1016/j.scitotenv.2015.11.175.
- Cinelli G., Fernandez A., Remondo J., Quindos J., Pereda A., Gutierrez-Viallanueva J.L., Bossew P., Sainz C. Development of the Geogenic Radon Hazard Index map in Cantabria (Spain). TEERAS (3rd Eastern European Radon Symposion), Sofia, Bulgaria, May 2017 .
- Bossew P., Cinelli G., Tollefsen T., De Cort M., 2017. The Geogenic Radon Hazard Index – Another Attempt. IWEANR (Itl. Workshop on the European Atlas of Natural Radiation). November 2017. https://remon.jrc.ec.europa.eu/About/Atlas-of-Natural-Radiation/Geogenic-radon/Geogenic-radon (accessed June 6, 2018).
- Bossew, P., Cinelli, G., Tollefsen, T., De Cort, M., 2016. Multivariate Estimation of the Geogenic Radon Potential and Prediction of Indoor Rn Concentration. Oral Presentation During the 13th International Workshop on the Geological Aspects of Radon Risk Mapping, Prague 15–16 September 2016. https://remon.jrc.ec.europa.eu/About/Atlas-of-Natural-Radiation/Geogenic-radon/Geogenic-radon.
- Tollefsen, T.; Cinelli, G.; De Cort, M. Special Issue of the Journal of Environmental Radioactivity: Geogenic Radiation and its Potential use for Developing the Geogenic Radon Map – Foreword. J. Environ. Radioact. 2017, 166, 209. doi: 10.1016/j.jenvrad.2016.11.008
- Cinelli, G.; Tollefsen, T.; Bossew, P.; Gruber, V.; Bogucarskis, K.; De Felice, L.; De Cort, M. Digital Version of the European Atlas of Natural Radiation. J. Environ. Radioact. 2018. doi:10.1016/j.jenvrad.2018.02.008.
- Gruber, V.; Bossew, P.; De Cort, M.; Tollefsen, T. The European map of the Geogenic Radon Potential. J. Radiol. Prot. 2013, 33, 51e60. doi:10.1088/0952-4746/33/1/51.
- Gruber, V.; Tollefsen, T.; Bossew, P.; De Cort, M. The European Indoor Radon map and Beyond. Carpathian J. Earth Environ. Sci. 2013, 8 (2), 169–176.
- Quindos Poncela, L.S.; Fernandez, P.L.; Gomez Arozamen, J.; Sainz, C.; Fernandez, J.A.; Suarez Mahou, E.; Martin Matarranz, J.L.; Cascon, M.C. Natural Gamma Radiation map (MARNA) and Indoor Radon Levels in Spain. Environ. Int. 2004, 29, 1091–1096. doi: 10.1016/S0160-4120(03)00102-8
- Warnery, E.; Ielsch, G.; Lajaunie, C.; Cale, E.; Wackernagel, H.; Debayle, C.; Guillevic, J. Indoor Terrestrial Gamma Dose Rate Mapping in France: A Case Study Using Two Different Geostatistical Models. J. Environ. Radioact. 2015, 139, 140–148. doi: 10.1016/j.jenvrad.2014.10.002
- Strati, V.; Baldoncini, M.; Bezzon, G.P.; Broggini, C.; Buso, G.P.; Caciolli, A.; Callegari, I.; Carmignani, L.; Colonna, T.; Fiorentini, G.; Guastaldi, E.; Kaçeli Xhixha, M.; Mantovani, F.; Menegazzo, R.; Mou, L.; Rossi Alvarez, C.; Xhixha, G.; Zanon, A. Total Natural Radioactivity, Veneto (Italy). J. Maps 2014, 11 (4), 545–551. doi:10.1080/17445647.2014.923348.
- Cinelli, G.; Tositti, L.; Capaccioni, B.; Brattich, E.; Mostacci, D. Soil Gas Radon Assessment and Development of a Radon Risk map in Bolsena, Central Italy. Environ. Geochem. Health 2015, 37 (2), 305–319. doi:10.1007/s10653-014-9649-9.
- Szegvary, T.; Leuenberger, M.; Conen, F. Predicting Terrestrial 222Rn Flux Using Gamma Dose Rate as a Proxy. Atmos. Chem. Phys. 2007, 7 (11), 2789–2795. doi: 10.5194/acp-7-2789-2007
- Manohar, S.N.; Meijer, H.A.J.; Herber, M.A. Radon Flux Maps for the Netherlands and Europe Using Terrestrial Gamma Radiation Derived From Soil Radionuclides. Atmos. Environ. 2013, 81, 399–412. doi:10.1016/j.atmosenv.2013.09.005.
- López-Coto, J.; Mas, J.L.; Bolivar, J.P. A 40-Year Retrospective European Radon Flux Inventory Including Climatological Variability. Atmos. Environ. 2013, 73, 22–33. doi:10.1016/j.atmosenv.2013.02.043.
- Karstens, U.; Schwingshackl, C.; Schmithüsen, D.; Levin, I. A Process-based 222radon Flux Map for Europe and Its Comparison to Long-term Observations. Atmos. Chem. Phys. 2015, 15, 12845–12865. doi:10.5194/acp-15-12845-2015.
- Maritan, L.; Mazzoli, C.; Sassi, R.; Speranza, F.; Zanco, A.; Zanovello, P. Trachyte from the Roman Aqueducts of Padua and Este (North-East Italy): A Provenance Study Based on Petrography, Chemistry and Magnetic Susceptibility. Eur. J. Mineral. 2013, 25, 415–427. doi:10.1127/0935-1221/2013/0025-2282.
- Germinario, L.; Siegesmund, S.; Maritan, L.; Mazzoli, C. Petrophysical and Mechanical Properties of Euganean Trachyte and Implications for Dimension Stone Decay and Durability Performance. Environmental Earth Sciences 2017, 76, 1–21. doi:10.1007/s12665-017-7034-6.
- Pola, M.; Fabbri, P.; Piccinini, L.; Zampieri, D. Conceptual and Numerical Models of a Tectonically-controlled Geothermal System: A Case Study of the Euganean Geothermal System, Northern Italy. Cent. European Geol. 2015, 58 (1–2), 129–151. doi:10.1556/24.58.2015.1–2.9. doi: 10.1556/24.58.2015.1-2.9
- UNSCEAR. Sources and Effects of Ionizing Radiation. Annex E. 2006. Report to General Assembly, United Nations, New York, NY.
- Tositti, L.; Cinelli, G.; Brattich, E.; Galgaro, A.; Mostacci, D.; Mazzoli, C.; Massironi, M.; Sassi, R. Assessment of Lithogenic Radioactivity in the Euganean Hills Magmatic District (NE Italy). J. Environ. Radioact. 2017, 166, 259–269. doi:10.1016/j.jenvrad.2016.07.011.
- ORTEC. Gamma-vision 32 A66-B32 User's Manual. 2003. ORTEC USA, Part No. 783620 Manual Revision D.
- Capaccioni, B.; Cinelli, G.; Mostacci, D.; Tositti, L. Long-term Risk in a Recently Active Volcanic System: Evaluation of Doses and Indoor Radiological Risk in the Quaternary Vulsini Volcanic District (Central Italy). J. Volcanol. Geotherm. Res. 2012, 247–248, 26–36. doi:10.1016/j.jvolgeores.2012.07.014.
- Gilmore, G. Practical Gamma-Ray Spectrometry; Wiley, 2008.
- Stromswold, D.C. Calibration Facilities for Borehole and Surface Environmental Radiation Measurements. J. Radioanal. Nucl. Chem. 1995, 194 (2), 393–401. doi: 10.1007/BF02038439
- Yi, C.Y.; Jun, J.S.; Chai, H.S.; Oh, J.J.; Yun, J.Y. Measurement of Ambient Dose Equivalent Using a Na(Tl) Scintillation Detector. Radiat. Prot. Dosim. 1997, 74 (4), 273–278. doi: 10.1093/oxfordjournals.rpd.a032207
- De Cort, M.; Fridman, D.; Izrael, Y.A.; Jones, A.R. Atlas of Caesium Deposition on Europe After the Chernobyl Accident. EUR Report 16733. EC, Office for Official Publications of the European Communities, 1998.
- Oakley, D.T. Natural Radiation Exposure in the United States. US Environmental Protection Agency Report ORP/SID 72-1. 1972 .
- Sztanyik, L.B.; Nikl, I. Contribution of Cosmic Rays to Radiation Exposure of the Population. Acta Phys. Acad. Sci. Hung. 1982, 53 (1–2), 189–200. doi: 10.1007/BF03156189
- Tsui, K.C.; Wong, M.C.; Lee, B.Y. 1991. Field Estimation of Cosmic Contribution to Total External Gamma Radiation in Hong Kong. Royal Observatory, Environmental Radiation Monitoring in Hong Kong, Technical Report n.4.
- Wissmann, F.; Dangendorf, V.; Schrewe, U. Radiation Exposure at Ground Level by Secondary Cosmic Radiation. Radiat. Meas. 2005, 39, 95–104. doi: 10.1016/j.radmeas.2004.03.025
- UNSCEAR. Sources and Effects of Ionizing Radiation, I. Annex B ISBN 92-1-142238-8. 2000 . http://www.unscear.org/docs/publications/2000/UNSCEAR_2000_Annex-B.pdf (accessed June 12, 2018).
- Battiston, G.A.; Degetto, S.; Gerbasi, R.; Sbrignadello, G.; Tositti, L.; Croatto, U. The Deposition of Chernobyl Fallout in Northeast Italy. Inorg. Chim. Acta. 1987, 140, 327–329. doi:10.1016/S0020-1693(00)81115-9.
- Rockwell, T. Reactor Shielding Design Manual; McGraw-Hill: New York, 1956.
- SURFER. User’s Guide, Golden Software. 2012.
- ESRI. ArcGIS Desktop: Release 10; Environmental Systems Research Institute: Redlands, CA, 2011, www.esri.com.
- Systat Software, Inc. San Jose California USA. www.systatsoftware.com.
- Tukey, J.W. Exploratory Data Analysis; Addison-Wesley: Reading, MA, 1977, p. 44.