
 ?Mathematical formulae have been encoded as MathML and are displayed in this HTML version using MathJax in order to improve their display. Uncheck the box to turn MathJax off. This feature requires Javascript. Click on a formula to zoom.
Abstract
In the present study, we used the sol-gel and ex-situ casting techniques to prepare a nanocomposite (NC) of polyvinyl alcohol (PVA), carboxymethyl cellulose (CMC), Zinc sulfide (ZnS) and nickel oxide (NiO) nanoparticles (NP). The Rietveld modification of XRD records indicated that the prepared ZnS and NiO had a nanonature of average particle size 4 and 18 nm, respectively. Samples from the prepared PVA/CMC/ZnS-NiO NC were irradiated with γ doses ranging from 15 to 90 kGy. The resulting impact of γ radiation on the optical properties of the NC films was studied using ultraviolet spectroscopy and the International Commission on Illumination (CIE) color difference technique. When the γ dose increased up to 90 kGy, both the direct and indirect bandgaps decreased. The Urbach energy exhibited a reverse trend. This could be attributable to the dominance of chain crosslinks. In addition, we used the optical dielectric loss (ε″) to identify the type of microelectronic transition for the NC samples, which was found to be a direct allowed transition. Also, the impact of γ radiation on the absorbance, extinction coefficient, refractive index, optical dielectric parameters, optical conductivity and the nonlinear parameters of the NC films were investigated. Moreover, the changes in color between the irradiated samples and pristine were determined. The pristine NC film was colorless. It showed permanent color changes upon the γ irradiation. The induced modifications in the optical properties indicated that the prepared PVA/CMC/ZnS-NiO NC can be suitable candidate for the application of in optoelectronic devices.
1. Introduction
Organic–inorganic hybrid optical materials are very important from a technological viewpoint. Hybrid nanocompositions (NCs) with significant characteristics can be produced when the properties of inorganic elements and polymer matrix are correlated. Polymeric NCs, due to their distinctive properties, represent an important category in the field of applied materials science technology. Polymer NCs exhibit a diversity of attractive optical features, including refractive index, tailored absorption spectra and strong optical nonlinearities. These materials are qualified for the application in optoelectronic as they have such distinctive properties (Citation1–4). One of the essential polymers that can be used in a variety of industrial applications is the polyvinyl alcohol (PVA). It is an environmental material that is non toxic and has good chemical and thermal stability. It is characterized by excellent optical properties (Citation5, Citation6). NCs fabricated from PVA are usually used in a wide range of products, including optical membranes, nanofibers and wrapping materials (Citation7, Citation8). Another essential polymer is the carboxymethyl cellulose (CMC) which is an important derivative of cellulose. In this polymer, the carboxylic groups (-CH2-COOH) are bound to some OH groups of natural cellulose (Citation9, Citation10). CMC is a semi-crystalline polymer that is water-soluble, non-toxic (Citation11), low-cost (Citation12) and biodegradable material (Citation13) with good film-forming capability. From the previous literature, the blend of CMC and PVA has enhanced physical properties (Citation14). Ibrahim et al. (Citation15) prepared membranes from PVA and 12.5% CMC. They found that the inclusion of CMC decreases the absorbance of the OH groups because of the bond formation between CMC and PVA. This caused the reduction in the transport properties of PVA.
The physical and chemical properties of the NC can be improved by the addition of nanoparticles (NP). This can be attributed to the tiny size of the NP that allow a high ratio of surface area to volume. This is required for their interactions. Consequently, the produced NCs can be suitable for their use in many industrial applications (Citation16). Among the common metallic-chalcogenides NP is the ZnS which is widely used in photocatalytic applications. It has two main crystalline structures, wurtzite and cubic phases. It exhibits good semiconductors properties with oxidation and reduction bands potential that allow it to be a suitable candidate for photocatalytic water splitting (Citation17, Citation18). However, a disadvantage of ZnS is the photo-corrosion behavior and inadequate charge splitting efficiency (Citation19, Citation20). On the other hand, NiO exhibited an electrochemical effect and has attained important awareness because of its optical properties. NiO is chemically stable due to its cubic structure stability (Citation21). NiO is an effective matter which allows enhanced reduction reaction, high strength to photocorrosion and co-catalytic characteristics (Citation12). Navakoteswara et al. (Citation22) confirmed that the ZnS/NiO mix is effective in transferring carriers to the surface of the catalyst.
On the other hand, the γ irradiation of polymers plays an important role in enhancing their chemical and physical properties. When polymers are exposed to γ radiation chain sessions arise, therefore creating chemically active free radicals which cause the formation of new bonds leading to chain crosslinks, consequently, the morphology and macromolecular structure of the polymers are affected (Citation23). Furthermore, the γ irradiation-induced color change in polymers is another important characteristic that makes it easier to recognize how the polymer's properties have changed (Citation24). The aim of our study described here was to study the feasibility of enhancing the linear and nonlinear optical properties of the prepared PVA/CMC/ZnS-NiO NC using the γ radiation for their application in optoelectronic and electronic devices.
2. Experimental
2.1. Materials
Sigma-Aldrich GmbH, Egypt was contacted to supply the (EDTA-ethylenediamine) and PVA (average molecular weight was 27,000 g/mol). CMC (average molecular weight was 250,000 g/mol) was purchased from Sigma-Aldrich Corp., USA.
2.1.1. Preparation of the ZnS and NiO NPs
ZnS NP were prepared, following the same procedure illustrated in details in our prior article (Citation25), using the chemical coprecipitation procedure in atmospheric air in the presence of a stabilizing agent (EDTA-ethylenediamine). The NiO NP were prepared using the solgel technique. We provided detailed information in our previous article (Citation21).
2.1.2. Preparation of PVA/CMC/ZnS-NiO NC films
The PVA/CMC/ZnS-NiO NC film was prepared using the ex-situ casting technique. 100 mL of hot, deionized water, 0.5 g of CMC and 0.5 g of PVA were thoroughly stirred for four hours at 85oC to form a CMC/PVA solution. We then added 1 w% of the previously prepared ZnS and NiO NP (0.005 g each) with magnetic stirring in a vacuum oven set to 80°C. Then we poured the mixtures into Petri dishes for drying. The formed films were then kept at 40°C for four days in an electric oven in order to eliminate the residual solvents. We used the same procedure in our previous article (Citation26). The resulting film was of 0.28 mm average thickness, measured by a thickness meter (Model 11/2704 Ast MD 370) standardized by the ABD-Arab British Co. for Dynamics Industrialization, Egypt.
2.2. Irradiation tool
The NC films were irradiated using a 60Co source (designed by Atomic Energy of Canada, Ltd.) with a dose rate of 1 kGy/h. The samples were irradiated at the National Center of Radiation Research and Technology, Egyptian Atomic Energy Authority, Cairo, Egypt.
2.3. Experimental device
As illustrated in our previous articles (Citation21, Citation25), the XRD was carried out using a PANalytical diffractometer model (X’Pert-Pro MPD, Koninklijke Philips N.V. (Royal Philips), Netherlands) with a goniometer using Cu-Kα radiation (λ=1.542A°). The microstructure and structure of the prepared NP were studied using the Rietveld profile method, using Program MAUD (Luca Lutterotti, Department of Materials Engineering and Industrial Technologies, University of Trento, Trento, Italy (Citation27)). In addition, the morphology of the NP was characterized with a scanning electron microscope SEM (Model JCM 6000, JEOL Ltd., Japan). Additionally, the shape and electron diffraction of the fine particles were studied by means of a transmission electron microscope (model: JSM2010; JEOL Ltd., Japan).
The UV/Vis spectra (200–800 nm) of the irradiated films and pristine were measured using a 1800 spectrophotometer (Tomos Life Science Group, China). The differences in color between the irradiated films and the pristine were calculated using the International Commission on Illumination (CIE) color changes technique.
3. Results and discussion
3.1. Characteristics of the prepared NP
The Rietveld improved outlines of the ZnS and NiO NPs, obtained by means of the MAUD software together with the SEM images were investigated in our previous articles (Citation21, Citation25). The synthesized ZnS was extremely crystalline in cubic sphalerite phase. Its average particle diameter was 4 nm. The SEM image showed that the ZnS was characterized by spherical crystals which were aggregated. These aggregators contains uniform shaped NPs of size ranging from 10 to 25 nm. The results of TEM showed that the ZnS crystals are of ∼2.5 nm diameter in average. The TEM and SEM images of ZnS NPs were shown in our prior article (Citation25).
The NiO NP had a sole phase by space group (R-3 m) and 18 nm particle diameter. The particles were spherically shaped and tended to agglomerate because of their common reactions.
3.2. Absorbance analysis
The absorbance spectra of the irradiated PVA/CMC/ZnS-NiO NC films and the pristine was measured to investigate the changes in the bandgap (Eg) structure due to the γ irradiation and to obtain information concerning the optical microelectronic transitions. The obtained curves are shown in Figure . A high absorbance band was observed at 280 nm, then the absorbance decreased with increasing wavelength up to 800 nm. This can be attributed to the π− π* phenyl rings and locally excited n−π* transitions between the energy levels (Citation28). These transitions depend on how closely adjacent phenyl rings are conjugated within the PVA chain (Citation29).
Figure 1. The absorbance bands of the pristine and irradiated NC samples.
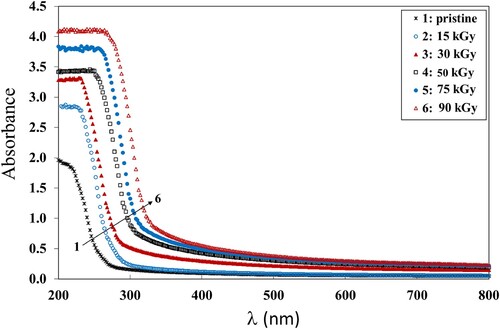
Additionally, the increase of γ dose up to 90 kGy, the maximum dose used, caused the incorporation of the NP inside the polymer matrix leading to the increase of the absorbance. This can be attributed to the change of the energy band levels caused by the gamma radiation. Furthermore, it can be due to the energy transfer by the gamma radiation that causes crosslinking which increases the amount of disordered regions in the polymer matrix (Citation30). Also, the UV light stimulates the molecules to their single or triple states and therefore causes the photo-chemical reactions to start in the polymeric matrix, leading to an increase in absorbance (Citation31). The increase in absorbance with increasing dose indicates that the intermediate atoms of the NC have absorbed the incident photon energy and consequently a novel chemical configuration was formed, so it is expected that the bandgap will decrease with increasing dose (Citation32). Additionally, the chain crosslinking can be activated by the small size of the NP. This is responsible for the decrease in the atomic volume filled with the NP and hence its density and absorbance increase (Citation33).
3.3. Urbach energy analysis
One of the parameters which are used to quantify energetic disorder in the band edges of amorphous materials is the Urbach energy (EU). The reason is the presence of localized states, which are extended into the bandgap, in those materials (Citation34). EU is calculated by fitting the absorption coefficient (α) as a function of energy (Citation35). This absorption coefficient (α) follows the Urbach rule (Citation36):
(1)
(1) where the constant αo depends on the material and EU is the Urbach energy that specifies the disorder of phonon states in the NC (Citation37).
We used the following equation to determine the absorption coefficient (α):
(2)
(2) in which A is the absorbance and d is the sample thickness. The changes in band structure can be recognized using
. We calculated EU using the slope of the resulting straight lines of the ln α vs. hυ graph (Figure ) and applying Equation 1. The calculated EU values are given in Table . The Urbach energy increased when the γ dose increased up to 90 kGy (Table ). The increase of the EU could be attributed to the chain crosslinking that led to more amorphous regions (Citation38).
Figure 2. A plot of lnα vs. hν for the pristine and irradiated NC films.
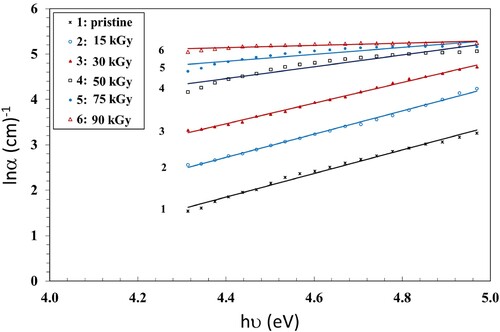
Table 1. Values of EU and Eg obtained from Tauc’s relation and Eg obtained from ε″ vs. hυ of the PVA/CMC/ZnS-NiO NC films as a function of γ dose.
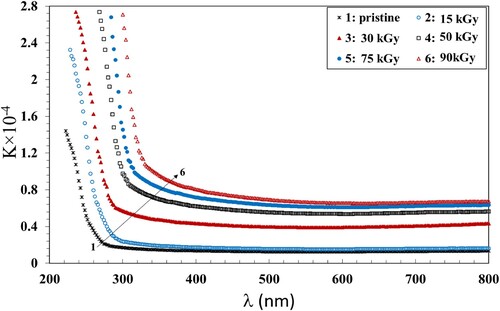
The extinction coefficient (K) of the irradiated NC films and the pristine was calculated using Equation 3:
(3)
(3) where
and
is the absorption coefficient. The extinction coefficient provides knowledge about the slight dispersions of the incident photons due to the absorption and scattering per unit path of the entered medium. The plots of K vs.
are shown in Figure . The extinction coefficient showed a decrease with increasing λ up to 800 nm. Also, K increased with increasing dose up to 90 kGy which can be attributed the increase in the amount of disordered regions within the NC due to the formation of chain crosslinks.
Figure 3. The variation of the extinction coefficient with the wavelength.
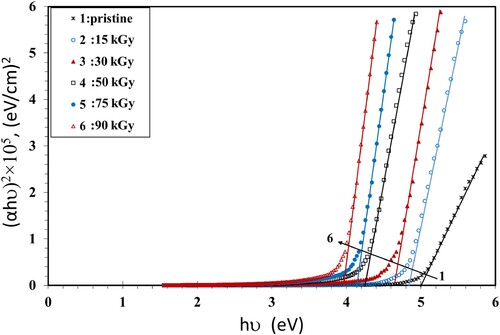
3.4. Bandgap analysis
The bandgap (Eg) values were calculated using the Tauc's principle (Equation 4) (Citation39):
(4)
(4) where hν is the photon energy and B is the probability parameter for the transition, which measure the disorder of the material (Citation40). It has no constant value because it depends on the static refractive index and the minimum electrical conductivity. The value of the index n signifies the nature of the micro-electronic transition. It has the value of 1/2 or 3/2 for a direct transition, while it has the value of 2 or 3 in the case of an indirect transition, dependent on whether being allowed or forbidden (Citation41). The values of Eg can be calculated by plotting (αhν)1/n vs. hυ and then extending the straight part of the curve to the hυ axis. Figure shows the Tauc’s relations that were used to estimate bandgaps for n = 1/2. The obtained values of Eg of the NC films are given in Table as a function of γ dose. The values of Eg decreased when the dose was increased up to 90 kGy. This can be attributed to the increase of the amorphous regions in the NC films. This activates the localized states and generation of defects, initiating microelectronic transitions of lower energy. The dispersal impact of the NP, which modifies the transmission, may also be the reason for the drop of Eg. In addition, the γ irradiation causes the breaking of bonds that creates free radicals, leading to an increase of chain crosslinks, also resulting in a drop in the Eg values (Citation42).
Figure 4. A plot of (αhν)2 vs. hν for the pristine and irradiated NC film.
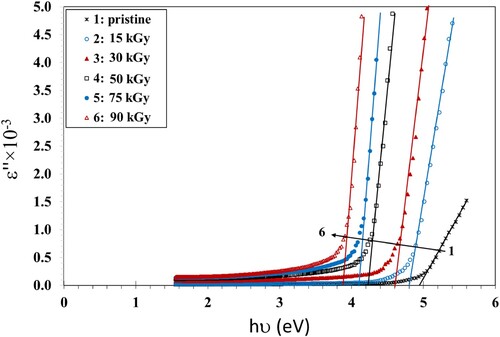
In order to determine the optical bandgap and the type of the microelectronic transition, we plotted the Tauc’s model plots (Figures ) and the optical dielectric loss, ε″, function (Figure ) because ε″ depends on the band structure of its matter. The values of Eg obtained from the Tauc’s model plots (Figures ) and the plot ε″ vs. hν graph (Figure ) are shown in Table . Studying the ε″ function by using UV spectroscopy helps in understanding the full band structure of the material (Citation43). Also, the imaginary part of the dielectric loss, ε″, helps in realizing the microelectronic transition among non-occupied and occupied states (Citation43). For instance, in a prior article, Aziz et al. (Citation43) prepared samples from polyvinyl alcohol/cerium dioxide (PVA/CeO2) that exhibited a direct allowed transitions because the values of the Eg obtained from (ε″) vs. hν were close to the values obtained from Tauc's relationship when n = 1/2. They had a direct optical Eg as a result. In another article (Citation41), they prepared films from poly(methyl methacrylate) (PMMA) doped with dye. They found that the Eg values of the treated films obtained from ε″ vs. hν were nearly equal to the results of Tauc's relation with n = 3/2, while the values of Eg of pure PMMA, obtained from Tauc's relation when n = 1/2, were fairly close to the one determined from the ε″ vs. hν plot. They reached the conclusion that the blank film had allowed direct transitions, while the treated film had a forbidden direct transition. Similar results were obtained by Brza et al. (Citation44). They found that the Eg values estimated using n = 3/2 were adequately close to those obtained from the ε″ vs. hν plot, signifying that the transition was categorically forbidden. They concluded that the optical dielectric loss could be efficiently used for estimating Eg and studying the band structure.
Figure 5. A plot of (αhν)0.5 vs. hν for the pristine and irradiated NC films.
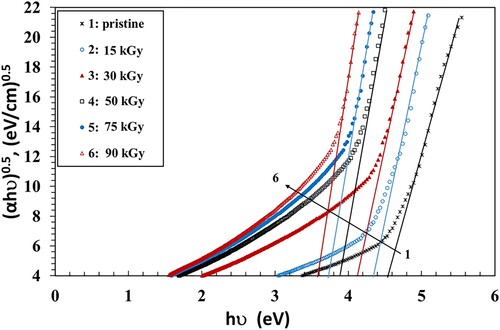
Figure 6. A plot of (αhν)2/3 vs. hν for the pristine and irradiated NC films.
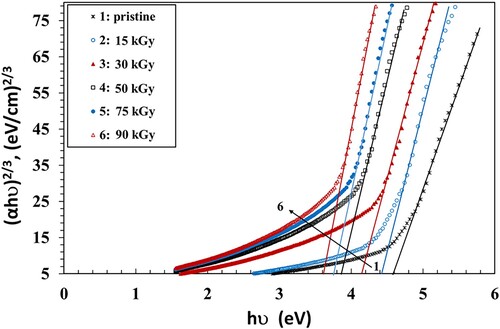
Figure 7. A plot of ε″ vs. hν for the pristine and irradiated NC films.
The values of ε″ were calculated using Equation 5:
(5)
(5) in which K is the extinction coefficient, and n is the real component of the complex refractive index. We calculated the refractive index using the Equation 6:
(6)
(6)
The amplitude reflectance (R) can be calculated using the transmission values (T), calculated from the absorption spectrum and the relation: .
In our results, we found that the values of Eg obtained from the ε″ vs. energy plots were close to those values obtained from Tauc’s relation when n = 1/2 (Table ). This indicates that the PVA/CMC/ZnS-NiO NC film exhibited direct allowed transitions (Citation43).
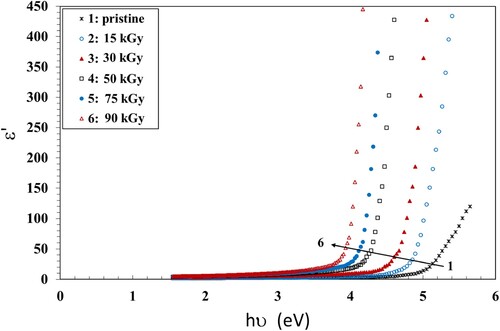
The dielectric parameters help in the interpretation of the optical properties of the materials (Citation45). The dielectric constant is related to the refractive index n and extinction coefficient K according to Equation 7 (Citation46):
(7)
(7) The calculated values are plotted vs. hν in Figure . It is shown that the NC films established a unique photon electron interaction. The values of ε′ increased when increasing the γ dose up to 90 kGy, meaning the increase of the density of states within the forbidden gap of the NC film. The crosslinking induced by γ radiation destroys the ordered structure creating more defects and thus increasing the density of states inside the NC forbidden gap (Citation44).
Figure 8. A plot of ε′ vs. hν for the pristine and irradiated NC films.
3.5. Refractive index analysis
The change of the real component of the complex refractive index, n, with wavelength, is an important property, required in designing optoelectronic devices such as waveguides, modulators and filters. We calculated the values of n using Equation 6. The change of n with wavelength is shown in Figure . It is shown that n decreased with wavelength and increased when increasing the γ dose up to 90 kGy.
Figure 9. A plot of n vs. λ for the pristine and irradiated NC films.
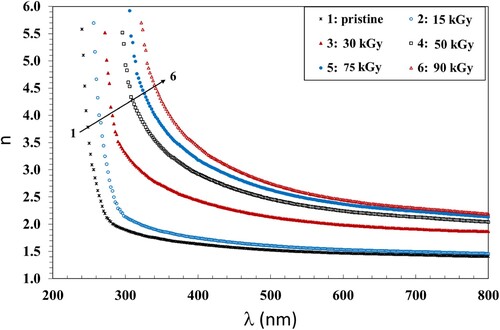
The effect of high inertia of the polymer molecules was detected from the decrease of n with increasing the wavelength; this indicates a reduction of the electronic polarizability state of the macromolecules with the low energy photons. Moreover, the values of n increased with increasing the γ dose, which can be considered as an evidence for the intermolecular modifications in the polymer matrices.
The increase of n with increasing γ dose signifies the formation of hydrogen bonds in the chains because n is a parameter that indicates the optical density of the materials, This allows the increase of disordered regions leading to crosslinking. The trend of n with γ dose was similar to that of Eg described in section 2.3; both were due to the effect of crosslinking. Comparable results were obtained previously by Shams-Eldin et. al. (Citation47). They showed that the development of chain crosslinks was the reason for increasing the values of n. An analogous investigation was carried out earlier by Ranby and Rebek (Citation48).
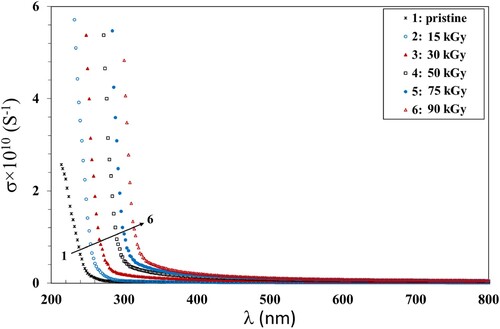
3.6. Optical conductivity analysis
Another essential factor of concern in the fields of optoelectronic devices is the optical conductivity (σ). It means the electrical conductivity of matter in the presence of an alternating electric field associated with the incident EM radiation. We calculated σ using α, n and c (the velocity of the light) using Equation 8 (Citation49):
(8)
(8) The variation of σ with the incident λ is shown in Figure . The values of σ showed similar trend to that of the absorbance and refractive index (Figures and ). This can be attributed to the inability of the incident photons with low energy to be transmitted through the film. Also, it is shown that σ increased when increasing the γ dose up to 90 kGy which can be attributed to the increase of the amorphous regions in the polymer matrix. This allows the movement of electrons in the bandgap and, thus, σ increases. These results were in agreement with those obtained by Ismail et al. (Citation50).
Figure 10. A plot of σ vs. λ, for the pristine and irradiated NC films.
The Wemple-Di-Domenico single oscillator model helps in studying the spectral dependence of the refractive index below the band gap energy region (inter-band absorption edge) (Citation51, Citation52). It describes the dielectric response for transitions below the optical gap (Citation52). The dispersion of the refractive index, n, was analyzed as expressed by Wemple-Di-Domenico single oscillator model relationship (Citation53):
(9)
(9) where
is the photon energy,
is the single oscillator energy, and
is the dispersion energy (average strength of inter-band optical transitions). The single oscillator energy (Eo) is the average gap energy which is dependent on the optical bandgap (Eg) (Citation51, Citation52). The dispersion energy Ed is related to the charge distribution within each unit cell and is, thus, a quantity closely related to chemical bonding. Ed is directly related to the structural properties of the material (Citation52).
and
, can be directly determined from the slope
of the linear portion of the plots (n2−1)−1 vs. (hν)2 (Figure ) and its intercept with the ordinate axis
. Furthermore, the value of the dielectric constant at high frequency (
) was determined from the intersection of the lines with the y-axis at
= 0. The values of Eo and Ed were determined and are given in Table . The values of Eo decreased with increasing the γ dose up to 90 kGy, while Ed exhibited an opposite trend, indicating stronger optical transitions.
Figure 11. A plot of (n2-1)−1 and (hν)2 for the pristine and irradiated NC films.
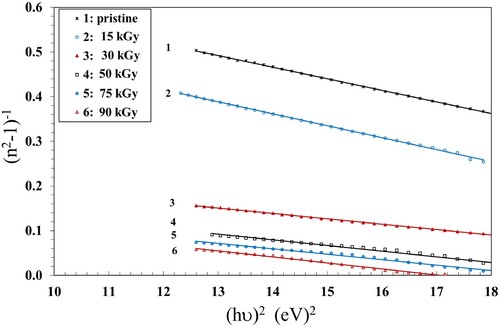
Table 2. Values of linear and nonlinear parameters of the PVA/CMC/ZnS-NiO NC films as a function of γ dose.
The dependence of refractive index on wavelength for our samples can be expressed by the following relationship (Citation54).
(10)
(10) where
is the average oscillator strength,
is an average oscillator wavelength and
is the wavelength of the incident light. The values of average inter-band oscillator wavelength (
), average oscillator strength (
) and the lattice dielectric constant (εl) were calculated and are given in Table . These values were determined from the slope and intercept of the linear fits of the plots (n2−1)−1 vs. λ−2 (Figure ) and n2 vs λ2 (Figure ) and applying Equation 11 given below:
Figure 12. A plot of (n2-1)−1 vs. λ−2 for the pristine and irradiated NC films.
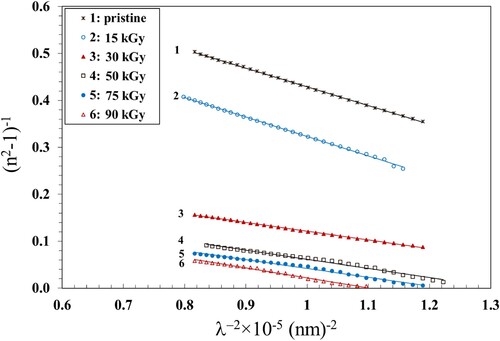
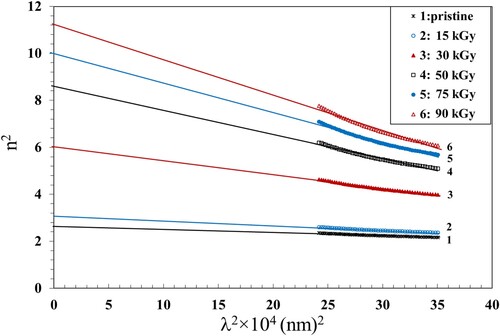
Figure 13. A plot of n2 vs. λ2 for the pristine and irradiated NC films.
For further analysis of the optical data, the lattice dielectric constant was calculated according to the following relation (Citation55).
(11)
(11) where
is a constant. The value of the lattice dielectric constant,
, can be calculated from the plots of
vs.
and extrapolating the linear part toward the shorter wavelength (Figure ). The intercept with the vertical axis (at
= 0) gives the
values which are also listed in Table . The values of n0, λo and εl increased with increasing the γ dose up to 90 kGy, while So exhibited a non monotonic trend. We attribute the increase of these parameters to the formation of chemically active free radicals that support the local polarization (Citation56). The γ irradiation leads to crosslinking that destroys the ordered structure and induces lattice defects that modify the electronic structure. The presence of lattice defects introduces new energy levels within the Eg, effectively increasing the material's lattice dielectric constant.
3.7. Nonlinear optical parameters
The optical behavior of materials whose polarization depends on the intensity of an applied electromagnetic radiation can be investigated by considering the third-order nonlinear optical susceptibility (χ3). This intensity dependence gives rise to a variety of significant properties, such as self-focusing, two-photon absorption and third harmonic generation. Self-focusing is a non-linear optical process induced by the change in refractive index of materials exposed to intense electromagnetic radiation. The two-photon absorption means that the sample absorbs two photons simultaneously in order to excite a molecule from ground state to a higher energy. The third harmonic generation is a process whereby light is generated at a wavelength which is 1/3 of the original wavelength. These processes are considered the base for all optical switching devices and photonic applications (Citation57). We calculated χ3 according to the Miller’s rule using Equation 12: (58)
(12)
(12) where
=
The nonlinear refractive index, χ2, of a material can be calculated based on χ3 and the linear refractive index, n0, using Equation 13: (59).
(13)
(13) where
is the linear refractive index,
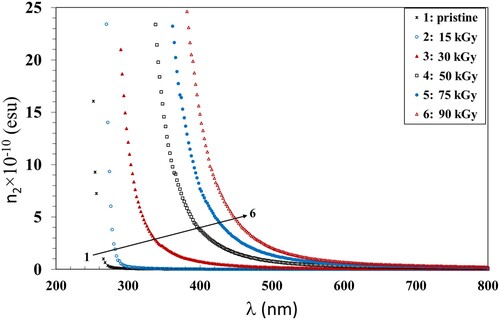
. The values of the static refractive index (no) are given in Table . The variation of χ3 with hν and χ2 with the wavelength of the incident photons for the pristine and exposed PVA/CMC/Zn-NiO NC films are shown in Figures and . Both χ3 and n2 decreased with increasing wavelength for all films. Also, they increased with increasing the γ dose up to 90 kGy which was consistent with the previously discussed data. The increase in χ3 and n2 values can be attributed to the induced alternations within the polymer structure due to the hydrogen bond cleavages. This induces defects and, hence, disorders, that enhance the number of chemically active free radicals and thus boosts the χ3 and n2 values.
Figure 14. A plot of χ3 vs. λ for the pristine and irradiated NC films.
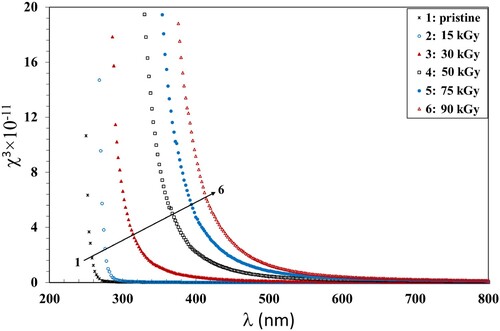
Figure 15. A plot of n2 vs.λ for the pristine and irradiated NC films.
3.8. Color changes analysis
A distinctive set of mathematical lights, X, Y and Z were established by vision scientists, to substitute the real red, green and blue lights (Citation60). The X, Y and Z are known as the color's tristimulus values. Moreover, they established an equivalence methodology to estimate the x, y and z chromaticity coordinates that describe the color saturation. Using the International Commission on Illumination (CIE) color changes technique defined in our prior article (Citation61), the color change parameters were calculated using the transmission data measured in the λ range from 370 up to 780 nm and applying the mathematical equations described in details in our prior article (Citation61).
The tristimulus values and chromaticity coordinates were evaluated and are given in Table as a function of γ dose.
Table 3. The tristimulus values and chromaticity coordinates of the PVA/CMC/ZnS-NiO NC films as a function of γ dose.
The 1976 CIE L* a* b* color space formula is useful in the production of paint, plastic and textile. This system's L*, a* and b* intercepts are built on the CIE color triangle. The L*, a*, b*values in this system denote the dark-white axis, the green-red axis and the blue-yellow axis. The uncertainty in valuing L* was ±0.05 and was ±0.01 for both a* and b*, respectively. The variations of a*, b* and L* with the γ dose are shown in Figure . The intercepts a* and b* had negative values that increased with increasing the dose up to 90 kGy, signifying the trend of the green and blue color components to be red and yellow, respectively (Figure a). This was associated with the darkness in the films (−L*) (Figure b).
Figure 16. The color intercepts and the color intensity vs. γ dose.
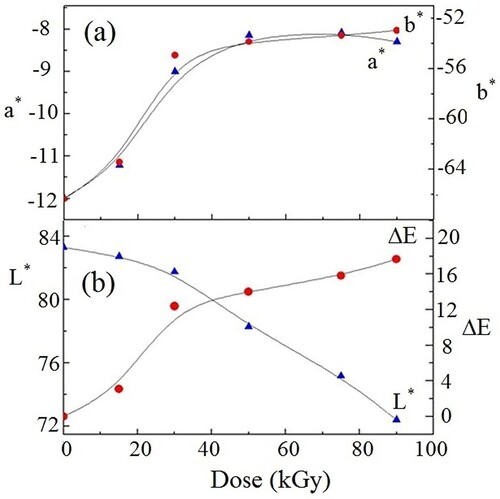
We used the color difference formula (Citation61) to estimate the color intensity (ΔE), which is the color difference between the irradiated NC films and the pristine. The variation of ΔE with the γ dose is shown in Figure b. Increasing the γ dose up to 90 kGy resulted in significantly higher values of ΔE. The color intensity, ΔE, reached 18 indicating significant color changes (Citation44, Citation45).
The main cause of coloration, the formation of the conjugated double bonds, was activated by the free radicals formed as a result of bond rupture. This causes discoloration and a decrease in light transmission which resulted in the formation of electron excitation levels in the visible spectral range. Also, the trapped free radicals produced from the radiation induced rupture of the polymer molecules, have electrons with unpaired spins. Such species may also give optical coloration (Citation61).
4. Conclusions
Gamma irradiation with doses up to 90 kGy led to chain crosslinks of the PVA/CMC/ZnS-NiO polymeric NC films and, thus, enhances their optical properties. Due to the formation of chain crosslining, the values of the absorption, absorption coefficient, refractive index, optical conductivity and the dielectric parameters (ε′ and ε″) increased. The values of the direct and indirect Eg decreased. Also, the values of the Eg indicated that the type of microelectronic transition in the PVA/CMC/ZnS-NiO NC samples was direct allowed. The increase in the values of n associated with the decrease in Eg with the γ irradiation suggests the use of the synthesized NC for application in solar cells as an absorbing material. Also, the nonlinearity behavior of the γ irradiated NC films can be considered a useful guide for future optoelectronic devices application.
In response to the ability of γ radiation to change color, the pure NC film behaved in an unusual way; the red and blue color components changed to green and yellow and were accompanied by an increase in the NC films’ darkness. Furthermore, the values of color intensity indicated significant color changes.
Disclosure statement
No potential conflict of interest was reported by the author(s).
References
- Ahmad, A.A.; Alsaad, A.M.; Al-Bataineh, Q.M.; Al-Akhras, M.-A.H.; Albataineh, Z.; Alizzy, K.A.; Daoud, N.S. Synthesis and Characterization of ZnO NPs-Doped PMMA-BDK-MR Polymer-Coated Thin Films with UV Curing for Optical Data Storage Applications. Polym. Bull. 2021, 78, 1189–1211. doi:10.1007/s00289-020-03155-x.
- Alsaad, A.M.; Al-Bataineh, Q.M.; Ahmad, A.A.; Jum’h, I.; Alaqtash, N.; Bani Salameh, A.A. Optical Properties of Transparent PMMA-PS/ZnO NPs Polymeric Nanocomposite Films: UV-Shielding Applications. Mater. Res. Exp. 2020, 6, 126446. doi: 10.1088/2053-1591/ab68a0.
- Jum’h, I.; Mousa, M.S.; Mhawish, M.; Sbeih, S.; Telfah, A. Optical and Structural Properties of (PANI-CSA-PMMA)/NiNPs Nanocomposites Thin Films for Organic Optical Filters. J. Appl. Polym. Sci. 2019, 137, 48643. doi:10.1002/app.48643.
- Chamroukhi, H.; Hamed, Z.B.; Telfah, A.; Bassou, M.; Zeinert, A.; Hergenröder, R.; Bouchriha, H. Optical and Structural Properties Enhancement of Hybrid Nanocomposites Thin Films Based on Polyaniline Doped with Zinc Oxide Embedded in Bimodal Mesoporous Silica (ZnO@SiOX) Nanoparticles. Opt. Mater. 2018, 84, 703–713. doi:10.1016/j.optmat.2018.07.041.
- Sheha, E.; Khoder, H.; Shanap, T.S.; El-Shaarawy, M.G.; Mansy, E.; Structure, M.K. Dielectric and Optical Properties of p-Type (PVA/CuI) Nanocomposite Polymer Electrolyte for Photovoltaic Cells. Optik. 2012, 123, 1161–1166. doi: 10.1016/j.ijleo.2011.06.066.
- Virtanen, S.; Vartianen, J.; Setala, H.; Tammelin, T.; Vuoti, S. Modified Nano Fibrillated Cellulose-Polyvinyl Alcohol Films with Improved Mechanical Performance. RSC Adv. 2014, 4, 11343–11350. doi: 10.1039/c3ra46287k.
- Zhang, C.H.; Yang, F.; Wang, W.; Chen, B. Preparation and Characterization of Hydrophilic Modification of Polypropylene non-Woven Fabric by dip-Coating PVA (Polyvinyl Alcohol). Sep. Purif. Technol. 2008, 61, 276–286. doi: 10.1016/j.seppur.2007.10.019.
- Abdelaziz, M.; Ghannam, M. Influence of Titanium Chloride Addition on the Optical and Dielectric Properties of PVA Films. Phys. B: Condens. Matter. 2010, 405, 958–964. doi: 10.1016/j.physb.2009.10.030.
- Gad, Y.H.; Ali, H.E.; Hegazy, E.S.A. Radiation-induced Improving Mechanical and Thermal Properties of Carboxymethyl Cellulose/Clay Composite for Application in Removal of Copper(II) Ions from Wastewater. J. Inorg. Organomet. Polym. Mater. 2021, 31, 2083–2094. doi:10.1007/s10904-020-01850-w.
- Pettignano, A.; Charlot, A.; Fleury, E. Solvent-Free Synthesis of Amidated Carboxymethyl Cellulose Derivatives: Effect on the Thermal Properties. Polymers 2019, 11, 1227. https://doi.org/10.3390/polym11071227.
- Mazuki, N.F.; Abdul Majeed, A.P.P.; Nagao, Y.; Samsudin, A.S. Studies on Ionics Conduction Properties of Modification CMC-PVA Based Polymer Blend Electrolytes via Impedance Approach. Polym. Test. 2020, 81, 106234. doi:10.1016/j.polymertesting.2019.106234
- Suppiah, K.; Teh, P.L.; Husseinsyah, S.; Rozyanty, A.R. Properties and Characterization of Carboxymethyl Cellulose/Halloysite Nanotube bio-Nanocomposite Films: Effect of Sodium Dodecyl Sulfate. Polym. Bull. 2019, 76, 365–386. doi: 10.1007/s00289-018-2392-0.
- Prajapati, D.G.; Kandasubramanian, B. Biodegradable Polymeric Solid Framework-Based Organic Phase-Change Materials for Thermal Energy Storage. Industrial Eng. Chem. Res. 2019, 58, 10652–10677. doi: 10.1021/acs.iecr.9b01693.
- Taleb, M.F.; El-Mohdy, H.L.; El-Rehim, H.A. Radiation Preparation of PVA/CMC Copolymers and Their Application in Removal of Dyes. J. Hazard. Mater. 2009, 168, 68–75. doi: 10.1016/j.jhazmat.2009.02.001.
- Ibrahim, M.M.; Koschella, A.; Kadry, G.; Heinze, T. Evaluation of Cellulose and Carboxymethyl Cellulose/Poly(Vinyl Alcohol) Membranes. Carbohydr. Polym. 2013, 95, 414–420. doi:10.1016/j.carbpol.2013.03.012.
- Chahal, R.P.; Mahendia, S.; Tomar, A.K.; Kumar, S. ( Irradiated PVA/Ag Nanocomposite Films: Materials for Optical Applications. J. Alloys Compd. 2012, 538, 212–219. doi:10.1016/j.jallcom.2012.05.085.
- Hernley, P.A.; Chavez, S.A.; Quinn, J.P.; Linic, S. Engineering the Optical and Catalytic Properties of Co-Catalyst/Semiconductor Photocatalysts. ACS Photonics. 2017, 4, 979–85. doi: 10.1021/acsphotonics.7b00047.
- Hao, J.; Wang, X.; Liu, F.; Han, S.; Lian, J.; Jiang, Q. Facile Synthesis ZnS/ZnO/Ni(OH)2 Composites Grown on Ni Foam: A Bifunctional Materials for Photocatalysts and Supercapacitors. Sci Rep. 2017, 7, 3021. doi:10.1038/s41598-017-03200-2.
- Pal, A.; Srivastava, S.; Gupta, R.; Sapra, S. Electron Transfer from CdSe–ZnS Core–Shell Quantum Dots to Cobalt(iii) Complexes. Phys. Chem. Chem. Phys. 2013, 15, 15888. doi: 10.1039/C3CP51834E.
- Wang, G.; Huang, B.; Li, Z.; Lou, Z.; Wang, Z.; Dai, Y.; Whangbo, M. H. Synthesis and Characterization of ZnS with Controlled Amount of S Vacancies for Photocatalytic H2 Production Under Visible Light. Sci Rep. 2015, 5, 8544. doi:10.1038/srep08544.
- Nouh, S.A.; Alsobhi, B.O.; Abou Elfadl, A.; Massoud, A.M. Effect of Gamma Irradiation on the Structure,: Optical and Thermal Properties of PC–PBT/NiO Polymer Nanocomposites Films. J. Inorg. Organomet. Polym. 2017, 27, 1851. Doi: 10.1007/s10904-017-0650-5.
- Navakoteswara, R.V.; Ravi, P.; Sathish, M.; Lakshmana, R.N.; Lee, K.; Sakar, M.; Prathap, P.; Mamatha, K.M.; Raghava, R.K.; Nadagouda, M.N.; Aminabhavi, T.M.; Shankar, M.V. Monodispersed Core/Shell Nanospheres of ZnS/NiO with Enhanced H2 Generation and Quantum Efficiency at Versatile Photocatalytic Conditions. J. Hazard. Mater. 2021, 413, 125359. doi: 10.1016/j.jhazmat.2021.125359.
- Nouh, S.A.; Radwan, Y.E.; Elfiky, D.; Abutalib, M.M.; Bahareth, R.A.; Hegazy, T.M.; Fouad, S.S. Structure,: Thermal, Optical and Electrical Investigation of the Effect of Heavy Highly Energetic Ions Irradiations in Bayfol DPF 5023 Nuclear Track Detector. Radiat Phys Chem. 2014, 97, 68–74. doi: 10.1016/j.radphyschem.2013.10.017.
- Yamauchi, T.; Nakai, H.; Somaki, Y.; Oda, K. Formation of CO2 gas and OH Groups in CR-39 Plastics due to Gamma-ray and Ions Irradiation. Radiat. Meas. 2003, 36, 99–103. doi: 10.1016/S1350-4487(03)00102-1.
- Nouh, S.A.; Benthami, K. Gamma Induced Changes in the Structure and Optical Properties of ZnS/PVA Nanocomposite. J. Vinyl. Additive. Technol. 2019, 25, 271. doi: 10.1002/vnl.21689.
- Bakeer, D.; AlSomali, F.; Yajzey, R.; Benthami, K.; Nouh, S.A. Effect of Laser Radiation on the Linear and Nonlinear Optical Characteristics of Polyvinyl Alcohol/Carboxymethyl Cellulose/Nickel Oxide Nanocomposite Films. J. Macromol. Sci. Part B. Phys. 2023, 62, 718–737. doi:10.1080/00222348.2023.2245301.
- Lutterotti, L. Total Pattern Fitting for the Combined Size–Strain–Stress–Texture Determination in Thin Film Diffraction. Nucl. Instr. Methods B 2010, 268, 334–340. doi:10.1016/j.nimb.2009.09.053.
- El-Mesady, I.A.; Rammah, Y.S.; Abdalla, A.M.; Ghanim, E.H. Gamma Irradiation Effect Towards Photoluminescence and Optical Properties of Makrofol DE 6-2. Radiat. Phys. Chem. 2020, 168, 108578. doi:10.1016/j.radphyschem.2019.108578.
- Eisa, W.H.; Zayed, M.F.; Abdel-Moneam, Y.K.; Abou Zeid, A.M. Water-Soluble Gold/Polyaniline Core/Shell Nanocomposite: Synthesis and Characterization. Synth. Met. 2014, 195, 23–28. doi:10.1016/j.synthmet.2014.05.012.
- Alhazime, A.A.; Benthami, K.; Alsobhi, B.O.; Ali, G.W.; Nouh, S.A. Pani-Ag/PVA Nanocomposite: Gamma Induced Changes in the Thermal and Optical Characteristics. J. Vinyl Addit. Technol. 2021, 27, 47–53. doi: 10.1002/vnl.21782.
- Karthikeyan, B.; Hariharan, S.; Mangalaraja, R.V.; Pandiyarajan, T.; Udayabhaskar, R.; Sreekanth, B. Studies on NiO-PVA Composite Films for Opto-Electronics and Optical Limiters. IEEE Photon. Technol. Lett. 2018, 30, 1539–1542. doi: 10.1109/LPT.2018.2859042.
- Gupta, S.K.; Singh, P.; Kumar, R.; Kumar, S. Gamma Radiation Induced Modification on Physicochemical Properties of Makrofol (kG and N) Polycarbonate. Adv. Polym. Technol. 2015, 34, 21510. doi: 10.1002/adv.21510.
- Seoudi, R.; Shabaka, A.A.; Kamal, M.; Abdelrazek, E.M.; Eisa, W.H. Dependence of Structural,: Vibrational Spectroscopy and Optical Properties on the Particle Sizes of CdS/Polyaniline Core/Shell Nanocomposites. J. Mol. Struct. 2012, 1013, 156–162. doi: 10.1016/j.molstruc.2012.01.016.
- Nouh, S.A.; Abou Elfadl, A.; Benthami, K.; Alhazime, A.A. Structural and Optical Characteristics of Laser Irradiated CdSe/PVA Nanocomposites. Int. Polym. Proc. 2019, 34, 255–261. doi: 10.3139/217.3729.
- Rakhshani, A.E. Study of Urbach Tail,: Bandgap Energy and Grain-Boundary Characteristics in CdS by Modulated Photocurrent Spectroscopy. J. Phys. Condens. Matter. 2000, 12, 4391–4400. doi:10.1088/0953-8984/12/19/309.
- Urbach, F. The Long-Wavelength Edge of Photographic Sensitivity and of the Electronic Absorption of Solids. Phys. Rev. 1953, 92, 1324–1324.
- Wahab, L.A.; Zayed, H.A.; Abd El-Galil, A.A. Study of Structural and Optical Properties of Cd1- XZnxSe Thin Films. Thin Solid Films 2012, 520, 5195–5199. doi:10.1016/j.tsf.2012.03.119.
- Prasher, S.; Kumar, M.; Singh, S. Electrical and Optical Properties of O6+Ion Beam–Irradiated Polymers. Int. J. Polym. Anal. Charact. 2014, 19, 204–211. doi:10.1080/1023666X.2014.879418.
- Tauc, J. Optical Properties of Amorphous Semiconductors. In Amorphous and Liquid Semiconductors. J. Tauc, Ed.; Plenum Press: London, New York, 1974; p. 159. doi: 10.1002/vnl.21689
- Dongol, M.; El-Denglawey, A.; Abd El Sadek, M.S.; Yahia I.S., Thermal Annealing Effect on the Structural and the Optical Propertiesof Nano CdTe Films. Optik 2015, 126, 1352–1357. doi:10.1016/j.ijleo.2015.04.048
- Aziz, S.B.; Abdullah, O.G.; Hussein, A.M.; Ahmed, H.M. From Insulating PMMA Polymer to Conjugated Double Bond Behavior: Green Chemistry as a Novel Approach to Fabricate Small Band Gap Polymers. Polymers 2017, 9, 626. doi:10.3390/polym9110626.
- Palija, T.; Dobi, J.; Jai, M. A Photochemical Method for Improvement of Color Stability at Polymer–Wood Biointerfaces. Colloids Surf., B 2013, 108, 152–157. doi:10.1016/j.colsurfb.2013.02.045.
- Aziz, S.B.; Dannoun, E.M.A.; Tahir, D.A.; Hussen, S.A.; Abdulwahid, R.T.; Nofal, M.M.; Abdullah, R.M.; Hussein, A.M.; Brevik, I. Synthesis of PVA/CeO2 Based Nanocomposites with Tuned Refractive Index and Reduced Absorption Edge: Structural and Optical Studies. Materials 2021, 14, 1570. doi: 10.3390/ma14061570.
- Brza, M.A.; Aziz, S.B.; Anuar, H.; Al Hazza, M.H. From Green Remediation to Polymer Hybrid Fabrication with Improved Optical Band Gaps. IJMS 2019, 20, 3910. doi: 10.3390/ijms20163910.
- Soylu, M.; Al-Ghamdi, A.A.; Yakuphanoglu, F. Transparent CdO/n-GaN(0001) Heterojunction for Optoelectronic Applications. J. Phys. Chem. Solids 2015, 85, 26–33. DOI: 10.1016/j.jpcs.2015.04.015.
- Bhavsar, V.; Tripathi, D. Study of Refractive Index Dispersion and Optical Conductivity of PPy Doped PVC Films. Indian J. Pure Appl. Phys. 2016, 54, 105.
- Shams-Eldin, M.A.; Wochnowski, C.; Koerdt, M.; Metev, S.; Hamza, A.A.; Juptner, W. Characterization of the Optical-Functional Properties of a Waveguide Written by an UV-Laser Into a Planar Polymer Chip. Opt. Mater. 2005, 27, 1138–1148. doi:10.1016/j.optmat.2004.09.019.
- Ranby, B.; Rebek, J. Photodegradation, Photooxidation and Photostabilization of Polymers: Principles and Applications; J.F. Rabek ed; Wiley: London, 1996
- Mudila, H.; Prasher, P.; Kumar, A.; Zaidi, M.G.H.; Verma, A. Effect of Temperature on the Polymerization and Optical Conductivity of Thin Flexible Polypyrrole/Starch Composites. J. Phys.: Conf. Ser. 2019, 1531, 012105. doi: 10.1088/1742-6596/1531/1/012105.
- Ismail, A.M.; Mohammed, M.I.; El-Metwally, E.G. Influence of Gamma Irradiation on the Structural and Optical Characteristics of Li ion-Doped PVA/PVP Solid Polymer Electrolytes. Indian J. Phys. 2019, 93, 175–183. doi:10.1007/s12648-018-1286-1.
- Wemple, S.H.; DiDomenico, M. Optical Dispersion and the Structure of Solids. Phys. Rev. Lett. 1969, 23, 1156−1160. doi:10.1103/PhysRevLett.23.1156
- Wemple, S.H.; DiDomenico, M. Behavior of the Electronic Dielectric Constant in Covalent and Ionic Materials. Phy. Rev. 1971, 3, 1338–1350. doi:10.1103/PhysRevB.3.1338.
- Timoumi, A.; Bouzouita, H.; Rezig, B. Characterisation and Wemple Didomenico Model of Indium Sulphide Thin Layers for Photovoltaic Applications. Aust. J. Basic Appl. Sci. 2013, 7, 448–456.
- Mahmoud, S.A.; Alshomer, S.; Tarawnh, M.A. Structural and Optical Dispersion Characterisation of Sprayed Nickel Oxide Thin Films. J. Modern Phys. 2011, 2, 1178−1186. DOI: 10.4236/jmp.2011.210147
- Yous, B.; Berger, J. M.; Ferraton, J. P.; Donnadieu, A. Gap optique et indice de réfraction du silicium amorphe préparé par “Chemical Vapour Deposition” Entre 95 K et 673 K. Thin Solid Films. 1981, 82, 279–285. doi:10.1016/0040-6090(81)90195-4
- Zhou, P.; You, G.; Li, J.; Wang, S.; Qian, S.; Chen, L. Annealing Effect of Linear and Nonlinear Optical Properties of Ag:Bi2O3 Nanocomposite Films, Opt. Express. 2005, 13, 1508-1514. https://doi.org/10.1364/OPEX.13.001508
- Tamgadge, Y.S.; Sunatkari, A.L.; Talwatkar, S.S.; Pahurkar, V.G.; Muley, G.G. Linear and Nonlinear Optical Properties of Nanostructured Zn(1−x)SrxO–PVA Composite Thin Films. Opt. Mater. 2014, 37, 42–50. doi:10.1016/j.optmat.2014.04.036.
- Sunatkari, A.L.; Talwatkar, S.S.; Tamgadge, Y.S.; Muley, G.G. Surfactant-Dependant Thermally Induced Nonlinear Optical Properties of L-Ascorbic Acid-Stabilized Colloidal GNPs and GNP–PVP Thin Films. RSC Adv. 2019, 9, 15502–15512. DOI:10.1039/C9RA01598A.
- Sunatkari, A.L.; Talwatkar, S.S.; Tamgadge, Y.S.; Muley, G.G. Comprehensive Study of -Alanine Passivated Colloidal Gold Nanoparticles and GNP-PVP Thin Films: Linear Optical Properties and Very Large Nonlinear Refractive Index, Absorption Coefficient,: Third-Order Nonlinear Susceptibility Measurements and Effect of Passivation. Opt. Mater. 2021, 121, 111458. doi:10.1016/j.optmat.2021.111458.
- Nassau, K. Color for Science, Art and Technology; Elsevier: New York, 1998.
- Nouh, S.A.; Gaballah, N.; Abou Elfadl, A.; Alsharif, S.A. Modification Induced by Proton Irradiation in Bayfol UV1 7-2 Nuclear Track Detector. Radiat. Prot. Dosim. 2019, 183, 450–459. doi:10.1093/rpd/ncy165.