
Abstract
Graphene nanoplatelets/polydimethylsiloxane (GNPs/PDMS) nanocomposites foils are obtained by dispersing nanoplatelets of graphene (GNPs) into polydimethylsiloxane (PDMS) at a given GNPs concentration but at different curing times to study the effects of curing time on some their bulk and surface properties. Their appearance and morphology have been examined by optical and scanning electron microscopies, their wettability and roughness by the sessile drop method and profilometry, their bonds by µRaman and ATR-FTIR spectroscopies, their dielectric response by dielectric spectroscopy. In particular, optical and SEM images and roughness measurements indicate a roughened and hydrophobic surface at the shortest curing time that becomes less roughened, more uniform and less hydrophobic as curing time increases. ATR-FTIR and µRaman spectra reveal the absence of chemical interaction between GNPs and PDMS. The behavior of the PDMS real and imaginary parts of dielectric permittivity without and with GNPs and at increasing curing times seems to define the obtained GNPs/PDMS nanocomposites as low-loss materials. The obtained results show that the curing time significantly affects the filler distribution in the PDMS matrix and consequently the properties of the final nanocomposites.
1. Introduction
In recent years, nanotechnology is increasingly used to develop new materials with improved multifunctionalities. In this regard, nanofiller-based polymeric composites, thanks to their simple processing, good mechanical flexibility, low cost and good compatibility, are gaining great attention to realize, for example, wearable sensors or thermal heaters or high permittivity nanomaterials with low loss or for electromagnetic interference shielding (Citation1–8).
Among the nanofillers, graphene nanoplatelets (GNPs) are ideal filler for polymer matrices to obtain multifunctional flexible nanocomposites thanks to their mechanical, thermal and electrical properties combined with their extremely high aspect ratio with planar shape (Citation9). They are considered an alternative to graphene, a single graphite monolayer thick one atom (0.34 nm) but with lateral size several orders of magnitude larger, because of their low cost, easy manufacture, and potential for large-scale production. GNPs are light weight and are stacked graphene monolayers bonded to each other by weak van der Waals forces. The graphene layers vary in thickness from few to several dozens of nanometers, while their diameters can reach the micrometer scale. These structural features justify their high specific surface area, ideal, when a good GNPs dispersion is reached, to reinforce polymers with amounts much smaller than those required by other 2D fillers (Citation10). GNPs can be produced from crystalline graphite by acid intercalation (Citation11), intercalation-exfoliation (Citation12), liquid phase exfoliation (Citation13), microwave-assisted exfoliation (Citation14), ball milling (Citation15) methods. To produce GNPs in bulk amounts for commercial application another technique is plasma exfoliation that can shape and functionalize GNPs according to the need of surface manipulation (Citation16). Their application is various as they may be added to solids, semi-liquids or greases, and also liquids (Citation9).
Among the polymeric matrices, polydimethylsiloxane (PDMS) is attractive for its high flexibility, biocompatibility, chemical inertia, permeability to gases, good thermal stability, optically transparency, hydrophobic nature, low price, fast curing cycles which make this silicon-based, cross-linkable and flexible polymer very useful for applications in different fields (Citation17–21): micro-electromechanical systems (MEMSs), micro optical and microfluidic devices, biosensors, biochips or micro stamps and antifouling coatings can be realized with it.
Combining the exceptional mechanical strength and the good thermal and electrical conductivities of GNPs with the flexibility of PDMS it is possible to obtain multifunctional materials which can be widely used as biocompatible materials with enhanced mechanical and thermal behavior or to realize wearable devices, such as for example wearable sensors for human motion monitoring or new electronic or energy harvesting devices. But the addition of GNPs in PDMS not only can enhance its mechanical, thermal, electrical properties but also, by creating tortuous paths for the water molecules depending on the GNPs geometry, thickness and lateral size, it can further reduce PDMS ability to absorb water increasing its resistance to aggressive humid environments (Citation9). All this makes unlimited the applications of these nanocomposites.
Since GNPS tend to clump together and agglomerate it is important in the production of the GNPs/PDMS nanocomposites to find the correct parameters in terms of concentration, curing time and temperature. In particular, at the same concentration and temperature, the curing time could influence the properties of GNPs/PDMS nanocomposites. This is precisely the goal of this study: to understand the influence of curing time on some bulk and surface properties of these nanocomposites. To reach this, different techniques, such as optical and electronic microscopies, profilometry, the contact angle sessile drop method, ATR-FTIR and µRaman spectroscopies have been used.
Since it has been demonstrated that the electric permittivity can actually be significantly increased in electrically heterogeneous systems consisting of conducting particles embedded in insulating polymer matrices (Citation22), we have also utilized the dielectric spectroscopy to investigate how the PDMS dielectric permittivity changes in presence of GNPs and also how the GNPs/PDMS dielectric permittivity changes as curing time increases.
2. Materials and methods
2.1. GNPs/PDMS nanocomposite foil preparation
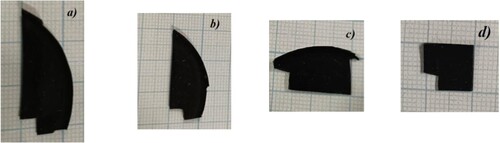
The production of GNPs/PDMS nanocomposite foils followed three steps, as shown in Figure : (1) dispersion of GNPs into the PDMS matrix, (2) degassing to remove the entrapped air, and (3) curing. More specifically in a beaker 0.9 g of the graphene nanoplatelet dispersion in water (5%wt) by ACS Materials was added to 8 g of the PDMS monomer (the base of Sylgard 184 Silicone Elastomer kit by Dow Corning) and then mixed by a stirrer for 5 min at room temperature to obtain a homogeneous mixture. Subsequently, 0.8 g of curing agent (the cross-linker of Sylgard 184 Silicone Elastomer kit) was added to the mixture (respecting the Dow Corning suggested ratio of 10:1 between base and curing agent), mixed at room temperature and kept under vacuum for 3 hours to reduce the air bubbles formation. When the curing agent chemically reacts with the PDMS base gives rise to the crosslinking of the polymer chains, so a higher weight percentage of curing agent increases the crosslinking concentration and therefore affect the PDMS properties (mechanical, crystallinity, …) and biocompatibility. Finally, the so-obtained mixture was poured into a Petri dish and baked, to accelerate the polymerization, in an oven at 100 °C for four different curing time values: 15 min, 30 min, 45 min and 1 h. In this way, as shown in the photos of Figure , four different types of GNPs/PDMS nanocomposite foils, 1 mm thick, were manufactured after having removed them from the Petri dish with the help of tweezers. Each of four chosen curing time values differs from the next by 15 minutes because smaller intervals did not give rise to remarkable variation in curing.
Figure 1. Experimental set up for the GNPs/PDMS nanocomposite foil manufacturing.
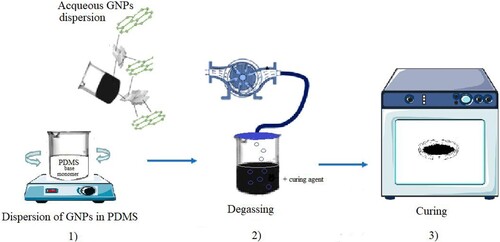
Figure 2. Photo of GNPs/PDMS nanocomposite foils obtained for curing times of a) 15 min, b) 30 min, c) 45 min and d) 60 min.
2.2. Structural characterization
The so-obtained GNPs/PDMS nanocomposite foils were characterized by using the following techniques:
Optical microscopy: an Olympus optical microscope equipped with a 10X objective and a white lamp has been used to better observe the surface of the obtained GNPs/PDMS nanocomposite foils.
SEM: an environmental FEI Quanta FEG scanning electron microscope (SEM) has allowed us to study the morphology of the used GNPs water dispersion and of the obtained GNPs/PDMS nanocomposite foils with 5–10 keV electron beams. The GNPs/PDMS nanocomposite foils were coated by sputtering a thin layer of chromium to prevent the accumulation of charge on their surface and in this way ensuring a proper microstructural observation.
Profilometry: A Tencor P10-Surface Profiler was used to analyze the maximum roughness (peak-to-peak) of the GNPs/PDMS nanocomposite foils at a scan speed of 10 µm/s and a sampling rate of 50 Hz on a scan length of 500 µm.
Surface wettability measurements: the contact angle sessile drop method using an optical microscope and a micrometric syringe was employed to pour a 3 µl droplet of deionized water on the sample surface and to measure the contact angle.
µRaman spectroscopy: an iHR550 Horiba spectrometer, equipped with a 473 nm laser operating at the 0.08 mW/mm2 power, a 600 l/mm grating and an Olympus optical microscope working with a 100X objective (NA = 0.9) allowed us to capture in air Raman spectra in the (400–3500) cm-1 wavenumber range with an integration time of 30 s and 2 accumulations.
FTIR spectroscopy: a Fourier transmission infrared (FTIR) spectrometer, Jasco Mod. 4600 equipped with an ATR (Attenuated Total Reflectance) accessory was used to investigate the chemical structure of PDMS foils in presence of GNPs. The investigated wavenumber interval ranged from 4000 to 450 cm-1.
Dielectric spectroscopy: an Agilent 4284A precision LCR meter connected to a computer by an IEEE 488 interface was used to investigate the sample dielectric response using the 4-terminal pair measurement configuration. The samples were sandwiched between two symmetric stainless-steel electrodes of the Keysight 16451B dielectric material text fixture. The applied peak-to peak voltage was 2 V. The guarded electrode had an area of about 19.64 mm2.
3. Results and discussion
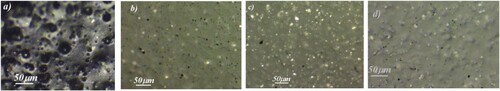
Figure shows how the obtained samples appear when observed with an optical microscope equipped with a 10X objective. Only the GNPs/PDMS nanocomposite foil obtained for a curing time of 15 min (Figure a) presents a roughened surface with entrapped air or eventually developed gases and remaining water, characterized by the presence of bubbles and pores/voids. The bubbles are due to the presence of non-evaporated water, gases (CO2) or air, while pores /voids are left by the water evaporation. In fact, as reported in the literature (Citation23), the graphene fillers tend to hinder the evaporation of solvents developed during the crosslinking reactions generating porosity. The surface of the GNPs/PDMS nanocomposite foils becomes more uniform on increasing curing time (see Figure b–d). This different behavior can be ascribed to a very fast evaporation of water and gas in the early times of curing. On increasing the curing time at 100°C, the presence of GNPs hinders porosity giving rise to a more uniform surface.
Figure 3. Optical images of GNPs/PDMS nanocomposite foils obtained for curing times of a) 15 min, b) 30 min, c) 45 min and d) 60 min.
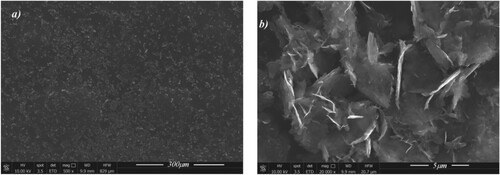
This change of morphology with increasing curing time is also confirmed by the SEM images shown in Figure a–d in which one can see that pores reduce in number (see Figure e) but not in size (see Figure f) as curing time increases, while bubbles decrease both in surface density (see Figure e) and size (see Figure f). These measurements have been performed on an average surface of 270 µm2. Moreover, the SEM images also indicate that polymer matrix sticks very well to the nanofiller flakes and penetrates them without disrupting the inter-layer van der Waals forces and consequently causing no graphene platelet delamination. In this way it is possible to observe some aggregates of graphene (see Figure c) together with few-layers with lateral sizes in agreement with the observable ones in Figure b, in which GNPs are clearly visible with lateral sizes around 5 µm or less and thickness of the order of the nanometers. The SEM images of Figure , captured at different magnification, are relative to the GNPs film obtained from the deposition of a drop of the used GNPs water dispersion onto a glass and then transferred on a SEM stub. These images reveal that the graphene platelets form agglomerates of diverse sizes and irregular shapes with a developed surface and the edges of carbon layers often rolled up. Therefore, the used fillers show a complex nature which is neither graphite nor graphene in the strict sense of the term.
Figure 4. a–d: SEM images of GNPs/PDMS nanocomposite foils obtained for curing times of a) 15 min, b) 30 min, c) 45 min and d) 60 min at 20000X; e) bubble and pore surface density as a function of curing time; f) bubble and pore size as a function of curing time.
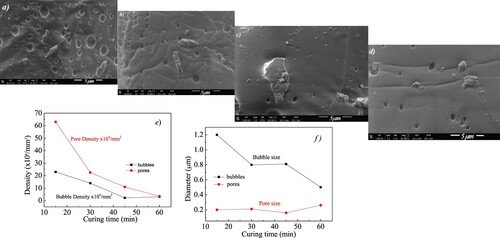
Figure 5. SEM images of GNPs film at 500X (a) and 20000X (b) magnifications.
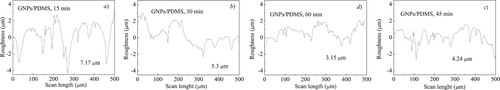
Roughness data, displayed in Figure , confirm what has been said so far, indicating a peak-to-peak roughness that decreases from 7.17 µm to 3.15 µm as curing time increases from 15 min to 60 min.
Figure 6. Roughness spectra for GNPs/PDMS nanocomposite foils obtained for curing times of a) 15 min, b) 30 min, c) 45 min and d) 60 min. In each spectrum the maximum roughness (peak-to-peak) value is also indicated.
Wettability optical images captured for GNPs/PDMS nanocomposite foils, obtained for curing times of a) 15 min, b) 30 min, c) 45 min and d) 60 min, when a water droplet is on their surface are shown in Figure . The so-deduced water sessile drop contact angle (WCA) values are plotted as a function of curing time in Figure . Each point is the average of three measurements recorded on the same day. The data show no significant variation as a function of time, indicating that accumulation of dust or other hydrocarbon contaminants does not affect the observed WCA. As the curing time increases, WCA decreases suggesting that the GNPs/PDMS nanocomposite foil obtained for the longest curing time (60 min) is less hydrophobic. Considering that more roughness translates in more available surface, being both PDMS and GNPs hydrophobic (Citation24, Citation25) justify why the GNPs/PDMS nanocomposite foil relative to the shortest curing time (15 min) is more hydrophobic.
Figure 7. Wettability optical images captured with an optical microscope equipped with a 30X objective for GNPs/PDMS nanocomposite foils obtained for curing times of a) 15 min, b) 30 min, c) 45 min and d) 60 min.
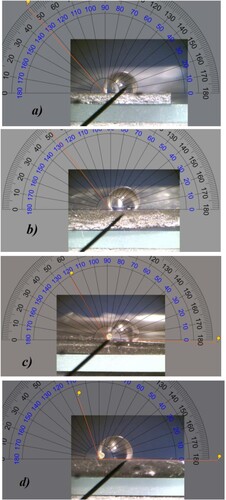
Figure 8. Water contact angle value as a function of curing time for the investigated GNPs/PDMS nanocomposite foils.
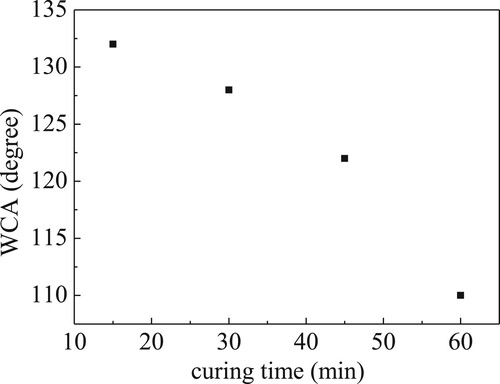
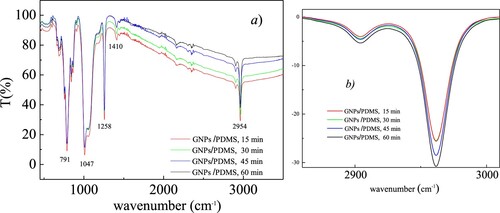
Figure shows the comparison between the ATR-FTIR spectra for the analyzed GNPs/PDMS nanocomposite foils in terms of IR transmittance vs the wavenumber. At first glance no remarkable differences among the different spectra are observed for the different curing times revealing the absence of chemical interaction between GNPs and PDMS. As one can see in Figure a, the collected ATR-FTIR spectra showed strong double or single peaks at around 2954 and 1047 cm−1, corresponding respectively to the stretching vibrations of CH3 and Si−O−Si groups, around 1258 cm−1 corresponding to the in-plane bending of CH3 group, around 1410 cm−1 relative to the CH3 asymmetric bending, around 791 cm−1 that can be identified as the Si−C stretching vibrations and the rocking modes of CH3 group in agreement with the literature (Citation26–28). Only the weak, continuous and broad structure that extends from 2500 to 3300 cm-1, due to the O-H stretching, and on which the double peak around 2954 cm-1 rises appears to slightly decrease in intensity indicating a gradual removal of residual water on increasing curing time, confirmed by the observed increase of infrared transmittance in this spectral region. Looking more in details at the double peak around 2954 cm-1, as shown in Figure b, as curing time rises, a very small increase in the intensity of its two components can be observed indicating an increase on its IR absorbance probably due to an increase on cross-linking as curing time grows.
Figure 9. (a) ATR-FTIR spectra comparison for the investigated GNPs/PDMS nanocomposite foils; (b) a zoom of the double peak around 2954 cm-1 after having subtracted the large background due to the O-H stretching.
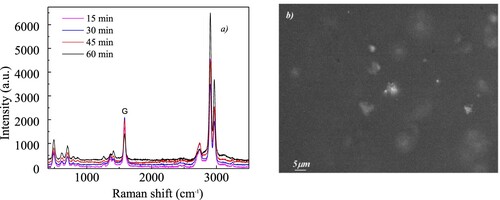
To reveal possible structural modification µRaman spectra were acquired, and Figure a shows the comparison between the obtained spectra. The samples’ tested areas by the Raman technique were those that displayed glittering clusters as shown as example in Figure b for the GNPs/PDMS nanocomposite foil cured for 15 min.
Figure 10. (a) µRaman spectra comparison for the investigated GNPs/PDMS nanocomposite foils; b) the optical image of the tested point in the GNPs/PDMS nanocomposite foil cured for 15 min.
In all the investigated samples, the Raman spectrum depicts the presence of the major peaks corresponding to PDMS and GNPs indicating that no chemical interaction occurred between PDMS and GNPs, in agreement with ATR-FTIR data. In particular, as one can see in Figure , for the GNPs/PDMS nanocomposite foil cured for 15 min, the PDMS modes can be observed, in agreement with the
Figure 11. µRaman spectrum for the GNPs/PDMS nanocomposite foil cured for 15 min.
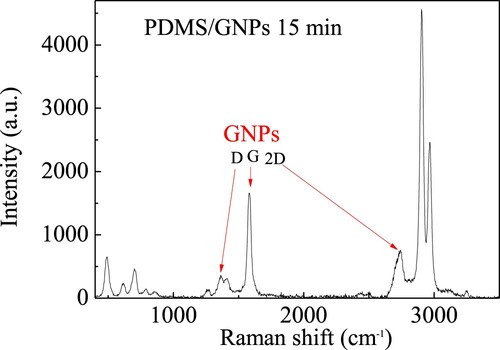
literature (Citation27), at the following wavenumbers (in cm−1): 493 - the Si–O–Si stretching vibration, 703 - the Si–C stretching vibration, 1266, 1411 - the CH3 symmetric and asymmetric bending vibration, 2906, 2967 - the CH3 stretching vibration. Other weaker features at about 617, 789 and 861 cm−1 are visible due to the CH3 rocking modes. As regards the GNPs modes, indicated with red arrows, they were observed at the following wavenumbers (in cm−1): 1360 - assigned as D mode, the breathing vibration A1g of aromatic ring, 1585 - labelled as G mode, the stretching vibration E2g of sp2 carbon pairs, 2741 – indicated as 2D mode, the overtone of D mode. The presence of the D band, associated with the defect density in graphene, can be assigned to the structural disorder of few-layers GNPs.
Figure show the trend observed for the real ε1 (a) and imaginary ε2 (b) components of dielectric permittivity of the investigated GNPs/PDMS nanocomposite foils as a function of curing time at frequencies from 1 kHz to 10 MHz. As regards the permittivity real part ε1 (Figure a), if we compare the dielectric response of PDMS foil (grey empty circles) with that of the GNPs/PDMS nanocomposite foil cured for 15 min (black empty circles), we can note that ε1 is independent from frequency, as it is in the virgin PDMS, but its value slightly increases from about 1.46 to about 1.63. This increase could be due to the formation of small domains in which those GNPs that do not show bending and folding and are arranged in parallel with each other can align giving rise to local micro-capacitors with the GNPs as electrodes and a very thin PDMS layer in between as dielectric. These micro-capacitors with different characteristic sizes enhance the local internal field around GNPs surfaces and consequently the permittivity of the obtained nanocomposite. Increasing curing time at 100°C seems to favor these micro capacitors formation thus rising further the ε1 value at about 1.74 for 30min, 1.80 for 45 min and 2.04 for 60 min.
Figure 12. Comparison of the real ε1 (a) and imaginary ε2 (b) parts of dielectric permittivity for the investigated GNPs/PDMS nanocomposite foils.
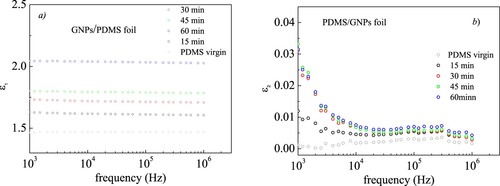
The ε2 behavior as a function of frequency observed for the virgin PDMS (Figure b - grey full circles), together with that noted for ε1 (Figure a - grey empty circles), classifies the virgin PDMS as a good insulator with very small losses. When GNPs are embedded in PDMS a small increase from about 0.001 to 0.012 in ε2 is observed around 1000 Hz for the 15 min curing time. On increasing curing time to 30 min the ε2 value slightly rises around 0.03 remaining almost constant with curing time within the experimental error (about 10% of experimental value). However, at each investigated curing time, ε2 tends to zero as the frequency increases. This could be due to the size of the involved charges.
4. Conclusions
In this paper we have produced some GNPs/PDMS nanocomposite foils at the same GNPs content but at different curing time to analyze the effects of curing time on their look, morphology, wettability, roughness, structure and bonding. The behavior of permittivity as a function of curing time is also investigated for application purposes. The results demonstrate that GNPs are an effective nano additive for enhancing the PDMS permittivity real part without introducing remarkable losses.
Analyzing the GNPs/PDMS nanocomposite foils ATR- FTIR spectra, the PDMS IR main characteristic features are visible without no significant change for the different curing times revealing the absence of chemical interaction between GNPs and PDMS.
The lack of chemical interaction between PDMS and GNPs is also confirmed by Raman spectra that show the major peaks of PDMS and GNPs. A structural disorder of few-layers GNPs within PDMS is indicated by the presence of the D band.
With respect to the roughness and wettability measurements, on increasing curing time the GNPs/PDMS nanocomposite foils become less roughened and less hydrophobic. This change of morphology with increasing curing time is also confirmed by the optical and SEM images. As curing time increases pores reduce in number and in size, PDMS sticks very well to GNPs and penetrates them without causing graphene platelet delamination.
The effect of the curing time on the GNPs/PDMS dielectric response is to increase the real ε1 part of permittivity keeping the imaginary ε2 part to very small values. If compared to virgin PDMS foil, this seems to indicate that we should use much longer curing times if we want to obtain low-loss materials characterized by higher values of ε1. This could provide a direction for fabrication of high permittivity nanocomposites with low loss. Therefore, further investigations are in progress first at higher curing times and then at greater GNPs concentrations.
Disclosure statement
No potential conflict of interest was reported by the author(s).
Additional information
Funding
References
- Zheng, Q.; Lee, J.; Shen, X.; Chen, X.; Kim, J. Graphene-based Wearable Piezoresistive Physical Sensors, Mater. Today 2020, 36, 158–179.
- Amjadi, M.; Kyung, K.; Park, I.; Sitti, M. Stretchable, Skin-Mountable, and Wearable Strain Sensors and Their Potential Applications: A Review. Adv. Funct. Mater. 2016, 26, 1678−1698.
- Niu, S.; Chang, X.; Zhu, Z.; Qin, Z.; Li, J.; Jiang, Y.; Wang, D.;Yang, C.; Gao, Y.; Sun, S. Low-Temperature Wearable Strain Sensor Based on a Silver Nanowires/Graphene Composite with a Near-Zero Temperature Coefficient of Resistance. ACS Appl. Mat. Interf. 2021, 13, 55307−55318.
- Tung, T.T.; Nine, M.J.; Krebsz, M.; Pasinszki, T.; Coghlan, C.J.; Tran, D.N.H.; Losic, D. Recent Advances in Sensing Applications of Graphene Assemblies and Their Composites. Adv. Funct. Mater. 2017, 27, 1702891.
- Zhang, D.; Xu, S.; Zhao, X.; Qian, W.; Bowen, C.R.; Yang, Y. Wireless Monitoring of Small Strains in Intelligent Robots via a Joule Heating Effect in Stretchable Graphene–Polymer Nanocomposites. Adv. Funct. Mater. 2020, 30, 1910809.
- Ning, W.; Wang, Z.; Liu, P.; Zhou, D.; Yang, S.; Wang, J.; Li, Q.; Fan, S.; Jiang, K., Multifunctional super-aligned carbon nanotube/ polyimide composite film heaters and actuators. Carbon 2018, 139, 1136–1143.
- Dang, Z. M.; Yuan, J. K., Yao, S. H., Liao, R. J. Flexible Nanodielectric Materials with High Permittivity for Power Energy Storage. Adv. Funct. Mater. 2013, 25 (44), 6334–6365.
- Zhao, B.; Zhao, C.; Li, R.; Hamidinejad, S.M.; Park, C.B. Flexible, Ultrathin, and High-Efficiency Electromagnetic Shielding Properties of Poly (Vinylidene Fluoride)/Carbon Composite Films. ACS Appl. Mater. Interfaces 2017, 9, 20873−20884.
- Jiménez-Suárez, A.; Prolongo, S.G. Graphene Nanoplatelets. Appl. Sci. 2020, 10 (5), 1753. DOI:10.3390/app10051753
- Zotti, A.; Zuppolini, S.; Borriello, A.; Zarrelli, M. Polymer Nanocomposites Based on Graphite Nanoplatelets and Amphiphilic Graphene Platelets. Compos. B Eng. 2022, 246, 110223.
- Truong, Q.T.; Pokharel, P.; Song, G.S.; Lee, D.S. Preparation and Characterization of Graphene Nanoplatelets from Natural Graphite via Intercalation and Exfoliation with Tetraalkylammoniumbromide. J. Nanosci. Nanotechnol. 2012, 12 (5), 4305–430
- Kumar, D.; Singh, K.; Verma, V.; Bhatti, H.S. Synthesis and Characterization of Pristine and Functionalized Graphene Nanoplatelets. Adv. Sci. Eng. Med. 2014, 6 (11), 1143–1151.
- Wolf, E. L. Applications of graphene. Springer Briefs Mater. 2014, 19–38. DOI:10.1007/978-3-319-03946-6_2
- Kumar, D.; Singh, K.; Verma, V.; Bhatti, H.S., Microwave Assisted Synthesis and Characterization of Graphene Nanoplatelets. Appl. Nanosci. 2016, 6, 97–103.
- Jeon, I.Y.; Choi, H.J.; Jung, S.M.; Seo, J.M.; Kim, M.J.; Dai, L.; Baek, J.B. Large-scale Production of Edge-Selectively Functionalized Graphene Nanoplatelets via Ball Milling and Their use as Metal-Free Electrocatalysts for Oxygen Reduction Reaction. J. Am. Chem. Soc. 2013, 135 (4), 1386–1393.
- Tiwari, S.K.; Sahoo, S.; Wang, N.; Huczko, A. Graphene Research and Their Outputs: Status and Prospect. J. Sci. Adv. Mater. Dev. 2020, 5 (1), 10–29.
- Sanchez-Romate, X.X.F.; del Bosque Garcia, A.; Sanchez, M.; Urenña, A. Electrical Transport Mechanisms in Graphene Nanoplatelet Doped Polydimethylsiloxane and Application to Ultrasensitive Temperature Sensors. ACS Appl. Mater. Interf. 2023, 15 (18), 22377−22394
- He, S.; Zhang, Y.; Gao, J.; Nag, A.; Rahaman, A. Integration of Different Graphene Nanostructures with PDMS to Form Wearable Sensors. Nanomaterials 2022, 12 (6), 950.
- Huszank, R.; Szikra, D.; Simon, A.; Szilasi, S.Z.; Nagy, I.P. 4He+ Ion Beam Irradiation Induced Modification of Poly(Dimethylsiloxane), Characterization by Infrared Spectroscopy and Ion Beam Analytical Techniques. Langmuir 2011, 27, 3842–3848.
- Cutroneo, M.; Havrànek, V.; Mackovà, A.; Malinský, P.; Silipigni, L.; Slepička, P.; Fajstavr, D.; Torrisi, L. Synthesis of Porous Polydimethylsiloxane Gold Nanoparticles Composites by a Single Step Laser Ablation Process. Int. J. Mol. Sci. 2021, 22, 12155.
- Cutroneo, M.; Havrànek, V.; Semiàn, V.; Torrisi, A.; Mackovà, A.; Malinský, P.; Silipigni, L.; Slepička, P.; Fajstavr, D.; Torrisi, L. Porous Polydimethylsiloxane Filled with Graphene-Based Material for Biomedicine. J. Porous Mater. 2021, 28 (5), 1481–1491.
- Yuan, J.; Luna, A.; Neri, W.; Zakri, C.; Colin, A.; Poulin, P., Giant Electrostriction of Soft Nanocomposites Based on Liquid Crystalline Graphene. ACS Nano 2018, 12 (2), 1688−1695.
- Piscitelli, F.; Rollo, G.; Scherillo, F.; Lavorgna, M. Innovative Graphene-PDMS Sensors for Aerospace Applications. Adv. Mater. Lett. 2019, 10 (8), 533–538.
- Jin, M.; Feng, X.; Xi, J.; Zhai, J.; Cho, K.; Feng, L.; Jiang, L. Super-Hydrophobic PDMS Surface with Ultra-Low Adhesive Force. Macromol. Rapid Commun. 2005, 26, 1805–1809.
- Leenaerts, O.; Partoens, B.; Peeters, F. Water on Graphene: Hydrophobicity and Dipole Moment Using Density Functional Theory. Phys. Rev. B 2009, 79, 235440.
- Mohan, V.; Mariappan, V.K.; Pazhamalai, P.; Krishnamoorthy, K.; Kim, S.-J. Unravelling the Impact of Carbon Allotropes in Flexible Polydimethylsiloxane Film Towards Self-Powered Triboelectric Humidity Sensor. Carbon 2023, 205, 328–335.
- Torrisi, L.; Cutroneo, M.; Torrisi, A.; Di Marco, G.; Fazio, B.; Silipigni, L. IR ns Pulsed Laser Irradiation of Polydimethylsiloxane in Vacuum. Vacuum 2020, 177, 109361.
- Bistricic, L.; Borjanovic, V.; Mikac, L.; Dananic, V. Vibrational Spectroscopic Study of Poly(Dimethylsiloxane)-ZnO Nanocomposites. Vib. Spectrosc. 2013, 68, 1–10.