
 ?Mathematical formulae have been encoded as MathML and are displayed in this HTML version using MathJax in order to improve their display. Uncheck the box to turn MathJax off. This feature requires Javascript. Click on a formula to zoom.
Abstract
Makrolon/Pocan is a polymer blend of amorphous polycarbonate (PC) and semicrystalline polybutylene terephthalate (PBT). We fabricate a nanocomposite (NC) of PC/PBT polymer blend, Zinc sulfide (ZnS) and Nickel oxide (NiO) nanoparticles by the sol–gel and ex-situ casting processes. We trust that this study is novel in the area of the impact of γ radiation on this NC. The Rietveld modification of XRD records indicates that both the prepared ZnS and NiO have a nano-nature of an average particle size of 4 and 18 nm, respectively. Samples of the PC-PBT/ZnS-NiO NC films are irradiated with several γ doses (10 − 100 kGy). We investigate the resulting outcome of the γ irradiation on the linear and non linear optical behavior of the NC films, using ultraviolet spectroscopy (UVs) and the International Commission on Illumination (CIE) color changes technique. Upon increasing the γ dose up to 100 kGy, the maximum dose used, both direct and indirect bandgaps decreased. The Urbach energy exhibits a reverse trend. We attribute this to the dominance of chain crosslinks that damaged the ordered configuration and thus increased the amorphous phase. This suggests that the γ radiation can facilitate the spreading of the nanoparticles within the composite matrix suggesting an extra compacted structure of the NC samples. Also, we detect the nature of microelectronic transitions, using the optical dielectric loss (ε”), and found that the PC-PBT/ZnS-NiO NC films had direct allowed transitions. Moreover, we study the γ-induced modifications in the optical conductivity, dielectric parameters and nonlinear optical parameters. Further, the color changes between the pristine and irradiated films were estimated. The pristine NC film exhibited significant color differences upon γ irradiation. The induced improvements in the optical characters suggest that the γ is a suitable mean that permits the use of PC-PBT /ZnS-NiO NC in the optoelectronic devices.
KEYWORDS:
1. Introduction
Polycarbonate (PC) is a natural amorphous polymer distinguished by its outstanding optical properties (Citation1). Moreover, it is a suitable candidate for dosimeter applications (Citation2, Citation3). PC contains phenyl and carbonyl groups. The carbonyl group is more sensitive to radiation. It degrades by the effect of low radiation doses faster than the phenyl groups and, hence, it is the main reason for radiation-induced destruction in PC (Citation4). The low density and excellent transparency of PC let it to be helpful for optical fibers and electronic devices. On the other hand, PBT is a semi-crystalline polymer, which can be applied in fibers and films. The industrial interest in PC/PBT blends has developed due to their properties, which permitted them to be high-performance polymers (Citation5). These polymers combine the excellent impact toughness, high mechanical and thermal properties, and good dimensional stability of PC with the excellent chemical resistance of PBT (Citation6). The blend of PC with PBT is an important category of commercial blends with several applications. This can be attributable to the transesterification exchange reaction that takes place between PC and PBT, resulting in a novel chemical structure (Citation7).
Though these polymers have huge applied and marketable importance, the occurrence of some issues, which are very difficult to control, such as the changes in humidity and temperature, affect its polymerization technique. This support the creation of structural defects inside the polymers, associated with modifications in their physical properties (Citation8). These structural defects can be treated by adding nanoparticles (NPs) together with the γ irradiation.
The addition of NPs enhances the properties of the hosting polymer blend due to their minute size which improves the chance for more surface atoms to take part in the reactions (Citation9, Citation10). Therefore, the resulting nanocomposites (NCs) can be appropriate for the application in industry. ZnS is a metallic chalcogenide that is extensively applied in photocatalytic requests. It contains two main crystalline constructions, wurtzite and cubic phases. It displays excellent SC characteristics with oxidation and reduction band potentials (Citation11, Citation12). Comparatively, NiO displays an electrochemical influence and has achieved great attention owing to its optical characteristics. It is chemically stable owing to its cubic construction stability (Citation13). NiO is an effective material, which allows enhanced reduction reaction, high strength to photocorrosion, and co-catalytic characteristics (Citation14). Navakoteswara, et al. (Citation14) demonstrated that the NiO/ZnS constructions are effective in transferring carriers to the surface of the catalyst.
Polymer NCs have their importance in the area of functional material sciences and technologies. The NCs show a diversity of remarkable optical structures, including modified absorption or emission spectra, refractive indices, and high optical nonlinearities. These properties made the NCs qualified for optoelectronic applications (Citation15–17). An additional factor that improves the physical and chemical properties of polymer NCs is γ irradiation. When polymeric materials are exposed to γ radiation chain sessions take place, thus forming chemically active, free radicals. These free radicals contribute in chemical reactions, leading to chain crosslinks. Crosslinking is the process by which these active free radicals create new bonds between the chains. Therefore, the morphology and macromolecular structure of the polymeric material are affected (Citation7). Furthermore, the γ irradiation-induced color change in polymers is another significant characteristic that makes it easier to recognize how the polymer's properties have changed. It can be used in the field of dosimetry and radiation processing (Citation18).
Optical properties play an important role for researchers because of their wide application in optoelectronic devices (Citation19). Also, the color changes by the action of γ irradiation allow the estimation of the optical performance of the polymers. This is required information for their application in industries (Citation19). Several articles have studied the feasibility of applying the color changes of irradiated polymers for dosimeter applications (Citation20–22). They credited the change in color to the formation of free radicals, that lead to production of strong conjugated bonds through the chain crosslinks (Citation23). The current study aims to evaluate the viability to enhance the optical properties of PC/PBT blend and enhancing its presentation in many applications by the addition of Zn-NiO NPs and γ irradiation.
2. Experimental
2.1 Materials
Sigma-Aldrich GmbH, Egypt provided the EDTA-ethylenediamine acid, while Makrolon/Pocan blend was fabricated by Bayer A.G., Germany, Corporation. It is marketable called Bayfol CR 4-2 which is of 1.2 g/cm3 density and 250 µm thickness.
2.2. Preparation of the ZnS and NiO NPs
We prepared ZnS NPs, as demonstrated in our prior article (Citation24), applying the chemical coprecipitation procedure in atmospheric air, using a stabilizing agent (EDTA-ethylenediamine). The NiO NPs are fabricated, applying the sol–gel procedure; its characteristics are investigated applying the methodology demonstrated in our previous article (Citation13).
2.3. Preparation of the PC/PBT/ZnS-NiO NC
Using the ZnS and NiO NPs, we prepare the PC-PBT/ZnS-NiO NC by means of the solution casting procedure following the technique illustrated in our prior article (Citation24). In this technique, we dissolved one gram of PC/PBT in 100 mL of Dimethylformamide (DMF) through stirring until the blend fully dissolves. Then, 0.5 wt% (0.005 g) of each of the fabricated NPs is added to the prior solution with magnetic stirring at RT, till a homogenous solution is obtained. The mixes are then dried in Petri dishes in a vacuum oven adjusted at 60°C. Then, we keep the shaped films at 45°C for three days in an electrical furnace to eliminate the remaining solvent. The produced films are of 0.35 mm thick in average, estimated by a thickness meter (Model 11/2704 Ast MD 370).
2.4. Exposure facility
The NC samples were irradiated using a 60Co source (designed by Atomic Energy of Canada, Ltd.) with a dose rate of 1 kGy/h. The samples were irradiated at the National Center of Radiation Research and Technology, Egyptian Atomic Energy Authority, Cairo, Egypt.
2.5. Instrumentation
The UV spectroscopy is carried out by means of a Tomos spectrophotometer (Model No. 1800) manufactured by the Life Science Group, China. The color changes between the irradiated films and the pristine are evaluated by the International Commission on Illumination (CIE) color changes technique. Formerly, we gave a full investigation of all the applied formulas in (Citation19).
3. Results and discussion
3.1. Characterization of the ZnS and NiO NPs
The Rietveld enhanced outline of the ZnS and NiO NPs, obtained using MAUD software together with the SEM images, were investigated in our previous articles (Citation13, Citation24). The prepared ZnS was highly crystalline in the cubic sphalerite phase. Its average particle diameter was 4 nm. The SEM measurements indicated that the ZnS was characterized by spherical crystals, which were aggregated. These aggregators contained uniform-shaped NPs of size ranging from 10 to 25 nm. The results of TEM indicated that the ZnS crystals were of approximately 2.5 nm diameter in average. The TEM and SEM images of ZnS NPs were provided in our prior publication (Citation24). The NiO NPs had a sole phase by space group (R-3 m) and 18 nm particle diameter. The particles were spherically shaped and tended to agglomerate because of their common reactions.
3.2 Absorbance study
The absorbance spectrum of the irradiated and pristine PC/PBT/ZnS-NiO NC films are shown in Figure in order to demonstrate the induced alternations in the band gap (Eg) structure, when irradiated with γ doses and to acquire understandings around the optical electronic transition. It is seen that the absorbance decreases when the wavelength increases.
Figure 1. The absorbance spectra of the PC/PBT/ZnS-NiO NC samples. Here and further curves numbered 1–7 are for films irradiated with 0, 10, 20, 50, 70, and 100 kGy correspondingly.
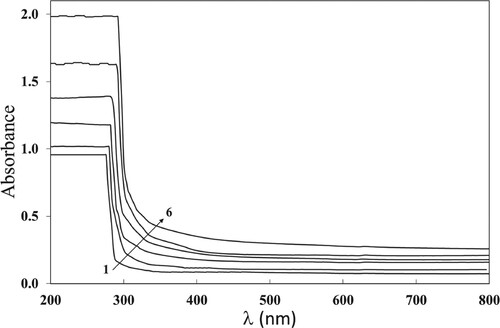
This can be attributable to a decrease of the amount of probable transitions of (n− π*) carbonyl groups and phenyl groups (π− π*) (Citation25). Additionally, the absorbance increases when the γ dose increases up to 100 kGy. The reason of increasing the absorbance with the γ dose is the development of bonding as a result of crosslinking. The γ radiation causes the degradation of carbonate and isopropyl groups in the PC/PBT chains, and then decomposition of aromatic rings occurs (Citation26). The free radicals formed by degradation create novel bonds, leading to crosslinking. consequently, increase in amorphous phases within the polymer matrix contributes in increase of the absorbance. Also, the alternations in energy bands produced by the effect of γ together with the implanted ZnS and NiO NPs Rayleigh scattering can be the cause of increasing absorbance (Citation27). Besides, when the UV light is fully absorbed, the molecules can be stimulated into their single or triple states, that consequently leads to the photo-chemical reactions to start within the polymer matrices, increasing the absorbance (Citation28). Therefore, increase in the absorbance, when increasing the dose, possibly means the absorbing of the incident light energy through the inter-mediate atoms and, thus, a new chemical construction was obtained in (Citation29). The minute size of the ZnS and NiO NPs encourage the chain crosslinks, as it is the main reason of the reduction in the atomic volume occupied by the NPs and, thus, the absorbance increases (Citation30).
3.3. Urbach energy illustration
Alongside the spectra of the absorption coefficient α and nearby the optically band edge, there exists an exponential portion named the Urbach energy (EU). This seems in amorphous materials due to the attendance of localized states that are expanded into the band gap (Citation31). The values of EU are calculated in terms of α (Citation32), which follows the EU rule (Citation33),
(1)
(1) where αo is a constant dependent on the material. The Urbach energy identifies the disorders of phonon states in the NC (Citation34). We evaluate the numerical values of α, in view of the equation
(2)
(2) The alternations in band structure can be evaluated by means of α. We determine EU from the slope of the resultant linear part of the ln α versus hν plot; see Figure . The numerical values of EU are displayed in Table . Upon increasing the γ dose up to 100 kGy, EU increases (0.83 − 1.47 eV). This increase is due to the chain crosslinking that increases the amorphous regions (Citation35).
Figure 2. Variation of lnα with hν for the PC/PBT/ZnS-NiO NC films.
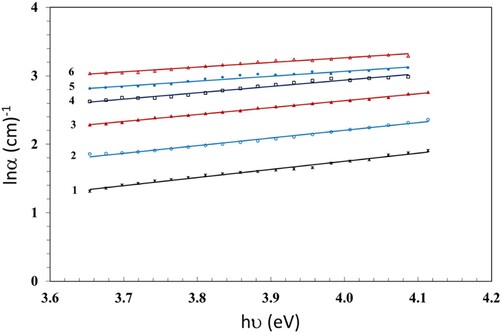
Table 1. Values of Eg and EU for the PC/PBT/ZnS-NiO NC Samples against γ dose.
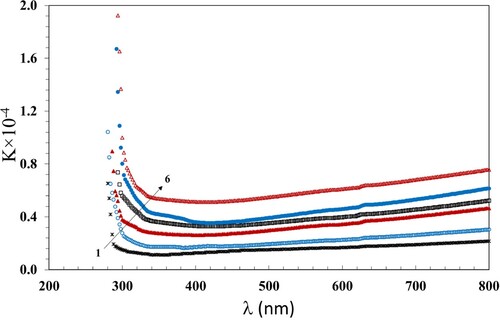
The extinction coefficient (K) can be evaluated for the NC films as follows:
(3)
(3) The values of K give data around the minor dispersions of the incident photons due to the scattering and absorbance. The relation between k and λ is displayed in Figure . The numerical values of K decreases when λ increases up to 400 nm and then increases with increase in λ up to 800 nm. Moreover, the values of K increase with increasing dose up to 100 kGy, which is attributable to the dominance of the chain crosslinking that increases the disorder in the NC films (Citation36).
Figure 3. Variation of K with λ for the PC/PBT/ZnS-NiO NC films.
3.4. Investigation of band gaps
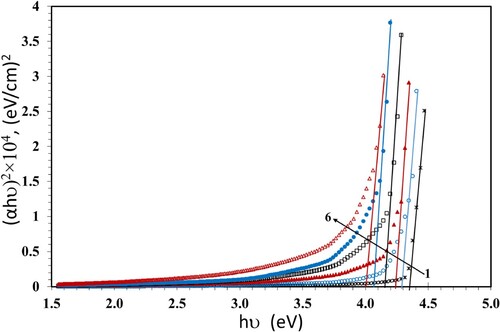
We apply the Tauc's relation (Citation37) to estimate the values of band gaps Eg,
(4)
(4) Where hν is the photon's energy and B is the probability parameter for the transition, which measures the disorder of the material. The value of the index n indicates the nature of the micro-electronic transition. According to the selection rule, it has the value of 1/2 for a direct allowed transition; the electron vertically transfers from the top valence band to the bottom conduction band during a direct allowed transition. The value of n is 2 for the non-vertical transitions which are generally known as indirect allowed transitions. Also, n has the values of 3 and 3/2 for indirect and direct forbidden transitions, respectively (Citation38). The numerical values of Eg can be evaluated from the plot of (αhν)1/n versus hν and extending the linear part of the curve to the hν axis. The values of Eg which were calculated at n = 1/2 are given in Table and plotted in Figure versus hν. The Eg values decreased with increasing the dose up to 100 kGy. This can be due to the growth of disordered portions in the NC films. The decrease of Eg causes increase in the localized states and creates defects in the Eg structure, forming microelectronic transitions. The existence of ZnS and NiO NPs affects the transmission and thus causes the drop of Eg. Also, breaking of the γ-induced bonds creates free radicals, that lead to chain crosslinks resultant in a reduction of Eg values (Citation39). This permits the NC to be a suitable candidate for solar cell applications. An additional factor that enhances the domination of crosslinking is the presence of PBT in the blend which allows the formation of additional bonds through the transesterification reaction. Transesterification is an essential exchange reaction taking place between PC and PBT, resultant in a new chemical structure of copolymers with new bands (Citation7).
Figure 4. Variation of (αhν)2 with hν for the PC/PBT/ZnS-NiO NC films.
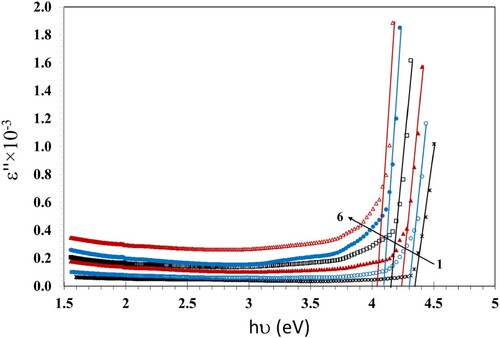
We calculated the values of the optical dielectric loss (ε″) using Equation 5:
(5)
(5) where n is the real part of the refractive index.
The values of n were determined by the relation:
(6)
(6) We calculated the reflectance (R) from the transmittance values (T), computed from the absorbance spectra, by means of the equation:
, where A is the absorbance.
To estimate the type of microelectronic transition we compared the values of Eg calculated from Tauc’s relations (Figures ) with those calculated using the relation between the optical dielectric loss (ε′′) and hν (Figure ) as ε′′ depends on the band configuration of its material. Also, the analysis of the ε′′ vs. energy relation by means of UV-vis spectroscopy is useful to deduce the band structure of the studied material (Citation40). Furthermore, ε″ is aids in exploring the microelectronic transition among occupied and non-occupied states (Citation41). Aziz et al. (Citation41) found that the values of Eg evaluated, using the graph of ε” against the hν, were nearby to the band gaps evaluated, using Tauc's plots, when n = 1/2. Therefore, their synthesized (PVA/CeO2) films had direct allowed transitions, as a result. In the other work (Citation40), they prepared PMMA films doped with dye. Their results indicated that the values of Eg evaluated, using the graph of ε” against hν, were closely equal to the values resulting from Tauc's plots at n = 3/2, while the values of Eg of the pristine PMMA evaluated, using the Tauc's plots at n = 1/2, were justly nearby to that resulting, using the graph of ε” against hν. They reached the conclusion that the pristine sample had a direct allowed transition, while the modified films had direct forbidden transition. Comparable results were obtained by Brza et al. (Citation42). The values of Eg estimated, when n = 3/2 were acceptably nearby to the values estimated using the graph of ε” against, mean a forbidden transition. They decided that ε” can be capably applied for estimating Eg and studying the band gap structure. In our results we found that the values of Eg estimated, using the graph of the ε” against hν, are nearby to those calculated, using the Tauc's plots at n = 1/2; see Table . This indicated that the PC-PBT/ZnS-NiO NC films had a direct allowed transition (Citation40).
Figure 5. Variation of (αhν)1/2 with hν for the PC/PBT/ZnS-NiO NC films.
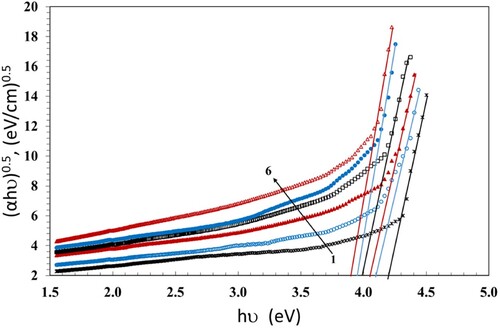
Figure 6. Variation of (αhν)2/3 with hν for the PC/PBT/ZnS-NiO NC films.
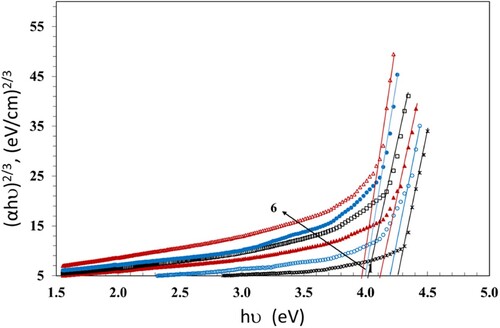
Figure 7. Variation of ε” with hν for the PC/PBT/ZnS-NiO NC films.
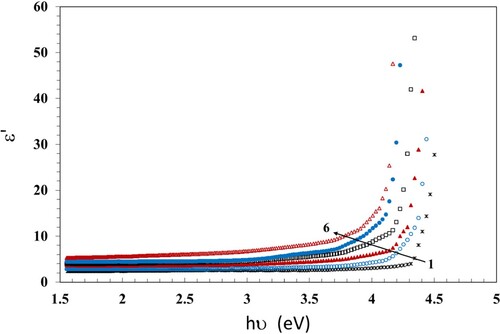
Studying the optical dielectric properties is useful for obtaining information about the optical behavior of matter (Citation43). The real part of the dielectric constant ε′ can be calculated in terms of n and K (Citation44);
(7)
(7) In Figure , we show the dependence of ε′ on hν. It is deduced that the NC films behave a unique photon-electron reaction. Also, in Figure , the dependence of ε′ on the γ dose is shown. The values of ε′ increase with increasing dose up to 100 kGy; this means the development of the density of states inside the forbidden gap of the samples. The γ irradiation breaks the hydrogen bonding within the samples, forming extra defects and hence increasing the density of states inside the forbidden gap (Citation40).
Figure 8. Variation of ε′ with hν for the PC/PBT/ZnS-NiO NC films.
3.5. Refractive index investigation
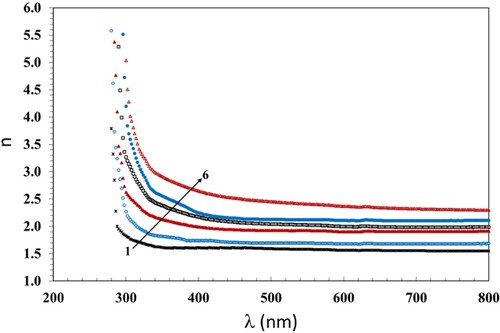
The numerical values of n of the irradiated and pristine films are estimated by means of Equation (6). The dependence of n on λ is shown in Figure . The variation of n with λ is an essential issue, which is required for the design of optoelectronics, counting filters, waveguides, and modulators. Also, the decrease of n with increasing λ indicates a decrease in the polarizability of the macromolecule electronic state. This helps in the detection of the high inertia of the polymer macromolecules. In addition, n increases with the increasing dose. This indicates intermolecular changes in the PC/PBT/ZnS-NiO NC matrix, because n is an issue, which means the optical density of matter, increase in n with increasing dose indicates the creation of hydrogen bonding in the polymeric chains. This aids in the development of amorphous portions causing chain crosslinks. Another issue that encourages crosslinking is the transesterification that occurs between PC and PBT. There are three mechanisms by which transesterification occur in PC/PBT blend; namely: (I) Alcoholysis (trans-reaction between ester and hydroxyl groups in PC), (II) Acidolysis (transesterification reaction among PC and carboxylic acid groups of polyester), and (III) Direct transesterification reaction among the carbonate group of PC and ester group of PBT (Citation45). The kinetics of direct transesterification is much faster than that of acidolysis and alcoholysis (Citation46). The bonding between the carbonate and ester groups enhances the crosslinking which reduces the ordered phase in the NC films and increases the amorphous regions, increasing the refractive index.
Figure 9. Variation of n with λ for the PC/PBT/ZnS-NiO NC films.
3.6. Optical conductivity investigation
An important issue that aids in the area of optoelectronics is the optical conductivity σ that means the electrical conductivity of the substance in the presence of an irregular electric field accompanying with the incident radiation. To estimate the values of σ in terms of n, α and the velocity of light (c) we use the equation (Citation47):
(8)
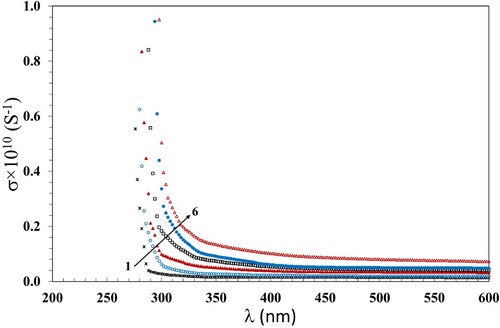
(8) The change of σ with λ is shown in Figure . It is seen that the trend of σ with λ is similar to that of A and n; this could be attributable to the failure of the low-energy incident photons to be transmitted in the films. Also, the values of σ increase when the γ dose increases up to 100 kGy; it is attributable to the ionizing effect of γ radiation. This allows the breaking of bonds and creating free radicals; consequently, the amorphous regions in the NC increase. Accordingly, the motion of electrons in the band gap becomes easy, being reflected by increase of σ (Citation48).
Figure 10. Variation of σ with λ for the PC/PBT/ZnS-NiO NC films.
The spectral dependence of the refractive index lower the band gap energy region (inter-band absorption edge) can be investigated by means of the Wemple-Di-Domenico single oscillator model (Citation49, Citation50). It explains the dielectric response for transitions below the optical gap (Citation50). We analyzed the dispersion of the refractive index, n, as expressed by Wemple-Di-Domenico single oscillator model relationship (Citation51):
(9)
(9) where
is the single oscillator energy and
is the dispersion energy (average strength of inter-band optical transitions). The single oscillator energy Eo is the average gap energy that is dependent on the optical band gap Eg (Citation49,Citation50). The dispersion energy Ed is related to the charge distribution in each unit cell and is, therefore, a quantity strongly related to chemical bonding. Ed is directly connected with the structure of matter (Citation50).
and
, can be estimated from the slope
of the linear segment of the plots (n2-1)−1 vs. (hν)2 (Figure ) and its intercept with the ordinate axis
. Additionally, the value of the dielectric constant at high frequency (
) was estimated from the intersection of the lines with the y-axis at
= 0. The values of Eo and Ed were estimated and are given in Table . The values of Eo decreased with increasing the γ dose up to 100 kGy, while Ed exhibited an opposite trend, indicating stronger optical transitions.
Figure 11. Variation of (n2-1)−1 with (hν)2 for the PC/PBT/ZnS-NiO NC films.
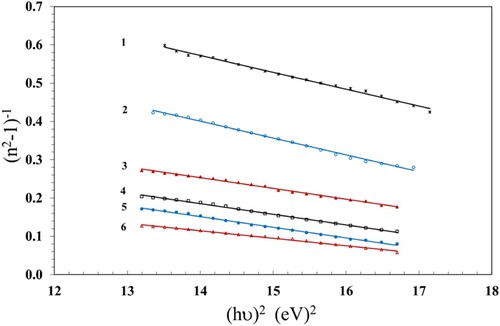
Table 2. Values of linear and nonlinear parameters of the PC/PBT/ZnS-NiO NC films against γ dose.
The variation of refractive index with wavelength can be determined by the following relationship (Citation52).
(10)
(10) where
is the average oscillator strength,
is an average oscillator wavelength and
is the wavelength of the incident light. The values of average inter-band oscillator wavelength (
), average oscillator strength (
) and the lattice dielectric constant (εl) were estimated and are given in Table . These values were estimated from the slope and intercept of the linear fits of the plots (n2-1)−1 vs. λ−2 (Figure ) and n2 vs λ2 (Figure ) and using Equation 11 given below:
Figure 12. Variation of (n2-1)−1 with λ−2 for the PC/PBT/ZnS-NiO NC films.
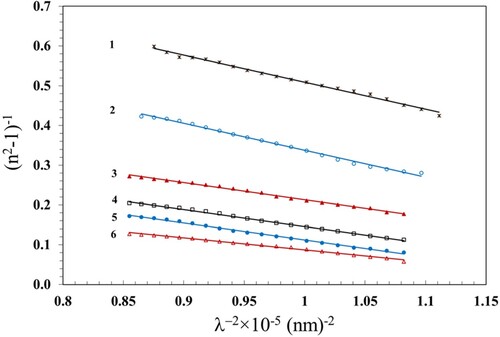
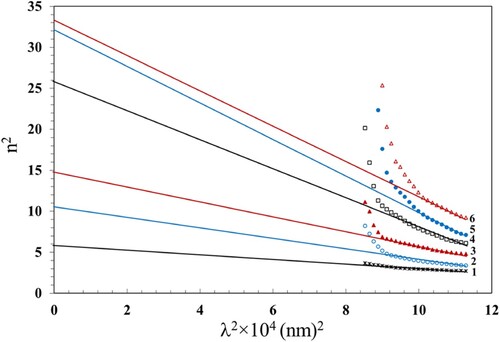
Figure 13. Variation of n2 with λ2 for the PC/PBT/ZnS-NiO NC films.
For further analysis of the optical data, the lattice dielectric constant was estimated according to the following relation (Citation53).
(11)
(11) where
is a constant. The value of the lattice dielectric constant,
, can be estimated from the plots of
vs.
and extrapolating the linear segment towards the shorter wavelength (Figure ). The intercept with the vertical axis (at
= 0) gives the
values which are also listed in Table . The values of no, λo, So and εl increased with increasing the γ dose up to 100 kGy. The increase of these parameters can be attributable to the formation of chemically active free radicals that support the local polarization (Citation54). The γ irradiation causes crosslinking that damages the crystalline structure and induces lattice defects leading to modification in the electronic structure. These lattice defects introduces new energy levels within the Eg, efficiently increasing the material's lattice dielectric constant.
3.7. Nonlinear optical parameters
Studying the third order nonlinear optical susceptibility χ3 aids in investigating the optical behavior of materials whose polarization is dependent on the intensity of an applied electromagnetic radiation. This intensity dependence gives rise to a diversity of distinctive properties, including self-focusing, two-photon absorption and third harmonic generation. Self-focusing is a non-linear optical route that arises from the modification in refractive index of materials exposed to intense electromagnetic radiation. The two-photon absorption indicates that the sample absorbs two photons concurrently to excite a molecule from ground state to a higher energy. The third harmonic generation is a process whereby light is created at a wavelength which is 1/3 of the original wavelength. These processes are considered the base for all optical switching devices and photonic applications (Citation55). We calculated χ3 according to the Miller’s rule using Equation 12: (Citation56)
(12)
(12) where
The nonlinear refractive index, n2, of materials can be estimated from χ3 and the linear refractive index, n0, using Equation 13: (Citation57).
(13)
(13) where
is the linear refractive index,
. The values of the static refractive index (
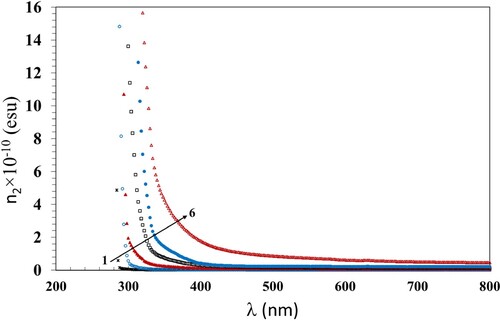
) are given in Table . The variation of χ3 with λ and n2 with λ of the incident photons are shown in Figures and . Both χ3 and n2 decreased with increasing wavelength for all films. Also, they increased with increasing the γ dose up to 100 kGy which was consistent with the previously discussed data. The increase in χ3 and n2 values can be attributed to the induced modifications in the polymer structure due to the hydrogen bond cleavages. This induces defects and, thus, disorders, that enhance the number of chemically active free radicals and thus boosts the χ3 and n2 values.
Figure 14. Variation of χ3 with λ for the PC/PBT/ZnS-NiO NC films.
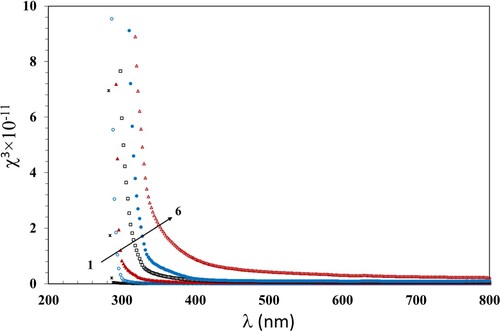
Figure 15. Variation of n2 vs.λ for the PC/PBT/ZnS-NiO NC films.
3.8. Estimation of color changes
A set of mathematical lights (X, Y, and Z) known as the color's tristimulus values, were established by the vision scientists to substitute the real red, green, and blue lights (Citation58). Also, they established a standardization method to compute the x, y, and z chromaticity coordinates that specify the color capacity. By means of the CIE procedure defined in our prior article (Citation19), we estimate the color factors, applying the transmission data measured in the λ range from 370 up to 780 nm. The tristimulus values and chromaticity coordinates are evaluated and given in Table against the γ dose.
Table 3. The tristimulus values and chromaticity coordinates of the PC/PBT/ZnS-NiO NC films against γ dose.
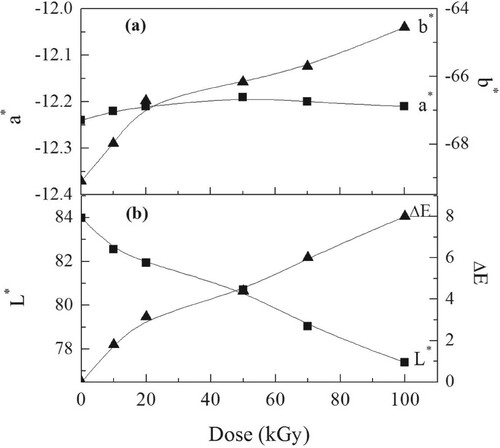
The paint, plastic, and textile productions all deeply depend on the 1976 CIE L*a*b* color space. The system's L*, a*, and b* intercepts are built on the CIE color triangle. The L* value, a* value, and b* value in this system describe the dark − white axis, the green − red axis, and the blue − yellow axis. The uncertainty in valuing L* is ±0:05 and ±0:01 for both a* value and b* value, respectively. The variations of a* value, b* value, and L* value with the γ dose are shown in Figure . The intercepts b* had negative values that increased when the γ dose increased up to 100 kGy, suggesting the trend of the blue color component to be yellow. The intercept a* exhibited similar values within experimental errors, suggesting no changes in the green-red component, see Figure (a). This was associated with the darkness in the films − L* value; see Figure (b).
Figure 16. Variation of the color intercepts and color intensity for the PC/PBT/ZnS-NiO NC films.
To estimate the values of color intensity ΔE, meaning the color discrepancy between the irradiated NC films and the pristine one, we use the equation
(14)
(14) where the subscripts 1 and 2 denote the irradiated and pristine films.
The dependence of ΔE on the γ dose is shown in Figure (b), where ΔE increases when the dose increased up to 100 kGy. The color intensities are greater than 5; this suggested permanent color changes (Citation59, Citation60). The optical color changes are attributable to the active free radicals, which cause chain crosslinks through the formation of conjugated double bonds. Furthermore, the trapped free radicals, created by the γ brought break of polymer molecules, have electrons with unpaired spins. Such classes cause coloration changes (Citation19).
4. Conclusions
Summarizing, we conclude that the γ irradiation of the PC/PBT/ZnS-NiO NC samples leads to the domination of chain crosslinking, causing an improvement of their optical and color properties. The absorbance, extinction coefficient, refractive index, optical conductivity, and the real parts of the dielectric constants ε′ and ε” increase, due to the formation of crosslinking, whereas, the band gaps decreased. Moreover, the values of band gap indicated that the PC/PBT/ZnS-NiO NC films had a direct allowed transitions. Increase in the refractive index accompanying by the reduction of band gap with the increasing γ dose suggests the application of the prepared NC in solar cells as an absorbent matter. The nonlinearity behavior of the γ irradiated NC films can be considered a useful guide for future optoelectronic devices application. The pristine NC film was colorless, but it showed permanent color changes when exposed to γ dose up to 100 kGy. This optical coloration is owed to the conversion of the blue color constituent into the yellow one together with increase in the darkness.
Disclosure statement
No potential conflict of interest was reported by the author(s).
References
- El Ghazaly, M.; Aydarous, A. Res. Phys. 2017, 7, 333–337. DOI: 10.1016/j.rinp.2016.09.008.
- Yu, K.N.; Nikezic, D. Nuclear Track Detectors: Design, Methods and Applications; Nova Science Publishers: New York, 2009; pp. 107–131. ISBN: 978-1-60876-826-4.
- Singh, N.L.; Qureshi, A.; Singh, F.; Avasthi, D.K. Mater. Sci. Eng. A 2007, 457, 195–198. doi:10.1016/j.msea.2006.12.008.
- Nouh, S.A.; Amer, H.; Remon, S.W. Nucl. Instrum. Methods B 2009, 267, 1129–1134. doi:10.1016/j.nimb.2009.02.049.
- Dal Lago, E.; Boaretti, C.; Piovesan, F.; Roso, M.; Lorenzetti, A.; Modesti, M. Materials (Basel) 2018, 12, 49. DOI: 10.3390/ma12010049.
- Alhazime, A.A.; El-Shamy, N.T.; Benthami, K.; Barakat, M.M.E.; Nouh, S.A. J. Polym. Eng. 2021, 41, 119–126. doi:10.1515/polyeng-2020-0197.
- Nouh, S.A.; Radwan, Y.E.; Elfiky, D.; Abutalib, M.M.; Bahareth, R.A.; Hegazy, T.M.; Fouad, S.S. Rad. Phys. Chem. 2014, 97, 68–74. doi:10.1016/j.radphyschem.2013.10.017.
- Nouh, S.A.; Mahrous, E.M.; AlSomali, F.; Yajzey, R.; Benthami, K.; Abbady, G. J. Russ. Laser Res. 2023, 44, 384–395. doi:10.1007/s10946-023-10145-7.
- Ibrahim, H.A.; Badr, A.; Mahdy, K.T. Curr. Sci. Int. 2014, 3, 390–402.
- Akbarzadeh, M.; Ebadi-Dehaghani, H.; Sadeghi, M. Adv. Mater. Res. 2013, 739, 51–56. doi:10.4028/www.scientific.net/AMR.739.51.
- Hernley, P.A.; Chavez, S.A.; Quinn, J.P.; Linic, S. ACS Photonics 2017, 4, 979–985. doi:10.1021/acsphotonics.7b00047.
- Hao, J.; Wang, X.; Liu, F.; Han, S.; Lian, J.; Jiang, Q. Sci. Rep. 2017, 7, 3021. DOI:10.1038/s41598-017-03200-2.
- Nouh, S.A.; Alsobhi, B.O.; Abou Elfadl, A.; Massoud, A.M. J. Inorg. Organomet. Polym. 2017, 27, 1851. doi:10.1007/s10904-017-0650-5.
- Navakoteswara, V.R.; Ravi, P.; Sathish, M.; Reddy, N.L.; Lee, K.; Sakar, M.; Prathap, P.; Kumari, M.M.; Reddy, K.R. J. Hazard. Mater. 2021, 413, 125359. doi:10.1016/j.jhazmat.2021.125359.
- Ahmad, A.A.; Alsaad, A.M.; Al-Bataineh, Q.M.; Al-Akhras, M.-A.H.; Albataineh, Z.; Alizzy, K.A.; Daoud, N.S. Polym. Bull. 2021, 78, 1189–1211. doi:10.1007/s00289-020-03155-x.
- Jum’h, I.; Mousa, M.S.; Mhawish, M.; Sbeih, S.; Telfah, A. J. Appl. Polym. Sci. 2019, 137, 48643. doi:10.1002/app.48643.
- Chamroukhi, H.; Hamed, Z.B.; Telfah, A.; Bassou, M.; Zeinert, A.; Hergenröder, R.; Bouchriha, H. Opt. Mater. 2018, 84, 703–713. doi:10.1016/j.optmat.2018.07.041.
- Yamauchi, T.; Nakai, H.; Somaki, Y.; Oda, K. Radiat. Meas. 2003, 36, 99–103. doi:10.1016/S1350-4487(03)00102-1.
- Nouh, S.A.; Gaballah, N.; Abou Elfadl, A.; Alsharif, S.A. Radiat. Prot. Dosim. 2019, 183, 450–459. doi:10.1093/rpd/ncy165.
- Fahim, E.; Bekhit, M.; Sobhy, A.; Ali, Z.I. Radiochim. Acta 2020, 108, 231–238. doi:10.1515/ract-2019-3138.
- Abdullahi, S.; Aydarous, A.; Salah, N. Radiat. Phys. Chem. 2021, 188 (1-8), 109656. doi:10.1016/j.radphyschem.2021.109656.
- Sudha, A.; Maity, T.K.; Sharma, S.L.; Gupta, A.N. Nucl. Instrum. Methods B 2019, 461, 171–174. DOI: 10.1016/j.nimb.2019.09.050.
- Said, H.M.; Ali, Z.I.; Hussein, E.A. J. Appl. Polym. Sci. 2006, 101, 4358–4365. doi:10.1002/app.24325.
- Nouh, S.A.; Benthami, K. J. Vinyl. Additive. Technol. 2019, 25, 271. doi:10.1002/vnl.21689.
- El-Mesady, I.A.; Rammah, Y.S.; Abdalla, A.M.; Ghanim, E.H. Radiat. Phys. Chem. 2020, 168, 108578. doi:10.1016/j.radphyschem.2019.108578.
- Sharma, R.; Kar, Kamal K.; Das, Malay K.; Gupta, G. K.; Kumar, S, 2016. Short Carbon Fiber-Reinforced Polycarbonate Composites. In Composite Materials Processing, Applications, Characterizations: Kar, K. K., Ed.; Springer: Berlin; pp. 199–223.
- Rathore, B.S.; Gaur, M.S.; Singh, K.S. J. Appl.: Polym. Sci. 2012, 126, 960–968. DOI: 10.1002/app.37004.
- Karthikeyan, B.; Hariharan, S.; Mangalaraja, R.V.; Pandiyarajan, T.; Udayabhaskar, R.; Sreekanth, B. IEEE Photon. Technol. Lett. 2018, 30, 1539–1542. doi:10.1109/LPT.2018.2859042.
- Alhazime, A.A.; Benthami, K.; Alsobhi, B.O.; Ali, G.W.; Nouh, S.A. J. Vinyl Addit. Technol. 2021, 27, 47–53. doi:10.1002/vnl.21782.
- Seoudi, R.; Shabaka, A.A.; Kamal, M.; Abdelrazek, E.M.; Eisa, W.H. J. Mol. Struct. 2012, 1013, 156–162. doi:10.1016/j.molstruc.2012.01.016.
- Nouh, S.A.; Abou Elfadl, A.; Benthami, K.; Alhazime, A.A. Int. Polym. Proc. 2019, 34, 255–261. doi:10.3139/217.3729.
- Rakhshani, A.E. J. Phys. Condens. Matter 2000, 12, 4391–4400. doi:10.1088/0953-8984/12/19/309.
- Urbach, F. Phys. Rev. 1953, 92, 1324–1324. doi:10.1103/PhysRev.92.1324.
- Wahab, L.A.; Zayed, H.A.; Abd El-Galil, A.A. Thin Solid Films 2012, 520, 5195–5199. doi:10.1016/j.tsf.2012.03.119.
- Prasher, S.; Kumar, M.; Singh, S. Int. J. Polym. Anal. Charact. 2014, 19, 204–211. doi:10.1080/1023666X.2014.879418.
- Hamad, T.K.; Yusop, R.M.; Al-Taa’y, W.A.; Abdullah, B.; Yousif, E. Int. J. Polym. Sci. 2014, 2014, 787595. DOI:10.1155/2014/787595
- Tauc, J. In Amorphous and Liquid Semiconductors; Tauc, J., Ed.; Plenum Press: London, New York, 1974, p. 159. DOI: 10.1007/978-1-4615-8705-7.
- Jubu, P.; Yam, F.; Igba, V.; Beh, K.J. Solid State Chem. 2020, 290, 121576. DOI:10.1016/j.jssc.2020.121576.
- Palija, T.; Dobi, J.; Jai, M. Colloids Surf. B 2013, 108, 152–157. doi:10.1016/j.colsurfb.2013.02.045.
- Aziz, S.B.; Abdullah, O.G.; Hussein, A.M.; Ahmed, H.M. Polymers 2017, 9, 626. doi:10.3390/polym9110626.
- Aziz, S.B.; Dannoun, E.M.A.; Tahir, D.A.; Hussen, S.A.; Abdulwahid, R.T.; Nofal, M.M.; Abdullah, R.M.; Hussein, A.M.; Brevik, I. Materials 2021, 14, 1570. doi:10.3390/ma14061570.
- Brza, M.A.; Aziz, S.B.; Anuar, H.; Al Hazza, M.H. IJMS 2019, 20, 3910. doi:10.3390/ijms20163910.
- Soylu, M.; Al-Ghamdi, A.A.; Yakuphanoglu, F. J. Phys. Chem. Solids 2015, 85, 26–33. DOI: 10.1016/j.jpcs.2015.04.015.
- Bhavsar, V.; Tripathi, D. Indian J. Pure Appl. Phys. 2016, 54, 105.
- Montaudo, M.S.; Puglisi, C.; Samperi, F.; Montaudo, G. Macromolecules 1998, 31, 8666–8676. DOI:10.1021/ma980821c.
- Ganguly, A.; Channe, P.; Jha, R.; Mitra, S.; Saha, S. Polym. Eng. Sci. 2021, 61, 650–661. doi:10.1002/pen.25652.
- Mudila, H.; Prasher, P.; Kumar, A.; Zaidi, M.G.H.; Verma, A. J. Phys.: Conf. Ser. 2019, 1531, 012105. doi:10.1088/1742-6596/1531/1/012105.
- Ismail, A.M.; Mohammed, M.I.; El-Metwally, E.G. Ind. J. Phys. 2019, 93, 175–183. doi:10.1007/s12648-018-1286-1.
- Wemple, S.H.; DiDomenico, M. Phys. Rev. Lett. 1969, 23, 1156–1160. doi:10.1103/PhysRevLett.23.1156.
- Wemple, S.H.; DiDomenico, M. Phy. Rev. 1971, 3, 1338–1350. doi:10.1103/PhysRevB.3.1338.
- Timoumi, A.; Bouzouita, H.; Rezig, B. Aust. J. Basic Appl. Sci. 2013, 7, 448–456.
- Mahmoud, S.A.; Alshomer, S.; Tarawnh, M.A. J. Modern Phys. 2011, 2, 1178–1186. DOI: 10.4236/jmp.2011.210147.
- Yous, B.; Berger, J.M.; Ferraton, J.P.; Donnadieu, A. Thin Solid Films 1981, 82, 279–285. doi:10.1016/0040-6090(81)90195-4.
- Zhou, P.; You, G.; Li, J.; Wang, S.; Qian, S.; Chen, L. Opt. Exp. 2005, 13, 1508–1514. doi:10.1364/OPEX.13.001508.
- Tamgadge, Y.S.; Sunatkari, A.L.; Talwatkar, S.S.; Pahurkar, V.G.; Muley, G.G. Opt. Mater. 2014, 37, 42–50. doi:10.1016/j.optmat.2014.04.036.
- Sunatkari, A.L.; Talwatkar, S.S.; Tamgadge, Y.S.; Muley, G.G. RSC Adv. 2019, 9, 15502–15512. DOI:10.1039/C9RA01598A.
- Sunatkari, A.L.; Talwatkar, S.S.; Tamgadge, Y.S.; Muley, G.G. Opt. Mater. 2021, 121, 111458. doi:10.1016/j.optmat.2021.111458.
- Nassau, K. Color for Science; Art and Technology; Elsevier: New York, 1998.
- Benthami, K.; Barakat, M.M.E.; Nouh, S.A. Eur. Phys. J. Appl. Phys. 2020, 92, 20402. doi:10.1051/epjap/2020200201.
- Nouh, S.A.; Barakat, M.M.E.; El-Nabrawy, H.A.; Benthami, K.; Elhalawany, N. Fibers Polym. 2021, 22, 1711–1717. doi:10.1007/s12221-021-0871-7.