
Abstract
Quality and morphology of outcrop exposure places fundamental constraints on what ichnological observations can be made and the veracity of these observations. Whilst the limits and potential biases are well known and reported for core studies, in the majority of field studies the equivalent biases are typically overlooked. In this paper we present a widely applicable method for recording outcrop characteristics based on their morphology, and how these characteristics may affect observations. We consider the impacts of structural orientation, superficial cover, and outcrop location on outcrop quality. Finally, we present two case studies, from the Tumblagooda Sandstone of Western Australia and the Armorican Sandstone Formation of northwestern France, to highlight the importance of recording outcrop characteristics.
Introduction
Field-based analyses of sedimentary strata and their constituent ichnofaunas are highly reliant on available exposure of rock outcrop. The physical shape and structure of geological exposures place intrinsic biases upon any observations which can be made of the rocks: for example, the gathering of particular measurements can be impeded or abetted (e.g. Marenco & Hagadorn, Citation2019; Nami, Citation1976; Stephen et al., Citation2001), or the outcrop may be variably suited to the observations of vertical profiles or horizontal bedding planes (Davies & Shillito, Citation2018, Citation2021; Gougeon et al., Citation2023; Petersen, Citation2002; Shillito & Davies, Citation2020). The information contained within a bedding surface is different to that contained within a vertical stratigraphic section: both aspects may be available, but provide different focal lengths in terms of recorded time and spatial scales (Davies et al., Citation2017, Citation2019; Davies & Shillito, Citation2018). The presence or absence of bedding surfaces at a given outcrop, or within a formation as a whole, is particularly significant in ichnological studies, as epifaunal trace fossils can most often only be observed upon these surfaces (unlike infaunal trace fossils that can be seen in both bedding plane and vertical exposures, as they are 3-D constructions that must intersect with vertical and horizontal planes).
Whilst it is well understood that observations of trace fossils in well core have inherent limits and biases (e.g. Dorador et al., Citation2014; Dorador & Rodríguez-Tovar, Citation2018; Knaust, Citation2012, Citation2017; Pemberton, Citation1992; Pemberton et al., Citation2001), equivalent biases dependent on outcrop morphology are often overlooked and infrequently discussed in scientific publications. However, the limits imposed by outcrop morphology can play an even more significant role, as whilst the inherent limits of core studies are consistent across all studies, those associated with outcrop morphology can vary drastically depending on specific outcrop traits at different locations. This can limit comparability of previous studies when it is uncertain how outcrop biases have affected observations, interpretations, and trace fossil censuses. Moreover, interpretations of diversity trends and paleoecologic shifts, both at local and global scales, are ultimately dependant on the completeness of data recovered and analysed—data that can be significantly altered by outcrop morphology and other natural biases (Gougeon et al., Citation2023; Kikuchi et al., Citation2018; Nanglu & Cullen, Citation2023).
To remedy this, in this short paper we: (1) summarise the treatment of outcrop morphology effects on ichnological observations in previous literature, and (2) present a widely applicable method for characterizing outcrops based upon their morphology, and how these morphotypes may differently influence observations. This develops a methodology first employed in a study of the Tumblagooda Sandstone of Western Australia (Shillito & Davies, Citation2020).
Previous considerations of outcrop effects
Previous discussion of outcrop effects on ichnological studies typically serves to compare how observations of ichnotaxa differ between outcrop and core (e.g. Bottjer & Droser, Citation1991; Bromley & Pedersen, Citation2008; Rodríguez-Tovar et al., Citation2017). This emphasizes that studies of core tend to lead to different ichnological interpretations than outcrop studies. For example, Ophiomorpha irregulaire is far more commonly reported from core than in outcrop (Bromley & Pedersen, Citation2008). As a result, some subsequent work extolls the benefits of integrated outcrop and core studies, to gain from the upsides of both methods (Rodríguez-Tovar et al., Citation2017).
However, those studies do not discuss the degree to which ichnological observations depend upon outcrop extent or morphology. It has long been recognised that ecosystems are heterogeneous (i.e. animals are not uniformly distributed within a biotope, they preferentially occupy some areas over others (Dörjes, Citation1972; Kotler & Brown, Citation1988; Thrush, Citation1991; Cosson et al., Citation1997; Winemiller et al., Citation2010; Zeppilli et al., Citation2016)). However, it is only recently that the constraints outcrop morphology place on the observable record have been considered in detail (e.g. Marenco & Hagadorn, Citation2019; Shillito & Davies, Citation2019). The inevitable result of the patchy occupation of substrates by animals is a heterogeneous ichnological record (Mángano et al., Citation2002; Marenco & Hagadorn, Citation2019; McIlroy, Citation2007; Shillito & Davies, Citation2019), and hence the point in space from which the record is observed strongly influences the observations that are made.
Whilst ichnological zonation has long been recognised between sub-environments (e.g. Frey et al., Citation1987; Swinbanks & Murray, Citation1981), intra-habitat heterogeneity in an ichnological assemblage was first recognised by Mángano et al. (Citation2002) in the Stull Shale Member at Waverly, Kansas, USA. The authors provide examples of ichnological heterogeneity from the strata, and consider potential ecological explanations, discussing the importance of niche specialization in tidal ecosystems. As exposure is extensive and trace fossils abundant, they do not discuss how interactions between a heterogeneous record and outcrop quality may impact observations.
McIlroy (Citation2007) discusses how the lateral variability of ichnofabrics can lead to very different ichnological signatures from the same bed at different locations short distances apart. He demonstrates that over just a few metres, individual ichnotaxa can go from comprising almost 60% of an ichnofabric to being entirely absent. Whilst this is not an issue with the relatively complete section of the Yorkshire coast that was used for his study, he highlights that where exposure is less complete, or when observations come from core, ichnofabric analysis should be approached conservatively due to the inherent ecological patchiness.
Kikuchi et al. (Citation2018) employed a statistical approach to account for the impact of outcrop extent on reported ichnodiversity. As trace fossil distributions are non-uniform, they observed that in less extensive outcrops the apparent ichnodiversity was lower. To eliminate this bias, the authors subsample existing ichnological data sets to obtain the relative ichnodiversity in exposed strata. They then use this to estimate the ichnodiversity in equivalent strata that are not exposed, verifying their method with artificial data sets before applying it in the field.
The impact of outcrop on a heterogeneous ichnological record was also considered by Shillito and Davies (Citation2019), with regards to dinosaur footprints. The studied section contained a significant footprint-bearing bed cropping out in a cliff, in an area characterized by rapid coastal erosion. Whilst fresh material appeared every year over the five-year period the authors studied the area, over longer timescales new reports of footprints were far more sporadic. During the intervals where no reports took place, up to 48.5 m of cliff retreat occurred, suggesting extensive tracts of the footprint-bearing horizon were barren. These barren regions were attributed to tracemaker behaviour, with gregarious dinosaurs preferentially following the same routes leading to high concentrations of footprints in some areas and low concentrations elsewhere. The dynamic nature of this outcrop enabled these observations. However, in a region of high outcrop stability such as inland, the outcrop may be locked on a barren section for hundreds to thousands of years (see also Gougeon et al., Citation2023).
Marenco and Hagadorn (Citation2019) consider how the morphology of outcrops may be restrictive to ichnological study, with specific focus on the size of exposed bedding surfaces. The authors highlight the paucity of work on ichnological patchiness, particularly with regards to horizontal trace fossils. This considers similar issues to those raised by Kikuchi et al. (Citation2018), although here the authors do not attempt to use statistical models to account for unavailable data. Through mapping trace fossil occurrences on large bedding surfaces (from 6–48 m2) from the Cambrian Elk Mound Group of Wisconsin (USA), they demonstrate that lateral heterogeneity in trace fossil occurrence and abundance exists at meter-decameter scales. This implies that small outcrops, and particularly small bedding surfaces, may be unrepresentative of the entire sedimentary unit from an ichnological standpoint, and hence recording outcrop characteristics is essential for proper interpretation of a dataset.
Shillito and Davies (Citation2020) refined their observations on the significance of outcrop morphology into a methodological framework in a recent study of the Tumblagooda Sandstone of Western Australia. In this study, three main styles of outcrop exposure were described that are commonly seen throughout the exposure belt. These outcrop morphologies are then compared, to illustrate how observations of trace fossils from the same strata could be wildly different, purely due to the physical shape of the outcrop. As the different outcrop morphologies in the Tumblagooda Sandstone are also typically associated with different sedimentary facies, it is discussed how much of the ichnological variation between the facies is real, and how much is an artefact of the outcrop exposure. As this was originally developed purely to quantify possible biases in observations of the Tumblagooda Sandstone, the model presented therein required further refinement to make it widely applicable.
This method was reapplied in a study by the same authors on the Silurian Mereenie Sandstone, NT, Australia (Shillito & Davies, Citation2021), and then built upon by Gougeon et al. (Citation2023) who described outcrop morphologies from four sections of the Ediacaran–Cambrian Chapel Island Formation of Newfoundland (Canada). Through comparing the different exposures, the authors identify traits of the different sections that advantage or disadvantage ichnological observations, and use this to inform their conclusions. For example, the site at Point May has mostly vertical cliff sections with limited bedding plane exposure. Where exposed, bed surfaces are also affected by structural cleavage which hampers ichnologic observations. The trace-fossil data set recorded from that site is dominated by vertical structures, with fewer horizontal trace fossils than elsewhere, which is accounted for by biases from outcrop morphology. Conversely, the Cambrian type section at Fortune Head possesses well-exposed vertical profiles and bed surfaces, therefore reinforcing the GSSP status of this section.
This article is the final product of iterating on this method. Here we expand upon it to account for a full range of possible outcrop morphologies and orientations, and to consider the impact of superficial cover and outcrop location.
A new method to record outcrop constraints
Outcrop characterization
The scheme presented here categorizes outcrops on a seven-point scale, ranging from purely horizontal bedding plane exposures, to purely vertical cliff exposures (). Some of the outcrop types listed are mirrors of one another, with steps and plateaus recording bed tops, and the corresponding overhangs recording bed bases. As tops and bases of beds may record different structures it is important to differentiate what is preserved by outcrop type. The seven outcrop types, illustrated in by 3 × 3 unit cubes, are:
Figure 1. Outcrop types block diagrams. An overview of the seven distinct types of outcrop that, alone or in combination, can be used to describe any outcrop morphology. Block diagrams show the hypothetical distribution of observed trace fossils in a 3x3 unit cube, if units contain vertical (blue), horizontal (red) or no (yellow) traces. Grey shows areas which cannot be observed, and missing cubes are those lost to erosion. Pie charts show proportion of existing vertical traces (blue/grey) and horizontal traces (red/grey) which can be observed with a given outcrop style, and the relative bias towards observed vertical/horizontal traces (red/blue) given equal proportions existing within the volume. All schematics show two cases, the upper where vertical and horizontal traces occur in every unit cube, and the lower where vertical and horizontal traces occur in every alternate cube (see key). Where traces do not occur in every unit cube, only those where they are present are taken into account for proportion pie charts. Type 1 – Plateau Exposure. An example of a plateau exposure from the Potsdam Group, NY, USA with schematics. Type 2 – Stepped Plateau Exposure. An example of a stepped plateau exposure from the Mereenie Sandstone, NT, Australia with schematics. Type 3 – Stepped Exposure. An example of stepped exposure from The Loop, Tumblagooda Sandstone, WA, Australia with schematics. Type 4 – Stepped Cliff Exposure. An example of a stepped cliff exposure from Eagle Gorge, Tumblagooda Sandstone, WA, Australia with schematics. Type 5 – Cliff Exposure. An example of cliff exposure from Hawks Head Lookout, Tumblagooda Sandstone, WA, Australia with schematics. Type 6 – Overhang Cliff Exposure. An example of an overhang cliff exposure from the Lastres Formation, Asturias, Spain. Bases of overhang show horizontal trace fossils. Overhang cliff exposure typically occurs where the base of a cliff is preferentially eroded, either due to lithological differences or variable erosion pressures up the rock face, such as in waterfalls. Type 7 – Stepped Overhang Exposure. An example of a stepped overhang exposure from Grand Bank Head, Chapel Island Formation, NL, Canada with schematics. Bases of overhang show horizontal trace fossils. Note this example has undergone some structural rotation.
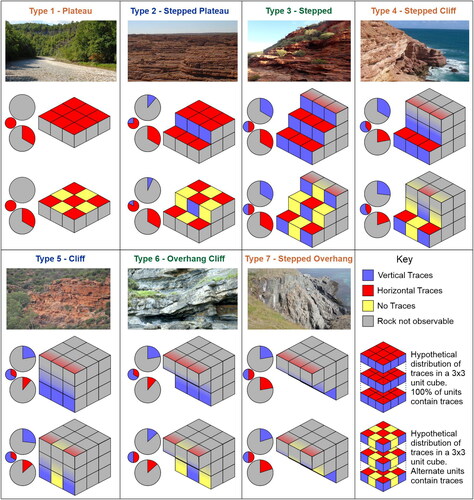
Plateau – exposures consisting almost entirely of flat bedding surfaces.
Stepped Plateau – exposures dominated by bedding planes, but with short vertical sections separating extensive flat areas.
Stepped – exposures formed of an approximately equal proportion (by area) of bedding surfaces and vertical sections.
Stepped Cliff – exposures dominated by vertical sections, but with occasional bedding plane exposures at points up the cliff.
Cliff – exposures consisting almost entirely of shear rock faces of vertical section, with few to no bedding planes.
Overhang Cliff – exposures dominated by vertical sections, but with the bases of some bedding surfaces exposed at points up the cliff.
Stepped Overhang – exposures formed of an approximately equal proportion (by area) of vertical sections and bedding plane bases.
All discrete exposures (i.e. any continuous outcrop of any size) can be described as one of, or a combination of, these morphotypes, at a scale of metres to kilometres. Combinations are notably useful if outcrops expose both bed tops and bases, such as in the case study from the Armorican Sandstone of northwestern France described at the end of this paper. In that case, 5 × 5 unit cubes are employed (e.g. Gougeon et al., Citation2023).
Each block diagram can then be expanded to account for the lateral continuity of sedimentary beds exposed at a site investigated. This is especially relevant when comparing outcrops composed of coeval strata (e.g. Gougeon et al., Citation2023). This evaluation is done by adding or removing unit cubes laterally to the block diagrams. If investigators are able to report exact measurements of the lateral extension of beds at each site, and if lateral bed extension does not vary significantly over the strata investigated, the exact width of the outcrop can be reported on the block diagram and a scale be added. If exact measures are not available, a relative evaluation can be applied instead (cf. Gougeon et al., Citation2023).
The block diagrams in show how the exposure of trace fossils would be expected to vary within the different types of outcrop, in scenarios of either ubiquitous or scattered presence of trace fossils. The large pie charts show that even with stepped exposure, the majority of trace fossils within an area either remain concealed within the rock or are destroyed by erosion. The smallest pie charts consider only the visible trace fossils, showing that even though stepped cliff exposures would result in a skew towards vertical rather than horizontal trace fossils, examples of both should be observed if they were widely present. It is hoped that through reporting these outcrop biases, they can be accounted for when drawing any conclusions about ichnologic diversity within trace-fossil assemblages.
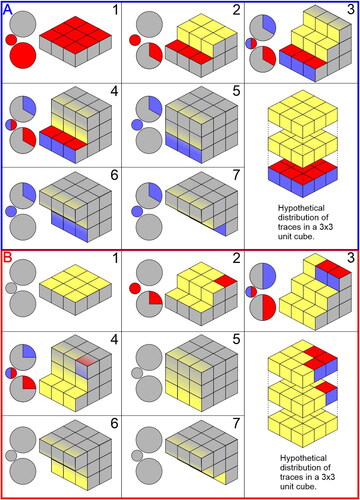
This base model illustrates how trace fossils would be observed with different uniform distributions, but it is just as applicable with non-uniform distributions, such as where trace fossils are restricted to one bedding surface, or to a small patch (). This shows that different original distributions result in subtly different proportions of observable trace fossils, with patchier distributions being more greatly affected by outcrop morphology than uniform distributions. As most trace fossil distributions in nature will be somewhat patchy due to ecological factors (e.g. Mángano et al., Citation2002; McIlroy, Citation2007), this makes it all the more important to report outcrop characteristics in ichnological studies.
Figure 2. Two examples of non-uniform trace-fossil distribution shown in the seven different types of outcrop exposure. Only unit cubes where trace fossils are present are taken into account for proportion pie charts (hence e.g. B3 exposes 50% of potential trace fossils). (A) All outcrop types shown where vertical and horizontal traces only occur in a single bed, distribution illustrated in key. (B) All outcrop types shown where vertical and horizontal traces only occur in four unit blocks in the top right corner, distribution illustrated in key.
Structural orientation and deformation
Any post depositional tectonic deformation of the bedding adds an extra level of complexity. Tilted bedding results in rotated forms of the horizontally bedded outcrop types (), with shifted areas of inaccessibility: up-dip parts of all beds are inaccessible due to being high in the rock face, rather than all beds further up-section in unrotated cliff-type exposures. Because of the shift in what is accessible it is important to record dip of the strata, as well as the relative orientation of the dip to the outcrop belt (e.g. Shillito & Davies, Citation2020). We recommend illustrating this with block diagrams as in , as well as providing quantitative information.
Figure 3. Examples of severely rotated outcrops, illustrating how structural effects modify the outcrop styles from the model. The amount of rotation is indicated by the arrow and numerical value on the right side of the block diagrams. (A) A cliff from the Silurian-Devonian Cowie Formation, Stonehaven, Scotland. The rock has been tilted 90°, and the bedding plane is parallel to the cliff face resulting in a rotated stepped plateau-type (2) exposure. Up-section, rotated cliff-type exposures occur on the foreshore (e.g. ). (B) Cliffs from the Silurian Old Red Sandstone of Pembrokeshire, Wales. The rock has been tilted 90°, but the cliff face is irregular leading to a rotated stepped-type (3) exposure. (C) Cliffs from the Silurian Old Red Sandstone of Pembrokeshire, Wales. The rock has been tilted 80°, and the bedding plane is perpendicular to the cliff face resulting in a rotated cliff-type (5) exposure.
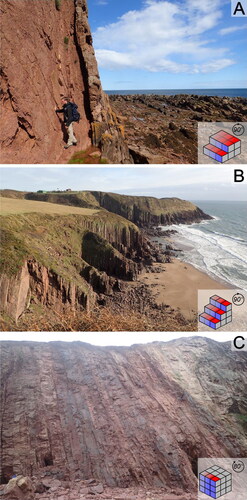
The most extreme examples of structural effects are seen when bedding has been rotated a full 90°, so that beds are perpendicular to the ground. In these cases, orientation of strike relative to orientation of cliffs affects the outcrop type, and hence the observations that can be made. Where strike is parallel to the outcrop, rock faces are rotated plateau type exposures (), whereas where strike is perpendicular, rock faces are rotated cliff type exposures ().
Clear examples of these end members come from the Old Red Sandstone of the UK. In Pembrokeshire, much of the outcrop is vertically dipping and striking perpendicular to the rock face. This leads to thick sections of rotated cliff-type exposures () and rotated stepped-type exposures (). In many of these outcrops vertical trace fossils are readily observable (Morrissey et al., Citation2012; Morrissey & Braddy, Citation2004), but due to the relative paucity of bedding surfaces, horizontal trace fossils appear less abundant. In the Midland Valley, the Cowie Formation crops out with a similarly steep dip along the coast. However, in this example, the dip is parallel to the rock face, which leads to rotated cliff-type exposures in the foreshore, and rotated stepped plateau-type exposures in the rock face (). Trace fossils are observed on the scant bedding surfaces that are accessible, but the restrictive outcrop style hampers the investigation (Shillito & Davies, Citation2017).
The probability of strata having significant tectonic dip increases with age, due to the increased likelihood of having been impacted by tectonic events. For example, in the UK, Neoproterozoic to Silurian strata have an average dip of approximately 55°, Devonian to Carboniferous strata 24°, and Permian to Pleistocene strata 4° (Craig et al., Citation2024). There is also significant geographic variation: regions that have experienced Phanerozoic orogenic events (e.g. much of Europe, western North and South America) are far more likely to have reoriented bedding than those within tectonically stable cratons (e.g. much of Africa, Australia). Depending on the focus of the study, increased dip can be favourable for observations as it can lead to an increase in the stratigraphic thickness that can be readily sampled at the cost of reduced lateral continuity of beds (depending on the orientation of dip to the outcrop belt).
Superficial cover
In addition to the raw morphology and orientation of the beds, quality of observations that can be made are also limited by superficial cover of the outcrop. This can be by near-permanent features, such a Quaternary drift; biological features, such as vegetation or encrusting animals; and transient features, such as snow, ice, or beach. Drift cover is already commonly accounted for in geological studies by recording exposed outcrop extent, and we recommend no changes to this practice. However, less permanent outcrop cover is often undescribed, and yet just as disruptive when attempting to make representative observations ().
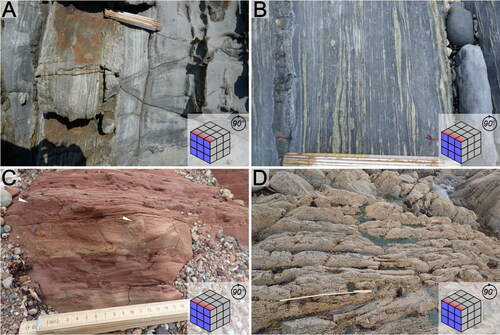
Figure 4. Examples of superficial cover of strata, resulting in reduced outcrop quality. (A) The Silurian Barlow Inlet Formation, Cornwallis Island, Canada. The outcrop is a stepped cliff-type (4) exposure, but is partially obscured by snow. This photo was taken in July, after much of the snow had melted but before the outcrop was completely exposed – approximately 20% remains under superficial cover. (B) The Ordovician Wallowbarrow Tuff Formation, Cumbria, England. The outcrop is a stepped plateau-type (2) exposure, but is partially obscured by vegetation. Before efforts were made to clear the exposure, the outcrop was partially covered in moss, and turf covered the leftmost region. This was successfully peeled back in order to make observations. This photo was taken in April. (C) Cambrian mudrock, Gaspé, Quebec, Canada. The outcrop is rotated cliff-type (5) exposure, and is partially obscured by the level of the beach and encrusting seaweed. Approximately 40% of the strata are hidden under beach cover, and a further 30% are obscured by seaweed. This photo was taken in August, so it is expected that this is towards the higher end of the beach level, and in winter more would be exposed.
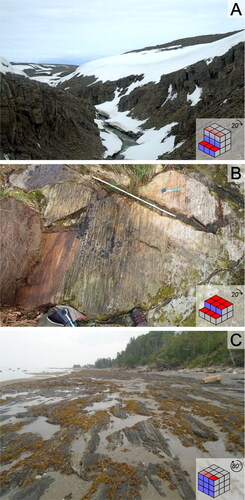
Here we recommend that superficial cover is illustrated with representative photographs of the outcrop, along with description of any efforts that have been made to clear the cover. An approximate percentage of the outcrop that is obscured by cover should be recorded, where possible splitting this for bedding planes vs vertical exposures. Additionally, it is important to note the dates of field visits to any sites to maximise reproducibility, as superficial cover is often highly seasonally variable. With vegetation, growth predominantly occurs in warmer, sunnier months obscuring more of the outcrop, but dies back in the winter improving visibility of the exposure. Contrasting this, snow or ice cover will occur from winter until melting occurs, although for fieldwork at high latitudes (or high altitudes) this can last for most of the year. Beach cover also varies seasonally, with sediment being stripped by storm activity in the winter and accumulating during the summer. This means that outcrops that are visible in the spring may be entirely covered by sediment in the autumn.
Outcrop location
Finally, the spatial location of the outcrop relative to dynamic features of the environment affect observations that can be made. This is most obvious with the effect of tides on observing coastal rock exposures. For these outcrops it is important to record whether exposures are fully submerged at any part of the tidal cycle, or whether access to outcrops is cut off at parts of the tidal cycle. In addition to a limited observation window, outcrops that are intermittently submerged are altered due to extended periods of time underwater. This can be a positive, resulting in polishing of sections by the tide which enhances visibility of otherwise hard to see structures (). Alternatively, it can lead to an increase in superficial cover due to encrustation by barnacles and other animals, to the growth of seaweed or algae on the rock surfaces (), or to the obliteration of horizontal trace fossils by erosion (see Armorican Sandstone Formation case study).
Figure 5. Examples of strata above and below the tide line, demonstrating how tidal action affects outcrop quality. (A–B) Cambrian-Ordovician Los Cabos Formation, Asturias, Spain. (A) shows part of the exposure above the tide line, the rock face is somewhat weathered and dusty, and it is difficult to make out any detail of trace fossils. (B) shows part of the same exposure below the tide line. The rock face has been polished by regular submersion, is clean, and details of trace fossils are clear. (C–D) Silurian-Devonian Cowie Formation, Stonehaven, Scotland. (C) shows part of the exposure above the tide line. The outcrop is partially concealed by the gravel beach, but is otherwise clean and unobscured by organic cover. Burrows can be clearly observed (white arrows). (D) shows part of the same exposure below the tide line. In contrast to the Los Cabos exposure, outcrop below the tideline here is almost entirely (∼90%) encrusted by barnacles, rendering the observation of trace fossils impossible. All four outcrops illustrated in this figure are rotated cliff-type (5) exposures.
Contrasting observations of exceptional and limited outcrop
To highlight the value of a rigorous approach to describing outcrop, we provide two short case studies that have very different ichnological expressions in areas of exceptional versus restricted outcrop.
Inland vs. coastal variability: the Tumblagooda sandstone of Western Australia
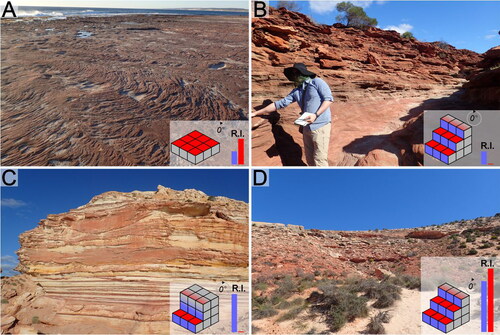
The Tumblagooda Sandstone, the case for which this method was originally developed, differs in outcrop style between inland and coastal exposures (Shillito & Davies, Citation2020). The coast is dominated by cliffs with some plateaus towards the foreshore, and inland exposures are largely stepped outcrop (). This suggests that the coastal exposures, particularly facies recorded in the cliffs, are biased towards observation of vertical structures, whereas inland exposures should be more representative of the full ichnofauna. Two facies associations crop out both along the coast and inland, so these can be used to verify whether the different outcrop signature biases ichnologic observations as would be expected.
Figure 6. A case study from the Tumblagooda Sandstone of Western Australia illustrating how different outcrop morphology of the same facies associations (i.e. FA3 in A and B, and FA4 in C and D) can affect ichnodiversity measurements. Block diagrams illustrate outcrop morphology. Bars illustrate relative ichnodiversity (R.I.) of the section, with horizontal traces in red and vertical traces in blue. For reference, ichnodiversity of vertical traces in A is 1, and of horizontal traces is 2. (A) Coastal exposures of FA3 are extensive plateaus and the bases of cliffs (shown in bottom part of 6 C). The significant bedding plane area allows traces with a patchy distribution to be observed where they may not be exposed with other outcrop morphologies. (B) Inland exposures of FA3 are stepped outcrops with smaller bedding surfaces, and no horizontal traces are observed. (C) Coastal exposures of FA4 are cliff-type outcrops, and hence biased towards observations of vertical trace fossils. (D) Inland exposures of FA4 are stepped outcrops, hence any horizontal traces that are present are observable, conversely to coastal exposures.
Facies Association 3 crops out on the coast in the bases of the cliffs and on the foreshore as plateaus, and as stepped outcrop in gullies inland. For this facies association there were more horizontal structures observed in coastal exposures, likely due to the greater areal extent of bedding surfaces mitigating lateral heterogeneity in the ichnofauna (; cf. Marenco & Hagadorn, Citation2019). Increased observations of horizontal trace fossils on plateaus is predicted by our outcrop characterization method, and the additional information provided by the bases of cliffs and stepped inland exposure was ideal to accurately observe the full ichnological signature ().
Facies Association 4 crops out almost entirely in cliff type exposures along the coast, and stepped exposures inland. Coastal outcrops are dominated by vertical structures, because the outcrop is not suitable for observing horizontal trace fossils (). However, comparison with inland outcrops reveals that this is due to bias caused by the morphology of the outcrop, as stepped exposures of the same facies association have a far more diverse ichnofauna with an additional suite of horizontal trace fossils (). This illustrates that even where outcrop is extensive and well exposed, the morphology of the outcrop can lead to biased observations that need to be accounted for.
Influence of modern tides: the Armorican sandstone formation of northwestern France
The Lower Ordovician Armorican Sandstone Formation of Brittany in France crops out in multiple sites along the shoreline of Crozon peninsula. The succession is composed of three members, of which the intermediate heterolithic member of thinly laminated to thin-bedded mudstone and sandstone is most subject to coastal erosion from frequent waves, storms, and tidal activity. Lower and upper members are dominated by quartzitic sandstone beds and are more resistant to erosion (especially the lower), composing some of the most prominent reliefs of the coastline (e.g. 70 m-high cliffs at Pointe de Pen-Hir). Recent investigations at Morgat and Kerroux () reveal that data sets recovered from coeval strata can differ significantly in their trace fossil signatures.
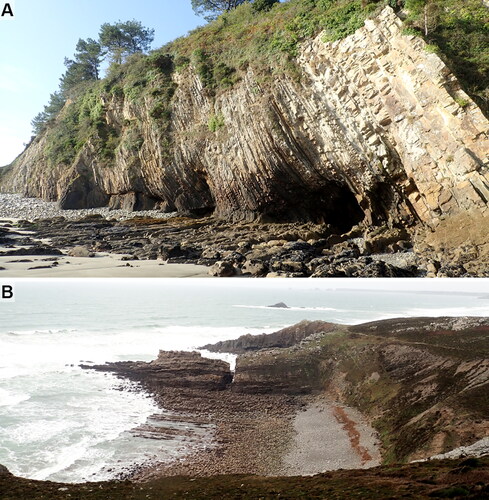
Figure 7. A case study from the Armorican Sandstone Formation of northwestern France illustrating the impact of modern tides on trace-fossil observations. Block diagrams depicting outcrop quality for the two sites can be found on . (A) Beds of the intermediate and upper member at Morgat are exposed on a cliff face and are easily accessible by foot on a beach. Note the good exposure of both vertical profiles and bed bases and tops, enhanced by the presence of local caves at the base of the cliff. The site is mostly considered a stepped exposure (). (B) Beds of the intermediate and upper member at Kerroux are only accessible at low tides, and are severely affected by the erosive action of modern waves, storms, and tides. Gaps of exposure and polishing of bed surfaces are common (), rendering the preservation potential of horizontal trace fossils low.
The data sets that were collected consist of sedimentary structures and other sedimentologic characters, vertical and bed surface bioturbation, ichnodiversity and ichnodisparity, and the stratigraphic appearance of trace fossils () (see Gougeon, Citation2023 and Gougeon et al., Citation2023 for full details on data curation methods). At Morgat, strata are accessible by foot, especially at low tides, with rocks dipping at 70° and visible on the cliff face (). This section is 197.2 m thick and consists of the upper part of the lower member, the complete intermediate member, and the lower part of the upper member. Due to the stepped nature of the outcrop at Morgat (), comprehensive data curation was easy to proceed with. The only difficulties resulted from partial vegetation cover in some areas of the rock surface, and local faulting rendering some stratigraphic intervals inaccessible because of their exposure high-up on the cliff face. Vertical trace fossils are easily spotted, and multiple bed surfaces were available for the study and collection of data on horizontal trace fossils.
Figure 8. Sedimentologic and ichnologic data sets from two sections of the Armorican Sandstone Formation in northwestern France. LM = lower member; IM = intermediate member; UM = upper member; f/m mudstone = fine/medium mudstone; ls = limestone; f/m/c sandstone = (very) fine/medium/(very) coarse-grained sandstone; cg = conglomerate; BI = bioturbation index (i.e. vertical bioturbation); BPBI = bedding plane bioturbation index (i.e. bed surface bioturbation); Rossel. = Rosselia, and M. = Monomorphichnus. See Gougeon (Citation2023) and Gougeon et al. (Citation2023) for details on methodology for data curation. (A) Morgat hosts an excellent ichnologic data set from the intermediate member as a result of ideal stepped exposure observable on a cliff face. (B) Kerroux has a much more limited ichnologic data set, with dominance of vertical trace fossil observed. Strata at this locality are exposed within the modern tidal range, and bed surfaces of intermediate and basal upper member are continuously eroded by waves, storms, and tides, significantly reducing the preservation potential of horizontal trace fossils.
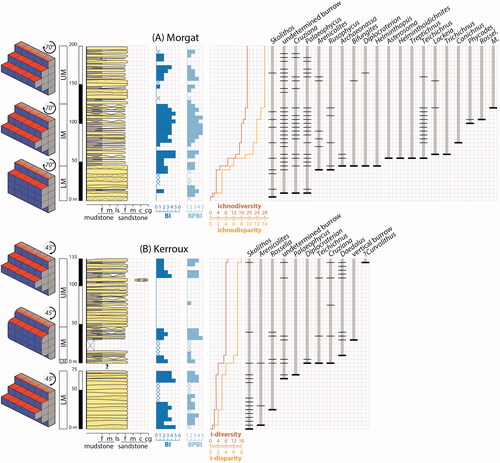
Coeval strata at Kerroux expose a total of 210 m of strata, including a good portion of the lower member, the intermediate member, and the basal part of the upper member of the Armorican Sandstone Formation. The lower member is visible on the cliff face and easily accessible on a beach; beds are dipping at 45°, and like Morgat, this interval crops out as a stepped exposure (). The situation is more complex for the intermediate member and basal portion of the upper member, as strata are submerged at high tides on a modern tidal flat (). Despite a stratal dip of 45° and the common exposure of both vertical and horizontal surfaces of beds, the constant action of waves and tides tends to erode bed surfaces, significantly reducing the potential to observe horizontal trace fossils, especially those with delicate features (e.g. incisive elements of arthropod trackways). Consequently, apparent trace fossil diversity is significantly skewed at that site and is biased towards the preservation of vertical burrows (). Evaluation of outcrop quality is therefore essential to untangle this bias and accurately evaluate paleoecologic changes that are evidenced at Crozon. Ultimately, this evaluation enables the accurate assessment of local bioturbation and ichnodiversity changes, permitting inferences on global evolutionary trends related to the Ordovician radiation.
Summary
This article serves two main purposes. First, we re-emphasize that ichnofaunas are often laterally heterogeneous on small (meter) scales. This means that the size and shape of outcrops from which observations are made places significant constraints on those observations. Larger, more continuous outcrops will lead to more representative observations than smaller, patchier outcrops or cores, as more of the innate variability will be observable.
Second, we present a novel method for recording outcrop characteristics when undertaking sedimentological fieldwork, particularly ichnological work. This method is a straightforward categorization that will provide additional information about potential biases within data sets caused by the physical attributes of the outcrop. This information is currently missing from the majority of studies, and yet is one of the most significant factors in determining what observations can be made. Evaluation of outcrop quality is a procedure that should not be overlooked as the type of exposure affects the breadth and quality of ichnologic data that can be recovered, therefore impacting any interpretation of paleoecology and animal evolution. It is hoped with the introduction of this method that ichnologic field studies will better account for those potential biases.
Acknowledgments
We thank N. Davies, G. Mángano and L. Buatois for discussions that helped us shaping those ideas and the method. We thank the editors for their constructive reviews that improved the manuscript.
Disclosure statement
No potential conflict of interest was reported by the author(s).
Additional information
Funding
References
- Bottjer, D. J., & Droser, M. L. (1991). Ichnofabric and basin analysis. PALAIOS, 6(3), 199–205. https://doi.org/10.2307/3514901
- Bromley, R. G., & Pedersen, G. K. (2008). Ophiomorpha irregulaire, Mesozoic trace fossil that is either well understood but rare in outcrop or poorly understood but common in core. Palaeogeography, Palaeoclimatology, Palaeoecology, 270(3–4), 295–298. https://doi.org/10.1016/j.palaeo.2008.07.017
- Cosson, N., Sibuet, M., & Galeron, J. (1997). Community structure and spatial heterogeneity of the deep-sea macrofauna at three contrasting stations in the tropical northeast Atlantic. Deep Sea Research Part I: Oceanographic Research Papers, 44(2), 247–269. https://doi.org/10.1016/S0967-0637(96)00110-0
- Craig, J. A., Battle, R. J., Veenma, Y. P., McMahon, W. J., Slater, B. J., Shillito, A. P., & Davies, N. S. (2024). Fidelity of earth history archives unrelated to rock quantity unevenness through geologic time. [Manuscript Submitted for Publication]
- Davies, N. S., & Shillito, A. P. (2018). Incomplete but intricately detailed: The inevitable preservation of true substrates in a time-deficient stratigraphic record. Geology, 46(8), 679–682. https://doi.org/10.1130/G45206.1
- Davies, N. S., & Shillito, A. P. (2021). True substrates: The exceptional resolution and unexceptional preservation of deep time snapshots on bedding surfaces. Sedimentology, 68(7), 3307–3356. https://doi.org/10.1111/sed.12900
- Davies, N. S., Shillito, A. P., & McMahon, W. J. (2017). Short-term evolution of primary sedimentary surface textures (microbial, abiotic, ichnological) on a dry stream bed: Modern observations and ancient implications. PALAIOS, 32(3), 125–134. https://doi.org/10.2110/palo.2016.064
- Davies, N. S., Shillito, A. P., & McMahon, W. J. (2019). Where does the time go? Assessing the chronostratigraphic fidelity of sedimentary rock outcrops in the Pliocene-Pleistocene Red Crag Formation, eastern England. Journal of the Geological Society, 176(6), 1154–1168. https://doi.org/10.1144/jgs2019-056
- Dorador, J., & Rodríguez-Tovar, F. J, I.O.D.P. (2014). Digital image treatment applied to ichnological analysis of marine core sediments. Facies, 60(1), 39–44. https://doi.org/10.1007/s10347-013-0383-z
- Dorador, J., & Rodríguez-Tovar, F. J. (2018). High-resolution image treatment in ichnological core analysis: Initial steps, advances and prospects. Earth-Science Reviews, 177, 226–237. https://doi.org/10.1016/j.earscirev.2017.11.020
- Dörjes, J. (1972). Distribution and zonation of macrobenthic animals. Senckenberg. Marit, 4, 183–216.
- Frey, R. W., Hong, J. S., Howard, J. D., Park, B. K., & Han, S. J. (1987). Zonation of benthos on a macrotidal flat, Inchon, Korea. Senckenbergiana Maritima, 19, 295–329.
- Gougeon, R., Mángano, M. G., Buatois, L. A., Narbonne, G. M., Laing, B. A., & Paz, M. (2023). The Ediacaran–Cambrian Chapel Island Formation of Newfoundland, Canada: Evaluating the impact of outcrop quality on trace-fossil data sets at the Cambrian GSSP and less-explored sections. Canadian Journal of Earth Sciences, 60(7), 897–911. https://doi.org/10.1139/cjes-2022-0060
- Gougeon, R. (2023). The chapel island formation of newfoundland (Canada) revisited: Integrating ichnologic and sedimentologic datasets to unravel early metazoan evolution [PhD dissertation, University of Saskatchewan].
- Kikuchi, K., Naruse, H., & Kotake, N. (2018). Evaluation of ichnodiversity by image-resampling method to correct outcrop exposure bias. PALAIOS, 33(5), 204–217. https://doi.org/10.2110/palo.2017.090
- Knaust, D. (2012). Methodology and techniques. In D. Knaust & R. G. Bromley (Eds.), Trace fossils as indicators of sedimentary environments. Developments in sedimentology (Vol. 64, pp. 245–271). Elsevier.
- Knaust, D. (2017). Atlas of trace fossils in well core: Appearance, taxonomy and interpretation. Springer.
- Kotler, B. P., & Brown, J. S. (1988). Environmental heterogeneity and the coexistence of desert rodents. Annual Review of Ecology and Systematics, 19(1), 281–307. https://doi.org/10.1146/annurev.ecolsys.19.1.281
- Mángano, M. G., Buatois, L. A., West, R., & Maples, C. G. (2002). Ichnology of an equatorial tidal flat: The stull shale member at waverly, Eastern Kansas. Bulletin of the Kansas Geological Survey, 245, 130.
- Marenco, K. N., & Hagadorn, J. W. (2019). Big bedding planes: Outcrop size and spatial heterogeneity influence trace fossil analyses. Palaeogeography, Palaeoclimatology, Palaeoecology, 513, 14–24. https://doi.org/10.1016/j.palaeo.2018.08.008
- McIlroy, D. (2007). Lateral variability in shallow marine ichnofabrics: Implications for the ichnofabric analysis method. Journal of the Geological Society, 164(2), 359–369. https://doi.org/10.1144/0016-76492005-101
- Morrissey, L. B., & Braddy, S. J. (2004). Terrestrial trace fossils from the lower old red sandstone, Southwest Wales. Geological Journal, 39(3–4), 315–336. https://doi.org/10.1002/gj.991
- Morrissey, L. B., Hillier, R. D., & Marriott, S. B. (2012). Late silurian and early devonian terrestrialisation: Ichnological insights from the lower old red sandstone of the Anglo-Welsh Basin, UK. Palaeogeography, Palaeoclimatology, Palaeoecology, 337–338, 194–215. https://doi.org/10.1016/j.palaeo.2012.04.018
- Nami, M. (1976). An exhumed Jurassic meander belt from Yorkshire, England. Geological Magazine, 113(1), 47–52. https://doi.org/10.1017/S0016756800043004
- Nanglu, K., & Cullen, T. M. (2023). Across space and time: A review of sampling, preservational, analytical, and anthropogenic biases in fossil data across macroecological scales. Earth-Science Reviews, 244, 104537. https://doi.org/10.1016/j.earscirev.2023.104537
- Pemberton, S. G. (1992). Applications of Ichnology to Petroleum Exploration: A Core Workshop. Society for Sedimentary Geology Core Workshop, 17, 442. Tulsa.
- Pemberton, S. G., Spila, M., Pulham, A. J., Saunders, T., MacEachern, J. A., Robbins, D., & Sinclair, I. K. (2001). Ichnology and Sedimentology of Shallow to Marginal Marine Systems. Ben Nevis and Avalon Reservoirs, Jeanne d’Arc Basin. Geological Association of Canada Short Course Notes 15, St. John’s, p. 641.
- Petersen, J. F. (2002). The role of roadcuts, quarries, and other artificial exposures in geomorphology education. Geomorphology, 47(2–4), 289–301. https://doi.org/10.1016/S0169-555X(02)00095-8
- Rodríguez-Tovar, F. J., Dorador, J., Mayoral, E., & Santos, A. (2017). Outcrop and core integrative ichnofabric analysis of Miocene sediments from Lepe, Huelva (SW Spain): Improving depositional and paleoenvironmental interpretations. Sedimentary Geology, 349, 62–78. https://doi.org/10.1016/j.sedgeo.2017.01.001
- Shillito, A. P., & Davies, N. S. (2017). Archetypally Siluro-Devonian ichnofauna in the Cowie Formation, Scotland: Implications for the myriapod fossil record and Highland Boundary Fault movement. Proceedings of the Geologists’ Association, 128(5–6), 815–828. https://doi.org/10.1016/j.pgeola.2017.08.002
- Shillito, A. P., & Davies, N. S. (2019). Dinosaur-landscape interactions at a diverse Early Cretaceous tracksite (Lee Ness Sandstone, Ashdown Formation, southern England). Palaeogeography, Palaeoclimatology, Palaeoecology, 514, 593–612. https://doi.org/10.1016/j.palaeo.2018.11.018
- Shillito, A. P., & Davies, N. S. (2020). The Tumblagooda Sandstone revisited: Exceptionally abundant trace fossils and geological outcrop provide a window onto Palaeozoic littoral habitats before invertebrate terrestrialization. Geological Magazine, 157(12), 1939–1970. https://doi.org/10.1017/S0016756820000199
- Shillito, A. P., & Davies, N. S. (2021). The Silurian inception of inland desert ecosystems: Trace fossil evidence from the Mereenie Sandstone, Northern Territory, Australia. Journal of the Geological Society, 178(4). https://doi.org/10.1144/jgs2020-243
- Stephen, K. D., Clark, J. D., & Gardiner, A. R. (2001). Outcrop-based stochastic modelling of turbidite amalgamation and its effects on hydrocarbon recovery. Petroleum Geoscience, 7(2), 163–172. https://doi.org/10.1144/petgeo.7.2.163
- Swinbanks, D. D., & Murray, J. W. (1981). Biosedimentological zonation of Boundary Bay tidal flats, Fraser River Delta, British Columbia. Sedimentology, 28(2), 201–237. https://doi.org/10.1111/j.1365-3091.1981.tb01677.x
- Thrush, S. F. (1991). Spatial patterns in soft-bottom communities. Trends in Ecology & Evolution, 6(3), 75–79. https://doi.org/10.1016/0169-5347(91)90178-Z
- Winemiller, K. O., Flecker, A. S., & Hoeinghaus, D. J. (2010). Patch dynamics and environmental heterogeneity in lotic ecosystems. Journal of the North American Benthological Society, 29(1), 84–99. https://doi.org/10.1899/08-048.1
- Zeppilli, D., Pusceddu, A., Trincardi, F., & Danovaro, R. (2016). Seafloor heterogeneity influences the biodiversity–ecosystem functioning relationships in the deep sea. Scientific Reports, 6(1), 26352. https://doi.org/10.1038/srep26352