
 ?Mathematical formulae have been encoded as MathML and are displayed in this HTML version using MathJax in order to improve their display. Uncheck the box to turn MathJax off. This feature requires Javascript. Click on a formula to zoom.
ABSTRACT
The purpose of this paper is to demonstrate the easy manufacturing and quick characterization of several microtextured functional surfaces on two transparent thermoplastics of general interest for several industrial sectors. Microtextured polymeric surfaces with special optical, tribological and easy-cleaning properties were manufactured via isothermal injection-molding using laser-microtextured steel mold inserts. For that purpose, conventional injection molding of two chosen amorphous transparent polymers (polycarbonate, PC, and polymethyl methacrylate, PMMA) utilizing laser-microtextured steel inserts was carried out, and a detailed morphological and functional characterization of the injected specimens was conducted later on. We also report on the suitable process conditions for the injection molding of these specimens using design of experiment (DOE) techniques. The analysis of the degree of replication (DR%) on the injected samples shows that mold temperature and injection speed are the most relevant parameters to obtain a successful replication and confirm the viability of conventional injection molding as a processing technique to obtain microtextured functional surfaces in amorphous transparent thermoplastics. The success of the procedure is further checked by the confirmation of the obtained surface functionalities by various standard and self-developed methods.
Introduction
Injection molding of specimens with micro- and nanostructured faces, which enhance or modify their surface functionality, constitutes a technology of rising interest in a wide variety of sectors and applications within the industry. Numerous publications are being focused nowadays on the study and manufacturing of polymeric specimens for a variety of applications. Relevant examples correspond to microfluidic chips,[Citation1] optical lenses,[Citation2] structural coloration of polymers,[Citation3] isolation of specific cells[Citation4] or enhancement of mechanical properties,[Citation5] amongst others.
For the production of such specimens, one of the technologies with higher industrial potential is the injection molding using laser-textured metallic mold inserts, due to its practicality and ease of integration in standard injection molds. In this technique, the negatively patterned surface on the metallic insert (commonly nickel or steel) is carried out via lithography & plating processes[Citation6] or laser ablation techniques[Citation7–10] to directly remove material from the metallic plate surface in a periodical fashion.
This mastered material can then be introduced as a tool insert inside the injection mold for the manufacturing of the final polymeric specimen, which once injected will have the complementary positive texture on its surface.[Citation2,Citation8,Citation11]
On the injection molding phase, the main factors influencing the quality of the replication are the election of the injected polymer, the geometry of the mold and cavities to be filled, mold temperature, melt temperature, injection & holding pressure, cooling time and injection speed as shown by numerous previous studies.[Citation12–15] While there are differences in the main processing parameters affecting replication, there seems to be a general agreement on the fact that high melt and mold temperature, high injection speed, and high holding pressure have a positive effect on the melt flow in micro- and nanometer-sized cavities. Exhaustive reviews around the influencing factors were performed by Maghsoudi et al. and Attia et al..[Citation16,Citation17] Considering mold temperature, packing pressure, and injection speed as the factors with highest relevance on the particular process presented here (PC and PMMA injection molding over micro-textured steel inserts), a determination of the factors with the highest influence investigated via a DOE is presented in this study.
Concerning the surface characterization of the injected polymeric specimens, a double testing on the surface of the resulting molded specimens (morphological and functional) is carried out in order to investigate both the replication degree and the acquired/enhanced surface functionality achieved by the microstructure. Confocal microscopy is used to characterize the replicated surfaces, the reference technique when characterizing of transparent polymers.[Citation18,Citation19] In the case of surface functional characterization, various tests can be performed to determine the effectivity of the four functionalities designed on the laser-microtextured steel inserts: light diffusion, light guiding, easy to clean and anti-scratch.
To evaluate the effectivity of the injected light-diffusive structures, a quick test to measure luminance, homogeneity, and percentage of change versus a non-structured surface is conducted.[Citation20] On the other hand, the light-guiding effectivity of microstructures on the injected specimens was evaluated by a high sensitive device that was able to register the luminance of the perpendicularly guided light (Fig. S3 on S.I.).
It is well known that micro- and nanotextures can modify the tribological performance properties of polymeric surfaces.[Citation21,Citation22] The particular anti-scratch microstructure studied in this paper is evaluated by various micro indentation and micro-scratch tests, following previously reported techniques.[Citation23–25] Surface roughness parameters were measured and correlated with the variations on user perceptions of the scratch-visibility. The easy-to-clean functionality is qualitatively evaluated – due to the lack of suitable standard test methods – by combining water contact angle measurements[Citation26] and a quick dust-wiping effectivity test inspired by Haines.[Citation27]
The overall objective of the work presented was to confirm the validity of conventional injection molding as a suitable method for the successful replication of functional microtextures in amorphous transparent thermoplastics and to obtain the most relevant influencing parameters. The aim was also to confirm the investigated surface functionalities using conventional and novel characterization techniques in the absence of relevant testing standards in some of the presented cases.
Materials and methods
Injection molding materials
The injection molding experiments were conducted using mainly a polycarbonate polymer, but in some cases (i.e., optical characterization) polymethyl methacrylate was also used for comparison purposes. The specific selected polymers were:
Polycarbonate (PC) from the company Covestro (Makrolon 2207 – grade 550115-Crystal Clear).[Citation28]
Polymethyl methacrylate (PMMA) from the company Evonik (Plexiglas 8N Clear).[Citation29]
Both materials were dried prior to the injection molding trials: PC was dried at 120°C during 4 h, while PMMA was dried at 98°C during 2 h, as recommended by the technical datasheets of the manufacturers.
The injection molding tests were performed at 290°C for PC and 240°C for PMMA, as recommended by the material manufacturers.
Microtextured steel discs
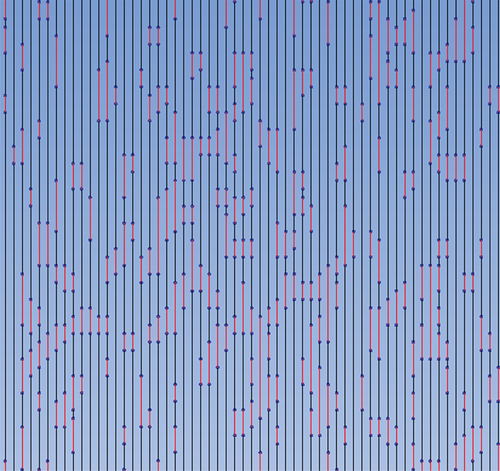
The microtextures were manufactured on one of the sides of steel disc-shaped samples of 30 mm diameter and 5 mm thickness. Inserts were manufactured using laser-ablation techniques with a nano-laser texturing machine, using 220 ns pulse durations, a wavelength of 1068 nm, and a repetition rate of 80 KHz. The power rate and galvo speed of the laser were set to 35 W and 2000 mm/s. The laser used a circular polarization similar to what is stated in ref. [Citation10], but distinctly in our research the laser source was switched on and off several thousand times per layer in a controlled manner to selectively eliminate material across the surface which allows to create a smoother microtopography. This derived in lesser demolding issues upon the latter injection molding trials, as it can be observed in the scheme presented in .
Figure 1. Scheme of the controlled laser switch-off (red lines) along a small zone in one of the passes to create the textured area, on which the normal laser functioning can be observed in black lines.
The four microstructures (named D1, D2, D3, and D5) used in the experiments were designed and manufactured by MICRORELLEUS SL., and their main morphological characteristics and expected functionalities were as follows:
D1 – Homogeneous light-diffusive structure: This microtexture was designed to conceal and homogenize the light coming from a LED or a focal point.This structure followed a Gaussian roughness profile, with a matte visual appearance, an average depth of structures of 50 μm and an arithmetic mean height of line (Saroughness parameter) of 3,024 μm. (upper left image) shows a scheme of the working principle of this microtexture, along with a confocal image. In this case, the microstructure was engraved within the profile of an automotive icon representing a heated-seat according to the manufacturer original design.
Figure 2. Composed images showing the details of the D1, D2, D3, D5 microstructures. Each of the images is composed by: a scheme of the intended observing direction for each functionality (upper left corner); a confocal image showing the microstructure general appearance (upper right corner) with a line drawn on it showing a linear profile (lower right corner) and the place from which is extracted. Finally, a picture of each disc that shows red dots marking the places in which replication degree and uniformity are investigated (lower left corner).
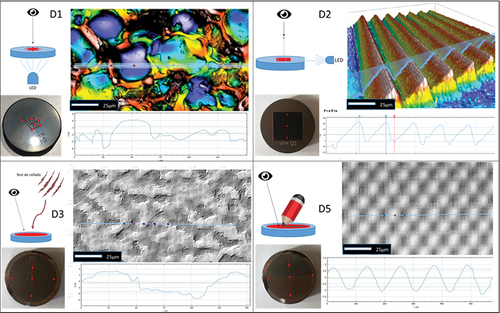
D2 – Light-guiding structure: This microtexture was designed to guide the light passing through a transparent specimen (e.g., PC or PMMA). Light refracts perpendicularly toward the observer with regards to the initial direction of illumination. It had shiny visual appearance and finishing, a peak-to-valley average height of ΔZ = 206 ± 7 μm, and an approximate distance between peaks of ΔL = 315 μm. A scheme of the working principle of this microtexture, along with a confocal image of it can be seen in (upper right image). The microstructure lied within a 1.6 × 1.5 mm rectangle centered on the disk face, according to the manufacturer original design.
D3 - Anti-Scratch: The purpose of this microstructure was to optically hide the scratches produced on the surface of the final polymeric specimen, while increasing the scratch-resistance of the polymer surface over which is practised. The structure followed a Gaussian profile and has an average feature depth of 3-4 μm with a matte-rough finish. A scheme of the working principle of this microtexture, along with a confocal image of it can be seen in (lower left image).
D5 – Easy-to-clean: This microstructure was conceived to give the final injected polymeric specimen a decorative finish (matte & shiny) and an easy cleaning of dust and dirt using water as wiping medium. This is due to the soft peak and valley features present on it that show an average peak-to-valley height of 10 μm. (lower right image) shows a scheme of the working principle of this microtexture, along with a confocal image.
Mold inserts and machinery
All the injection molding and morphological characterization tests were carried out at the facilities of EURECAT.
In order to hold in place the above-explained microtextured discs during the injection molding process, a custom-designed injection mold insert was manufactured. The insert allowed the placement of the microtextured discs interchangeably on the surface of the fixed half in the injection mold in order to carry out replication trials. The insert provided for the adequate flatness, leaving the microtextured face of the disc exposed toward the interior of the cavity at a reduced depth of 1,25 mm with regard to the mold-insert surface. Both insert and injection mold can be seen in .
Figure 3. Composed image showing the injection mold insert developed to hold the microtextured disc in position during the injection molding stage (upper left), pointing its specific placement on the injection mold cavity with a red-dotted arrow and line (upper right CAD-image). Below, a 3D-CAD image of the injected specimen and a processed specimen with a replicated microtextured disc on its center.
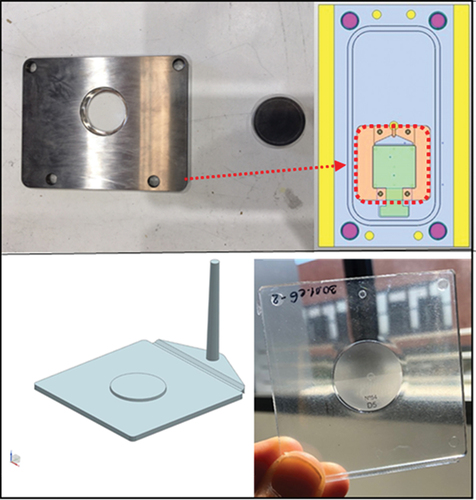
Thus, the injected specimen (a squared plate of 70 × 70 × 2.6 mm) has a cylindrical elevation of 1.25 mm height that is centered on the specimen, on top of which the texture is replicated as can be seen in (lower left image).
The entry of the polymeric material during the injection molding was effectuated through a 6.44 mm diameter circular gate that delivered the molten polymer into the cavity via a fan-type entry. The distance from the circular gate-center to the edge of the injected specimen was 34.40 mm. Main flow region width, thickness, and distance from entry to the microtextured zone of the tool were carefully observed using the polymer flow simulation software MOLDEX. After a careful analysis, all those parameters were considered favorable for a successful replication, as stated in.[Citation30]
For the injection molding trials, an Engel complete E-motion 200/55 electric machine was used. The main technical characteristics of the machine can be seen in .
Table 1. Technical characteristics of the injection-molding machine used for the trials.
The mold inserts were cleaned with isobutanol and let drying at room temperature prior to the start of each tests. Also, they were carefully inspected after each injection round, to confirm the lack of damage or wear on their surface (already observed in the previous related project[Citation14]) using the confocal microscope.
Injection molding experiments and DOE
A factorial design of experiments was applied to check the influence of various relevant process parameters on the replication of the microfeatures present on the insert on injected PC.[Citation12] This method constituted a relevant alternative to check for the highest-influencing processing factor on the expected results. For our specific test setup, a 23 experiment type was used, choosing three molding process factors to check their influence on the final DR% of the microstructures on the injected specimens. The chosen factors were as follows: mold temperature (Tm), injection speed (Vinj) and holding pressure (P). Details of the specific D.O.E. matrix can be seen in the Supporting Information (S.I.) document.
The microtextured steel insert D3 with anti-scratch functionality was chosen for this purpose.
Morphological characterization
For the morphological characterization of the injected samples a Sensofar Plμ 2300 confocal microscope was used, and the images acquired were latter processed by the softwares MountainsMap 5.1 of Digital Surf, and Gwyddion.
The main purpose of this characterization was the determination of the degree of replication, DR%:
where hf is the height of features in the polymeric sample anddc is the depth of cavities in the steel insert.
The DR% parameter is also interesting to check the uniformity of the replicated structures on the injected polymer samples.
Peak heights of features Rp, along with relevant surface roughness parameters such as were measured on the injected samples according to the DIN EN ISO 4827 standard. The overall uniformities of the microtextured surfaces’ profiles were further checked on several relevant points of each of the microtextured icons, as indicated in .
Once the topographies of the microtextured steel discs and the replicated injection-molded specimens were evaluated, the Design of Experiments (DOE) was completed with the help of the software MINITAB 18.
Functional characterization
For the functional characterization, different tests were chosen in order to determine the effectivity of each surface and found a correlation with microstructure morphology in each case:
Light diffusion (D1)
Three of the injected samples of both PC and PMMA materials with light-diffusive microstructures were tested to determine the light-diffusive functionality of the microtexture. For that purpose, maximum and minimum light luminance and homogeneity were determined for the injected samples with the highest DR% by means of illuminating the sample back face on the zone corresponding to the microtexture (placed on the front face) by using a LED light source with known characteristics. Then, the variations on the LED-emitted light characteristics once it had gone through the microtextured sample were registered using an ultra-light-sensitive camera (LMK6–5 color TechnoTeam Bildverarbeitung) placed in front of the microtextured surface (opposite side of the sample). The results were compared with those obtained from illuminating samples of the same untextured materials.
Light-guiding (D2)
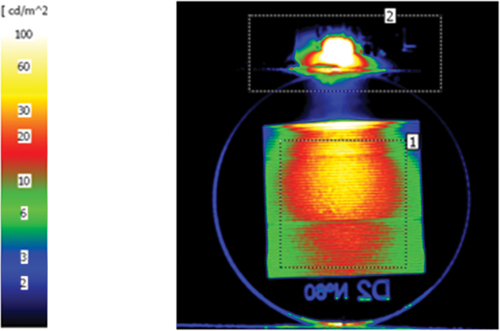
Four samples of PC with light-guiding microstructures and different DR% were illuminated with an LED light of known intensity on one of the sides of the sample (). By doing so, the light traveled through the PC sample and exited it perpendicularly so that a high-sensitivity light-measuring system (LMK6–5 color Techno Team Bildverarbeitung GmbH) could properly be placed in order to measure the relevant light characteristics. In addition, it is important to note that the samples were cut following indications of the adequate LED light source-microstructure distance for optimal guiding supplied by the microstructure manufacturer (i.e., 10 mm).
Figure 4. Image of the measured luminance on LED-source and a microtextured sample. Measured values are displayed in a logarithmic color- scale.
Anti-scratch (D3)
Several surface scratches using a Micro-combi Indentation-Scratch Tester MHT (CSM) were produced on the D3 microtextured samples at the EURECAT facilities. In order to evaluate the coefficient of friction (COF) and the visibility of the residual footprint, scratches with different applied loads (from 2 N to 10 N) and speeds (8 mm/min and 500 mm/min) using a steel ball indenter with 2.5 mm diameter as counterpart were performed. After the scratch tests, relevant surface roughness parameters were determined and the scratch residual imprints were visually inspected and measured using confocal imaging. These results were correlated with changes in the relevant surface roughness parameters (Sa, Sdr and Str) measured before and after producing the scratch.
The three selected parameters initially measured and whose evolution was followed after producing the sample-scratches at different speeds and loads are shown in . They were chosen in order to be correlated with the “scratch hiding ability” of the microstructure and to analyze the visual perception of the various scratches produced.
Table 2. Experimental results of the light-diffusion characterization.
Table 3. Experimental results of the light-guiding measurements.
Easy-to-clean (D5)
Due to the absence of standard procedures to check this effect, a self-made method in which a controlled quantity of very fine-grained talc powder (PRC Panreac) was deposited on the top of the microtextured surface, and then the sample was wiped by dropping ultra-clean water from a fixed distance.
First, the samples were dried in an oven prior to the test (following each material datasheet recommendations) to avoid contributions of absorbed humidity on the weighed sample prior to the test. The dust was deposited on the surface of the discs and its excess was subsequently eliminated in order to obtain a uniform layer. Then, samples were weighed with a high-precision scale. After that, samples were held at an angled position (i.e., 45°) and three equal amounts of 100 μL of ultra-clean water were dropped from a height of 1.5 cm from the upper part of the textured disc, along three positions parallel to the disc horizontal diameter (details are shown in Figure S5 of supplementary information). Finally, the samples were dried for 5 min at 100°C inside an oven and weighted after complete water evaporation. This procedure was followed for all the microtextured and non-microtextured polymer samples and steel discs. After that, the weights of wiped-off dust in each case were compared. Images of samples before and after the water-drop assay were taken for visual comparison.
In addition, water contact angles and their hysteresis were determined for all the injected samples and compared to those determined for the microtextured steel inserts. A tensiometer (Dataphysics OCA 15 CE) and the appropriate image processing software (SCA 2.0) were employed.
Results and discussion
Design of experiments DOE
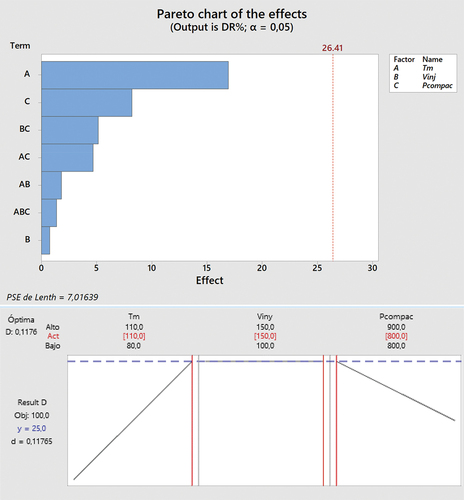
The results of the design of experiments carried out for the PC material were obtained using the microtextured disc of anti-scratch functionality (D3). shows the Pareto chart-plot of the relative effects that the different considered parameters have on replication along as well as the interactions between them.
Figure 5. Results of DOE showing the critical factors and interactions between them in the replication process carried out with PC.(Tm=mold temperature/Vinj= injection speed/Pcompac= holding pressure) and the interaction plot between the selected parameters for an optimized replication response (below).
The mold temperature Tm during the injection molding was the dominant factor of influence on the DR% as expected.[Citation12,Citation15] The holding pressure and its interaction with injection speed represented the second and third highest influencing factors in the process, respectively. The graph also shows a smaller influence of the interaction between Tm and P, and that the interactions between Tm and Vinj were not significant. As expected, for the chosen materials and process parameters, high Tm and P constituted the two most important influencing factors for maximizing DR%.
It is interesting to see that the interaction between Vinj and P had higher relevance than Vinj alone, which is the less influencing factor for the considered DOE. This suggests a very small variation of the polymer viscosity on the short interval where Vinj was tested (i.e., between 100 and 150 mm/s) for the two sets of mold temperatures. It seems that further experimentation with more spaced Vinj andTm values is necessary to check with better accuracy the influence of Vinj.
Topographic analysis
Light-diffusion microstructure (D1)
For all the different tested injection molding conditions, DR% reached average values between 68% and 95%. For the conditions in which the best replication was achieved (i.e., 95%), the injected PC samples showed a variation on the Sa roughness of the microtopography around ±10% between the different tested zones in the samples (see , upper left and right images). This was a clear sign of a uniform DR% across the whole microtextured surface. Nevertheless, this small variation in the DR% may be a consequence of small differences in the thickness of the microtextured discs (reaching values of up to 0.01 mm in some points). Note that these differences could cause a non-satisfactory adjustment of the textured disc inside the manufactured custom mold. This feature could lead to small deviations on the flatness of the injected sample and the observed DR% variations amongst the various zones of the sample.
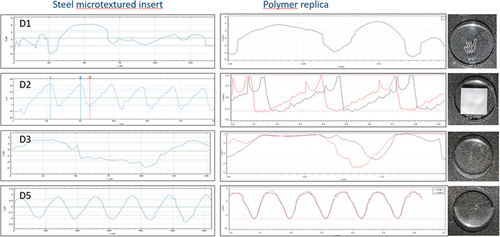
compares the linear profiles of the D1 microtextured steel (left) and the microtextured surface of the injection molded PC sample with the highest DR% (i.e., Tm/Vinj/P molding conditions of 110°C 100 mm/s and 900 bar).
Figure 6. Linear profile extracted from confocal images of the microtextured D1, D2, D3 and D5 steel inserts (left column), and from PC injected specimens (right column). The general appearances of the injected specimens are shown on the right margin.
Light-guiding microstructure (D2)
(second row-profile on the left) compares the linear profiles of the microtextured steel insert D2 and the textured surface of the injected PCsample at the molding conditions (i.e., Tm/Vinj/P of 110°C 100 mm/s and 800 bar, respectively) that gave rise to the highest replication degree (DR%).
DR% ranged from averages of 80% to 150% depending on the different conditions applied. The values obtained suggested an unusual elongation of the features in the case of injection conditions associated to the highest replication degree. These elongations were probably due to a too short cooling time or even by an excessive surface roughness of the metallic disc of the D2 microtexture. Another possible cause could be the small “wells” with larger demolding angles present in the valleys observed between peaks on the profile of the D2 microtextured steel insert. These two facts might have caused an undesired excessive adhesion of the polymer in the mold cavity upon demolding.
In addition to the elongation shown by the highest peaks in the replicated microstructure, a set of secondary peaks is also observed. These might also be caused by an excessive adhesion of the polymer to the irregularities present on the ridge surfaces upon demolding. As it will be shown later in the functional validation part, these deformations did not prevent the expected light-guiding functionality.
Despite the observed deformations, the microtextured surface of the injected PC samples showed a good replication uniformity for all the injection molding conditions. Variations on the peak-to-valley distance between the different tested zones were minimal (i.e., St around ±10%).
Anti-scratch microstructure (D3)
In we can observe a linear profile of the D2 microtextured steel insert together with two parallel profiles (roughly 50 μm apart) extracted from the textured surface of the injected PC sample at molding conditions (i.e., Tm/Vinj/P of 110°C 150 mm/s and 800 bar, respectively) that correspond to the highest DR% (93%).
For all the observed injection molding conditions, the microtextured surface of the injected PC samples showed an acceptable uniformity of replication, with variations on the peak-to-valley distance St of ±15% between the different tested zones. Again, it is believed that small variations in the steel disc thickness caused an incorrect adjustment of the disc in the tool insert and flatness defects on the injected samples, which later derived into uniformities of the DR% amongst various zones of the disc.
Easy to clean microstructure (D5)
compares a linear profile of the D5 microtextured steel insert D5 with two parallel profiles (roughly 150 μm apart from each other) extracted from the textured surface of the injected PC sample at molding conditions corresponding to the highest DR% (i.e., Tm/Vinj/P of 110°C 150 mm/s and 800 bar, respectively).
The best replication degree for this test configuration reached an average 95%, while the lowest were approximately 55 and 65% for the lowest mold temperatures.
For all the observed injection molding conditions, the microtextured surface of the injected PC samples showed an acceptable uniformity of replication. Variations on the maximum peak to valley distance St were ±10% between the different zones tested in the samples.
Surface functionality characterization
Light-diffusion microstructure (D1)
Three samples of PC were tested and compared for an equal number of injected samples with and without microstructural features on its top face, following the method presented in the experimental section. The same experiment was carried out for the same number of PMMA-microtextured samples with a similar DR% for comparison purposes to exclude the possibility of material-associated diffusivity effects.
summarizes the results of the light diffusion measurements. Textured PC samples showed a marked increase of 96.5% in the homogeneity of the light measured sample vs the non-textured PC samples. The increase of homogeneity determined for the PMMA samples reached 19.2%, while the decrease in the main luminance was of 17.8% compared to a decrease of 29.5% for PC. As can be seen on , both materials confirmed the enhanced light-diffusive surface functionality acquired by the presence of the microtexture, markedly on a higher level for the PC material when compared to the PMMA. Nevertheless, the increase in light homogeneity measured for both materials, which is directly related to the diffusive capability of the microstructure, came at a higher decrease in mean luminance of 12% in the case of PC with regards to the PMMA.
Light-guiding microstructure (D2)
Four samples of injection molded PC were illuminated from one of its sides by means of a white LED of known characteristics, and the light coming out of the D2 microstructure was evaluated and recorded at a distance of 20 cm (Figure S2 in supporting information document).
The measured luminances of the original LED-source and guided light after going through the microstructure D2 are summarized in .
It can be observed from the table that the highest efficiency of the light-guiding functionality was reached for sample 1, which corresponds to a DR% of 80%. This value contrasted with the value attained on sample 2, which had the highest DR% (i.e., 150%), but also the highest distortion on the injected features. Nevertheless, even for various different DR% and geometrical distortions of the features, the measurements of mean luminance for all samples showed similar values and confirmed the D2 surface functionality. This is consistent with the bigger dimensions of the D2 microtextures, which probably were less exigent in terms of process conditions to achieve adequate replication when compared to the other microstructures (e.g., D1, D3, and D5).
Anti-scratch microstructure (D3)
The chosen roughness parameters (Sa, Sdr, Str) were initially measured for both injected textured and non-textured samples of the same material for comparison purposes. These initial values are summarized in . Samples with a DR% of 67,5% were chosen for this evaluation in order to confirm the surface functionality at the lowest replication level obtained.
Confocal images of scratch residual imprints for two applied loads (2 N, 5 N) and speed levels (8 mm/min and 500 mm/min) in both textured and non-textured samples are shown in for comparative purposes. Table s7 summarizes the resulting values of the roughness parameters and the corresponding friction coefficients (COF) for the different tested load and speed scenarios. Finally, a chart representing the evolution of the Str parameter (right y-axis) and that of the friction coefficient COF (left y-axis) is shown on .
Figure 7. Confocal images (200 X magnification) of the footprints produced on non-textured samples (right) and D3-microtextured samples (left) at the indicated indenter loads and speeds.
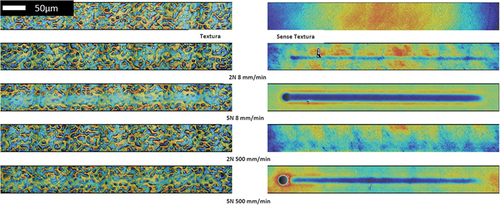
Figure 8. Evolution of the coefficient of the measured friction COF (left y-axis) coefficient and Str values with load and speed levels of indentation.
The determined roughness parameters Sa, Sdr, and Str have been used for the analysis of scratch visibility on this study (). The parameter Str, related to the microstructure isotropy () stays at relatively constant values for low load levels and all the load speeds tested, while strong decreases are seen for Sa and Sdr. This fact correlates with the lowest visibility of the scratches produced at low load levels (2 and 5 N) at both high and low speeds (500 and 8 mm/min, 1st to 2nd lowest visibility), as perceived by the observers on the round robin run. Low perception level was defined as hard to be perceived or directly not perceived, depending on the observer age. The results clearly contrast with the much higher visibility of the scratches produced at higher load levels.
Table 4. Initial measurements of the roughness parameters for non-textured and D3 textured samples.
Table 5. Roughness parameters for D3-textured and non-textured samples.
The values of Str at high load (7 N and 10 N) and speed levels (8 and 500 mm/min) showed a drastic reduction when compared to those determined at low load levels for both scratching speeds. This feature can be explained by the higher damage observed when scratching the microtextured PC sample at high load and speed levels, and relates well with the different scratch behavior observed at various low and high loads and speeds for this viscoelastic material.
Confocal and SEM images of the scratches produced on the D3 microtextured samples at low and high levels of scratching load and speeds can be seen in Figures S4 and S5 of the Supporting Information.
With respect to the friction coefficient (COF), measurements indicated a practically constant value for every applied load level applied when the speed is 500 mm/min, except for 10 N that led to a small decrease. On the other hand, a correlation is observed between COF and the Str parameter. Specifically, COF increases for higher Str values. When this roughness becomes, the surface shows less deformation when scratched and higher distances exist between peaks and valleys (correlated to Sz) of the structured surface. This feature may also explain the lowest visibility of scratches at high Str values.
Easy to clean microstructure (D5)
First, the values of water contact angles were determined for the microtextured PC (on both shiny and matte sides), non-microtextured PC and steel D5 disc insert samples. summarizes the average values obtained, which were in good agreement with reported water contact angles measured on PC surfaces.[Citation31] The average hysteresis remained below 5° for all the samples measured.
Table 6. Average water contact angles (five measurement points) for microtextured PC samples 1 and 2, flat PC sample and D5 steel disc insert.
During the process of checking the efficiency of the easy to clean microstructure, an additional PC sample with a D1 surface microstructure was included in the trials for comparison purposes. The values obtained for the weight measurements can be observed in .
Table 7. Values of initial sample weight, weight after dust addition, and percentage of dust removed after the cleaning and drying process was completed.
The values of the amount of dust removed after the specified cleaning process for samples 1 and 2 were superior to those observed for the metallic disc or even for the PC sample.
Nevertheless, these values should be taken with caution, as this is mostly a custom test setup that gives qualitative information. The dust amounts removed represent very small quantities, and the PC samples might have gone through some hydration during the liquid drop stage, due to their different hydrophilicities.
The water contact angles were quite similar for all the samples measured, which points to a similar adhesion of water for all materials. Nonetheless, there were clear differences between the amount of dust wiped for the D5 microtextured PC samples and the rest of the samples used in the study. In the case of the original D5 textured steel disc, the lower amount of dust removed might be caused by a higher chemical affinity between steel and water or a slightly rougher surface of the steel disc when compared to the rest of the samples shown.
Interestingly, the removed dust weight for the PC sample of the D1 microtexture was also smaller than those determined for samples 1 and 2 (“easy to clean” microtextured D5 PC samples with DR% of 75% and 95%, respectively). This eliminated the possible reasoning of having an easy to clean functionality on the surface of injected PC due to the mere existence of a microtextured surface. The specificity of the D5 microstructure design for easy to clean purposes appears to be confirmed by the observed results.
All these facts seemed to confirm the surface functionality easy to clean for injected PC samples and point to a higher effectivity for higher degrees of replication DR%.
Conclusions
This paper demonstrates a method for the replication of surface microstructures on PC using regular isothermal injection molding and confirms their functionalities based on custom and easily aplicable validation tests with interest for the industry. The attainment of such functionalities on steel was achieved by means of laser texturing using an innovative technique that reverts into lower surface roughness of the obtained microtextures and therefore easier demolding of the latter injection molded parts. The latter obtained functional surfaces of the injection molded plastic specimens represents an interesting technology to enhance the functionality of plastic parts on the automotive, consumer electronics, medical devices or lighting sectors, to cite some.
Isothermal injection molding constitutes a suitable method for the replication of such low aspect-ratio structures of various physical functionalities in the micrometer range, with high applicability and uniform results for a large number of parts. Between the process parameters chosen for the analysis, mold temperature, and holding pressure showed the highest influence on the replication degree, as shown by the factorial DOE analysis.
The surface functionalities were validated even at varied degrees of replication for the injected microtextured surfaces. Custom validation test set-ups were defined to best represent the final application potential, with a clear focus on final use properties. Measurements were taken for relevant parameters, following recommendation of the project participants in view of underlying the industrial relevance of the replicated textures. On most cases, the best replication fidelity was obtained for the center of the microstructure and a slight deviation on the DR% between the center and the lateral ends of the injected samples was detected. These deviations reached a maximum of 15% for the case of the highest aspect ratio structures (i.e., D2 light-guiding functionality with AR = 0.73).
Supplementary_information_to__C_Sa_ez-Comet_.docx
Download MS Word (6.8 MB)Acknowledgement
This work has been performed within the PLASTFUN project (Planta Pilot de Peces Plàstiques amb Superficies Funcionals Avançades),within the Industries of the Future community (IDF) RIS3CAT supported by the European Regional Development Fund (ERDF) as part of the operative frame FEDER of Catalonia 2014-2020 EC[COMRDI 16-1-0018], included in the 7th Framework Program.
We thank Dr. Jordi Puiggali and Dr. Luis Javier del Valle Mendoza for their continuous contribution, guiding and support to this research as PhD supervisors.
We thank the companies MICRORELLEUS SL (https://www.microrelleus.com/) and KOSTAL Eléctrica (http://www.kostal.com/) for the design and manufacturing of the steel disc inserts and the support ontesting of optical functionalities, respectively.
Disclosure statement
No potential conflict of interest was reported by the author(s).
Supplementary material
Supplemental data for this article can be accessed online at https://doi.org/10.1080/10426914.2022.2075888.
Additional information
Funding
References
- Zhang, H.; Fang, F.; Gilchrist, M.D.; Zhang, N. Filling of High Aspect Ratio Micro Features of a Microfluidic Flow Cytometer Chip Using Micro Injection Moulding. J. Micromech. Microeng. 2018 July 1, 28(7), 075005. DOI:10.1088/1361-6439/aab7bf.
- Loaldi, D.; Calaon, M.; Quagliotti, D.; Parenti, P.; Annoni, M.; Tosello, G. Tolerance Verification of Precision Injection Moulded Fresnel Lenses. Procedia CIRP. 2018, 75, 137–142. DOI: 10.1016/j.procir.2018.05.004.
- Højlund-Nielsen, E.; Clausen, J.; Mäkela, T.; Thamdrup, L.H.; Zalkovskij, M.; Nielsen, T.; Li Pira, N.; Ahopelto, J.; Mortensen, N. A.; Kristensen, A., et al. Plasmonic Colors: Toward Mass Production of Metasurfaces. Adv. Mater. Technol. 2016, 1(7), 1600054. DOI: 10.1002/admt.201600054.
- Islam, M.; Sajid, A.; Mahmood, M.A.I.; Bellah, M.M.; Allen, P.B.; Kim, Y.-T.; Iqbal, S. M., et al. Nanotextured Polymer Substrates Show Enhanced Cancer Cell Isolation and Cell Culture. Nanotechnology. 2015, 26(22), 225101. DOI: 10.1088/0957-4484/26/22/225101.
- Hernández, J.J.; Monclús, M.A.; Navarro-Baena, I.; Viela, F.; Molina-Aldareguia, J.M.; Rodríguez, I. Multifunctional Nano-Engineered Polymer Surfaces with Enhanced Mechanical Resistance and Superhydrophobicity. Sci. Rep. 2017, 7(1), 43450. DOI: 10.1038/srep43450.
- Kehagias, N.; Francone, A.; Guttmann, M.; Winkler, F.; Fernández, A.; Sotomayor Torres, C.M. Fabrication and Replication of Re-Entrant Structures by Nanoimprint Lithography Methods. J. Vac. Sci. Technol. B. 2018 Nov 1, 36(6), 06JF01. DOI:10.1116/1.5048241.
- Aizawa, T.; Inohara, T. Pico- and Femtosecond Laser Micromachining for Surface Texturing. In: Micromachining. IntechOpen, 2019. https://www.intechopen.com/books/micromachining/pico-and-femtosecond-laser-micromachining-for-surface-texturing
- Holzer, C.; Gobrecht, J.; Schift, H.; Solak, H. Replication of Micro- and Nanostructures on Polymer Surfaces. Macromol. Symp. 2010, 296(1), 316–323. DOI: 10.1002/masy.201051044.
- Ebrahimi, M.; Konaganti, V.K.; Moradi, S.; Doufas, A.K.; Hatzikiriakos, S.G. Slip of Polymer Melts Over Micro/nano-Patterned Metallic Surfaces. Soft Matter. 2016, 12(48), 9759–9768. DOI: http://dx.doi.org/10.1039/C6SM02235A.
- Skoulas, E.; Manousaki, A.; Fotakis, C.; Stratakis, E. Biomimetic Surface Structuring Using Cylindrical Vector Femtosecond Laser Beams. Sci. Rep. 2017 Mar 22, 7(1), 45114. DOI:10.1038/srep45114. PMID: 28327611; PMCID: PMC5361190.
- Zhang, N.; Srivastava, A.; Kirwin, B.; Byrne, R.; Fang, F.; Browne, D.; Gilchrist, M. D., et al. Manufacturing Microtextured Tool Inserts for the Production of Polymeric Microfluidic Devices. J. Micromech. Microeng. 2015 Aug 10, 25(9), 95005. DOI:10.1088/0960-1317/25/9/095005.
- Vera, J.; Brulez, A.-C.; Contraires, E.; Larochette, M.; Trannoy-Orban, N.; Pignon, M., et al. Factors Influencing Microinjection Molding Replication Quality. J. Micromech. Microeng. 2017, 28(1), 15004. DOI: 10.1088%2F1361-6439%2Faa9a4e.
- Pina-Estany, J.; Colominas, C.; Fraxedas, J.; Llobet, J.; Perez-Murano, F.; Puigoriol-Forcada, J.M.; Ruso, D.; Garcia-Granada, A. A., et al., A Statistical Analysis of Nanocavities Replication Applied to Injection Moulding. Int. Commun. Heat Mass Transf. 2017, 81, 131–140. DOI: 10.1016/j.icheatmasstransfer.2016.11.003.
- Muntada-López, O.; Pina-Estany, J.; Colominas, C.; Fraxedas, J.; Pérez-Murano, F.; García-Granada, A. Replication of Nanoscale Surface Gratings via Injection Molding. Micro Nano. Eng. 2019, 3, 37–43. DOI: 10.1016/j.mne.2019.03.003.
- Liou, A.-C.; Chen, R.-H. Injection Molding of Polymer Micro- and Sub-Micron Structures with High-Aspect Ratios. Int. J. Adv. Manuf. Technol. 2006, 28(11–12), 1097–1103. DOI: 10.1007/s00170-004-2455-2.
- Maghsoudi, K.; Jafari, R.; Momen, G.; Farzaneh, M. Micro-Nanostructured Polymer Surfaces Using Injection Molding: A Review. Mater. Today Commun. 2017, 13, 126–143. DOI: 10.1016/j.mtcomm.2017.09.013.
- Attia, U.M.; Marson, S.; Alcock, J.R. Micro-Injection Moulding of Polymer Microfluidic Devices. Microfluid. Nanofluidics. 2009, 7(1), 1. DOI: 10.1007/s10404-009-0421-x.
- Zhang, Y.; Mischkot, M.; Hansen, H.; Hansen, P.-E. Replication of Microstructures on Three-Dimensional Geometries by Injection Moulding of Liquid Silicone Rubber. 2015.
- Loaldi, D.; Regi, F.; Baruffi, F.; Calaon, M.; Quagliotti, D.; Zhang, Y.; Tosello, G., et al. Experimental Validation of Injection Molding Simulations of 3D Microparts and Microtextured Components Using Virtual Design of Experiments and Multi-Scale Modeling. Micromachines. 2020 Jun 24, 11(6), 614. DOI:10.3390/mi11060614.
- Lu, Y.; Luo, W.; Wu, X.; Xu, B.; Wang, C.; Li, J., Li, L., et al. Fabrication of Micro-Structured LED Diffusion Plate Using Efficient Micro Injection Molding and Micro-Ground Mold Core. Polymers (Basel). 2020, 12(6), 1307. DOI: 10.3390/polym12061307.
- Gheisari, R.; Lan, P.; Polycarpou, A.A. Efficacy of Surface Microtexturing in Enhancing the Tribological Performance of Polymeric Surfaces Under Starved Lubricated Conditions. Wear. 2020, 444–445, 203162. DOI: 10.1016/j.wear.2019.203162.
- He, B.; Chen, W.; Jane Wang, Q. Surface Texture Effect on Friction of a Microtextured Poly(dimethylsiloxane) (PDMS). Tribol. Lett. 2008, 31(3), 187. DOI: 10.1007/s11249-008-9351-0.
- Świetlicki, M.; Chocyk, D.; Klepka, T.; Prószyński, A.; Kwaśniewska, A.; Borc, J.; Gładyszewski, G., et al. The Structure and Mechanical Properties of the Surface Layer of Polypropylene Polymers with Talc Additions. Mater. (Basel). 2020 Feb 4, 13(3), 698. https://www.mdpi.com/1996-1944/13/3/698
- Skarmoutsou, A.; Charitidis, C.A.; Gnanappa, A.K.; Tserepi, A.; Gogolides, E. Nanomechanical and Nanotribological Properties of Plasma Nanotextured Superhydrophilic and Superhydrophobic Polymeric Surfaces. Nanotechnology. 2012, 23, 50, 505711. DOI: 10.1088%2F0957-4484%2F23%2F50%2F505711.
- Wong, M.; Moyse, A.; Lee, F.; Sue, H.-J. Study of Surface Damage of Polypropylene Under Progressive Loading. J. Mater. Sci. 2004, 39(10), 3293–3308. DOI: 10.1023/B:JMSC.0000026930.12462.3d.
- Geyer, F.; D\textquoterightacunzi, M.; Sharifi-Aghili, A.; Saal, A.; Gao, N.; Kaltbeitzel, A.; Sloot, T.-F.; Berger, R.; Butt, H.-J.; Vollmer, D., et al. When and How Self-Cleaning of Superhydrophobic Surfaces Works. Sci. Adv. 2020, 6(3). DOI: 10.1126/sciadv.aaw9727.
- Haines, R.S.; Ahf, W.; Zhang, H.; Coffey, J.; Huddle, T.; Lafountaine, J.S.; Lim, Z.-J.; White, E. A.; Tuong, N. T.; Lamb, R. N., et al. Self-Cleaning Surfaces: A Third-Year Undergraduate Research Project. J. Chem. Educ. 2009 Mar 1, 86(3), 365. DOI: 10.1021/ed086p365
- Condition, T. Makrolon® 2207, 2019, pp 2–5.
- Information P. PLEXIGLAS ®8N, 2013, pp 3–5.
- Masato, D.; Sorgato, M.; Lucchetta, G. Analysis of the Influence of Part Thickness on the Replication of Micro-Structured Surfaces by Injection Molding. Mater. Des. 2016, 95, 219–24. DOI: 10.1016/j.matdes.2016.01.115.
- Rios, P.F.; Dodiuk, H.; Kenig, S.; McCarthy, S.; Dotan, A. The Effect of Polymer Surface on the Wetting and Adhesion of Liquid Systems. J. Adhes. Sci. Technol. 2007 Jan 1, 21(3–4), 227–241. DOI:10.1163/156856107780684567.