
Abstract
Most higher-risk myelodysplastic syndrome (HR-MDS) patients will become transfusion-dependent, leading to potential complications, including infections or end-organ dysfunction. Data correlating achievement of transfusion-free intervals (TFIs) during first-line therapy (1LT) with survival are sparse. We evaluated HR-MDS patients receiving 1LT diagnosed from 1/1/2008 to 7/31/2015 and the impact of a TFI (≥60-day interval without transfusions) on progression-free and overall survival (PFS, OS) using Cox proportional-hazard models. Two hundred and twenty-nine HR-MDS patients received 1LT; overall, median PFS/OS were 8.4 months and 14.7 months, respectively. Two-year PFS/OS were 22.3% and 34.6%, respectively. Median PFS/OS were longer for patients with vs. without a TFI (16.9 vs. 6.1 months and 26.1 vs. 11.8 months, respectively; p < .01 [both]). Two-year PFS (43.0% vs. 3.9%; p < .01) and 2-year OS (51.8% vs. 22.5%; p < .01) were also longer in patients with a TFI vs. not. Achievement of a TFI during 1LT appears to positively affect PFS and OS in HR-MDS patients.
Introduction
Myelodysplastic syndromes (MDS) are a group of heterogeneous malignant bone marrow disorders characterized by ineffective hematopoiesis causing anemia, neutropenia, and thrombocytopenia and leading to transfusions, infections, and death [Citation1]. There are an estimated 10,000 new cases of MDS diagnosed annually in the United States (US) [Citation2]. MDS tends to be a disease of the elderly, with a median age at diagnosis of 76 years [Citation2]. Overall, approximately 30% of patients initially diagnosed with MDS will progress to acute myeloid leukemia (AML) [Citation3].
The prognosis of patients with MDS is currently estimated using the revised International Prognostic Scoring System (IPSS-R) for MDS which classifies patients into five distinct risk categories (very low, low, intermediate, high, and very high) based on both clinical factors such as bone marrow blast percentage and depth of cytopenias and genomic factors (i.e. cytogenetics) at diagnosis (). Median survival decreases with increased risk category based on IPSS-R score and ranges from 8.8 years (range: 7.8–9.9) for those patients with very low-risk disease to 0.8 years (range: 0.7–0.8) for patients with very high-risk disease [Citation4].
Table 1. IPSS-R classification for MDS [Citation4].
Treatment decisions for patients with MDS are largely guided by the IPSS-R. National Comprehensive Cancer Network (NCCN®)-recommended treatment regimens for patients with higher-risk myelodysplastic syndrome (HR-MDS) include hypomethylating agents (HMAs) (azacitidine or decitabine), high-intensity chemotherapy (most commonly with an antimetabolite ± an anthracycline), and allogeneic stem cell transplant (alloSCT), either alone or after chemotherapy with HMAs and/or high-intensity chemotherapy [Citation5]. AlloSCT is the only curative-intent treatment and is therefore preferred in patients with HR-MDS. However, few patients with MDS are able to receive alloSCT due to advanced age, poor performance status, and/or comorbid conditions at diagnosis [Citation5]. Low-intensity chemotherapy for MDS, with either azacitidine or decitabine, has been shown in randomized controlled trials to decrease the risk of leukemic transformation; however, only azacitidine has been shown to improve survival in patients with HR-MDS [Citation6–9].
Supportive care is standard across all risk groups with MDS and largely comprises managing cytopenias and infectious complications associated with the disease state [Citation5]. Patients with MDS most commonly present with anemia (39%), and many also have one other cytopenia in addition to anemia (27%) or two other cytopenias (pancytopenia) (15%) at presentation [Citation10,Citation11]. Further, approximately 60–80% of MDS patients will develop anemia at some point during their disease course [Citation12]. Up to 90% of patients with MDS will receive transfusions during their clinical course, and up to 79% of patients with HR-MDS will become transfusion-dependent, although how transfusion independence/dependence has been defined either varies or has not been explicitly stated across publications [Citation13–15].
Transfusions lead to many clinical complications among the MDS population, including infections, transfusion reactions, and iron overload, often leading to dysfunction of end-organ systems such as the heart, liver, and endocrine system [Citation14,Citation16–18]. There is also a significant economic burden associated with transfusion dependence: in a recent analysis, transfusion-dependent patients incurred a mean total cost of $17,815 per month vs. approximately $7874 for those patients who were transfusion-independent [Citation15].
However, there are little data correlating transfusion independence or attaining prolonged intervals during therapy where no transfusions are needed for survival in patients specifically with HR-MDS, as many previous studies have reviewed all IPSS-R risk groups together. This is particularly important because the risk of transfusion-dependent disease increases as the IPSS-R risk group increases [Citation13]. Therefore, we conducted a retrospective analysis of a US cohort of HR-MDS patients receiving first-line therapy (1LT) in routine clinical care to evaluate progression-free survival (PFS) and overall survival (OS) outcomes in this population, as well as the prognostic significance of attaining a transfusion-free interval (TFI) on both PFS and OS.
Methods
This was a retrospective cohort analysis using the Humedica electronic medical record (EMR) database (see online appendix). HR-MDS patients diagnosed between 1/1/2008 and 7/31/2015 were identified; the date of HR-MDS diagnosis was the index diagnosis date, and the 12 months prior to the index diagnosis date was the baseline period. Patients were followed for ≥60 days from the index diagnosis date (except patients who died <60 days from index diagnosis date) until death, loss to follow-up, or end of study (9/30/2015). For patients who progressed to AML, evaluation of MDS treatment patterns ended on the progression date.
Study population
Patients were ≥18 years with newly diagnosed HR-MDS. Since complete cytogenetics and IPSS-R classification were not available in the database, HR-MDS diagnosis was based on either an HR-MDS International Classification of Diseases, 9th or 10th Revision (ICD-9/ICD-10) diagnosis code or an adapted HR-MDS algorithm based on IPSS-R classification (). See the online appendix for ICD-9/10 codes and HR-MDS algorithm.
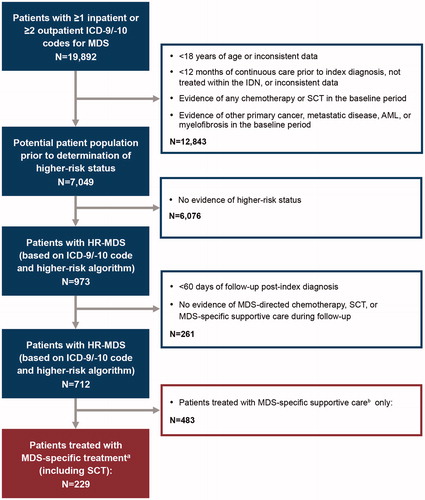
Eligible patients had continuous care in the baseline period, received treatment within integrated delivery networks (IDNs), and had evidence of MDS-specific 1LT (see online appendix) (). Exclusion criteria included evidence of any chemotherapy or stem cell transplant (SCT) or evidence of other primary cancers, metastatic disease, AML, or myelofibrosis in the baseline period.
Figure 1. Study design. aMDS chemotherapy includes the following: azacitidine, decitabine, lenalidomide, ATG, cyclosporine, cytarabine, idarubicin, daunorubicin, fludarabine, clofarabine and topotecan, or alloSCT. bMDS-specific supportive care includes the following: erythrocyte/platelet transfusions; thrombopoietic-, erythropoietic-, and granulocyte-stimulating agents, and hydroxyurea. AML: acute myeloid leukemia; alloSCT: allogeneic stem cell transplant; ATG: anti-thymocyte globulin; HR-MDS: higher-risk myelodysplastic syndrome; ICD-9/ICD-10: International Classification of Diseases 9th/10th Revision; IDN: integrated delivery network; MDS: myelodysplastic syndrome; SCT: stem cell transplant.
Baseline characteristics
Baseline demographics were recorded on the index diagnosis date. Baseline clinical characteristics included Charlson comorbidity index (CCI), hemoglobin, bone marrow blast percentage, platelet count, and absolute neutrophil count (ANC) (measured in the baseline period and up to 30 days following the index diagnosis date).
Study outcomes
1LT was defined as MDS-specific treatment initiated on or after the index diagnosis date. Second-line therapy (2LT) was triggered by the addition or substitution of an MDS-specific treatment after 28 days from the start of the 1LT. MDS-specific supportive care use in the baseline and follow-up period was recorded. See online appendix for further information on MDS-specific treatments. TFI was defined as no evidence of erythrocyte/platelet transfusions for a period of ≥60 days at any point during 1LT and was assessed in the sub-population with ≥60 days’ duration of 1LT.
Survival outcomes from the 1LT initiation were evaluated: PFS was defined as time to transformation to AML, initiation of 2LT, or death; and OS was defined time to death by any cause.
Statistical analysis
Median OS, median PFS, and 2-year OS and PFS rates were evaluated using Kaplan–Meier analyses. Survival outcomes were compared among patients treated with azacitidine vs. other regimens in 1LT and among patients with TFI vs. not in 1LT using a log-rank test.
Cox proportional hazard models were used to assess the impact of TFI on 2-year survival outcomes following 1LT. The key independent variable was TFI vs. no TFI. The model adjusted for age (<65 and ≥65 years), gender, race, region, payer type, CCI (0, 1, ≥2), months to 1LT, year of diagnosis, baseline supportive care, baseline ANC, baseline hemoglobin, and baseline platelet count. Analyses were conducted using SAS® version 9.2 (SAS Institute, Cary, NC).
Results
Seven hundred and twelve newly diagnosed HR-MDS patients were identified; of these, 229 patients (32%) received MDS-specific treatment after the index diagnosis date and were included in the analysis (). Among the 229 patients who received MDS-specific treatment, 65.1% were male and the mean age was 71.6 years. Further, 34.5% of patients had a CCI of ≥2, 20.5% had a CCI of 1, and 45.0% had a CCI of 0. The most common baseline comorbidities were chronic pulmonary disease (22.3%), diabetes (21.4%), peripheral vascular disease (14.4%), moderate to severe renal disease (13.1%), congestive heart failure (12.7%), and cerebrovascular disease (10.5%). Overall, 28.4% of patients had received MDS-directed supportive care in the baseline period. contains the baseline characteristics for those patients receiving MDS-specific treatment, excluding those with only a record of SCT (n = 218).
Table 2. Baseline patient characteristics and treatment characteristics.
Treatment patterns following MDS diagnosis
Median time to 1LT for all treated patients (n = 229) was 22 days (interquartile range [IQR]: 10, 74), and median duration of 1LT for all patients was 99 days (IQR: 36, 208).
Hypomethylating agents (HMAs) were the most common agents in 1LT, with 60% (n = 138) and 24% (n = 54) of patients receiving azacitidine and decitabine, respectively. Although not approved for HR-MDS patients, lenalidomide was used in 7.4% of patients (n = 17), 4.8% (n = 11) received SCT alone, and 3.9% (n = 9) received induction-type chemotherapy with an antimetabolite (i.e. cytarabine or fludarabine) and/or an anthracycline (i.e. idarubicin or daunorubicin). Overall, 82.6% of patients received some form of MDS supportive care during the follow-up. Of the 145 patients on 1LT for ≥60 days who also were evaluable for achieving a TFI (HMAs, n = 138; induction-type chemotherapy, n = 0; lenalidomide, n = 7), 58% achieved a ≥60-day TFI following initiation of the 1LT (58% of those evaluable on HMAs and 57.1% of those evaluable on lenalidomide).
Some differences were noted in the baseline characteristics of patients initiated on the various 1LT regimens (). A higher proportion of patients receiving decitabine and lenalidomide were ≥65 years of age vs. the other therapies (decitabine, 85% and lenalidomide, 100% vs. azacitidine, 78% and induction-type chemotherapy, 67%). Further, a higher proportion of patients receiving azacitidine and induction-type chemotherapy received MDS supportive care at baseline compared with patients receiving decitabine or lenalidomide (32% and 33%, respectively vs. 22% and 18%, respectively). Among those treated with HMAs, a higher proportion of azacitidine patients (with known blasts) had >5% bone marrow blasts (25% vs. 17%), platelets <50K/L (46% vs. 39%), and hemoglobin <8 g/dL (33% vs. 26%) than those treated with decitabine.
A total of 130 patients had azacitidine cycles in 1LT with ≥1 dose, and the median number of cycles was 4.0 (IQR: 2, 6). Across all cycles, the majority of azacitidine doses were outside of the Food and Drug Administration (FDA)-approved dosing regimen (82.3%); only 17.7% of patients received ≥1 cycle utilizing seven consecutive doses of azacitidine (FDA-approved regimen). The most common azacitidine dosing patterns per cycle were five consecutive days (30.8%), followed by seven consecutive days (17.7%; FDA-approved regimen), and seven nonconsecutive days (17.5%; i.e. five consecutive days on treatment, 2 days off treatment, followed by two consecutive days on treatment).
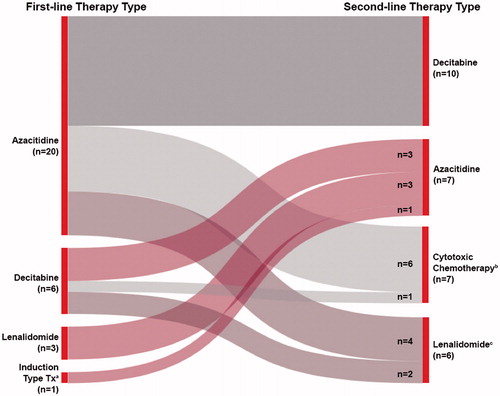
Of the 218 patients who received 1LT, 30 patients (13.8%) received 2LT with or without MDS supportive care, and 56 patients (25.7%) received MDS supportive care alone until death, progression to AML, or loss to follow-up. The most common MDS-directed treatments in 2LT were, again, HMAs (decitabine [n = 10, 30.0%] and azacitidine [n = 7, 23.3%]); these were followed by cytotoxic chemotherapy (n = 7, 23.3%) (i.e. fludarabine + another agent, cytarabine ± daunorubicin, or clofarabine) and lenalidomide (23.3%; n = 6 alone; with azacitidine, n = 2). Of those receiving 2LT for MDS, 13 (43.3%) received therapy with an HMA, both in 1LT and 2LT ().
Figure 2. Prescribing patterns for patients receiving second-line therapy. aInduction-type treatment: an antimetabolite (i.e. cytarabine, fludarabine) ± an anthracycline (i.e. idarubicin or daunorubicin). bCytotoxic chemotherapy: any non-HMA chemotherapy (i.e. fludarabine ± another agent, clofarabine, cytarabine ± daunorubicin). cOf the lenalidomide patients, n = 4 were lenalidomide alone and n = 2 were in combination with azacitidine. HMA: hypomethylating agent.
Survival outcomes among treated HR-MDS patients
Across all patients with evidence of 1LT, excluding those with only a record of SCT (n = 218), the 2-year PFS and OS rates were 22.3% and 34.6%, respectively. Median PFS was 8.4 months (95% confidence interval [CI]: 6.1, 11.1) and median OS was 14.7 months (95% CI: 11.8, 16.6).
Kaplan–Meier analyses, without adjusting for baseline characteristics, showed that using azacitidine vs. other MDS treatments in 1LT did not result in any significant difference in median PFS or OS. Median PFS was 7.7 months (95% CI: 5.8, 9.8) and median OS was 13.6 months (95% CI: 11.3, 16.4) for patients on azacitidine compared with 10.4 months (95% CI: 4.9, 13.8) and 15.2 months (95% CI: 11.2, 18.8), respectively, for those on other therapies (p = .6794 and p = .3480, respectively). In addition, neither 2-year PFS nor 2-year OS rates were significantly different between those who received azacitidine vs. other MDS treatments; 2-year PFS rates were 21.7% vs. 23.0% (p = .8217), and 2-year OS rates were 33.7% vs. 35.8% (p = .6194), respectively.
Survival outcomes among HR-MDS patients with and without a TFI during 1LT
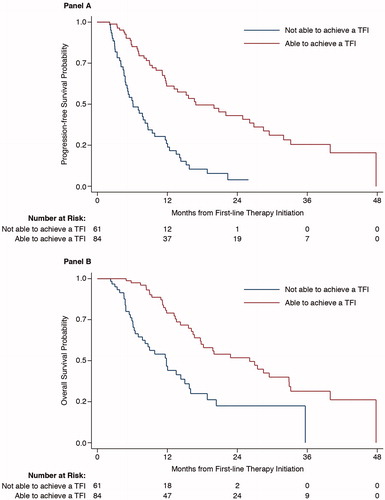
In patients evaluable for ability to attain a TFI during 1LT (n = 145), those who were able to attain this transfusion-free period (n = 84) had a significantly longer median PFS and OS in the unadjusted analysis compared with those who did not attain a TFI (n = 61). Median PFS was 16.9 months (95% CI: 11.9, 26.8) and median OS was 26.1 months (95% CI: 17.7, 32.9) for patients who achieved a TFI vs. 6.1 months (95% CI: 4.8, 8.6) and 11.8 months (95% CI: 7.7, 15.0) for those that did not (p < .0001 for both) (). The 2-year PFS (43.0% vs. 3.9%) and 2-year OS (51.8% vs. 22.5%) rates were both significantly longer in patients attaining a TFI vs. those who did not (p < .0001, for both).
Figure 3. Progression-free survival (A) and overall survival (B) in patients with and without a TFI receiving first-line therapy (p < .0001 for both). TFI: transfusion-free interval.
In the adjusted analysis for the effect of ability to attain a TFI on outcomes, attaining this ≥60-day period without transfusions was associated with improved 2-year PFS and OS rates. Patients able to achieve a TFI of ≥60 days had a 73% reduction in risk of progression at 2 years and a 66% reduction in risk of death at 2 years vs. those who were not able to attain this TFI (p < .0001 and p = .0002, respectively) (). Results of the multivariate analyses also showed that age, CCI, baseline use of MDS supportive care, and hemoglobin influenced survival outcomes. Age ≥65 years was associated with shorter PFS (hazard ratio [HR]: 2.21 [95% CI: 1.01, 4.83]; p = .0475) and OS (HR: 2.97 [95% CI: 1.11, 7.94]; p = .0300) (). CCI score ≥2 compared to a CCI score of 0 (HR: 2.31 [95% CI: 1.13, 4.74]; p = .0218) and baseline MDS supportive care use compared with no MDS supportive care use (HR: 2.45 [95% CI: 1.26, 4.76]; p = .0080) were associated with decreased OS (). CCI score of 1 compared to a CCI score of 0 (HR: 0.48 [95% CI: 0.24, 0.99]; p = .0471) was associated with better PFS, while baseline hemoglobin ≥8 g/dL compared to baseline hemoglobin <8 g/dL (HR: 1.79 [95% CI: 1.08, 2.98]; p = .0251) was associated with worse PFS (). However, 19.6% of patients had evidence of a transfusion in the 30 days prior to index diagnosis date, and in this proportion of patients, hemoglobin may have been elevated due to transfusion need rather than due to normal hematopoiesis.
Table 3. Multivariate analysis of 2-year PFSTable Footnotea,Table Footnoteb and OSTable Footnotea,Table Footnoteb among HR-MDS patients with and without a TFI.
Discussion
A large proportion of patients (67%) did not receive treatment for HR-MDS outside of supportive care in the clinical practice setting. Among those who received treatment, the majority of patients who received 1LT for HR-MDS received an HMA, most commonly azacitidine (60%). This aligns with both the NCCN guidelines and primary literature, which show that azacitidine improved survival in HR-MDS patients [Citation5–8]. The majority of azacitidine cycles were divergent from the FDA-approved dosing regimen (82.3%). There is evidence to suggest that alternative dosing regimens that provide 7 days of azacitidine at 75 mg/m2 produce similar results to that of the FDA-approved dosing regimen in terms of hematologic improvement and safety; however, these regimens have not been studied in randomized controlled trials, to date [Citation19]. Regimens providing fewer days or lower doses of azacitidine may be inferior. The median OS and 2-year OS of the patients included in this retrospective analysis were lower than that of the phase 3 trial that evaluated the use of azacitidine vs. conventional care regimens (i.e. either induction therapy, low-dose cytarabine, or best supportive care) in patients with ≥ intermediate-risk MDS (i.e. HR-MDS). Multiple factors could have led to this distinction, including patient age and comorbid conditions [Citation6]. In our analysis, for example, 81% of patients were ≥65 years of age and 34.9% of had a CCI of ≥2 at baseline; comparatively, in the phase 3 trial assessing the impact of azacitidine on OS, 68% of azacitidine patients and 76% of patients on conventional care were ≥65 years of age [Citation6]. Further, although CCI was not reported in the trial, 92% of azacitidine patients and 93% of patients on conventional care had an Eastern Cooperative Oncology Group performance status of 0–1, indicating that the majority of patients had a good to very good performance status [Citation6]. The 2-year OS found in this study was consistent with that found in other real-world analyses of HR-MDS patients treated with azacitidine [Citation20–22].
Achievement of a TFI during 1LT was a prognostic indicator for increased PFS and OS in 1LT of HR-MDS patients in both the unadjusted analysis and the analysis adjusted for age (<65 and ≥65 years), gender, race, region, payer type, CCI (0, 1, ≥2), time to 1LT (in months), year of diagnosis, any baseline supportive care, ANC, hemoglobin, and platelet count. The results of this retrospective analysis are consistent with findings from other clinical trials and retrospective analyses that have shown transfusion independence to be associated with improved survival across the entire MDS patient population, regardless of risk [Citation23,Citation24]. A recent meta-analysis reported a 59% reduction in mortality in patients with MDS who were transfusion-independent at baseline compared with those who were transfusion-dependent, although the study also revealed that the definition of transfusion independence varied across the literature and was frequently unreported [Citation24]. Further, this analysis concluded that a meta-analysis was not possible of studies where patients with MDS acquired transfusion independence with treatment; however, those individual studies consistently reported a survival benefit for these patients [Citation24]. Additionally, it has been reported that increasing the number of transfusions also has a negative impact on survival [Citation23,Citation24]. Our analysis confirms that achieving a TFI of ≥60 days during 1LT is associated with improved survival, specifically in an HR-MDS patient population engaged in routine clinical care.
Among the HR-MDS patient population, upwards of 79% will develop transfusion-dependent anemia during their clinical course [Citation13]. Several potential issues associated with anemia and transfusions likely contribute to the increased mortality risk associated with anemia and transfusion dependency. First, anemia has been associated with increased risk for the development of cardiac disease in patients with MDS [Citation25]. Transfusions are associated with many risks including infections, transfusion reactions, and iron overload [Citation14,Citation16–18]. Iron overload has been linked to dysfunction of several end-organ systems, including the heart, liver, and endocrine system [Citation14,Citation17]. Iron overload secondary to red blood cell transfusions has also been associated with decreased survival [Citation23].
In this retrospective study, hemoglobin ≥8.0 g/dL at baseline negatively affected OS. These results differ from that of previous analyses that showed that lower hemoglobin levels at baseline were associated with decreased survival [Citation26,Citation27]. This is also reflected in the IPSS-R, with lower baseline hemoglobin levels leading to increased risk within the scoring system and poorer prognosis [Citation4]. One reason our analysis might differ from these previous publications is due to the inclusion of baseline hemoglobin levels from the 12 months prior to index diagnosis up to index diagnosis date of HR MDS, using the level closest to the index diagnosis date; we did not exclude the 19.6% of patients that may have elevated hemoglobin levels due to transfusions within 30 days prior to the date of this baseline level. Therefore, baseline hemoglobin levels may, in general, not be an accurate representation of baseline anemia vs. normal hematopoiesis, as some with baseline hemoglobin levels ≥8 g/dL may have been elevated due to transfusions.
Some study limitations should be noted, including those inherent in any retrospective study. It is possible comorbidities that could affect the outcomes evaluated in this study were not captured through the use of diagnosis codes. A derived algorithm was used to identify HR-MDS patients, since cytogenetic abnormalities were not available within the EMR and bone marrow blast percentages were missing for the majority of patients. As a result, some patients may have been misclassified as having HR-MDS. While we are able to determine whether patients received transfusion, the number of units transfused is not available in the data. Further, existing guidelines incorporate discretion into whether or not treatment is warranted in MDS patients with intermediate risk, and our population contained those with ≥ intermediate-risk MDS.
Conclusions
Azacitidine is the most frequently used 1LT for HR-MDS in clinical practice. Treated patients who achieved a TFI for ≥60 days after 1LT initiation had a significantly better OS and PFS than patients who did not achieve a TFI. In addition, older age, a higher comorbidity burden, and use of baseline supportive care also had a negative impact on OS, while older age negatively affected PFS. Further research into therapies that increase a patient’s ability to become transfusion-independent, with a subsequent evaluation of the impact on PFS and OS, would address a critically important unmet medical need.
Potential conflict of interest
Disclosure forms provided by the authors are available with the full text of this article online at https://doi.org/10.1080/10428194.2018.1464155.
ICMJE Form for Disclosure of Potential Conflicts of Interest
Download PDF (1.2 MB)Appendix
Download MS Word (21.4 KB)Acknowledgments
The authors would like to thank Dr. Bruce Dezube for his clinical expertise and his input in developing an algorithm to identify higher-risk patients with MDS.
Additional information
Funding
References
- Komrokji RS. Current state of the art: management of higher risk myelodysplastic syndromes. Clin Lymphoma Myeloma Leuk. 2016;16:S39–S43.
- Ma X, Does M, Raza A, et al. Myelodysplastic syndromes: incidence and survival in the United States. Cancer. 2007;109:1536–1542.
- Disperati P, Ichim CV, Tkachuk D, et al. Progression of myelodysplasia to acute lymphoblastic leukaemia: implications for disease biology. Leuk Res. 2006;30:233–239.
- Greenberg PL, Tuechler H, Schanz J, et al. Revised International Prognostic Scoring System for myelodysplastic syndromes. Blood. 2012;120:2454–2465.
- NCCN.org [Internet]. Fort Washington, PA: NCCN. Myelodysplastic syndromes. V.2.2017; [cited 2017 Apr 17]. Available from: https://www.nccn.org/professionals/physician_gls/pdf/mds_blocks.pdf.
- Fenaux P, Mufti GJ, Hellstrom-Lindberg E, et al. Efficacy of azacitidine compared with that of conventional care regimens in the treatment of higher-risk myelodysplastic syndromes: a randomised, open-label, phase III study. Lancet Oncol. 2009;10:223–232.
- Kantarjian H, Issa JP, Rosenfeld CS, et al. Decitabine improves patient outcomes in myelodysplastic syndromes: results of a phase III randomized study. Cancer. 2006;106:1794–1803.
- Lübbert M, Suciu S, Baila L, et al. Low-dose decitabine versus best supportive care in elderly patients with intermediate- or high-risk myelodysplastic syndrome (MDS) ineligible for intensive chemotherapy: final results of the randomized phase III study of the European Organisation for Research and Treatment of Cancer Leukemia Group and the German MDS Study Group. J Clin Oncol. 2011;29:1987–1996.
- Silverman LR, Demakos EP, Peterson BL, et al. Randomized controlled trial of azacitidine in patients with the myelodysplastic syndrome: a study of the Cancer and Leukemia Group B. J Clin Oncol. 2002;20:2429–2440.
- Lawrence LW. Refractory anemia and the myelodysplastic syndromes. Clin Lab Sci. 2004;17:178–186.
- Greenberg P, Cox C, LeBeau MM, et al. International scoring system for evaluating prognosis in myelodysplastic syndromes [erratum appears in Blood. 1998;91:1100]. Blood. 1997;89:2079–2088.
- Greenberg PL. The myelodysplastic syndromes. In: Hoffman R, Benz E, Shattil S, Cohen H, eds. Hematology: basic principles and practice. 3rd ed. New York, NY: Churchill Livingstone; 2000. p. 1106–1129.
- Brechignac S, Hellstrom LE, Bowen DT, et al. Quality of life and economic impact of red blood cell (RBC) transfusions on patients with myelodysplastic syndromes (MDS) [abstract 4716]. Blood. 2004;104:263b.
- Hellstrom-Lindberg E. Management of anemia associated with myelodysplastic syndrome. Semin Hematol. 2005;42:S10–S13.
- DeZern AE, Binder G, Rizvi S, et al. Patterns of treatment and costs associated with transfusion burden in patients with myelodysplastic syndromes. Leuk Lymphoma. 2017;58:2649–2656.
- Gupta P, LeRoy SC, Luikart SD, et al. Long-term blood product transfusion support for patients with myelodysplastic syndromes (MDS): cost analysis and complications. Leuk Res. 1999;23:953–959.
- Cazzola M, Anderson JE, Ganser A, et al. A patient-oriented approach to treatment of myelodysplastic syndromes. Haematologica. 1998;83:910–935.
- Pomeroy C, Oken MM, Rydell RE, et al. Infection in the myelodysplastic syndromes. Am J Med. 1991;90:338–344.
- Lyons RM, Cosgriff TM, Modi SS, et al. Hematologic response to three alternative dosing schedules of azacitidine in patients with myelodysplastic syndromes. J Clin Oncol. 2009;27:1850–1856.
- Jabbour E, Paolo S, Cabrero M, et al. Impact of achievement of complete cytogenetic response on outcome in patients with myelodysplastic syndromes treated with hypomethylating agents. Am J Hematol. 2017;92:351–358.
- Bernal T, Martinez CP, Sánchez GJ, et al. Effectiveness of azacitidine in unselected high-risk myelodysplastic syndromes: results from the Spanish registry. Leukemia. 2015;29:1875–1881.
- Dinmohamed AG, van Norden Y, Visser O, et al. Effectiveness of azacitidine for the treatment of higher-risk myelodysplastic syndromes in daily practice: results from the Dutch population-based PHAROS MDS registry. Leukemia. 2015;29:2449–2451.
- Malcovati L, Della Porta MG, Pascutto C, et al. Prognostic factors and life expectancy in myelodysplastic syndromes classified according to WHO criteria: a basis for clinical decision making. J Clin Oncol. 2005;23:7594–7603.
- Harnan S, Ren S, Gomersall T, et al. Association between transfusion status and overall survival in patients with myelodysplastic syndromes: a systematic literature review and meta-analysis. Acta Haematol. 2016;136:23–42.
- Alessandrino EP, Della Porta MG, Bacigalupo A, et al. WHO classification and WPSS predict post-transplantation outcome in patients with myelodysplastic syndrome: a study from the Gruppo Italiano Trapianto di Midollo Osseo (GITMO). Blood. 2008;112:895–902.
- Malcovati L, Della Porta MG, Strupp C, et al. Impact of the degree of anemia on the outcome of patients with myelodysplastic syndrome and its integration into the WHO classification-based Prognostic Scoring System (WPSS). Haematologica. 2011;96:1433–1440.
- Triantafylldis I, Ciobanu A, Stanca O, et al. Prognostic factors in myelodysplastic syndromes. Maedica. 2012;7:295–302.