
Abstract
In Sézary syndrome (SS) impaired T-cell function and cytokine profile lead to immune evasion. Immune checkpoints non-redundantly regulate immune responses and targeting them is promising. We evaluated the expression of BTLA, CTLA-4, FCRL3, LAG-3, and TIGIT in tumor and non-tumor SS T-cells.Compared to CD4+ T helper cells from ten healthy individuals, tumor cells of eight SS patients had a significant upregulation of BTLA (1.5-fold; p < .0001), FRCL3 (2.2-fold; p < .0028) and TIGIT (2.2-fold; p < .0003) expression. In contrast, we found a reduced expression of LAG-3+ cells in the blood of tumor patients (0.5-fold; p < .0014). Only weak alternations between tumor, non-tumor cells, and healthy controls were observed regarding CTLA-4 (0.5-fold; p < .2022). Our results show a diverse expression pattern of immune-regulatory molecules in SS patients. As these molecules are essential in the regulation of T-cell mediated tumor surveillance and defense, their specific targeting might be of clinical relevance.
Introduction
Sézary syndrome (SS) is a leukemic variant of primary cutaneous T-cell lymphoma (CTCL) with poor prognosis and duration of treatment response ranging from 7.5 to 22.4 months [Citation1,Citation2]. Since impaired immune responses and increased susceptibility to infections are a major mortality cause [Citation3], boosting the immune response is considered a rational therapeutic strategy.
Immune checkpoint inhibitors, especially those targeting PD-1 (programmed death receptor 1) and its ligand PD-L1 as well as CTLA-4 (cytotoxic T-cell antigen 4), are effective in the treatment of melanoma, advanced solid tumors and hematologic malignancies [Citation4–8]. Since overexpression of PD-1 has been shown in SS [Citation9] and mycosis fungoides (MF) [Citation10], the clinical benefit of targeting PD-1 and PD-L1 in CTCL is currently under investigation. Preliminary data showed response rates in 38% of CTCL (MF and SS) patients treated with the PD-1 inhibitor pembrolizumab [Citation11]. However, only 15% of the MF and none of the SS patients responded to treatment with the PD-1 inhibitor nivolumab [Citation4]. Additionally, in a murine T-cell lymphoma model, PD-1 suppresses oncogenic T-cell signaling in pre-malignant T-cells, but suppression or lack of PD-1 or PD-L1 induces lethal lymphoproliferation of T-cells with oncogenically fully activated T-cell receptor (TCR) pathways [Citation12]. Since there are multiple non-redundant immunosuppressive pathways, novel checkpoint molecules might be potential targets for immunotherapy of SS [Citation13].
B and T lymphocyte attenuator (BTLA; CD272) is an inhibitory receptor, engaged in immune tolerance and immune suppression and is thus expressed in tumor and non-tumor T-cells. In tumors, BTLA ligation by herpesvirus entry mediator (HVEM) blocks T-cell activation, proliferation, and cytokine production [Citation14]. Further, BTLA predicts poor prognosis in patients with diffuse large B cell lymphoma [Citation15]. In inflammatory diseases, restoration of BTLA immune suppressive functionality improves multiple sclerosis [Citation16], contact hypersensitivity [Citation17], lupus [Citation18] and T cell-tolerance induction to oral antigens [Citation19]. High BTLA expression is a hallmark of anergic and dysfunctional T cells [Citation17,Citation20].
Lymphocyte activation gene-3 (LAG-3; CD223) is a negative regulatory protein for T cell function, involved in tissue damage prevention and autoimmunity [Citation21]. Its blockade leads to enhanced proliferation of CD4+ T cells and an increased production of IL-2, IL-4, and IFN-γ [Citation22]. LAG-3 is frequently co-expressed with PD-1 on tumor-infiltrating lymphocytes (TILs), thus contributing to immune exhaustion and tumor promotion [Citation23]. Dual blockade of LAG-3 and PD-1 may act synergistically to reverse T-cell suppression [Citation11], restore immunity and improve murine chronic lymphocytic leukemia [Citation24,Citation25]. Currently, two inhibitory approaches, a LAG-3-Ig fusion protein (IMP321, Immuntep®) and monoclonal antibodies (mAbs) targeting LAG-3, are under clinical investigation either as a monotherapy or in combination with anti-PD-1 mAbs for hematologic neoplasms and solid tumors.
T-cell immunoreceptor with Ig and ITIM domains’ (TIGIT) is a poliovirus receptor (PVR)-like protein containing an immune-receptor tyrosine-based inhibitory motif (ITIM) and an immunoglobulin tail tyrosine (ITT)-like motif, which both induce inhibitory signals in T-cells [Citation26]. Specifically, TIGIT ligation was shown to impair Th1 activity, to enhance Th2 function and to stimulate the suppressive function of Tregs [Citation27–30]. Accordingly, TIGIT-deficiency in mice results in hyperproliferative T-cell responses, enhanced Th1 activity, increased susceptibility to autoimmunity and reduced tumor growth [Citation23,Citation28]. TIGIT overexpression on TILs correlates with advanced tumor stage in solid tumors [Citation31,Citation32] and in hematological malignancies [Citation33–35].
Fc receptor-like 3 (FCRL3; CD307c) is a member of the Fc receptor-like (FCRL) family of classical FcR homologs. Its expression is found on human B cells, T memory cells, and NK cells [Citation36,Citation37]. Although its physiological function is not yet completely elucidated, FCRL3 has been related to the regulation of immune responses and autoimmune diseases [Citation38].
In CTCL, the role of immunosuppressive pathways and the expression of checkpoint molecules on tumor and especially non-tumor T cells is unclear. Preliminary data suggest enhanced FCRL3, TIGIT, and LAG-3 expression on tumor T-cells [Citation39–42]. BLTA-expression in T-cells from CTCL patients has not been investigated thus far. Expression of those markers on non-tumor T-cells from CTCL patients has not been reported.
Our study aims to characterize the expression of immune checkpoint inhibitor regulators on tumor- and non-tumor (TILs) CD4+ T-cells in SS patients.
Materials and methods
Patients
Patients with previously diagnosed eight SS and with an unequivocally identifiable Vβ clonal T-cell population were included in the study. Blood samples from ten healthy individuals served as control. The diagnosis of SS was established in all patients according to the World Health Organization-European Organization for Research and Treatment of Cancer criteria for SS [Citation43]. Blood from the patients with SS was obtained from the University of Zürich Biobank (EK No. 647). Blood from healthy individuals was obtained from the blood bank of the University Hospital Zurich. The study was conducted in accordance with the principles of the Declaration of Helsinki and approved by the Institutional Review Board of the University of Zurich (KEK-ZH-Nr. 2015-0209).
Flow cytometry
For flow cytometry anti-human monoclonal antibodies were used as listed: CD3 (clone BW264/56, label PerCP; Miltenyi Biotec #130-096-910), CD4 (clone VIT4; label APC-Vio770; Miltenyi Biotec #130-098-153), TIGIT (clone MBSA43, label APC, eBioscience #17-9500-42), BTLA (clone MIH26, label APC, BioLegend #344510), LAG 3 (clone 3DS223H, label FITC, eBioscience #11-2239-41) and FCRL3 (clone 546828, label APC; R&D systems #FAB3126A). Vβ clonal T-cell populations were assessed using IOTest® Beta Mark TCR V beta Repertoire Kit., (Beckman Coulter, Nyon, Switzerland) according to the manufacturer’s instructions. Samples were acquired on Becton Dickinson, Allschwil, Switzerland FACSCanto instrument. FCS Express 5 Flow Cytometry RUO, Glendale, CA, USA, Origin Pro 9.1G, Northampton, MA, USA and GraphPad Prism 5.0 Software, San Diego, CA, USA were used for data analysis.
Statistical analysis
Statistical analysis was performed with GraphPad Prism 5.0 Software. For normality testing the Shapiro–Wilk normality test and the Kolmogorov–Smirnov test were used. Further analysis included unpaired t-test and the Mann–Whitney U-test.
Results
Decreased LAG-3 and increased BTLA, TIGIT, and FCRL3 expression on total CD4+ blood T-cells from patients with Sézary syndrome
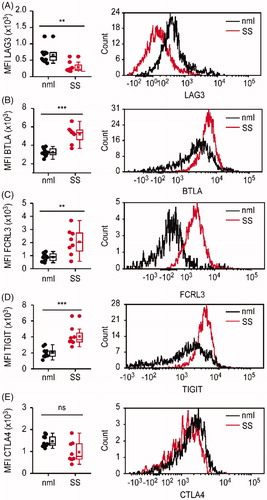
First, we assessed the fluorescence intensity of BTLA, CTLA-4, FCRL3, LAG-3, and TIGIT staining on all peripheral CD4+ blood T-cells isolated from SS patients. Peripheral blood T-cells isolated from blood samples donated by healthy individuals served as a control. The median fluorescence intensity (MFI) of LAG-3 expression was significantly lower on the cell surface of CD4+ T-cells from SS patients compared to CD4+ T-cells isolated from the blood of healthy donors (p < .0014) (). In contrast, the intensity of expression for BTLA (p < .0001) (), FCRL 3 (p < .0028) () and TIGIT (p < .0003) () was significantly higher on the cell surface of CD4+ T-cells from SS patients as compared to controls (). Although we observed a tendency for decreased intensity of CTLA-4 expression on CD4+ T-cells from SS patients, the differences were not statistically significant (p = .2022) ().
Figure 1. Divergent level of LAG-3 versus BTLA, TIGIT, and FCRL3 expression on total CD4+ blood T-cells from patients with Sézary syndrome. LAG-3, BTLA, FCRL3, TIGIT, and CTLA-4 expression in blood CD4+ T-cells from patients with Sèzary syndrome (SS) and healthy individuals (nml) was analyzed by flow cytometry. Left panels show significantly decreased mean fluorescence intensity (MFI) of LAG-3 (A) and increased MFI of BTLA (B), FCLR3(C) and TIGIT (D) on CD4+ T-cells from SS patients (in red) compared to CD4+ T-cells from healthy donors (in black). Each dot represents data obtained from one individual. Right panels show representative histograms of mean fluorescent intensities of LAG-3 (A), BTLA (B), FCLR3(C), TIGIT (D) and CTLA-4 (E) in CD4+ blood T-cells from SS patients (in red) and healthy individuals (in black).
Expression of immune checkpoint molecules on clonal (tumor) vs. non-clonal (non-tumor) CD4+ cells in Sézary syndrome
In SS patients, the peripheral CD4+ T-cell compartment contains the clonally expanded tumor T-cells as well as the non-clonal bystander CD4+ T-cells. To analyze the pattern and fluorescence intensity of immune checkpoint molecules’ expression on tumor and bystander T-cells, we identified patients with a conclusively identifiable malignant T-cell clone with commercially available TCR Vβ antibodies for flow cytometry. summarizes the patients’ clinical characteristics.
Table 1. Patients’ characteristics.
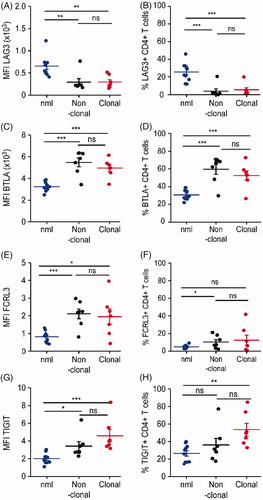
LAG-3 was downregulated on both clonal and non-clonal CD4+ T-cells from SS patients as compared to CD4+ T-cells from healthy controls. The mean MFI for LAG-3 was 294.8 ± 143.4 (153.2–516.1) in clonal, 292.8 ± 209.8 (170.8–766) in non-clonal and 652.7 ± 234.5 (409.4–1225) in healthy controls (). In addition, the percentage of LAG-3+ cells was lower for both clonal and non-clonal CD4+ T-cells from SS patients, respectively 5.496%±6.6 (1.22–20.02) and 3.92%±7.4 (0.04–20.52) LAG-3+ cells (). In contrast, in healthy controls, 25.6%±10.68 (11.99–45.94) of all CD4 + T-cells expressed LAG-3 (). Taken together, LAG-3 was statistically significantly downregulated on both clonal and non-clonal CD4+ T-cells from SS patients (p < .0007). However, the interindividual differences of LAG-3 expression between clonal and non-clonal were not statistically significant.
Figure 2. Expression of immune checkpoint molecules on clonal (tumor) vs. non-clonal (non-tumor) CD4+ cells in Sézary syndrome. CD4+ T-cells were isolated either from healthy donors (blue dots) or from SS patients. In blood samples from SS patients, CD4+ TCRVβ+ clonal tumor (red dots) and CD4+ TCRVβ- non-tumor (black dots) T lymphocytes were identified by TCR Vβ specific antibodies for flow cytometry. (A) Evaluation of the differences in the mean fluorescence intensity (MFI) for each marker of interest between healthy, clonal, and non-clonal T-cells. (B) Assessment of the differences in the percentage of positive for each marker of interest cells in the above defined T-cell populations.
In contrast to the global downregulation of LAG-3, all other studied immune checkpoint molecules - BTLA, FCRL3, and TIGIT were upregulated on both clonal and non-clonal CD4+ T-cells from SS patients.
With regard to BTLA, there was a significantly increased staining intensity in clonal and non-clonal cells (4949 ± 825.4 (3459–6137); 5478 ± 1086 (3432–6344)) compared to healthy controls (3245 ± 437.9; 2489–3876) (p < .0001) (). In line with this, the percentage of BTLA expressing cells from SS patients was significantly higher in clonal cells with 52.65%±13.91 (26.63–72.77), as well as in non-clonal cells with 59.61%±15.30 (29.76–70.89) than the percentage of BTLA expressing CD4+ T-cells from healthy individuals (p = .0005) ().
TIGIT and FCRL3 upregulation on both clonal and non-clonal SS CD4+ T-cells synchronous to BTLA upregulation. Intensity of FCRL 3 expression was high in non-clonal cells (2112 ± 735.1; 807.1–2978) and clonal CD4+ SS T-cells (1949 ± 1140; 436.5–3956) compared with T-cells from healthy individuals (892 ± 285.2; 460–1310) (). In addition, the percentage of FCRL3 expressing cells was higher in both clonal (12.47%±15.18 (0.71–41.73)) and non-clonal (10.29%±7.32 (2.28–21.14)) CD4+ SS T-cells than in healthy individuals (12.68%±12.34 (1.93–36.09)) (). Both clonal and non-clonal CD4+ T-cells isolated from SS patients stained more intensively for TIGIT than CD4+ T-cells isolated from healthy donors (2014 ± 604; 1099–3028; p < .0001) (p < .0006) (). Although there was a tendency for more intense TIGIT expression on clonal tumor cells compared to non-clonal bystander cells, the intra-individual difference in the intensity of TIGIT expression (MFI) between clonal (4583 ± 1833; 3166–8362) and non-clonal T-cells (3419 ± 1384; 2290–6380) was not significant in this patients’ cohort (p < .0973) (). Also, the percentage of TIGIT expressing CD4+ T-cells was significantly higher in total CD4+ T-cells from SS patients (47.45%±16.66 (25.84–78.26)) compared to healthy controls (26.49%±9.892 (14.19–39.80)) (p = .0043; data not shown). There was a distinct trend of higher TIGIT expression in clonal T-cells (53.61%±19.02 (32.94–85.04)) as compared to non-clonal T-cells (36.14%±20.09 (17.56–77.27)), but the differences were not statistically significant in this patients’ cohort ().
There was no statistically significant difference in either intensity of CTLA-4 expression or percentage cells expressing CTLA-4 on clonal versus non-clonal T-cells form SS patients (data not shown).
Intraindividual comparison of immune checkpoint molecule expression on clonal (tumor) vs. non-clonal (non-tumor) CD4+ cells in Sézary syndrome
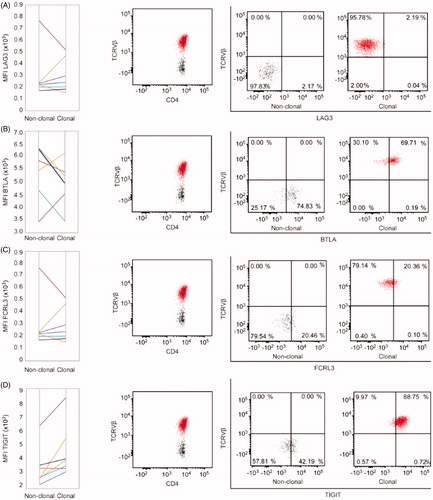
Variability and difficulty in collecting large numbers of human samples in a rare disease setting, such as SS, renders comparisons on an interindividual level challenging. For an intraindividual comparison, we analyzed the differences in the level of expression of LAG-3, BTLA, TIGIT, and FCRL3 on malignant, clonal T-cells and bystander, non-clonal T-cells in the blood of each individual patient with SS. Detailed pair-wise comparison showed slightly decreased expression of LAG-3 in 43% of all patients (). Expression of BTLA, FCRL3, and TIGIT was upregulated on the tumor T-cells in 29% (), 43% () and 86% () of the patients.
Figure 3. Intraindividual comparison of immune checkpoint molecules’ expression on clonal (tumor) vs. non-clonal (non-tumor) CD4+ cells in Sézary syndrome. (A) Pair-wise analysis of medium fluorescence intensity (MFI) in non-clonal and clonal CD4+ T-cells. Each color-indexed pair represents a data set from an individual patient with SS. (B) Representative example of flow cytometric identification of the malignant T-cell clone (red) and non-clonal T-cells (black) by staining with T-cell receptor Vβ antibodies specific for each patient’s malignant clone and evaluation of the differences in percentages of positive cells for each marker of interest between clonal and non-clonal T-cells.
Discussion
SS is a malignancy of mainly CD4+ T-cells and CD4+ T cells play an essential role in promoting effector immune responses. In solid tumors, CD4+ Th1 cells drive tumor senescence [Citation44]. In SS, malignant CD4+ cells lose their ability to acquire a Th1 phenotype, may acquire features of Tregs and IL-17 production [Citation45], they secrete Th2 cytokines and enforce immune suppression and a global Th2 bias in non-tumor T-cells [Citation46,Citation47]. Continuous antigen presentation by immature dendritic cells may lead to T-cell exhaustion in CTCL [Citation47], followed by silencing of T-cells mediated immune responses, decreased cytokine secretion of TNF-α, IL-2, and IFN-γ by memory T-cells and subsequent uncontrolled progression of infections, inflammatory, and tumor processes [Citation48–50]. Exhaustion may also result in an inefficacy of CAR T cells or other novel treatment modality [Citation51].
In acute myeloid leukemia, T cell exhaustion of bystander CD8+ lymphocytes has been discussed [Citation52]. In SS patients, CD8+ cells down-regulate activation markers CD127/IL-7R and CD26 and remained unresponsive to IL-7 stimulation. This has been attributed to their chronic activation due to the massive proliferation of malignant CD4 + T cells [Citation53].
T-cell exhaustion can be temporary and effective T-cell responses can be restored by a pharmacologic inhibition of the inhibitory receptors: CTLA-4, PD-1, TIGIT, LAG-3, BTLA, TIM3, and PD-1H [Citation50].
We investigated the expression of the checkpoint molecules BTLA, CTLA-4, FCRL3, LAG-3, and TIGIT on blood T helper subsets from SS patients. We observed a previously non reported and significant increases in the expression of BTLA on both tumor and non-tumor T-cells from SS patients. In parallel, we further found increased FCRL3 and TIGIT expression in SS tumor cells. These results are in line with the work of Jariwala et al. documenting the high expression of FRCL3 and TIGIT on CD4+ SS cells [Citation40]. Also, Wysocka et al. reported FCRL3 expression in patients with high tumor burden [Citation41]. In these studies, TIGIT and/or FCRL3 expression showed a correlation with an increase in single TCRVβ+CD4+ cells or loss of CD26 expression [Citation40]. However, in our patients’ cohort, both TIGIT and FCRL3 were found to be similarly upregulated on both tumor and bystander CD4+ T-cells, despite a distinct trend for the higher expression of BTLA and TIGIT in clonal cells. On the one hand, this lack of significance may be attributed to the small number of patients included in the study. On the other hand, the fact that non-clonal CD4+ cells also overexpress negative checkpoint regulators suggests that bystander CD4+ cells also have an immunosuppressive phenotype, which could contribute to the ineffective immune response observed in SS patients.
In line with this, an elegant study by Querfeld et al. assessing the expression profile of immune checkpoints in CTCL skin samples suggested that the exhaustion phenotype is a common characteristic of both helper and cytotoxic CTCL skin cells [Citation10]. In that study, gene expression profiling demonstrated upregulation of several immune checkpoints (PD-1, PD-L1, TIM2, CTLA-4, LAG-3) and IL-10 in advanced CTCL [Citation10]. Additionally, in flow cytometry, there were increased percentages of CD4+ PD-1, CTLA-4, and LAG-3 expressing cells and more CTLA-4 and LAG-3 expressing CD8+ cells as compared to healthy controls [Citation10]. Interestingly, CTCL skin also contained more T-cells expressing the inducible T-cell costimulator (ICOS), a marker of T-cell activation [Citation10]. Altogether, this informative analysis postulates that in CTCL skin, exhaustion of activated T-cells being a hallmark of both skin CD4+ and CD8+ T-cells, the expression of checkpoint inhibitors increasing during the course of the disease progression. While Querfeld et al. observed increased LAG-3 expression in lesional MF skin samples, in our study, SS cells showed a decreased intensity of LAG-3 staining and a decrease in the percentage of LAG-3 expressing CD4+ blood T-cells. This may be explained by the fact that MF and SS arise from distinct T-cell subsets [Citation54] but nevertheless should be further investigated in larger comparative cohorts.
By now, several advanced clinical studies address TIGIT as a target molecule. In our view, this concomitant targeting of malignant clonal and bystander CD4+ cells along with unblocking the response of CD8+ cells and boosting NK cell activity holds remarkable potential in CTCL as well.
The hitherto non-reported overexpression of BTLA in SS is of interest, as BTLA-blockade would arrest T-cell proliferation and hypothetically, in the case of SS patients, malignant T-cells would be specifically targeted. Recently, a specific fragment (HVEM 26–28), which is involved in the binding of the BTLA/HVEM complex has been designed to block the interaction of BTLA and HVEM in vitro [Citation55]. However, to our knowledge no in vivo studies have been conducted so far.
Altogether, we identify BTLA and confirms LAG-3 and TIGIT as potential immune modulatory targets for therapy of CTCL and specifically of SS. As immune checkpoints have non-redundant roles in cancer progression, other emerging regulatory molecules (TIM-3, CD96 (TACTILE), PD-1H (VISTA)) may be of interest in CTCL too.
Potential conflict of interest
Disclosure forms provided by the authors are available with the full text of this article online at https://doi.org/10.1080/10428194.2018.1564827.
Additional information
Funding
References
- Janiga J, Kentley J, Nabhan C, et al. Current systemic therapeutic options for advanced mycosis fungoides and Sézary syndrome. Leuk Lymphoma. 2018;59:562–577.
- Scarisbrick JJ, Prince HM, Vermeer MH, et al. Cutaneous lymphoma international consortium study of outcome in advanced stages of mycosis fungoides and Sezary syndrome: effect of specific prognostic markers on survival and development of a prognostic model. Jco. 2015;33:3766–3773.
- Axelrod PI, Lorber B, Vonderheid EC. Infections complicating mycosis fungoides and Sézary syndrome. Jama. 1992;267:1354–1358.
- Lesokhin AM, Ansell SM, Armand P, et al. Nivolumab in patients with relapsed or refractory hematologic malignancy: preliminary results of a phase Ib study. Jco. 2016;34:2698–2704.
- Brahmer JR, Tykodi SS, Chow LQ, et al. Safety and activity of anti-PD-L1 antibody in patients with advanced cancer. N Engl J Med. 2012;366:2455–2465.
- Topalian SL, Hodi FS, Brahmer JR, et al. Safety, activity, and immune correlates of anti-PD-1 antibody in cancer. N Engl J Med. 2012;366:2443–2454.
- Sznol M, Chen L. Antagonist antibodies to PD-1 and B7-H1 (PD-L1) in the treatment of advanced human cancer-response. Clin Cancer Res. 2013;19:5542.
- Xia Y, Medeiros LJ, Young KH. Immune checkpoint blockade: releasing the brake towards hematological malignancies. Blood Rev. 2016;30:189–200.
- Cetinozman F, Jansen PM, Vermeer MH, et al. Differential expression of programmed death-1 (PD-1) in Sézary syndrome and mycosis fungoides. Arch Dermatol. 2012;148:1379–1385.
- Querfeld C, Leung S, Myskowski PL, et al. Primary T cells from cutaneous T-cell lymphoma skin explants display an exhausted immune checkpoint profile. Cancer Immunol Res. 2018; 8:900–909.
- Yuan Y, Kos FJ, He TF, et al. Complete regression of cutaneous metastases with systemic immune response in a patient with triple negative breast cancer receiving p53MVA vaccine with pembrolizumab. Oncoimmunology. 2017;6:e1363138.
- Wartewig T, Kurgyis Z, Keppler S, et al. PD-1 is a haploinsufficient suppressor of T cell lymphomagenesis. Nature. 2017;552:121–125.
- Pardoll DM. The blockade of immune checkpoints in cancer immunotherapy. Nat Rev Cancer. 2012;12:252–264.
- Derre L, Rivals JP, Jandus C, et al. BTLA mediates inhibition of human tumor-specific CD8+ T cells that can be partially reversed by vaccination. J Clin Invest. 2010;120:157–167.
- Quan L, Lan X, Meng Y, et al. BTLA marks a less cytotoxic T-cell subset in diffuse large B-cell lymphoma with high expression of checkpoints. Exp Hematol. 2018;60:47–56.e1.
- Yuan B, Zhao L, Fu F, et al. A novel nanoparticle containing MOG peptide with BTLA induces T cell tolerance and prevents multiple sclerosis. Mol Immunol. 2014;57:93–99.
- Nakagomi D, Suzuki K, Hosokawa J, et al. Therapeutic potential of B and T lymphocyte attenuator expressed on CD8+ T cells for contact hypersensitivity. J Invest Dermatol. 2013;133:702–711.
- Sawaf M, Fauny JD, Felten R, et al. Defective BTLA functionality is rescued by restoring lipid metabolism in lupus CD4 + T cells. JCI Insight. 2018;3:e99711.
- Liu X, Alexiou M, Martin-Orozco N, et al. Cutting edge: a critical role of B and T lymphocyte attenuator in peripheral T cell tolerance induction. J Immunol. 2009;182:4516–4520.
- Zhao Q, Huang ZL, He M, et al. BTLA identifies dysfunctional PD-1-expressing CD4(+) T cells in human hepatocellular carcinoma. Oncoimmunology. 2016;5:e1254855.
- Marin-Acevedo JA, Dholaria B, Soyano AE, et al. Next generation of immune checkpoint therapy in cancer: new developments and challenges. J Hematol Oncol. 2018;11:39.
- Goldberg MV, Drake CG. LAG-3 in Cancer Immunotherapy. Curr Top Microbiol Immunol. 2011;344:269–278.
- Anderson AC, Joller N, Kuchroo VK. Lag-3, Tim-3, and TIGIT: co-inhibitory receptors with specialized functions in immune regulation. Immunity. 2016;44:989–1004.
- Wierz M, Pierson S, Guyonnet L, et al. Dual PD1/LAG3 immune checkpoint blockade limits tumor development in a murine model of chronic lymphocytic leukemia. Blood. 2018;131:1617–1621.
- Berrien-Elliott MM, Jackson SR, Meyer JM, et al. Durable adoptive immunotherapy for leukemia produced by manipulation of multiple regulatory pathways of CD8+ T-cell tolerance. Cancer Res. 2013;73:605–616.
- Blake SJ, Dougall WC, Miles JJ, et al. Molecular pathways: targeting CD96 and TIGIT for cancer immunotherapy. Clin Cancer Res. 2016;22:5183–5188.
- Baumeister SH, Freeman GJ, Dranoff G, et al. Coinhibitory pathways in immunotherapy for cancer. Annu Rev Immunol. 2016;34:539–573.
- Joller N, Lozano E, Burkett PR, et al. Treg cells expressing the coinhibitory molecule TIGIT selectively inhibit proinflammatory Th1 and Th17 cell responses. Immunity. 2014;40:569–581.
- Kourepini E, Paschalidis N, Simoes DC, et al. TIGIT enhances antigen-specific Th2 recall responses and allergic disease. JI. 2016;196:3570–3580.
- Yu X, Harden K, Gonzalez LC, et al. The surface protein TIGIT suppresses T cell activation by promoting the generation of mature immunoregulatory dendritic cells. Nat Immunol. 2009;10:48–57.
- Chauvin JM, Pagliano O, Fourcade J, et al. TIGIT and PD-1 impair tumor antigen-specific CD8(+) T cells in melanoma patients. J Clin Invest. 2015;125:2046–2058.
- Johnston RJ, Comps-Agrar L, Hackney J, et al. The immunoreceptor TIGIT regulates antitumor and antiviral CD8(+) T cell effector function. Cancer Cell. 2014;26:923–937.
- Catakovic K, Gassner FJ, Ratswohl C, et al. TIGIT expressing CD4 + T cells represent a tumor-supportive T cell subset in chronic lymphocytic leukemia. Oncoimmunology. 2018;7:e1371399.
- Guillerey C, Harjunpaa H, Carrie N, et al. TIGIT immune checkpoint blockade restores CD8(+) T cell immunity against multiple myeloma. Blood. 2018;132:1689–1694.
- Kong Y, Zhu L, Schell TD, et al. T-cell immunoglobulin and ITIM domain (TIGIT) associates with CD8+ T-cell exhaustion and poor clinical outcome in aml patients. Clin Cancer Res. 2016;22:3057–3066.
- Polson AG, Zheng B, Elkins K, et al. Expression pattern of the human FcRH/IRTA receptors in normal tissue and in B-chronic lymphocytic leukemia. Int Immunol. 2006;18:1363–1373.
- Won WJ, Foote JB, Odom MR, et al. Fc receptor homolog 3 is a novel immunoregulatory marker of marginal zone and B1 B cells. J Immunol. 2006;177:6815–6823.
- Bin Dhuban K, d'Hennezel E, Nashi E, et al. Coexpression of TIGIT and FCRL3 identifies Helios + human memory regulatory T cells. J Immunol. 2015;194:3687–3696.
- Dulphy N, Berrou J, Campillo JA, et al. NKG2D ligands expression and NKG2D-mediated NK activity in Sezary patients. J Invest Dermatol. 2009;129:359–364.
- Jariwala N, Benoit B, Kossenkov AV, et al. TIGIT and helios are highly expressed on CD4+ T cells in Sézary syndrome patients. J Invest Dermatol. 2017;137:257–260.
- Wysocka M, Kossenkov AV, Benoit BM, et al. CD164 and FCRL3 are highly expressed on CD4 + CD26- T cells in Sézary syndrome patients. J Invest Dermatol. 2014;134:229–236.
- Benoit BM, Jariwala N, O’Connor G, et al. CD164 identifies CD4(+) T cells highly expressing genes associated with malignancy in Sezary syndrome: the Sezary signature genes, FCRL3, Tox, and miR-214. Arch Dermatol Res. 2017;309:11–19.
- Trautinger F, Eder J, Assaf C, et al. European Organisation for Research and Treatment of Cancer consensus recommendations for the treatment of mycosis fungoides/Sézary syndrome - Update 2017. Eur J Cancer. 2017;77:57–74.
- Braumuller H, Wieder T, Brenner E, et al. T-helper-1-cell cytokines drive cancer into senescence. Nature. 2013;494:361–365.
- Wolk K, Mitsui H, Witte K, et al. Deficient cutaneous antibacterial competence in cutaneous T-cell lymphomas: role of Th2-mediated biased Th17 function. Clin Cancer Res. 2014;20:5507–5516.
- Guenova E, Watanabe R, Teague JE, et al. TH2 cytokines from malignant cells suppress TH1 responses and enforce a global TH2 bias in leukemic cutaneous T-cell lymphoma. Clin Cancer Res. 2013;19:3755–3763.
- Rubio Gonzalez B, Zain J, Rosen ST, et al. Tumor microenvironment in mycosis fungoides and Sézary syndrome. Curr Opin Oncol. 2016;28:88–96.
- Yi JS, Cox MA, Zajac AJ. T-cell exhaustion: characteristics, causes and conversion. Immunology. 2010;129:474–481.
- Wherry EJ, Kurachi M. Molecular and cellular insights into T cell exhaustion. Nat Rev Immunol. 2015;15:486–499.
- Catakovic K, Klieser E, Neureiter D, et al. T cell exhaustion: from pathophysiological basics to tumor immunotherapy. Cell Commun Signal. 2017;15:1.
- Kasakovski D, Xu L, Li Y. T cell senescence and CAR-T cell exhaustion in hematological malignancies. J Hematol Oncol. 2018;11:91.
- Wang M, Bu J, Zhou M, et al. CD8 + T cells expressing both PD-1 and TIGIT but not CD226 are dysfunctional in acute myeloid leukemia (AML) patients. Clin Immunol. 2018;190:64–73.
- Torrealba MP, Manfrere KC, Miyashiro DR, et al. Chronic activation profile of circulating CD8 + T cells in Sezary syndrome. Oncotarget. 2018;9:3497–3506.
- Campbell JJ, Clark RA, Watanabe R, et al. Sezary syndrome and mycosis fungoides arise from distinct T-cell subsets: a biologic rationale for their distinct clinical behaviors. Blood. 2010;116:767–771.
- Spodzieja M, Lach S, Iwaszkiewicz J, et al. Design of short peptides to block BTLA/HVEM interactions for promoting anticancer T-cell responses. PLoS One. 2017;12:e0179201.