
Abstract
This report summarizes a totality-of-evidence approach supporting recommendation of a 320-mg total daily dose, either as 160-mg twice daily (BID) or 320-mg once daily (QD) for zanubrutinib in patients with mantle cell lymphoma. Data were derived from a phase 2 study in patients receiving 160-mg BID and a phase 1/2 study with similar response rates observed with 160-mg BID or 320-mg QD. Given the limited number of patients in the QD dose group, population pharmacokinetics and exposure–response analyses were employed to bridge the two regimens. The analyses showed that similar plasma exposure and BTK inhibition were achieved, and differences in trough concentration and maximum plasma concentration between the two regimens are unlikely to have a meaningful impact on efficacy and safety endpoints. The totality of data, including pharmacokinetic, pharmacodynamic, safety, efficacy, and exposure–response analyses, provided support for the recommended 320-mg total daily dose for the approved indication.
Introduction
The advent of Bruton’s tyrosine kinase (BTK) inhibitors has revolutionized the treatment of B-cell lymphomas [Citation1]. Bruton’s tyrosine kinase is an important component of the B-cell receptor (BCR) signaling pathway, which is an important regulator of B-cell proliferation, chemotaxis, adhesion, and survival [Citation2]. Aberrant activation of BTK has been observed in various B-cell malignancies [Citation2]. Inhibitors of BTK with indications across B-cell neoplasms have the potential to benefit more patients and generate better outcomes by complementing or replacing previous treatment options such as chemotherapy or immunotherapy [Citation1,Citation3]. A second-generation irreversible BTK inhibitor, zanubrutinib (BRUKINSA®), was granted accelerated approval by the United States (US) Food and Drug Administration (FDA) for the treatment of adult patients with relapsed or refractory (R/R) mantle cell lymphoma (MCL) who have received at least one prior therapy.
Zanubrutinib was designed to overcome some of the limitations associated with the first-generation BTK inhibitor, ibrutinib. Zanubrutinib is more selective than ibrutinib, minimizing binding with off-target kinases [Citation4]. Following oral administration, higher therapeutic concentrations can be achieved with zanubrutinib, and at the recommended total dose (320-mg per day), the free drug exposure of zanubrutinib in patients with B-cell malignancy is approximately 8-fold higher than that for ibrutinib at 560 mg once daily (QD) [Citation5]. Translation of these favorable pharmacological and pharmacokinetic (PK) attributes appears to be consistent with clinical data in which clinically meaningful benefits with respect to safety and efficacy compared with ibrutinib were demonstrated in a randomized head-to-head phase 3 study in patients with Waldenström macroglobulinemia (WM) [Citation6,Citation7].
All currently approved irreversible BTK inhibitors have a half-life (t½) of no more than 6 h, with 1 h for acalabrutinib and 4 to 6 h for ibrutinib [Citation8,Citation9]. The approved dose schedule for ibrutinib and acalabrutinib are QD and twice daily (BID), respectively. Zanubrutinib has an elimination t½ of approximately 2 to 4 h and an approximately dose-proportional increase from 40-mg to 320-mg [Citation10]. The current dose recommendation in the US prescribing information for zanubrutinib in patients with R/R MCL is 160-mg BID or 320-mg QD [Citation11], which is based on the efficacy and safety findings from two clinical studies (BGB-3111-AU-003 [NCT02343120] and BGB-3111-206 [NCT03206970]), supported by the safety data from other zanubrutinib monotherapy studies BGB-3111-1002 [NCT03189524], and including BGB-3111-205 [NCT03206918]. The primary study supporting the efficacy of zanubrutinib, BGB-3111-206 was a single-arm, multicenter study in 86 MCL patients treated BID with 160-mg zanubrutinib [Citation12]. The efficacy of zanubrutinib was further supported by data from a subpopulation of 32 MCL patients treated with either 160-mg BID or 320-mg QD in a phase 1/2, open-label, dose-escalation/expansion study (BGB-3111-AU-003) [Citation13]. Doses of 40-, 80-, 160-, and 320-mg QD and 160-mg BID were evaluated, the maximum tolerated dose (MTD) was not reached and no dose-limiting toxicities were observed during the dose-escalation part of the study [Citation13].
For cancer therapies, dose selection to optimize effectiveness, minimize toxicity, and promote treatment adherence is challenging. Selection between QD or BID dosing for oral targeted cancer therapies are often an important component of consideration and discussion during clinical development [Citation14]. Here we describe a summary of data and analyses that were used to support the recommendation of the 320-mg QD dose in addition to the 160-mg BID dose for zanubrutinib in patients with R/R MCL.
Materials and methods
Clinical studies and patient populations
Clinical studies on the patient populations from which data were derived have been previously published [Citation7,Citation10,Citation12,Citation15]. In brief, BGB-3111-206 was a single-arm, open-label, multicenter phase 2 study that evaluated the efficacy and safety of zanubrutinib in patients with R/R MCL. This study enrolled 86 patients with R/R MCL who had not responded or had relapsed after one to five prior treatment regimens. Patients were treated with zanubrutinib 160-mg BID until disease progression or unacceptable toxicity [Citation12]. This study also characterized the PK of zanubrutinib as an exploratory objective following single- and multiple-dose regimens in 20 patients. BGB-3111-AU-003 was a multicenter, phase 1, first-in-human study of zanubrutinib administered at starting doses of 40-mg, 80-mg, 160-mg, or 320-mg QD or 160-mg BID in patients with B-cell malignancies [Citation10]. The study comprised two parts: dose escalation (Part 1) and cohort expansion (Part 2). Part 1 evaluated the safety, PK, and pharmacodynamics (PD; i.e. BTK occupancy in peripheral blood mononuclear cells [PBMCs]) in patients with R/R B-cell malignancies who had received at least one prior therapy. Part 2 characterized the safety and preliminary efficacy of zanubrutinib in multiple cohorts of patients with B-cell malignancies, including chronic lymphocytic leukemia/small lymphocytic lymphoma (CLL/SLL), MCL, and WM. This study enrolled 37 patients with R/R MCL; 32 of these 37 patients were treated at the recommended phase 2 dose of either 320-mg QD (n = 18) or 160-mg BID (n = 14).
Supportive safety data following zanubrutinib monotherapy were collected from three other studies: BGB-3111-302, -1002, and -205. BGB-3111-205 was a single-arm, open-label, multicenter phase 2 study conducted in China in patients with histologically confirmed, R/R CLL/SLL after ≥1 prior line of treatment [Citation15]. BGB-3111-1002 was a phase 1 study conducted in Chinese patients with B-cell malignancies to assess the safety, tolerability, PK, PD, and antitumor effects of zanubrutinib at 320-mg QD or 160-mg BID in Chinese patients with B-cell malignancies. BGB-3111-302 is a phase 3, randomized, open-label study comparing the efficacy and safety of the BTK inhibitors zanubrutinib (at a dose of 160-mg BID) and ibrutinib (at a dose of 420-mg QD) in patients with WM [Citation7]. The primary objective was to compare the efficacy of zanubrutinib versus ibrutinib in patients with MYD88-mutated (MYD88mut) WM. This study also characterized the PK of zanubrutinib from a total of 129 zanubrutinib-treated patients.
Pharmacokinetic analysis and simulations
A previously developed population PK model was applied to predict zanubrutinib exposure [Citation16]. Zanubrutinib plasma concentration–time profiles were simulated using the Bayesian post hoc individual PK parameters, assuming linear PK, following actual zanubrutinib dose regimens for 10 days [Citation16]. The area under the plasma concentration–time curve from time 0 to 24 h at steady state (AUC0-24,ss), the maximum plasma concentration at steady-state (Cmax,ss) and the trough concentration at steady state (Cmin,ss) were computed for each subject and used in the exposure–response (E–R) analysis. Because zanubrutinib reached a steady state within 1 day with no appreciable accumulation after repeat dosing, Cmax,ss and Cmax, and Cmin,ss and Cmin are used interchangeably here.
Pharmacodynamic data collection and analysis
To estimate BTK inhibition of zanubrutinib, samples were collected to assess BTK occupancy in the BGB-3111-AU-003 study [Citation10] at Week 1 Day 1 at pre-dose, 4 h, and 24 h; Week 1 Day 3 pre-dose; and Week 2 Day 1 pre-dose in PBMC samples at 40-mg to 320-mg QD doses and 160-mg BID doses in patients with B-cell lymphomas. Occupancy of BTK by zanubrutinib was evaluated in PBMCs at 40- to 320-mg doses from 43 patients (n = 18 for 160-mg BID; n = 9 for 320-mg QD). The occupancy of BTK in nodal tissues was evaluated at 160-mg BID and 320-mg QD doses in paired biopsies from 30 patients. An enzyme-linked immunosorbent assay was used to measure BTK occupancy in PBMCs and lymph node biopsy samples; percentage of BTK occupancy was calculated by measuring both free BTK protein in the cell lysates and total BTK protein levels [Citation10].
Estimation of unbound zanubrutinib concentrations relative to IC50 for BTK inhibition was based on zanubrutinib plasma concentrations, taking into account plasma protein binding of zanubrutinib, which was approximately 94% [Citation11]. The IC50 value (0.5 nM) of zanubrutinib was measured at Km of ATP for the kinases and with 1-hour pre-incubation using a time-resolved fluorescence energy transfer biochemical assay [Citation4].
Clinical efficacy in patients with MCL
In the BGB-3111-206 study, the primary endpoint was objective response rate (ORR), defined as either partial response (PR) or complete response (CR) according to the Revised International Working Group Criteria for Malignant Lymphomas (the Lugano Classification) [Citation17]. Response evaluations were based on fluorodeoxyglucose positron emission tomography–computed tomography (PET-CT) scans, bone marrow biopsies, and gastrointestinal endoscopy, as assessed by an independent review committee (IRC). Response assessments, including imaging studies, were performed every 12 weeks for 96 weeks and every 24 weeks thereafter until disease progression or study withdrawal. Secondary endpoints included duration of response (DoR), time to response (TTR), PFS, and safety. In the BGB-3111-AU-003 study, efficacy endpoints were ORR and rates of CR and PR (including PR with lymphocytosis), using published criteria and CT imaging [Citation13]. Bone marrow examination was required at the time of screening and to confirm CR.
Safety data analysis
Treatment-emergent AEs were recorded until 28 days after the last dose of study treatment or until resolution of drug-related AEs, graded according to National Cancer Institute Common Terminology Criteria for Adverse Events, version 4.03, and coded using the Medical Dictionary for Regulatory Activities, version 22.0. The incidence and severity of AEs of interest were prespecified based on the known toxicity for the BTK inhibitor class. These AEs included infections, bleeding (including major hemorrhage), hypertension, atrial fibrillation/flutter, secondary primary malignancies, and peripheral blood cytopenias.
Exposure–response analysis for efficacy and safety endpoints
Exposure–response analysis [Citation18,Citation19] was used to assess exposure–efficacy relationships in patients with MCL and exposure–safety relationships in patients with B-cell malignancies across clinical studies of zanubrutinib monotherapy. The analyses were performed using data from all patients who had ≥1 set of the estimated PK parameters. The population PK model predicted individual AUCss, Cmax,ss, and Cmin,ss values were merged with the corresponding efficacy or safety data. Across these studies, zanubrutinib was administered at doses of 40-mg, 80-mg, 160-mg, or 320-mg QD, or 160-mg BID. The E–R analysis for the efficacy endpoint (ORR) was performed using pooled data from 51 patients in the BGB-3111-206 (n = 20) and BGB-3111-AU-003 (n = 31) studies. The efficacy of zanubrutinib, measured as ORR versus PK exposure, was investigated. A total of 542 patients from five studies were included in the exposure safety analyses. The E–R relationship was assessed between zanubrutinib exposure metrics (AUC0-24,ss, Cmax,ss, and Cmin,ss) and safety endpoints, including AEs leading to treatment discontinuation and AEs of interest (grade ≥3 neutropenia, thrombocytopenia, anemia, and infections/infestations; secondary primary malignancies, atrial fibrillation/flutter, major bleeding events, and bleeding events). In the exploratory analysis stage, for binary response variables, exposure boxplots were stratified by response values and the probability of response was plotted against exposure after binning patients according to exposure quantiles. If an apparent relationship was not evident based on the exploratory analysis, additional logistic regression modeling was not conducted.
Results
Comparison of zanubrutinib exposures at 160-mg BID and 320-mg QD
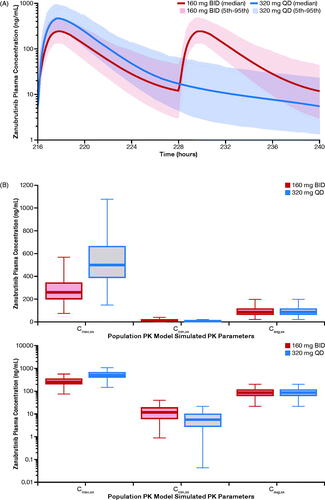
Population PK model–simulated concentration–time profiles of zanubrutinib at steady state are shown in . The simulated exposure metrics for the zanubrutinib 160-mg BID–based versus 320-mg QD–based population PK analysis are summarized in . Because the PK profile of zanubrutinib is linear from 40- to 320-mg doses, simulations showed the same AUC0-24,ss estimate of 2042 ng·h/mL following both 160-mg BID and 320-mg QD dosing. The geometric mean (%CV) zanubrutinib Cmax,ss was 264 (42%) ng/mL following the 160-mg BID dose and was 513 (41.8%) ng/mL following the 320-mg QD dose. Both dose schedules had comparable average plasma concentration at steady state (Cavg,ss), but the 320-mg QD dose had a lower Cmin,ss and a higher Cmax,ss relative to the 160-mg BID dose ().
Figure 1. (A) Population PK model–simulated time-course PK profile of zanubrutinib in patients following 160-mg QD or 320-mg QD dose. (B) Simulated steady-state exposures of zanubrutinib stratified by treatment in linear scale (top) and semi-log scale (bottom). The median is represented by the horizontal line in the middle of each box. The top and bottom ends of the box plot represent the 25th and 75th percentile (the lower and upper quartiles, respectively). The bars extending from the ends of the box to the outermost data represent 1.5× (the upper or lower interquartile range). BID: twice daily; Cavg,ss: average plasma concentration at steady state; Cmax,ss: steady-state maximum plasma concentration; Cmin,ss: trough plasma concentration; PK: pharmacokinetic; QD: once daily.
BTK occupancy following zanubrutinib treatment by dose regimen
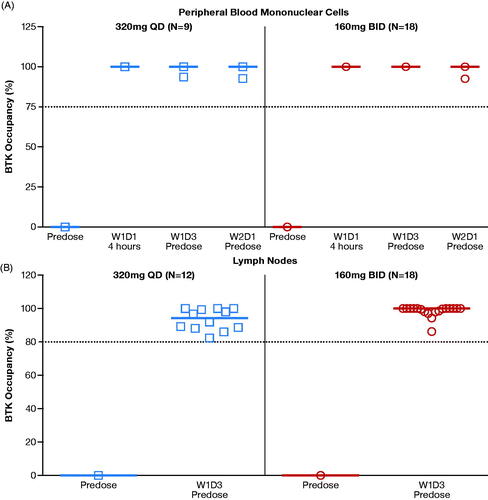
The median BTK occupancy in PBMCs at each time point was 100% at all doses, except at the 80-mg QD dose (N = 4), which had a median BTK occupancy >80% at all post-dose time points. A comparison of BTK occupancy in PBMCs at 160-mg BID and 320-mg QD doses is shown in . For both dosing regimens, median BTK occupancy in PBMCs was 100% across all time points, including those at Ctrough (pre-dose samples prior to dosing on Week 2 Day 1) when zanubrutinib plasma concentrations had dropped to almost undetectable levels (). The occupancy of BTK by zanubrutinib in lymph nodes was >80% in all evaluated patient samples (n = 30); the median BTK occupancy reached 94% in the 320-mg QD group (n = 12) and 100% in the 160-mg BID group (n = 18) (), indicating consistent and sustained BTK occupancy by zanubrutinib in target tissues (lymph nodes). Because it was noted that the median BTK occupancy was numerically lower at the 320-mg QD dose than at the 160-mg BID dose, additional data and analyses (described below) were used to assess whether the difference in BTK occupancy would have a meaningful clinical impact.
Figure 2. (A) Zanubrutinib BTK occupancy in peripheral blood mononuclear cells by dose regimen. (B) Zanubrutinib BTK occupancy in lymph nodes by dose regimen. Median values are shown as lines through the individual symbols. BID: twice a day; BTK: Bruton’s tyrosine kinase; N: number of patients; QD: once a day; W1D1: Week 1 Day 1; W1D3: Week 1 Day 3; W2D1: Week 2 Day 1.
Ctrough coverage relative to IC50 of BTK inhibition during the dose interval
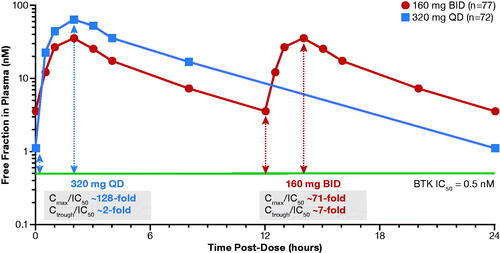
Due to its selectivity, zanubrutinib can be administered at higher doses, achieving sustained therapeutic concentrations for longer time periods when compared with other approved BTK inhibitors. shows unbound drug exposure achieved by zanubrutinib relative to the half maximal inhibitory concentration (IC50) levels needed to inhibit BTK. As shown in , zanubrutinib has exposure coverage above IC50 during the entire dose interval for both BID and QD dosing schedules. The ratio of Ctrough/IC50 is approximately 7 and 2 for the BID and QD doses, respectively, indicating Ctrough concentrations maintained at a level that was 7- and 2-fold higher than the IC50 during the 24-hour dosing period, respectively. Although the zanubrutinib 320-mg QD regimen has a lower Ctrough than those at 160-mg BID, Ctrough levels at both dose regimens are higher than the required exposure coverage for BTK inhibition (IC50).
Figure 3. Zanubrutinib concentration-time profiles (unbound) relative to IC50 of BTK inhibition. BID: twice daily; BTK: Bruton’s tyrosine kinase; Cmax: maximum plasma concentration; Ctrough/IC50: trough plasma concentration/half maximal inhibitory concentration ratio; QD: once daily.
Clinical efficacy and safety data for 160-mg BID and 320-mg QD dosing
The exposure coverage above the IC50 threshold during the entire dose interval appears consistent with favorable objective response for both zanubrutinib dosing schedules. As seen in , the ORR in these patients was 84.4%, with a median DoR of 18.5 months. Both ORR and DoR were similar for the 160-mg BID and 320-mg QD dosing regimens. There was no clinically meaningful difference in objective response between the two regimens. Similarly, there were no remarkable differences in safety and tolerability profiles between 160-mg BID (N = 278) and 320-mg QD (N = 95) dosing regimens based on the safety dataset (). Incidences of atrial fibrillation, contusion, diarrhea, hemorrhage, pneumonia, grade ≥3 AEs, and AEs leading to treatment discontinuation were comparable. Interestingly, there was a trend toward higher rates of hematologic AEs (e.g. neutropenia) with the 160-mg BID dose, but two dose regimens were assessed at different times in the study and in different patient cohorts. A comparison of AE profiles between the two dose regimens was also conducted using a larger safety dataset (160-mg BID: N = 662 vs 320-mg QD: N = 105; BeiGene internal data), and no remarkable differences were observed between the two regimens.
Table 1. Response to treatment (IRC-assessed) with zanubrutinib 160-mg BID compared with 320-mg QD in patients with MCL in Study BGB-3111-AU-003 (NCT02343120).
Table 2. Treatment-emergent adverse events following zanubrutinib treatment in patients with B-cell malignancies in Study BGB-3111-AU-003.
Exposure–response analysis of efficacy and safety
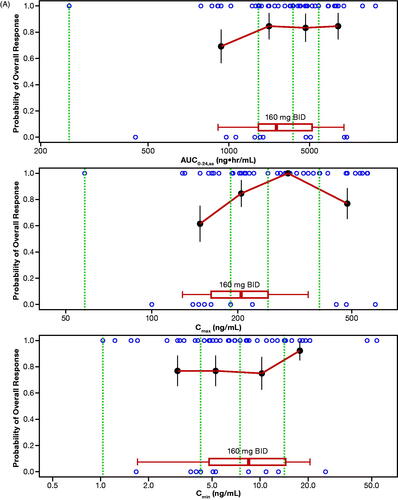
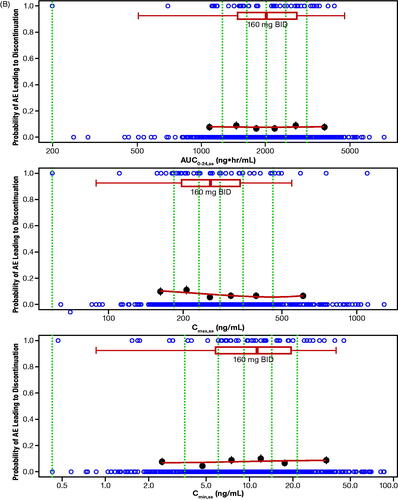
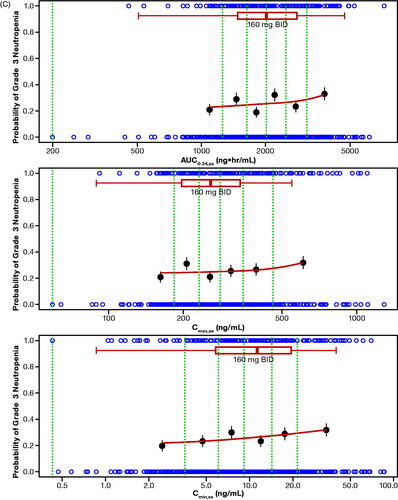
The probability of ORR by quantiles of zanubrutinib exposure is shown in . No statistically significant relationship was identified for E–R for efficacy per IRC as determined by logistic regression across the assessed dose range of 40 mg to 320 mg (). Of note, this analysis was limited by the small number of patients who received doses less than 320 mg per day (n = 5), and the majority of patients (>85%) receiving 320 mg per day responded to zanubrutinib treatment. Exposure–safety analyses showed that there were no evident E–R relationships between PK exposure (AUC0-24,ss, Cmax,ss, or Cmin,ss) and the probability of occurrence of specified AEs of interest or AEs leading to treatment discontinuation. The exposure ranges appeared to be similar in patients who experienced AEs of interest relative to those who did not. Plots showing a probability of AE leading to treatment discontinuation () or grade ≥3 neutropenia () versus steady-state exposures (AUC0-24,ss and Cmin,ss) are shown. Similarly, no evident E–R relationships were observed for other safety endpoints, including grade ≥3 neutropenia, grade ≥3 thrombocytopenia, grade ≥3 anemia, grade ≥3 infections/infestations, all events of secondary primary malignancies, all events of atrial fibrillation and flutter, and any major or minor bleeding events. Overall, there were no evident E–R relationships between PK exposure (AUC0-24,ss, Cmax,ss, or Cmin,ss) and the safety endpoints, and higher Cmax,ss from the 320-mg QD dose was not associated with a higher rate of AEs relative to the 160-mg BID dose.
Figure 4. (A) Exposure–response analysis for efficacy endpoints: Probability of overall response rate (by IRC) in Studies BGB-3111-AU-003 (NCT02343120) and BGB-3111-206 (NCT3206970) in patients with R/R MCL. (B) Exposure–response analysis for safety endpoints: probability of AE leading to discontinuation. (C) Exposure–response analysis for safety endpoints: probability of grade ≥3 neutropenia vs steady-state exposures. The blue open circles reflect the observed events in zanubrutinib-treated patients. The black solid circles are the observed probability of endpoints and the error bars are the standard errors (calculated as sqrt (P*(1-P)/N), where P is probability of endpoint and N is the number of patients in each quantile bin) for quantiles (at 100 x (1/4)th percentiles for panel A, and (100 x (1/6)th percentiles for panels B and C (green vertical dotted lines) of exposures (plotted at the median value within each quantile). The red lines are smooth curves to show the relationship between two variables. The boxplot represents simulated steady-state exposure of 160-mg BID using the Bayesian post hoc PK parameters of population PK model following 10 days of repeated doses of zanubrutinib for each patient. The median is represented by the vertical line in the middle of the box. The left and right ends of the box plot represent the 25th and 75th percentile (the lower and upper quartiles, respectively). The bars extend to the most extreme data point which is no more than 1.5× IQR from the box. Because zanubrutinib reached steady-state within 1 day, Cmax,ss and Cmax, and Cmin,ss and Cmin are used interchangeably. AE: adverse event; AUC0-24,ss: steady-state area under the plasma concentration-time curve from time 0 to 24 h; BID: twice daily; Cmax: maximum plasma concentration; Cmax,ss: steady-state maximum observed plasma concentration; Cmin: minimum plasma concentration; Cmin,ss: steady-state minimum plasma concentration; IRC: independent review committee; IQR: interquartile range; MCL: mantle cell lymphoma; PK: pharmacokinetic; R/R: relapsed or refractory.
Discussion
The current report summarized the totality-of-data supporting zanubrutinib 320 mg QD as an option in addition to the 160-mg BID dose for patients with R/R MCL. During early clinical development, it was noted that while both 320-mg QD and 160-mg BID doses had complete BTK occupancy in PBMC samples (median, 100%), median BTK occupancy in lymph nodes was numerically lower at the 320-mg QD dose than at the 160-mg BID dose (94% vs 100%). Whether differences in receptor occupancy translate to potential clinical implications is unknown. Here we presented the totality of data to show that the observed difference in BTK occupancy between the two dose regimens is unlikely to have a meaningful clinical impact. While there are limited clinical efficacy data at the 320-mg QD dose compared with the 160-mg BID dose, both regimens demonstrated comparable daily plasma exposures (AUC) and numerically comparable objective responses in patients with MCL. Similar objective response rates at the two dose regimens were also observed in other B-cell malignancies, including WM (internal data) and CLL/SLL [Citation10]. Comparable safety profiles were observed with the 160-mg BID and 320-mg QD doses in patients with various B-cell malignancies, including WM and R/R MCL. The E–R analysis for patients with MCL showed that efficacy (ORR) does not appear to be impacted by Cmax or Cmin. Higher Cmax from the 320-mg QD dose was not associated with a higher rate of AEs relative to the 160-mg BID dose. Taken together, there was no evidence of differences in clinical efficacy and/or safety profiles between the 320-mg QD and 160-mg BID dose regimens, thus supporting dose recommendation of a 320-mg total daily dose administered as 160-mg BID or 320-mg QD.
Dose selection in the era of targeted and immuno-oncology therapy presents unique challenges, as the seamless and accelerated development timeline may not provide sufficient time to evaluate different dose regimens and schedule optimization. Much progress has been made by adopting a paradigm shift from conventional MTD approaches to the totality-of-evidence–based approach that incorporates preliminary efficacy, PK, PD, biomarker, and E–R relationships. Nevertheless, additional optimization of dose or dose schedule often continues in the post-marketing phase. For example, a model-based approach using population PK and E–R analysis has been used to support conversion of body weight-based dosing to flat dosing or less frequent dose schedules for several programmed cell death protein-1 (PD-1) antibodies [Citation18]. Since the initial approval of carfilzomib for the treatment of multiple myeloma, subsequent clinical studies showed that once-weekly carfilzomib appears safe and more effective than the twice-weekly schedule with a convenient dosing regimen [Citation20]. Early exploration of dose schedule to promote real-world drug adherence while maintaining comparable risk/benefit profiles can obviate the need for additional clinical studies and streamline drug development processes.
To maximize the BTK inhibition in target tissues, the 160-mg BID zanubrutinib dose has been recommended in the ongoing phase 2/3 clinical trials. However, accumulated and emerging data, including those summarized in this report, called for consideration of the 320-mg QD regimen as an option in addition to the 160-mg BID regimen. It is notable that for irreversible inhibitors like zanubrutinib, the selection of dose schedule should consider the plasma half-life of the inhibitor and the synthesis rate of the de novo target protein. For example, a once-weekly dosing regimen was the approved regimen for irreversible proteasome inhibitor carfilzomib, despite having a short plasma half-life of 30 min [Citation20]. Recovery of BTK-dependent signaling requires de novo synthesis of BTK, and the BTK turnover rate of ∼2 days [Citation14] is longer than the plasma half-life of zanubrutinib (2-4 h). Furthermore, Ctrough/IC50 (unbound) ratios for zanubrutinib following the QD dose are considerably higher than those of ibrutinib and acalabrutinib where compelling clinical efficacy data has been reported in patients with multiple B-cell malignancies [Citation21,Citation22]. Both BID and QD doses of zanubrutinib have exposure coverage greater than IC50 during the entire dose interval with Ctrough/IC50 (unbound) ratios of more than 1 (2 to 7). In contrast, these ratios were estimated to be less than 1 for ibrutinib and acalabrutinib even with consideration of active metabolites [Citation21,Citation22].
An oral dose of the 320-mg QD dosage regimen in addition to the 160-mg BID dose may provide patients and caregivers with additional dosing flexibility and the potential for increased drug adherence. Choosing the optimal schedule to promote adherence in patients (especially in elderly patients) is an important consideration, given that the median age in clinical studies of zanubrutinib is approximately 65 years [Citation23]. Rates of adherence and persistence with oral cancer therapies have been reported to range between 16% and 100% in adult populations [Citation24]. A large meta-analysis of 76 studies demonstrated that adherence is inversely proportional to medication dosing frequency [Citation25], and QD dosing has the highest medication adherence rate compared with BID and 3-times daily dosing [Citation24,Citation26]. Simplifying the regimen using the QD oral dose may improve medication adherence and maintain overall dose intensity. This could be an important consideration for BTK inhibitors since it has been shown that patients with higher mean dose intensity had improved PFS, higher ORR, and a trend toward improved OS [Citation27].
According to the FDA E–R guidance [Citation19], understanding the E–R relationship is crucial to support the dose rationale. In some cases, E–R analysis can provide primary evidence for approval of different dose regimens, dosage forms, and populations when effectiveness is already well established in other settings. For example, population PK and E–R relationships for nivolumab were established to support the approval of an alternate dose regimen of 480-mg every 4 weeks based on data for a dosing regimen of 3-mg/kg every 2 weeks used in patients with solid tumors or a hematologic malignancy [Citation18]. The current analysis also used E–R relationships to bridge accumulated clinical findings related to BID to QD dosing regimens. As is typical for oncology drug development, dose ranging analyses of zanubrutinib were limited to the dose-escalation portion of the first-in-human study, and therefore the E–R analyses were limited by the small number of patients treated with doses below the recommended dose (i.e. 40-mg, 80-mg, and 160-mg QD), and were mainly limited to a total daily dose of 320-mg. Nevertheless, the E–R analysis included data across a relatively wide range of drug concentrations without an apparent trend in E–R relationships. Thus, differences in trough and peak concentrations between the 320-mg QD and 160-mg BID doses are unlikely to have any meaningful impact on clinical outcomes with zanubrutinib treatment.
Recognizing the limited clinical efficacy data in patients who have taken the 320-mg QD dose, several clinical studies have been initiated using the 320-mg QD dose in order to confirm the risk/benefit profiles of this dosage regimen. In conclusion, selection between QD or BID dosing can be an important consideration during the development of orally administered targeted cancer therapies. This report provides a case for a totality-of-evidence approach to bridge clinical findings related to BID and QD dosing regimens, supporting the recommendation of a 320-mg total daily dose. This report also calls for early exploration of dose schedule to promote real-world drug adherence, while maintaining comparable risk/benefit profiles.
Author contributions
Y.C.O., Z.T., W.N., A.C., K.W., Y.G., and S.S. were responsible for the study design; Y.C.O. wrote the first draft of the manuscript and S.S., Z.T., W.N., and A.C. contributed to the first draft and subsequent reviews. K.W., L.L., and Y.G. contributed to data interpretation and analysis. The corresponding author, Y.C.O., had the final responsibility to submit for publication. All authors had full access to all of the data. All authors carefully reviewed the manuscript and approved the final version.
GLAL-2021-0248-File011.docx
Download MS Word (44.9 KB)Acknowledgments
This study was sponsored by BeiGene USA, Inc. We thank the patients who participated in the study, their supporters, and the investigators and clinical research staff from the study centers. Editorial assistance was provided by Open Health Medical Communications, (Chicago, IL), and was funded by BeiGene, Inc.
Disclosure statement
Y.C.O., Z.T., W.N., A.C., and S.S. are employees and own stock in BeiGene, Inc. K.W., L.L., and Y.G. are employees of Shanghai Qiangshi Information Technology Co., Ltd.
Data availability statement
Upon request, and subject to certain criteria, conditions, and exceptions, BeiGene will provide access to individual de-identified participant data from BeiGene-sponsored global interventional clinical studies conducted for medicines (1) for indications that have been approved or (2) in programs that have been terminated. BeiGene will also consider requests for the protocol, data dictionary, and statistical analysis plan. Data requests may be submitted to [email protected].
Additional information
Funding
References
- Seiler T, Dreyling M. Bruton's tyrosine kinase inhibitors in B-cell lymphoma: current experience and future perspectives. Expert Opin Investig Drugs. 2017;26(8):909–915.
- Niemann CU, Herman SE, Maric I, et al. Disruption of in vivo chronic lymphocytic leukemia tumor-microenvironment interactions by ibrutinib–findings from an investigator-initiated phase II study. Clin Cancer Res. 2016;22(7):1572–1582.
- Crisci S, Di Francia R, Mele S, et al. Overview of targeted drugs for mature B-cell non-Hodgkin lymphomas. Front Oncol. 2019;9:443.
- Guo Y, Liu Y, Hu N, et al. Discovery of zanubrutinib (BGB-3111), a novel, potent, and selective covalent Inhibitor of Bruton's Tyrosine Kinase. J Med Chem. 2019;62(17):7923–7940.
- Tam CS, Grigg AP, Opat S, et al. The BTK inhibitor, BGB-3111, is safe, tolerable, and highly active in patients with relapsed/refractory B-cell malignancies: initial report of a phase 1 first-in-human trial. Blood. 2015;126(23):832.
- Tam CS, LeBlond V, Novotny W, et al. A head-to-head Phase III study comparing zanubrutinib versus ibrutinib in patients with Waldenström macroglobulinemia. Future Oncol. 2018;14(22):2229–2237.
- Tam CS, Opat S, D'Sa S, et al. A randomized phase 3 trial of zanubrutinib versus ibrutinib in symptomatic Waldenström Macroglobulinemia: the Aspen study. Blood. 2020;136(18):2038–2050.
- IMBRUVICA [Prescribing Information]. Pharmacyclics LLC, Sunnyvale, CA, 2020. Available from: https://imbruvica.com/files/prescribing-information.pdf. Accessed August 04, 2020.
- CALQUENCE [Prescribing Information]. AstraZeneca, Wilmington, DE, 2019. Available from: https://www.azpicentral.com/calquence/calquence.pdf#page=1. Accessed August 04, 2020.
- Tam CS, Trotman J, Opat S, et al. Phase 1 study of the selective BTK inhibitor zanubrutinib in B-cell malignancies and safety and efficacy evaluation in CLL. Blood. 2019;134(11):851–859.
- BRUKINSA (zanubrutinib) [package insert]. BeiGene USA, Inc., San Mateo, CA, 2019. Available from: https://www.brukinsa.com/prescribing-information.pdf. Accessed May 19. 2020.
- Song Y, Zhou K, Zou D, et al. Treatment of patients with relapsed or refractory mantle-cell lymphoma with zanubrutinib, a selective inhibitor of Bruton's tyrosine kinase. Clin Cancer Res. 2020;26(16):4216–4224.
- Tam CS, Wang M, Simpson D, et al. Updated safety and efficacy data in the phase 1 trial of patients with mantle cell lymphoma (MCL) treated with Bruton tyrosine kinase (BTK) inhibitor zanubrutinib (BGB-3111). Hematol Oncol. 2019;37:245–247.
- Alsadhan A, Cheung J, Gulrajani M, et al. Pharmacodynamic analysis of BTK inhibition in patients with chronic lymphocytic leukemia treated with acalabrutinib. Clin Cancer Res. 2020;26(12):2800–2809.
- Xu W, Yang S, Zhou K, et al. Treatment of relapsed/refractory chronic lymphocytic leukemia/small lymphocytic lymphoma with the BTK inhibitor zanubrutinib: phase 2, single-arm, multicenter study. J Hematol Oncol. 2020;13(1):48.
- Ou YC, Liu L, Tariq B, et al. Population pharmacokinetic analysis of the BTK inhibitor zanubrutinib in healthy volunteers and patients with B-cell malignancies. Clin Transl Sci. 2021;14(2):764–772.
- Cheson BD, Fisher RI, Barrington SF, et al. Recommendations for initial evaluation, staging, and response assessment of Hodgkin and non-Hodgkin lymphoma: the Lugano classification. J Clin Oncol. 2014;32(27):3059–3068.
- Bi Y, Liu J, Furmanski B, et al. Model-informed drug development approach supporting approval of the 4-week (Q4W) dosing schedule for nivolumab (Opdivo) across multiple indications: a regulatory perspective. Ann Oncol. 2019;30(4):644–651.
- Guidance for Industry: Exposure–Response Relationships—Study Design, Data Analysis, and Regulatory Applications. Food and Drug Administration, April. 2003. Available from: https://www.fda.gov/downloads/drugs/guidancecomplianceregulatoryinformation/guidances/ucm072109.pdf. Accessed August 4, 2020.
- Moreau P, Mateos MV, Berenson JR, et al. Once weekly versus twice weekly carfilzomib dosing in patients with relapsed and refractory multiple myeloma (A.R.R.O.W.). Interim analysis results of a randomised, phase 3 study. Lancet Oncol. 2018;19(7):953–964.
- Advani RH, Buggy JJ, Sharman JP, et al. Bruton tyrosine kinase inhibitor ibrutinib (PCI-32765) has significant activity in patients with relapsed/refractory B-cell malignancies. J Clin Oncol. 2013;31(1):88–94.
- Byrd JC, Harrington B, O’Brien S, et al. Acalabrutinib (ACP-196) in relapsed chronic lymphocytic leukemia. N Engl J Med. 2016;374(4):323–332.
- Trotman J, Opat S, Gottlieb DJ, et al. Zanubrutinib for the treatment of patients with Waldenström macroglobulinemia: three years of follow-up. Blood. 2020;136(18):2027–2037.
- Ruddy K, Mayer E, Partridge A. Patient adherence and persistence with oral anticancer treatment. CA Cancer J Clin. 2009;59(1):56–66.
- Claxton AJ, Cramer J, Pierce C. A systematic review of the associations between dose regimens and medication compliance. Clin Ther. 2001;23(8):1296–1310.
- Osterberg L, Blaschke T. Adherence to medication. N Engl J Med. 2005;353(5):487–497.
- Barr PM, Brown JR, Hillmen P, et al. Impact of ibrutinib dose adherence on therapeutic efficacy in patients with previously treated CLL/SLL. Blood. 2017;129(19):2612–2615.