
Abstract
In a phase 1b study of acalabrutinib (a covalent Bruton tyrosine kinase (BTK) inhibitor) in combination with vistusertib (a dual mTORC1/2 inhibitor) in patients with relapsed/refractory diffuse large B-cell lymphoma (DLBCL), multiple ascending doses of the combination as intermittent or continuous schedules of vistusertib were evaluated. The overall response rate was 12% (3/25). The pharmacodynamic (PD) profile for acalabrutinib showed that BTK occupancy in all patients was >95%. In contrast, PD analysis for vistusertib showed variable inhibition of phosphorylated 4EBP1 (p4EBP1) without modulation of AKT phosphorylation (pAKT). The pharmacokinetic (PK)/PD relationship of vistusertib was direct for TORC1 inhibition (p4EBP1) but did not correlate with TORC2 inhibition (pAKT). Cell-of-origin subtyping or next-generation sequencing did not identify a subset of DLBCL patients with clinical benefit; however, circulating tumor DNA dynamics correlated with radiographic response. These data suggest that vistusertib does not modulate targets sufficiently to add to the clinical activity of acalabrutinib monotherapy. Clinicaltrials.gov identifier: NCT03205046.
Introduction
Diffuse large B-cell lymphoma (DLBCL) is the most common type of non-Hodgkin lymphoma worldwide, comprising 30–40% of all new diagnoses. Although 5-year survival rates in the first-line setting range from 60–70%, 20–50% of patients become refractory to, or relapse after, treatment and the outcomes for these patients are poor [Citation1,Citation2]. DLBCL is a heterogeneous group of tumors with specific subtypes that are classified by differences in genetics, biology, and histology [Citation3–5]. Lymphomas generally utilize either a chronic activation or oncogenic tonic signaling through the B-cell receptor (BCR) pathway to maintain malignant proliferation and survival [Citation6].
Bruton tyrosine kinase (BTK) is a member of the Tec family of kinases and is an effector molecule that is critical for B-cell development, including proliferation, maturation, differentiation, migration, and apoptosis [Citation7]. As a critical component of BCR-mediated signaling, BTK has been shown to be essential in the initiation, survival, and progression of B-cell lymphomas [Citation7]. Acalabrutinib is a next-generation, potent, covalent, irreversible BTK inhibitor with increased biochemical and cellular selectivity and fewer off target effects than other BTK inhibitors [Citation8]. Acalabrutinib has been approved in the United States and other countries for the treatment of relapsed and refractory (R/R) mantle cell lymphoma and chronic lymphocytic leukemia/small lymphocytic lymphoma, including front-line therapy. Additionally, acalabrutinib and other BTK inhibitors have shown some monotherapy activity in DLBCL, with an overall response rate (ORR) of 24% [Citation9,Citation10].
The mammalian target of rapamycin (mTOR) is a member of the PI3K family of protein kinases and is involved in intra- and extracellular signaling. The kinase plays a role in regulating many cellular processes including metabolism, growth, proliferation, and survival [Citation11]. mTOR associates with other proteins and forms two functionally distinct complexes, mTOR complex 1 (mTORC1) and mTOR complex 2 (mTORC2). The complexes are distinguished by their differing responses to rapamycin and its derivatives (rapalogues). mTORC1 plays a key role in coupling nutrient sensing with regulation of protein translation and cellular metabolism processes. It directly phosphorylates proteins such as p70S6K (S6K) and 4EBP1 [Citation12], which are involved in controlling cellular growth and proliferation. mTORC2 has been reported to play a role in protein synthesis and in driving oncogenic PI3K signaling in cancer [Citation13]. There is building evidence that increases in mTORC1 and mTORC2 activity may directly or indirectly play a role in the initiation, propagation, and relapse of lymphoma. mTORC1 and mTORC2 are clinically active therapeutic targets for B-cell malignancies, with rapamycin and other rapalogue monotherapies providing complete responses (CRs) in some childhood acute lymphoblastic leukemia, and dual inhibitors providing suppressed tumor growth in various malignancies.
Vistusertib, also known as AZD2014, is an inhibitor of the mTOR kinase. Unlike rapamycin and rapalogues, which are potent inhibitors of only mTORC1, vistusertib inhibits signaling of mTORC1, including phosphorylation of rapalogue-insensitive substrate phosphorylated 4EBP1 (p4EBP1) and mTORC2 complexes [Citation14]. In addition to dual inhibition of mTORC1 and mTORC2, vistusertib has been reported to achieve a more profound inhibition of mTORC1 with a broader range of growth inhibitory activity in vitro across tumor types compared with rapalogues [Citation15,Citation16]. While early clinical data of mTORC1 inhibitors suggests some activity in a number of hematologic malignancies [Citation17], these agents have shown limited efficacy as monotherapies [Citation18]. The complexity and existence of multiple negative feedback loops involved in transducing signals from the BCR pathway suggests that combined inhibition of BTK and mTOR may offer clinical benefit in BCR-driven cancers [Citation17].
Materials and methods
Clinical study
ACE-LY-110 was a proof-of-concept, multicenter, open-label, randomized, parallel-group study to evaluate the safety, pharmacokinetics (PK), pharmacodynamics (PD), and efficacy of acalabrutinib in combination with vistusertib in R/R DLBCL (clinicaltrials.gov identifier NCT03205046). The study had two parts. Part 1 included patients with R/R de novo or transformed DLBCL or Richter transformation (RT) and was intended to select the vistusertib dose and schedule for part 2 (expansion cohort); the study was closed before part 2 initiation. Eligible patients were randomized to receive 35 mg twice-daily (BID) continuous or 100 mg BID intermittent (two days on/five days off) vistusertib (dose level 1). All patients were scheduled to receive acalabrutinib 100 mg BID. A standard safety analysis occurred when six patients completed a dose-limiting toxicity (DLT) review period (first cycle; one cycle = 28 days) in each schedule. If one or fewer DLTs occurred in each schedule during cycle 1, the dose of vistusertib was escalated (level 2) for six new patients to 50 mg BID continuous or 125 mg BID intermittent (two days on/five days off) cycles. Treatment with acalabrutinib and vistusertib was continued until disease progression or unacceptable drug-related toxicity. Response to treatment was assessed every 8 weeks (∼2 cycles) by investigators according to the revised response criteria for malignant lymphoma [Citation19].
Cell-of-origin subtyping
Central gene expression analysis in archival diagnostic formalin-fixed paraffin embedded tissue was performed as previously described [Citation5] using the LymphMark™ RUO test (NanoString Technologies, Seattle, WA) at Covance Genomics Labs (Redmond, WA).
Pharmacodynamic and pharmacokinetic analyses
Whole blood samples were drawn predose and 1 h postdose on cycle 1, day 1 and cycle 1, day 22 for PD analyses. Occupancy of BTK by acalabrutinib was measured by enzyme-linked immunosorbent assay (ELISA) in cryopreserved peripheral blood mononuclear cells utilizing a drug-analogue probe at predose, 1 h after the first dose, and on day 22 (pre- and postdose) as previously reported [Citation20]. To measure occupancy of vistusertib, whole blood was fixed with BD Phosflow™ Lyse/Fix Buffer (BD Biosciences, Franklin Lakes, NJ), permeabilized, and stained overnight. Fluorescence values derived from the surrogate CD3− lymphocyte population were determined with flow cytometry. For PK analyses, blood samples were assessed for plasma acalabrutinib (metabolite ACP-5862) and vistusertib concentrations predose and at 1, 2, 4, and 6 h postdose for cycle 1, day 1 and 22.
Next-generation sequencing (NGS) of tumor and circulating tumor DNA (ctDNA)
Sample preparation and sequencing was performed as described in the Supplemental Materials. For whole-genome sequencing, average achieved depth was 25X in plasma and 17X in tissue samples, and for the AZHeme600 panel, average achieved depth was 925X in plasma and 591X in tissue samples.
Preclinical studies
TMD8 tumor cells were injected subcutaneously in C.B.-17 scid female mice. For efficacy studies, acalabrutinib 20 mg/kg BID, vistusertib 15 mg/kg once daily (QD), or the combination of the two agents was dosed orally for 35 days; tumor volume and body weight were measured throughout the treatment and regrowth periods. For PK/PD studies, mice were dosed daily for five days, sacrificed 2 h after the last dose, and tumor samples were snap-frozen. Frozen tumors were homogenized and supernatant was separated using standard immunoblotting procedures and probed with AKT phosphorylation (pAKT) (S473) and p4EBP1.
Results
Patient demographics
A total of 25 patients were enrolled, randomized, and treated with the combination regimen: in level 1, six patients received vistusertib 100 mg intermittent (level 1 intermittent cohort) and seven patients received vistusertib 35 mg continuous (level 1 continuous cohort). In level 2, six patients received vistusertib 125 intermittent (level 2 intermittent cohort) and six patients received vistusertib 50 mg continuous level 2 dosing (level 2 continuous cohort). Acalabrutinib dosing was 100 mg BID through the entire study. The demographics of patients enrolled are summarized in . The median age was 69 years (range, 27–85), with 76% being men. Ann Arbor staging at time of enrollment included 80% with advanced disease (stages III and IV). Bulky disease with a tumor mass ≥10 cm in diameter was noted in 12% of patients.
Table 1. Baseline patient characteristics.
Safety
The median duration of exposure to acalabrutinib was 1.9 months (range, 0.9–22.3) in the level 1 intermittent cohort, 1.4 months (range, 0.6–3.6) in the level 1 continuous cohort, 3.6 months (range, 1.3–21.1) in the level 2 intermittent cohort, and 1.6 months (range, 0.9–3.2) in the level 2 continuous cohort. The median duration of exposure to vistusertib was 1.7 months (range, 0.8–22.1) in the level 1 intermittent cohort, 1.0 months (range, 0.6–3.6) in the level 1 continuous cohort, 3.3 months (range, 1.2–21) in the level 2 intermittent cohort, and 1.2 months (range, 0.9–3.2) in the level 2 continuous cohort. All 25 patients have discontinued therapy and the most common reason was progressive disease (n = 20 (80%) for acalabrutinib; n = 19 (76%) for vistusertib). Other reasons included adverse events (AEs) and investigator decision.
Treatment-emergent AEs occurred in all enrolled patients, with most being grade ≤2. AEs noted at a frequency of ≥20% (all grades) included fatigue (52%), blood creatinine increase (48%), nausea (36%), hyperglycemia (32%), diarrhea (32%), anemia (28%), constipation (24%), cough (24%), decreased appetite (24%), dry mouth (24%), vomiting (24%), pyrexia (20%), headache (20%), hypotension (20%), myalgia (20%), pruritus (20%), and rash (20%). Serious AEs (SAEs) were reported in nine patients (36%), with the most common SAEs (≥2 patients) being anemia (n = 2), pneumonia (n = 2), and pyrexia (n = 2). No grade 5 AEs were reported.
The most common AEs related to acalabrutinib were fatigue (40%), serum creatinine increase (28%), diarrhea (24%), and headache (20%), all grade ≤2. The most common AEs related to vistusertib were fatigue (44%), serum creatinine increase (32%), hyperglycemia (28%), nausea (24%), decreased appetite (20%), and diarrhea (20%). All above-mentioned AEs related to vistusertib were grade ≤2 with the exception of one patient experiencing grade 3 hyperglycemia related to vistusertib in the level 2 continuous cohort. No maximum tolerated dose (MTD) was reached for the combination therapy. Two dose-limiting toxicities occurred: one grade 3 alanine aminotransferase/aspartate aminotransferase increase related to both drugs in the level 1 continuous cohort, with the patient discontinuing both drugs, and one grade 3 hyperglycemia related to vistusertib in the level 2 continuous cohort, with the patient discontinuing vistusertib only. No patient in any cohort experienced AEs that led to the discontinuation of acalabrutinib only. No other treatment discontinuation was reported.
Clinical response
Among all 25 patients enrolled in this study, one patient (4%) achieved a CR (). This was a relapsed transformed DLBCL patient enrolled into the level 1 intermittent cohort, and the response lasted 20.5 months (). Two patients (8%) achieved partial responses (PRs): both were in the level 2 intermittent cohort (). One had RT and the response lasted 18.9 months. This patient was primarily refractory to R-CHOP, had no previous BTK exposure, and the underlying CLL clonality was associated with a TP53 mutation. The other was a de novo DLBCL patient (cell of origin (COO) unknown) and the response lasted two cycles. No other patient in either the level 1 continuous cohort or the level 2 continuous cohort responded ().
Figure 1. (A) Waterfall plot showing the maximum percent change (%) from baseline in the sum of product diameter (SPD) by investigator assessment for all treated patients with tumor assessments (n = 23). Two patients without post-baseline overall response assessment were excluded. (B) Swimmer plot showing time on treatment and best response for all patients (n = 25) by cohorts. All responses were assessment by investigators according to the revised response criteria for malignant lymphoma [Citation19]. CR: complete response; PD: progressive disease; PR: partial response; SD: stable disease.
![Figure 1. (A) Waterfall plot showing the maximum percent change (%) from baseline in the sum of product diameter (SPD) by investigator assessment for all treated patients with tumor assessments (n = 23). Two patients without post-baseline overall response assessment were excluded. (B) Swimmer plot showing time on treatment and best response for all patients (n = 25) by cohorts. All responses were assessment by investigators according to the revised response criteria for malignant lymphoma [Citation19]. CR: complete response; PD: progressive disease; PR: partial response; SD: stable disease.](/cms/asset/dde9ccf7-e9b1-4be9-88bd-6e0d1953c1ac/ilal_a_1938027_f0001_c.jpg)
Cell-of-origin and genomic classification of DLBCL
On the basis of local immunohistochemistry, the overall histological study disease types were de novo germinal center B-cell subtype of DLBCL (GCB DLBCL; 13 patients, 52%), de novo non-GCB DLBCL (three patients, 12%), transformed DLBCL (eight patients, 32%), and RT (one patient, 4%). Based on COO gene expression profiling, overall study disease subtypes were GCB DLBCL (56% of patients), activated B-cell-like subtype of DLBCL (ABC DLBCL; 12% of patients), unclassified (16% of patients), and not available (i.e. diagnostic tumor tissue not available; 16% of patients). Correlation of COO to response indicated that not all responders fell into one subtype, as only two of the three responders had available archival tissue and one was classified as ABC and the other as GCB using central gene expression profiling (). With the caveat that only three of 25 patients responded to treatment, understanding the baseline genomic features of the responders could provide insight of features that may correlate with response.
Figure 2. (A) Genomic classification using LymphGen classifier of next-generation sequencing data from tumor samples when available (n = 12) compared with the genomic classification of matched patient ctDNA at cycle 1 day 1 (C1D1). (B) Oncoprint of 24 patients (columns) rank order by best overall response; also includes days on treatment, C1D1 ctDNA-based profiling of genomics classifications of DLBCL and NanoString LST from matched FFPE tumor sample, histology from local pathology review, and reason for study exit. Dashed line separates responders from non-responders. Mutation must be present in at least two samples and have >2% allele frequency. Blank = no data available. COO: cell of origin; CR: complete response; ctDNA: circulating tumor DNA; DLBCL: diffuse large B-cell lymphoma; LST: lymphoma subtyping test; PD: progressive disease; PR: partial response; SD: stable disease; SNV: single-nucleotide variant.
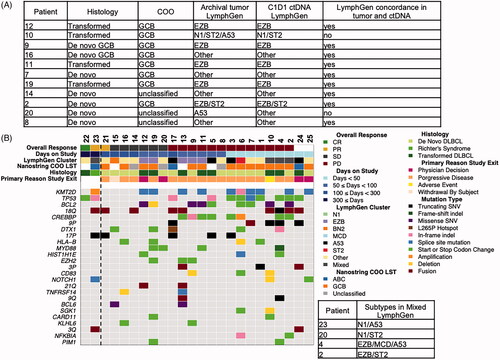
Recent DLBCL studies have proposed new genomic classifications of DLBCL [Citation3,Citation4] that enable genomic segmentation beyond COO gene. To determine the genomic classification of the DLBCL patients, we developed a targeted 600 gene NGS panel (AZHeme600, Supplemental Table 1) [Citation3,Citation4]. We applied a recently published classifier to this cohort of patients [Citation21]. The LymphGen classifier was validated for use with untreated de novo (not transformed) DLBCL patients using DNA from tumor tissue and not validated for use with ctDNA. Since only 12 patients in this study had available archival tumor tissue for analysis, none of the three responders, and all 24 patients including the three responders provided a C1D1 ctDNA plasma collection, we compared the performance of the classification of tumor and ctDNA using LymphGen in patient-matched samples (n = 12). Although from a small patient group, 10 of 12 patients had concordant LymphGen results between tumor and ctDNA, providing some confidence in the utility of ctDNA in the absence of tumor. The two patients with discordant tumor and ctDNA calls are due to classification of the tumor as A53, whereas this was not the call made from ctDNA. In patient 10, a TP53 mutation was detected in tumor but not in the ctDNA and patient 20 remained a mixed classification but in ctDNA had increased mutational overlap with other classifications and a NOTCH1 mutation that made it statistically less likely to be A53 (). With this limitation in mind, we aimed to compare the genomic profiles of patients, focusing on the genomic profiling on ctDNA collected on C1D1 prior to the first dose because all patients had an available sample.
The three responders were classified by the LymphGen algorithm as ‘mixed’ subtypes or as ‘other,’ a non-classifiable genomic subtype. Although there are no clear recurring alterations or classifications that characterize the three responders, there are some notable features that may characterize the non-responders including alterations associated with the EZB subtype (BCL2 fusions, KMT2D mutations, and CREBBP mutations) present in 11 of 13 progressed disease patients. The patient who achieved CR had a ctDNA profile that demonstrated that the highest allele fraction (AF) alteration was a TP53 R248Q mutation of 9%, with all other alterations detected below 4% AF. However, TP53 alterations were observed in both responders (n = 2) and non-responders (n = 9). Of note, none of the responders had MYD88 or CD79B alterations, which have been thought to confer sensitivity to BTK inhibition () [Citation22].
ctDNA monitoring
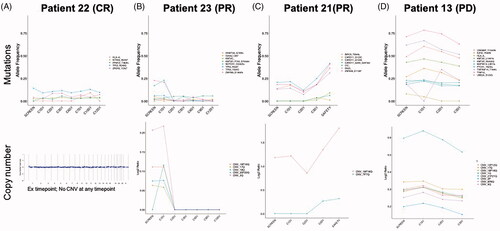
Monitoring ctDNA genomic changes with treatment in combination treatment responders was undertaken using plasma collections taken during screening and longitudinally at every tumor assessment visit to the clinic during the first 12 cycles. The patient who achieved a CR had no detectable alterations much above 10% AF and also no copy number variations before and during the first 12 cycles of treatment (). In one patient who achieved a PR, we first observed clearance of the copy number gains in 3q and chromosome 16 together with mutation in the splicing factor ZMYM3 by the first post-treatment timepoint in cycle 2 and then clearance of the NOTCH1 mutation by cycle 6 with NOTCH1 D244fs alteration remaining undetectable for the remaining available samples. TP53 R306* was also controlled by the start of the third cycle, demonstrating that clearance of preexisting alterations during the time of response may contribute to the duration of response of 22 months (). The other patient who achieved a PR was on treatment for 4.5 cycles and 1 month later, at the time of the safety follow-up visit, a sample for ctDNA genomic analysis was collected and demonstrated a rise in four CARD11 mutations, increases in preexisting chromosome 18 gains, and an emergence of chromosome 7 copy number gains, possibly explaining the short duration of response (). Patient 13 is a progressed disease patient that remained on study for 50 days post-treatment, showing minimal decreases in mutational allele frequencies at C2D1 and maintenance of greater than 20% allele frequencies in mutations in EZH2, MKT2D, CREBBP, TNFRSF14, and UBE2A ().
Figure 3. ctDNA monitoring of mutations that are known or likely in the following genes: MYD88, CD79B, PIM1, CDKN2A, HLA-B, BCL6, NOTCH2, CD70, TNFAIP3, DTX1, NOTCH1, IRF4, IRF2BP2, KLHL6, ID3, BCL2, EZH2, TNFRSF14, CREBBP, KMT2D, BCL10, UBE2A, SGK1, HIST1H1E, NFKBIE, BRAF, CD83, NFKBIA, TP53, and CARD11. Gene mutations plotted longitudinally must be present in at least two samples and have >2% allele frequency at any timepoint. (A, B) Responders with only first 12 month ctDNA collections; (C) short-lived response with ctDNA collection at safety follow-up visit to the clinic after clinical relapse and (D) progressed patient with 50 days on treatment.
Pharmacokinetic results
Summary PK parameters for acalabrutinib and metabolite ACP-5862, presented by vistusertib schedule (continuous or intermittent), and vistusertib, presented by dose and schedule, are shown in . In general, acalabrutinib time to Cmax (Tmax), Cmax, and area under the concentration–time curve from hours 0 to 6 (AUC0–6) on day 1 and 22 and oral clearance (CL/F) were consistent with that observed historically [Citation23], and similar irrespective of whether combined with continuous or intermittent regimens of vistusertib. For vistusertib, Tmax was consistent across doses and schedules, and Cmax and AUC0–6 increased with vistusertib dose. Due to the sparse and limited nature of the PK sampling, CL/F could only be estimated for a few patients, and no clear conclusions could be drawn. In general, vistusertib PK data were consistent with those observed historically in patients with solid tumors [Citation23].
Table 2. Summary pharmacokinetic parameters for acalabrutinib, ACP5862, and vistusertib.
Acalabrutinib pharmacodynamics
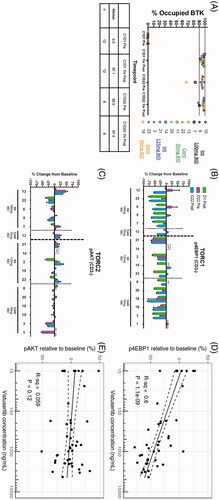
Acalabrutinib binding to C481 residue was assessed by ELISA. The median percent BTK occupancy is shown in for all patients meeting the criteria of a signal to noise ratio ≥5 for the cycle 1, day 1 predose sample. One hour after dosing on cycle 1, day 1 and cycle 1, day 22, the median BTK occupancy value was 97%, consistent with the complete occupancy reported in other acalabrutinib studies [Citation24–26]. Occupancy on cycle 1, day 22 at steady-state trough (before the next dose) remained at a median of 95%. No differences in occupancy were observed with the different vistusertib dose and schedules.
Figure 4. (A) The percent of BTK occupancy by acalabrutinib at each timepoint for subjects with a signal-to-noise ratio ≥5 for the day 1 predose sample. The center horizontal line represents the median. Median BTK occupancy remained above 90%, indicating that treatment with acalabrutinib and vistusertib in combination does not affect target occupancy. (B) Phosphorylation of 4EBP1, shown as the change from day 1 predose (baseline), was partially inhibited by vistusertib regardless of dose. (C) Phosphorylation of AKT, shown as the change from day 1 predose (baseline), was minimally impacted by vistusertib regardless of dose. Available time-matched PK and PD data for (D) p4EBP1 and (E) pAKT were plotted and analyzed using simple linear regression with PK data on log scale. Solid and dashed lines denote the linear regression and boundaries of its 95% confidence interval.
Vistusertib pharmacodynamics
Preclinical studies in the TMD8 tumor model showed that the combination of vistusertib and acalabrutinib at clinically relevant doses promoted tumor regression (Supplemental Figure 1A). Moreover, PD studies showed that at these doses, vistusertib at 2 h after the last dose (Cmax, 4.13 µM) inhibited TORC1 and TORC2 downstream biomarkers, with complete inhibition of p4EBP1 (an mTORC1 downstream biomarker) and up to 96% inhibition of pAKT (a biomarker of mTORC2 signaling) (Supplemental Figure 1B). In vivo preclinical data show a profound inhibition of both p4EBP1 and pAKT in the TMD8 tumor model compared to vehicle control.
The PD effects of vistusertib were determined by comparing the phosphorylation levels of the cycle 1, day 1 predose relative to the on-treatment levels 1 h after the first dose and after 22 days of treatment. One hour after the first dose, all patients showed a partial decrease in the phosphorylation of 4EBP1 (). However, the inhibition of TORC1 greatly varied between patients, with no apparent relationship between dose and schedule. At steady-state trough timepoints, six of the 15 patients showed increases in p4EBP1 compared with day 1 predose, with these increases being reversed 1 h after their next dose of vistusertib. No clear impact on TORC2 was observed as indicated by a lack of inhibition of the phosphorylation of AKT (). The relationship between vistusertib plasma concentrations and p4EBP1 and pAKT is visualized in . Within the observed concentration range, higher vistusertib concentrations are associated with increased p4EBP1 inhibition (R2=0.60), but not with pAKT inhibition (R2=0.059).
Discussion
The combination regimen of vistusertib and acalabrutinib was generally well tolerated during the short period of treatment, and most AEs are grade ≤2. Progressive disease was the primary reason for treatment discontinuation. The AE profile observed for acalabrutinib in the current study was generally consistent with the known safety profile of acalabrutinib in other cancers [Citation20,Citation25,Citation26] and no unexpected safety signals were identified. The vistusertib safety profile resembles that seen in clinical studies in other cancers [Citation27,Citation28]. The safety profile of the combination treatment was generally similar across different dosing levels (level 2 vs. level 1) and schedules (intermittent vs. continuous).
The PD effect of acalabrutinib, as measured by BTK occupancy at two timepoints (D1 and D22) was as expected, with greater than 97% median BTK occupation, demonstrating robust BTK inhibition. The PD effect of vistusertib was not as robust for both complexes, and in particular, the lack of TORC2 inhibition was evident from the minimal inhibition of pAKT. Furthermore, the inhibition of p4EBP1 showed only a moderate impact of vistusertib on TORC1, possibly explaining the lack of clinical benefit [Citation23]. The lack of robust pathway modulation by vistusertib in the clinic was in stark contrast to the inhibition by vistusertib of both TORC1 and TORC2 readouts in preclinical models. A previous trial investigating the level 2 intermittent dose and schedule of vistusertib as a single agent demonstrated that vistusertib did not confer benefit in this patient population [Citation18]; however, only three patients had PD data for TORC1 and TORC2 targets and one patient showed decrease of pS6 as a marker of TORC1 signaling. For TORC2, all three patients had decreases in pAKT, but only one of the three had complete decreases in PRAS40 using semi-quantitative immunohistochemistry methods. Therefore, the present trial was undertaken to escalate the dose to determine an active dose and schedule for the vistusertib and acalabrutinib combination while determining PD effects using quantitative readouts to help guide the optimal combination dose and schedule (i.e. for which both MTORC1/2 signaling would be robustly inhibited). However, PK data from patients at vistusertib dose level 2 suggested that increasing the dose to level 1 would only increase exposure by approximately 20%, which is not expected to provide sufficient TORC2 coverage to differentiate the dual TORC inhibitor from approved TORC1 inhibitors, and could increase risk for toxicity. An MTD for vistusertib in combination with acalabrutinib was not determined, in large part because the suggested dose increase requirement to demonstrate efficacy was prohibitive due to toxicity.
The clinical efficacy of the combination therapy was only modest (1/25 CR, 2/25 PR, ORR 12%), and of note, all responders were in the intermittent dosing schedule cohorts. The response rate is similar to expected response rates with acalabrutinib monotherapy in the R/R de novo non-GCB DLBCL patient population, for which the ORR was 24% for 21 patients enrolled [Citation9]. Due to the small sample size and difference in patient subpopulations, the comparison between the two studies would be difficult. Interestingly, the drug exposure time for the level 2 intermittent schedule of vistusertib was longer than other schedules, meaning that patients are less likely to discontinue due to disease progression in this schedule. In fact, four of six patients in this cohort achieved clinical benefit (two PR and two stable disease); however, the duration of response was mostly brief. Clinical benefit was not observed in other arms except one CR in a patient in the level 1 intermittent cohort.
To decipher whether the responders had any common features that could suggest a patient-enrichment strategy for this combination, genomic analysis were carried out based on COO and the new genomic classifications of DLBCL, albeit in a small sample of patients with either de novo or transformed R/R DLBCL. An assessment of the PI3K mTOR pathway gene alterations did not provide further insights into patient-enrichment strategies (data not shown), though perhaps a combination of a BTK inhibitor with a different node in the PI3K mTOR pathway would produce more benefit. Indeed PI3Kδ inhibitors show some benefit, but a patient-enrichment analysis is needed to demonstrate improved response rates [Citation29]. Furthermore, gene expression studies may provide more insight into the predictive factors for TORC1 response (e.g. ROR1 [Citation30]).
Assessments of minimal residual disease by monitoring ctDNA clearance in DLBCL [Citation31] have been reported to predict duration of response. In this study, we demonstrate that two patients with durable responses clear somatic alterations as detected in their ctDNA, whereas a progressed disease patient shows maintenance of mutations following treatment. Furthermore, ctDNA analysis at the time of progression of a PR de novo DLBCL patient with a short response suggests that patients with increases in chromosome ploidy and/or the emergence of gene mutations in CARD11 may precede treatment resistance to the combination treatment. Oncogenic CARD11 mutations are located in the coiled-coiled region of the protein, have been described in 9.6% of ABC DLBCL, and have been functionally linked to activation of NF-κB [Citation32]. The emergence of three mutations in the coiled-coiled region of CARD11 in one patient with a short duration of response may lead to the re-activation of the NF-κB pathway, which was initially controlled by BTK inhibition [Citation33]. Monitoring ctDNA is a potential method that can be used to identify mutations and copy number alterations that arise during targeted therapies to uncover genomic or epigenomic mechanisms of acquired resistance.
Preclinical data suggest a need to cover the pathway for the entire duration of the dosing interval [Citation34,Citation35] to deliver efficacy in models of DLBCL. The data from this clinical trial assessing the combination of acalabrutinib and vistusertib suggest that greater target occupancy of the mTOR pathway is required to improve clinical responses. Based on these data, vistusertib in combination with acalabrutinib under the dose and schedules investigated did not sufficiently inhibit the mTOR pathway in R/R DLBCL patients to provide clinical benefit.
Acknowledgements
Dr. Collins acknowledges support from the Haematology and Stem Cell Theme of the NIHR Oxford Biomedical Research Centre and CRUK Experimental Cancer Medicines Centre. Editorial assistance was provided by Peloton Advantage, an OPEN Health company, Parsippany, NJ, and funded by Acerta Pharma, South San Francisco, CA, a member of the AstraZeneca Group.
Disclosure statement
Graham P. Collins: Consultant: Takeda, Roche, Pfizer, BeiGene, Incyte, Daiichi Sankyo, Gilead, Novartis, Janssen; Research Support: Bristol Myers Squibb, Merck Sharpe & Dohme, Pfizer, Amgen. Tracy N. Clevenger: Equity: AstraZeneca; Personal fees: Kartos Therapeutics. Buyue Yang: Nothing to disclose. Alex MacDonald: Employment, shareholder: AstraZeneca. David Cunningham: Research grants: 4SC, AstraZeneca, Bayer, Amgen, Celgene, Clovis, Eli Lilly, Janssen, MedImmune, Merck, Merrimack, Sanofi. Christopher P. Fox: Consultant: Acerta Pharma, AstraZeneca. Andre Goy: Steering committee, advisor, advisory board, study PI-research funding for institution: AstraZeneca; Consulting, study PI-research funding for institution: Acerta Pharma; Consulting: Xcenda, MJH Associates; Consulting and travel-related expenses: Physicians Education Resource, LLC; Advisory board, consulting, study PI-research funding for institution: Kite/Gilead; Advisory board: Janssen, PracticeUpdate Oncology; Consulting/moderator: OncLive Peer Review; Consulting, study PI-research funding for institution: Celgene; Shareholder, board member, paid for attending meetings: COTA; Study PI-research funding for institution: Bayer, Bristol Myers Squibb, Constellation, Genentech, Hackensack UMC, Hoffman-La Roche, Infinity, Janssen, Karyopharm, Morphosys, Pharmacyclics. John Gribben: Research grants: AstraZeneca, Janssen; Speakers bureau: Janssen; Advisory boards: AbbVie, AstraZeneca, Janssen. Grzegorz Nowakowski: Consultant: Celgene/BMS, Morphosys, DeNovo, Kymara, Kite, Roche/Genentech, Debiopharm, Curis. Mark Roschewski: Nothing to disclose. Julie M. Vose: Research grant, advisory board: AstraZeneca. Anusha Vallurupalli: Nothing to disclose. Kathleen A. Burke: Nothing to disclose. Jean Cheung: Personal fees: Acerta Pharma, AstraZeneca. Amelia Raymond: Nothing to disclose. Barrett Nuttall: Employment: AstraZeneca. Daniel Stetson: Nothing to disclose. Brian Dougherty: Employment: AstraZeneca. Stein Schalkwijk: Employment and shareholder: AstraZeneca. Larissa S. Carnevalli: Employment and shareholder: AstraZeneca. Brandon Willis: Employment: AstraZeneca. Lin Tao: Employment: AstraZeneca. Elizabeth Harrington: Employment, shareholder: AstraZeneca. Ahmed Hamdy: Employment: Acerta Pharma at the time of the study. Patents: pending. Shareholder: Acerta Pharma and AstraZeneca. Raquel Izumi: Employment: Acerta Pharma at the time of the study. Patents: acalabrutinib (issued). Shareholder: Acerta Pharma and AstraZeneca. J. Elizabeth Pease: Nothing to disclose. Melanie M. Frigault: Employment, shareholder, patent holder: AstraZeneca. Ian Flinn: Payment to institution for conduct of clinical trial on which Dr. Flinn served as PI: Acerta Pharma, Agios, ArQule, Calithera Biosciences, Celgene, Constellation Pharmaceuticals, Curis, F. Hoffman-la Roche Ltd, Forma Therapeutics, Forty Seven, Genentech, IGM Biosciences, Incyte, Infinity Pharmaceuticals, Karyopharm Therapeutics, Loxo, Merck, Novartis, Pfizer, Portola Pharmaceuticals, Teva, Trillium Therapeutics, Triphase Research & Development Corp., AbbVie, AstraZeneca, BeiGene, Gilead, Janssen, Juno Therapeutics, Kite Pharma, MorphoSys, Pharmacyclics, Roche, Seattle Genetics, Takeda, TG Therapeutics, Unum Therapeutics, Verastem; Consulting: AbbVie, AstraZeneca, BeiGene, Curio Science, Gilead Sciences, Great Point Partners, Iksuda Therapeutics, Janssen, Juno Therapeutics, Kite Pharma, MorphoSys, Nurix Therapeutics, Pharmacyclics, Roche, Seattle Genetics, Takeda, TG Therapeutics, Unum Therapeutics, Verastem, Yingli Pharmaceuticals.
Data availability statement
Data underlying the findings described in this manuscript may be obtained in accordance with AstraZeneca’s data sharing policy described at https://astrazenecagrouptrials.pharmacm.com/ST/Submission/Disclosure.
References
- Crump M, Neelapu SS, Farooq U, et al. Outcomes in refractory diffuse large B-cell lymphoma: results from the international SCHOLAR-1 study. Blood. 2017;130(16):1800–1808.
- National Cancer Institute. Cancer Stat Facts: NHL – diffuse large B-cell lymphoma (DLBCL); 2021; [cited 2021 Mar 3]. Available from: https://seer.cancer.gov/statfacts/html/dlbcl.html
- Chapuy B, Stewart C, Dunford AJ, et al. Molecular subtypes of diffuse large B cell lymphoma are associated with distinct pathogenic mechanisms and outcomes. Nat Med. 2018;24(5):679–690.
- Schmitz R, Wright GW, Huang DW, et al. Genetics and pathogenesis of diffuse large B-cell lymphoma. N Engl J Med. 2018;378(15):1396–1407.
- Scott DW, Wright GW, Williams PM, et al. Determining cell-of-origin subtypes of diffuse large B-cell lymphoma using gene expression in formalin-fixed paraffin-embedded tissue. Blood. 2014;123(8):1214–1217.
- Young RM, Phelan JD, Wilson WH, et al. Pathogenic B-cell receptor signaling in lymphoid malignancies: new insights to improve treatment. Immunol Rev. 2019;291(1):190–213.
- Pal Singh S, Dammeijer F, Hendriks RW. Role of Bruton's tyrosine kinase in B cells and malignancies. Mol Cancer. 2018;17(1):57–57.
- Barf T, Covey T, Izumi R, et al. Acalabrutinib (ACP-196): a covalent Bruton tyrosine kinase inhibitor with a differentiated selectivity and in vivo potency profile. J Pharmacol Exp Ther. 2017;363(2):240–252.
- Dyer MJ, De Vos S, Ruan J, et al. Acalabrutinib monotherapy in patients (pts) with relapsed/refractory (R/R) diffuse large B-cell lymphoma (DLBCL). Presented at the American Society of Clinical Oncology; 2018 June 1–5; Chicago, IL.
- Wilson WH, Young RM, Schmitz R, et al. Targeting B cell receptor signaling with ibrutinib in diffuse large B cell lymphoma. Nat Med. 2015;21(8):922–926.
- Mirabilii S, Ricciardi MR, Piedimonte M, et al. Biological aspects of mTOR in leukemia. Int J Mol Sci. 2018;19:2396.
- Hsieh AC, Costa M, Zollo O, et al. Genetic dissection of the oncogenic mTOR pathway reveals druggable addiction to translational control via 4EBP-eIF4E. Cancer Cell. 2010;17(3):249–261.
- Lien EC, Dibble CC, Toker A. PI3K signaling in cancer: beyond AKT. Curr Opin Cell Biol. 2017;45:62–71.
- Guichard SM, Curwen J, Bihani T, et al. AZD2014, an inhibitor of mTORC1 and mTORC2, is highly effective in ER + breast cancer when administered using intermittent or continuous schedules. Mol Cancer Ther. 2015;14(11):2508–2518.
- Chresta CM, Davies BR, Hickson I, et al. AZD8055 is a potent, selective, and orally bioavailable ATP-competitive mammalian target of rapamycin kinase inhibitor with in vitro and in vivo antitumor activity. Cancer Res. 2010;70(1):288–298.
- Calimeri T, Ferreri AJM. m-TOR inhibitors and their potential role in haematological malignancies. Br J Haematol. 2017;177(5):684–702.
- Lee JS, Vo TT, Fruman DA. Targeting mTOR for the treatment of B cell malignancies. Br J Clin Pharmacol. 2016;82(5):1213–1228.
- Eyre TA, Hildyard C, Hamblin A, et al. A phase II study to assess the safety and efficacy of the dual mTORC1/2 inhibitor vistusertib in relapsed, refractory DLBCL. Hematol Oncol. 2019;37(4):352–359.
- Cheson BD, Fisher RI, Barrington SF, et al. Recommendations for initial evaluation, staging, and response assessment of Hodgkin and non-Hodgkin lymphoma: the Lugano classification. J Clin Oncol. 2014;32(27):3059–3068.
- Byrd JC, Harrington B, O’Brien S, et al. Acalabrutinib (ACP-196) in relapsed chronic lymphocytic leukemia. N Engl J Med. 2016;374(4):323–332.
- Wright GW, Huang DW, Phelan JD, et al. A probabilistic classification tool for genetic subtypes of diffuse large B cell lymphoma with therapeutic implications. Cancer Cell. 2020;37(4):551–568.e514.
- Phelan JD, Young RM, Webster DE, et al. A multiprotein supercomplex controlling oncogenic signalling in lymphoma. Nature. 2018;560(7718):387–391.
- Basu B, Dean E, Puglisi M, et al. First-in-human pharmacokinetic and pharmacodynamic study of the dual m-TORC 1/2 inhibitor AZD2014. Clin Cancer Res. 2015;21(15):3412–3419.
- Patel VK, Lamothe B, Ayres ML, et al. Pharmacodynamics and proteomic analysis of acalabrutinib therapy: similarity of on-target effects to ibrutinib and rationale for combination therapy. Leukemia. 2018;32(4):920–930.
- Wang M, Rule S, Zinzani PL, et al. Acalabrutinib in relapsed or refractory mantle cell lymphoma (ACE-LY-004): a single-arm, multicentre, phase 2 trial. Lancet. 2018;391(10121):659–667.
- Woyach JA, Blachly JS, Rogers KA, et al. Acalabrutinib plus obinutuzumab in treatment-naïve and relapsed/refractory chronic lymphocytic leukemia. Cancer Discov. 2020;10(3):394–405.
- Powles T, Wheater M, Din O, et al. A randomised phase 2 study of AZD2014 versus everolimus in patients with VEGF-refractory metastatic clear cell renal cancer. Eur Urol. 2016;69(3):450–456.
- Schmid P, Zaiss M, Harper-Wynne C, et al. Fulvestrant plus vistusertib vs fulvestrant plus everolimus vs fulvestrant alone for women with hormone receptor-positive metastatic breast cancer: the MANTA phase 2 randomized clinical trial. JAMA Oncol. 2019;5(11):1556–1563.
- Barr PM, Smith SD, Roschewski MJ, et al. Acalabrutinib combined with PI3Kδ inhibitor ACP-319 in patients (pts) with relapsed/refractory (R/R) B-cell malignancies. J Clin Oncol. 2018;36(15 Suppl.):7518.
- Mao Y, Xu L, Wang J, et al. ROR1 associates unfavorable prognosis and promotes lymphoma growth in DLBCL by affecting PI3K/Akt/mTOR signaling pathway. Biofactors. 2019;45(3):416–426.
- Kurtz DM, Scherer F, Jin MC, et al. Circulating tumor DNA measurements as early outcome predictors in diffuse large B-cell lymphoma. J Clin Oncol. 2018;36:2845–2853.
- Lenz G, Davis RE, Ngo VN, et al. Oncogenic CARD11 mutations in human diffuse large B cell lymphoma. Science. 2008;319(5870):1676–1679.
- Davis RE, Ngo VN, Lenz G, et al. Chronic active B-cell-receptor signalling in diffuse large B-cell lymphoma. Nature. 2010;463(7277):88–92.
- Faia K, White K, Murphy E, et al. The phosphoinositide-3 kinase (PI3K)-δ,γ inhibitor, duvelisib shows preclinical synergy with multiple targeted therapies in hematologic malignancies. PLoS One. 2018;13(8):e0200725.
- Spriano F, Tarantelli C, Gaudio E, et al. Single and combined BTK and PI3Kδ inhibition with acalabrutinib and ACP-319 in pre-clinical models of aggressive lymphomas. Br J Haematol. 2019;187(5):595–601.