
Abstract
TP53-aberrant myelodysplastic syndrome and acute myeloid leukemia have dismal outcomes. Here, we define the clinico-genomic landscape of TP53 disruptions in 40 patients and employ clonal dynamic modeling to map the mutational hierarchy against clinical outcomes. Most TP53 mutations (45.2%) localized to the L3 loop or LSH motif of the DNA-binding domain. TP53 disruptions had high co-occurrence with mutations in epigenetic regulators, spliceosome machinery, and cohesin complex and low co-occurrence with mutations in proliferative signaling genes. Ancestral and descendant TP53 mutations constituted measurable residual disease and fueled relapse. High mutant TP53 gene dosage predicted low durability of remission. The median overall survival (OS) was 280 days. Hypomethylating agent-based therapy served as an effective bridge to transplant, leading to improved median OS compared to patients who did not receive a transplant (14.7 vs. 5.1 months). OS was independent of the genomic location of TP53 disruption, which has implications for rational therapeutic design.
Introduction
Myelodysplastic syndrome (MDS) and acute myeloid leukemia (AML) are clonal disorders of the myeloid progenitor population. Seminal studies of the genomic landscape of AML showed that TP53 mutations are present at a frequency of 8% [Citation1]. Aberrations in TP53 may include deletions, translocations, or missense mutations [Citation2–6]. TP53 mutations are commonly associated with complex karyotype, drug resistance, and decreased overall survival (OS) [Citation1–3,Citation7–9]. The largest study to date of TP53-mutant MDS, which included 3,324 patients, found that the presence of multiple TP53 hits (regardless of the particular mutations) was associated with poor survival, suggesting that specific mutations or ancestral clones may not differentially affect treatment outcomes [Citation7]. Outcomes for patients with a monoallelic TP53 hit did not differ significantly from patients with wild-type TP53 [Citation7]. Our understanding of the disease biology of TP53-mutant MDS and AML is limited, and no specific or targeted FDA-approved therapy is currently available [Citation10]. Compared to conventional cytotoxic chemotherapy, decitabine has demonstrated a more robust response in patients harboring a TP53 mutation [Citation2]. Durable responses to treatment are infrequent, and long-term survival in most patients is rare [Citation2–5,Citation11]. There is a critical need for a better understanding of TP53-aberrant MDS and AML because this has implications in rational therapeutic design.
In this study, we characterize the clinico-genomic landscape and therapeutic outcomes of 40 patients with TP53-aberrant MDS or AML. We employ clonal dynamic modeling to show that numerous distinct TP53 aberrations are the primary pathogenic drivers of disease refractoriness and relapse in MDS and AML. The subclonal structure of MDS and AML harboring TP53 disruptions is, in large part, determined by ancestral and descendant TP53-aberrant clones. We observed that patients with TP53 aberrations benefit from hypomethylating agents (HMAs) as an effective bridge to allogeneic transplant, contrary to less optimistic reports about transplanting this mutational subset of patients [Citation11].
Methods
Patient subjects
Approval was obtained through the UMass Institutional Review Board (IRB) via protocols H00019393 (‘AML Database’) and H00013131 (‘Blood & Marrow Banking;’ NCT01174615). Data was collected from the UMass Leukemia Registry, which includes patients with new diagnoses of MDS and/or AML between 2011 and 2021. TP53 aberrations were defined as mutations with the TP53 locus (missense, frameshift deletion, splice site deletion, in-frame deletion, frameshift insertion) or large-scale disruptions including deletion of 17p or isochromosome 17.
TP53 sequencing of bone marrow aspirates
Genomic DNA was purified from bone marrow aspirates. A library was created using multiplex PCR targeting oncogene ‘hot spot’ mutations and full exon sequencing (CTMPv1 panel). PCR amplicons were isolated, followed by ligation of a sequencing linker and barcode for patient identification. Real-time PCR was used to quantify the library. A sequencing template was prepared by diluting the library, then by performing emulsion PCR to amplify and link the amplicon to a sequencing bead. The sequencing template was loaded onto an IonTorrent PGM next-generation sequencer.
Cytogenetic analyses
Bone marrow cells were cultured, and metaphase cells were harvested at 24 and 48 hr. Conventional G-banding using trypsin and Giemsa was performed on metaphases. Per each specimen, at least 20 (or all available) metaphase cells were analyzed for numerical and structural chromosomal anomalies. Criteria defined by the International System for Human Cytogenetic Nomenclature were used to describe abnormal clones. Fluorescence in situ hybridization was performed for TP53 deletion assessment using the Vysis LSI TP53/CEP17 probes (Abbott Molecular).
Extraction of gene expression profiling data for TP53 in normal and malignant hematopoiesis
Microarray data, stratified by cytogenetic subtype, was analyzed for TP53 gene expression in AML vs. normal human hematopoietic cells using BloodSpot [Citation12].
Prognostication using a multistage statistical model
A multistage statistical model developed from the German-Austrian AML Study Group of 1540 patients was used to prognosticate outcomes [Citation13].
Profiling of co-occurring mutations from datasets
The cBioPortal platform was queried for aggregate genomic and outcome data from The Cancer Genome Atlas (TCGA), Oregon Health and Science University (OHSU), and Washington University [Citation1–3,Citation14].
Pathogenicity analysis
A Catalog of Somatic Mutations and Cancer (COSMIC) was used to analyze TP53 mutations found in the UMass TP53-mutant AML/MDS cohort [Citation15,Citation16]. Pathogenicity predictions were determined by Functional Analysis through Hidden Markov Models (FATHMM).
Biological pathway analysis
Gene Ontology (GO) analysis (geneontology.org) was used to query select genes, and biological pathways and statistical analysis output were powered by the PANTHER classification system [Citation17–19]. TP53 gene sequence queries were performed using the NCBI RefSeq database [Citation20].
Clonal dynamic modeling and hierarchical clustering
Clonal dynamics were modeled via R (R Core team, www.r-project.org) and R packages ‘circlize,’ ‘timescape,’ and ‘BioCircos’ [Citation21,Citation22]. copy number variation (CNV) analysis was performed on sequencing data for samples containing ≥20% tumor load) and analyzed on IonXpress. Hierarchical clustering of co-occurring variant allele frequencies (VAFs) was performed by the R package ‘pheatmap’ [Citation21,Citation22]. VAF data was analyzed using IonTorrent Variant Caller and Softgenetics Next Gene software packages using GRCh37_3 (Ver HG19) as the reference sequence.
Statistical analyses
Statistical analyses were performed using GraphPad Prism version 8.4.2. Survival analysis and differences in OS were measured using the log-rank test. Scatterplot analysis of significance was performed using the unpaired t-test, two-tailed. Pearson’s chi-squared test for significance was used to calculate observed vs. expected frequencies of chromosomal aberrations. Co-mutation rate analysis was performed using Fisher’s exact test, two-sided. p-values of <0.05 were considered significant.
Results
TP53 expression is reduced in complex karyotype AML and TP53 disruption confers poor clinical outcomes
Previous work in TP53-mutant myeloid neoplasms has established an association between TP53 disruption and poor clinical outcomes [Citation2,Citation8]. Microarray analysis from the BloodSpot platform (GEO dataset GSE6891) showed similar results: the presence of multiple concurrent cytogenetic abnormalities was associated with lower TP53 messenger RNA (mRNA) in human AML (Figures S1(A,B)) [Citation12]. We explored curated MDS and AML datasets containing a total of 798 patients from TCGA, OHSU, and Washington University [Citation1–3]. The frequency of TP53 mutations was 9.8%. Datasets showed a significantly lower median OS for TP53-mutant MDS and AML cases (7.5 months, n = 78) compared to wild-type TP53 cases (15.9 months, n = 720) (p < 0.001) (Figure S1(C)). We employed a multistage statistical model developed from the German-Austrian AML data set to prognosticate TP53-aberrant MDS/AML from our cohort (Figure S1(D)) [Citation13]. Algorithms consistently showed a predicted median OS of <6 months.
AML-MRC and therapy-related MDS/AML encompass most TP53-mutant myeloid neoplasms and TP53 mutations drive numerous chromosomal aberrations
Among 477 identified cases of MDS or AML in the UMass Leukemia Registry, 40 patients (8.4%) harbored TP53 aberrations. Of these 40 patients, 28 patients (70%) segregated into WHO-defined AML subentities, and 12 patients (30%) segregated into WHO-defined MDS subentities (; ) [Citation23]. Of these 40 patients, 12 patients (30%) were female. The mean age of diagnosis was 67.2 ± 11.9 years, and the median age was 64.5 years (range 41–93 years). Among 64 total TP53 aberrations, most (58%) were missense mutations within the TP53 locus ().
Figure 1. (A) Distribution of WHO subentities of MDS and AML. (B) Spectrum of 64 TP53 disruptions among 40 patients with TP53-aberrant MDS/AML. (C) Cytogenetic landscape of TP53-aberrant myeloid neoplasm. Structural aberrations are shown in the chromomap. (D) Observed vs. expected burden of chromosomal aberrations per patient per gigabase of the genome, based on the size of reference human genome. Aberrations per gigabase are enumerated for each chromosome. AML-MRC: AML with myelodysplasia-related changes; t-AML: therapy-related AML; NOS: not otherwise specified; t-MDS: therapy-related MDS; MDS-EB-1: MDS with excess blasts-1 (5–9% blasts); MDS-EB-2: MDS with excess blasts-2 (10–19% blasts); MDS-SLD: MDS with single lineage dysplasia; MDS-MLD: MDS with multilineage dysplasia.
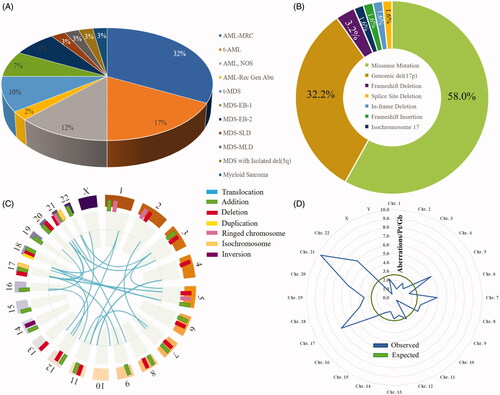
Table 1. Demographics and baseline disease features.
Previous work in TP53-mutant myeloid neoplasms has established an association between cytogenetic abnormalities and poor clinical outcomes [Citation24]. We performed chromomapping based on conventional cytogenetics, which showed significant large-scale genomic instability associated with TP53 aberrations in our cohort (; Table S1). A total of 324 cytogenetic aberrations were found among 40 patients. The most frequent translocation was an unbalanced t(5;17) that resulted in del(5q) and del(17p), with four occurrences. Despite being the smallest human autosome, chromosome 21 was a cytogenetic hotspot with 15 patients (37.5%) demonstrating abnormalities (). Chromosome 21 harbored the highest rate of genomic disruption per patient per gigabase, with a disproportionate number of observed vs. expected aberrations (p < 0.05) ().
TP53 mutations are topologically diverse and non-overlapping but localize mostly to the L3 loop or LSH motif of the DNA-binding domain
We next explored the structural aspects of TP53 aberrations (). Each mutational hotspot on the p53 isoform A amino acid sequence is represented by a colored flag located at the corresponding codon, tagged with the patient ID and amino acid sequence change. The flag colors and lengths correspond to clinical responses and outcomes. In 40 patients, 40 unique intragenic TP53 mutations were found: there were only two duplicates among the group (p.R273H and p.R282W), and 8 patients harbored multiple concurrent TP53 mutations. Among 40 different mutations, 38 mutations (95%) localized to the DNA-binding domain of p53. Annotation of our cohort () against the COSMIC dataset of 2659 known TP53 point mutations in hematolymphoid disorders () revealed a similar clustering pattern: hotspot codons mapped to the 3′ end of the DNA-binding domain.
Figure 2. (A) Mutational hotspots on the TP53 gene. The x-axis represents the p53 isoform A amino acid sequence. The flags indicate TP53 gene mutations in the cohort. Each flag is detailed with the corresponding patient ID and gene mutation, and ID numbers with a ‘-2’ or ‘-3’ specify the second or third TP53 mutation, respectively, in a patient. Flag masts are coded by ‘best clinical response’ and ‘duration of best clinical response,’ represented by line color and line length, respectively. Flag heads are color-coded by ‘clinical outcome.’ (B) Catalogue of Somatic Mutations in Cancer (COSMIC) data for 2659 known TP53 mutations in hematolymphoid malignancies annotated against UMass cohort mutations in panel (A). (C) p53 isoform A with mutational hotspots primarily in the DNA-binding domain, with the majority between N235 and E286. (D) DNA-binding domain of p53 with mutational sites (red rectangles) from the UMass cohort. Structure has been adapted from prior studies [Citation25].
![Figure 2. (A) Mutational hotspots on the TP53 gene. The x-axis represents the p53 isoform A amino acid sequence. The flags indicate TP53 gene mutations in the cohort. Each flag is detailed with the corresponding patient ID and gene mutation, and ID numbers with a ‘-2’ or ‘-3’ specify the second or third TP53 mutation, respectively, in a patient. Flag masts are coded by ‘best clinical response’ and ‘duration of best clinical response,’ represented by line color and line length, respectively. Flag heads are color-coded by ‘clinical outcome.’ (B) Catalogue of Somatic Mutations in Cancer (COSMIC) data for 2659 known TP53 mutations in hematolymphoid malignancies annotated against UMass cohort mutations in panel (A). (C) p53 isoform A with mutational hotspots primarily in the DNA-binding domain, with the majority between N235 and E286. (D) DNA-binding domain of p53 with mutational sites (red rectangles) from the UMass cohort. Structure has been adapted from prior studies [Citation25].](/cms/asset/12a2470d-e422-4ec1-b196-c6b6052b8ec0/ilal_a_1957869_f0002_c.jpg)
There was significant topographical diversity in the mutational repertoire within the p53 isoform A sequence (). Three-dimensional representation of the p53 protein is depicted with vulnerable mutational sites (red) () [Citation25]. TP53 has five domains that are conserved [Citation25,Citation26]. Areas II through V contained the most mutations in our cohort. Interspersed within these conserved sequences are structural domains which comprise the L2 loop (codons 163–195) and the L3 loop (codons 236–251). The L2 loop is required for folding and stabilization. The L3 loop probably contacts DNA directly, and the LSH motif (or L1 loop-sheet-alpha helix) (codons 112–141 and 273–286) appears to contact the DNA directly [Citation25,Citation26].
We observed that 19 of 42 total mutations (45.2%) occurred within the L3 loop or the LSH motif of the DNA-binding domain. Among these 19 mutations, 11 mutations (26.2%) occurred within the LSH motif, and eight mutations (19.0%) occurred within the L3 loop. Pathogenicity scores for the mutations were calculated via FATHMM, and 33 of 38 total mutations (86.8%) were deemed pathogenic (Table S2)).
TP53 mutations co-occur most commonly with mutations in epigenetic regulators, spliceosome machinery, and the cohesin complex
We postulated that mutant TP53 is the pathogenic driver for leukemogenesis and gives rise to other mutations throughout the natural history of the disease. Genes found to be most frequently co-altered with TP53 included epigenetic regulators and preleukemia-associated genes (32.5% co-mutation rate, blue chords), spliceosome genes (25% co-mutation rate, orange chords), and cohesin complex genes (10% co-mutation rate, green chords) (). Eight patients also harbored two or more concurrent but unique TP53 co-mutations (17.5% co-occurrence rate, red-to-red chord). Low co-alteration rates were seen in a variety of gene function clusters including proliferative signaling genes ().
Figure 3. (A) Frequency of co-occurring mutations with TP53-aberrrant MDS/AML in the UMass cohort. Genes are grouped and color-coded by cluster. The chord width between two genes corresponds to the rate of co-mutation. Genes were examined pairwise, moving clockwise around the circos. (B) Co-mutation frequency for TP53 chords only. (C) Rates of co-mutation with TP53 by gene cluster. (D) Co-mutational spectrum for 86 patients with TP53 mutations derived from aggregate analysis of 878 total AML samples from the cBioPortal platform. TP53 mutations were found in 86 samples by genome sequencing (mRNA ± whole exome). Samples harboring co-mutations in these candidate genes are shown by vertical columns. (E) Frequency of co-occurring mutations in the TP53-mutant UMass cohort (n = 40) vs. TP53-mutant cBioPortal cohort (n = 86) vs. cBioPortal total cohort (n = 878). *p < 0.05 for observed vs. expected.
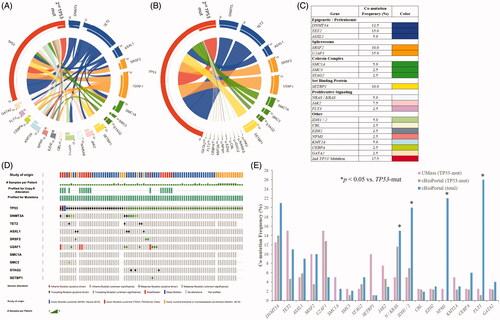
We next assessed cBioPortal data comprising the genomic profiles of 878 collective cases of myeloid neoplasms [Citation1–3,Citation14]. A total of 86 cases (9.8%) harbored TP53 mutations, and co-occurring mutation rates were analyzed for specific gene clusters. The co-mutational heatmap is color-coded by gene alteration type ().
Combined data from the UMass and cBioPortal TP53-mutant MDS/AML cohorts showed significant differences in some passenger mutation frequencies compared to the total cBioPortal dataset (). The cBioPortal total dataset (n = 878, regardless of TP53 mutation status) showed higher frequencies of mutations in proliferative signaling genes (FLT3, NRAS, KRAS), IDH1, IDH2, and NPM1 compared to TP53-mutant samples (blue bar vs. purple and gray bars, p < 0.05). A comparison of the UMass TP53-mutant cohort with the cBioPortal TP53-mutant cohort (n = 86) showed similar results, except for the frequencies of two co-mutant genes: TET2 (15 vs. 4.7%) and SETBP1 (10 vs. 1.2%) ().
Gene ontology analysis was performed to assess for enriched biological processes that unified the genes found to be frequently co-mutated with TP53 [Citation17–19] (Table S3). The most common biological processes involving the co-mutants included cell cycle control, mitotic spindle regulation, and chromatin assembly. There was no enrichment of processes involving proliferative signaling.
Ancestral and descendant TP53 mutations constitute MRD during morphologic remission and fuel disease relapse
We next modeled clonal dynamics of mutant cell populations that evolved during varying time points of remission and relapse. We performed amplicon quantification of genes for serial bone marrow aspirates taken at varying time points and performed CNV analysis for diagnostic specimens. We first assessed patients with no subclonal heterogeneity, namely those patients with mutant TP53 (red fishplots) but no co-occurring mutations (). Among eight patients with multiple concurrent TP53 mutations (red, purple, and pink fishplots), three patients had no other co-occurring mutations while five patients harbored descendant mutations. We then modeled patients with subclonal heterogeneity with a predominance of co-occurring spliceosome gene mutations (), a predominance of co-occurring epigenetic regulator gene mutations (), a predominance of co-occurring cohesin complex gene mutations (), and a predominance of co-occurring proliferative signaling gene mutations (). Absolute or relative VAFs illustrate the relation between co-occurring mutant genes and clones. CNV gains or deletions were annotated against cytogenetics and FISH to infer clonality (Figure S2). In some patients, multiple clones were present, and differences between clones balanced out CNV gains (green dots) and deletions (red dots) so that no net change was detected on average by CNV (Figure S2).
Figure 4. Subclonal architecture of TP53-mutant MDS/AML as determined by clonal dynamic modeling, organized by gene cluster. Clonal dynamics of TP53 and co-occurring mutant cell populations (with absolute or relative VAFs) are demonstrated by expansion and evolution over time and in relation to treatment. Relationship charts were constructed using timepoints when bone marrow sampling and molecular testing including CNV were performed. Timepoints are named in relation to the clinical disease context, for example at diagnosis (Dx), post-induction (Post-Ind), relapse (Rel), and after hematopoietic cell transplant (Post-HCT). (A) Patients with TP53 mutations only. (B) Dynamics of spliceosome-mutant descendants. (C) Dynamics of epigenetic regulator-mutant descendants. (D) Dynamics of cohesin complex-mutant descendants. (E) Dynamics of proliferative signaling-mutant descendants. Clonal phylogeny trees show hierarchical development of cell populations.
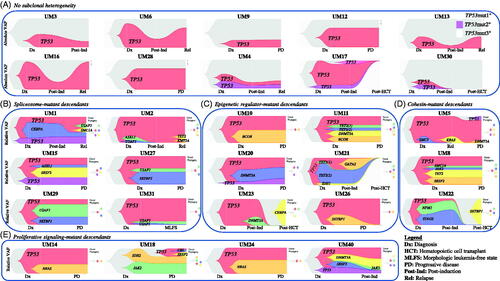
We found that TP53 was predominantly an ancestral mutation, but the emergence of a 2nd or 3rd TP53 mutation can occur (red, purple, and pink fishplots). Spliceosome complex and epigenetic regulator mutations were either passengers (concurrent in the initial clone) or descendants (late-arising) of the ancestral TP53 clone (). The reemergence of epigenetic, spliceosome, or cohesin complex mutations was driven by the expansion of the ancestral TP53-mutant clone (red fishplots) or the emergence of a new TP53-mutant clone (purple and pink fishplots). These results suggest that the TP53-mutant subclones are the key drivers of disease pathogenesis, therapy resistance, and evolution of co-occurring mutations in TP53-mutant MDS and AML.
We found that non-TP53-mutant clones commonly underwent extinction after induction (Post-Ind). However, TP53 mutations were resistant to therapy and were present throughout the clinical disease course. Relapsed (Rel) or progressive disease (PD) at the molecular level was seen in nearly all non-transplant patients, and the TP53 mutation(s) persisted. These patients did not achieve molecular remission after induction, despite often having achieved morphologic leukemia-free state (MLFS). TP53 mutations persisted except in patients who received the transplant, and these patients experienced subsequent extinction of the TP53-mutant clone only after full-donor chimerism was achieved ().
High mutant TP53 gene dosage predicts low durability of complete remission
We explored the relation between TP53 gene dosage and the likelihood of achieving complete remission (CR) () and the duration of CR (). The durability of CR was significantly lower in patients with higher mean mutant TP53 gene doses (). The mean VAF in patients achieving CR lasting >6 months was 20.0 ± 5.4%, whereas the mean VAF in patients achieving CR lasting <6 months was 45.6 ± 9.6% (p = 0.017). The mean mutant VAF was also significantly lower in patients achieving CR lasting >6 months compared to patients not having achieved remission (p = 0.0008) ().
Figure 5. Relation between mutant TP53 VAF and multiple clinico-pathologic parameters, including (A) remission status, (B) durability of remission, (C) number of distinct cytogenetic aberrations at diagnosis, (D) number of co-occurring mutations at diagnosis, (E) bone marrow cellularity, and (F) bone marrow blast count. (G) Hierarchical clustering based on VAFs of co-occurring mutations. CR: complete remission; CRi: complete remission with incomplete count recovery; mo: months; y: years; BM: bone marrow; PB: peripheral blood; VAF: variant allele frequency.
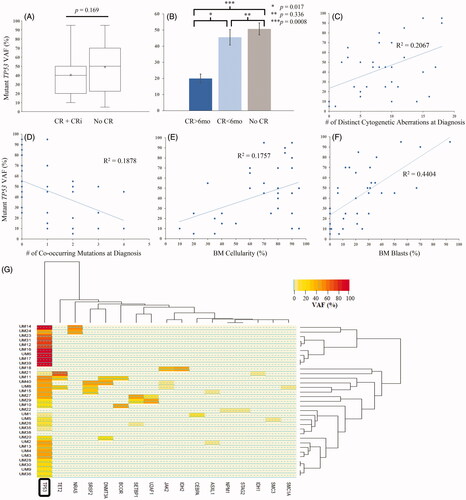
The VAF showed a direct correlation with the number of distinct cytogenetic aberrations (). Higher mutant VAFs were more often found in patients with fewer co-occurring mutations (). There was a trend toward higher bone marrow cellularity and blast percentage with higher VAF (). Hierarchical clustering based on VAFs of all co-occurring mutations at the time of diagnosis showed a dichotomy between high mutant TP53 VAF and low mutant TP53 VAF (). We observed a minimal burden of co-occurring mutations in patients with high mutant TP53 VAF ().
First-line HMA-based therapy serves as an effective bridge to transplant and improved OS post-transplant
We next sought to determine the best clinical response achieved after therapy and OS () [Citation27]. Eighteen patients (45%) had composite CR after first-line therapy. Among these 18 patients, 17 patients (42.5%) achieved MRD(+) CR while only 1 patient (2.5%) achieved MRD(−) CR. MRD(−) CR was mostly achieved only after transplant (except for one patient, UM30, who achieved MRD(-) CR even before transplant). Among the four patients who achieved CR after cytotoxic induction chemotherapy, the duration of response was <6 months for all. For the 27 patients who received HMA-based therapy as first-line or salvage, 10 patients (37%) were able to proceed with an allogeneic transplant, while only one of nine patients (11%) who received cytotoxic chemotherapy was able to proceed with the transplant.
Table 2. Treatment response for patients who received HMA-based induction vs. cytotoxic chemotherapy-based induction.
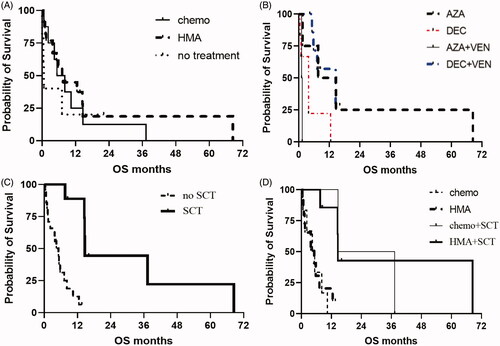
There was no significant difference in OS for patients who received front-line cytotoxic chemotherapy compared to HMA-based therapy (median OS 6.8 vs. 7.6 months, p = 0.83). (). Patients receiving upfront HMA therapy were further stratified to compare decitabine vs. azacitidine (±venetoclax) in the first-line setting (). Median OS was similar for these groups. There was an improvement in median OS for patients receiving transplant, compared to patients not receiving transplant (14.7 vs. 5.1 months, p = 0.0001) (). This survival benefit for transplant was seen regardless of the first-line therapy given: median OS was 26, 14.6, 5.2, and 4.9 months for chemotherapy + transplant, HMA + transplant, HMA alone, and chemotherapy alone, respectively (p = 0.002) (). However, a greater proportion of patients receiving HMA-based therapy were able to benefit from improved OS because they were more likely to proceed to transplant. The median OS for all 40 patients was 280 days. The average duration of follow-up was 255 days for patients with ongoing responses (). There was no difference in survival based on the type of TP53 mutation and the location of the mutation within the TP53 locus (Figure S3).
Figure 6. (A) OS for patients after HMA-based induction vs. cytotoxic chemotherapy-based induction. (B) OS for patients stratified by type of HMA, with or without venetoclax. (C) OS for patients having received stem cell transplant compared to not having receiving stem cell transplant. (D) OS for patients stratified by type of first-line therapy and whether transplant was performed. HMA: hypomethylating agent; AZA: azacitidine; DEC: decitabine; SCT: stem cell transplant.
Discussion
In this study, we explored the reasons underlying the adverse clinical outcomes for TP53-aberrant MDS and AML and employed clonal dynamic modeling to map the mutational hierarchy against clinical outcomes in 40 patients. Previous work in solid cancers also showed that TP53 mutations occur mostly in the DNA-binding domain [Citation28]. The integrity of the mutational hotspots seen in the DNA-binding region may be explainable by the fact that p53 is a transcription factor with multiple targets, and the DNA-binding domain carries out the effector function. This structural information is important because it alludes to function and provides insight into therapeutic design.
The clinical implications of our clonal dynamic modeling are based on the idea that the TP53-mutant clone rests at the pinnacle of the leukemic hierarchy. The TP53-mutant clone is the primary driver of pathogenicity, treatment resistance, and disease recurrence. Furthermore, the same TP53 mutation (the ancestral mutation) fuels subclonal diversity in descendants, demonstrated by late-arising mutations in multiple gene clusters. Patients do not show evidence of molecular remission after induction therapy, except in cases of transplant, supporting TP53-mutant clone persistence as the biological mechanism of therapeutic resistance to first-line treatment (). Our data suggest that transplant is necessary to eliminate the disease at the molecular level, which is consistent with current knowledge about the depth of response after transplant [Citation29]. Contrary to the current thoughts about futility of transplant for patients with TP53-aberrant MDS or AML, we show that HMA therapy serves as a safe and effective bridge to transplant, which ultimately improves OS in this mutational cohort. This novel paradigm of ‘low-intensity’ therapy before transplant may be favored for this subset of patients.
Preleukemic, spliceosome, and cohesin complex mutations are either passenger or descendant mutations of the founder clone and often undergo extinction on treatment (). Preleukemic and cohesin complex mutations likely have a biological role in leukemogenesis, but TP53 mutations appeared to be more dominant based on the inferred mutational order and based on the clinical context [Citation30,Citation31].
One limitation to our study is that, in the 8 patients who harbored two or more TP53 mutations at baseline, it is difficult to know which mutation(s) is/are driving the natural history of the disease. Single-cell sequencing might confirm this [Citation22]. We demonstrate that both ancestral and descendant TP53-mutant clones harbor pathogenic drivers. The identification of this descendant driver is novel in that the current paradigm for leukemogenesis holds that ancestral and early mutations serve as drivers of disease. Specifically, both ancestral and descendant clones can harbor both pathogenic drivers and non-pathogenic passenger mutations (). Another limitation to our study is that VAF may not be an accurate indicator of allelic status, as suggested by prior studies [Citation7]. Our study confirms the hypothesis by Bernard et al., who noted that multiple TP53 hits portend poor outcomes regardless of the nature of the hits (Figure S3) [Citation7]. Our study adds to Bernard et al. by including TP53 clonal dynamics. Another limitation is that clinical outcomes were retrospectively analyzed (without patient randomization to treatment arms), and physician preference often determined first-line therapy.
We show that MRD(−) CR is more likely to be achieved if transplant is preceded by first-line HMA compared to first-line conventional chemotherapy. Transplant offered the best (and arguably only) chance of durable remission. Outcomes were better with pre-transplant HMA therapy, despite a higher risk patient population (based on age, fitness, and/or leukemic features). In the absence of transplant, relapse occurs inevitably and is fueled by ancestral and descendant TP53 mutations. This concept seems unique to TP53-mutant MDS/AML.
There is a critical need for novel therapeutics for TP53-aberrant MDS/AML. Targeted approaches like eprenetapopt and idasanutlin are exciting new developments in the treatment of TP53-aberrant hematologic malignancies [Citation32–34]. Eprenetapopt is being studied in trials, and the mechanism for reverting mutant to wild-type p53 involves post-translational effects via folding and misfolding of the protein [Citation35]. We need a deeper understanding of the biological basis of TP53-aberrant MDS/AML, as this has implications in rational drug design.
Author contributions
SAP, MRL, and JMG conceived and wrote the manuscript. QS, JC, KS, and JMG created the Leukemia registry and acquired the data for analysis. AE, JC, MR, and JMG analyzed the data and provided a critical review. LH, PM, and AWH conducted the cytogenetic and molecular assays.
GLAL-2021-0197-File011.docx
Download MS Word (48.9 KB)GLAL-2021-0197-File010.pptx
Download MS Power Point (154.4 KB)GLAL-2021-0197-File009.pptx
Download MS Power Point (674.8 KB)GLAL-2021-0197-File008.pptx
Download MS Power Point (295.1 KB)Disclosure statement
SAP serves on the AML Advisory Board for Bristol Myers Squibb and the Multiple Myeloma Advisory Board for Pfizer. SAP has a consultancy role with the Dedman Group, SIS International, and Adivo Associates. JC has a consultancy role with Jazz Pharmaceuticals and Amgen and is on the Advisory Board for Allovir. JMG has a consultancy role for Novartis and holds US Patent No. 9,012,215 and US Patent No. 10,222,376 (not licensed thus far and no royalties to date).
References
- The Cancer Genome Atlas (TCGA). Genomic and epigenomic landscapes of adult de novo acute myeloid leukemia. N Engl J Med. 2013; 368:2059–2074.
- Welch JS, Petti AA, Miller CA, et al. TP53 and decitabine in acute myeloid leukemia and myelodysplastic syndromes. N Engl J Med. 2016;375(21):2023–2036.
- Tyner JW, Tognon CE, Bottomly D, et al. Functional genomic landscape of acute myeloid leukaemia. Nature. 2018;562(7728):526–531.
- Bowen D, Groves MJ, Burnett AK, et al. TP53 gene mutation is frequent in patients with acute myeloid leukemia and complex karyotype, and is associated with very poor prognosis. Leukemia. 2009;23(1):203–206.
- Seifert H, Mohr B, Thiede C, et al. The prognostic impact of 17p (p53) deletion in 2272 adults with acute myeloid leukemia. Leukemia. 2009;23(4):656–663.
- Middeke JM, Herold S, Rücker-Braun E, et al. TP53 mutation in patients with high-risk acute myeloid leukaemia treated with allogeneic haematopoietic stem cell transplantation. Br J Haematol. 2016;172(6):914–922.
- Bernard E, Nannya Y, Hasserjian RP, et al. Implications of TP53 allelic state for genome stability, clinical presentation and outcomes in myelodysplastic syndromes. Nat Med. 2020;26(10):1549–1556.
- Byrd JC, Mrózek K, Dodge RK, et al. Pretreatment cytogenetic abnormalities are predictive of induction success, cumulative incidence of relapse, and overall survival in adult patients with de novo acute myeloid leukemia: results from cancer and leukemia group B (CALGB 8461). Blood. 2002;100(13):4325–4336.
- Schoch C, Kern W, Kohlmann A, et al. Acute myeloid leukemia with a complex aberrant karyotype is a distinct biological entity characterized by genomic imbalances and a specific gene expression profile. Genes Chromosomes Cancer. 2005;43(3):227–238.
- Haase D, Stevenson KE, Neuberg D, et al. TP53 mutation status divides myelodysplastic syndromes with complex karyotypes into distinct prognostic subgroups. Leukemia. 2019;33(7):1747–1758.
- Lindsley RC, Saber W, Mar BG, et al. Prognostic mutations in myelodysplastic syndrome after stem-cell Transplantation. N Engl J Med. 2017;376(6):536–547.
- Bagger FO, Sasivarevic D, Sohi SH, et al. BloodSpot: a database of gene expression profiles and transcriptional programs for healthy and malignant haematopoiesis. Nucleic Acids Res. 2016;44(D1):D917–D924.
- Gerstung M, Papaemmanuil E, Martincorena I, et al. Precision oncology for acute myeloid leukemia using a knowledge bank approach. Nat Genet. 2017;49(3):332–340.
- Cerami E, Gao J, Dogrusoz U, et al. The cBio cancer genomics portal: an open platform for exploring multidimensional cancer genomics data. Cancer Discov. 2012;2(5):401–404.
- Futreal AP, Coin L, Marshall M, et al. A census of human cancer genes. Nat Rev Cancer. 2004;4(3):177–183.
- Tate JG, Bamford S, Jubb HC, et al. COSMIC: the catalogue of somatic mutations in cancer. Nucleic Acids Res. 2019;47(D1):D941–D947.
- Ashburner M, Ball CA, Blake JA, et al. Gene ontology: tool for the unification of biology. The Gene Ontology Consortium. Nat Genet. 2000;25(1):25–29.
- The Gene Ontology Consortium. The gene ontology resource: 20 years and still going strong. Nucleic Acids Res. 2019; 47:D330–D338.
- Mi H, Muruganujan A, Ebert D, et al. PANTHER version 14: More genomes, a new PANTHER GO-slim and improvements in enrichment analysis tools. Nucleic Acids Res. 2019;47(D1):D419–D426.
- O'Leary NA, Wright MW, Brister JR, et al. Reference sequence (RefSeq) database at NCBI: CURRENT status, taxonomic expansion, and functional annotation. Nucleic Acids Res. 2016;44(D1):D733–D745.
- Gu Z, Gu L, Eils R, et al. Circlize Implements and enhances circular visualization in R. Bioinformatics. 2014;30(19):2811–2812.
- Ediriwickrema A, Aleshin A, Reiter JG, et al. Single-cell mutational profiling enhances the clinical evaluation of AML MRD. Blood Adv. 2020;4(5):943–952.
- Arber DA, Orazi A, Hasserjian R, et al. The 2016 revision to the World Health Organization classification of myeloid neoplasms and acute leukemia. Blood. 2016;127(20):2391–2405.
- Rucker FG, Schlenk RF, Bullinger L, et al. TP53 alterations in acute myeloid leukemia with complex karyotype correlate with specific copy number alterations, monosomal karyotype, and dismal outcome. Blood. 2012;119(9):2114–2121.
- Joerger AC, Ang HC, Fersht AR. Structural basis for understanding oncogenic p53 mutations and designing rescue drugs. Proc Natl Acad Sci USA. 2006;103(41):15056–15061.
- May P, May E. Twenty years of p53 research: structural and functional aspects of the p53 protein. Oncogene. 1999;18(53):7621–7636.
- Dohner H, Estey E, Grimwade D, et al. Diagnosis and management of AML in adults: 2017 ELN recommendations from an international expert panel. Blood. 2017;129(4):424–447.
- Russo A, Migliavacca M, Zanna I, et al. p53 mutations in L3-loop zinc-binding domain, DNA-ploidy, and S phase fraction are independent prognostic indicators in colorectal cancer: a prospective study with a five-year follow-up. Cancer Epidemiol Biomarkers Prev. 2002;11(11):1322–1331.
- Hourigan CS, Dillon LW, Gui G, et al. Impact of conditioning intensity of allogeneic transplantation for acute myeloid leukemia with genomic evidence of residual disease. J Clin Oncol. 2020;38(12):1273–1283.
- Jaiswal S, Fontanillas P, Flannick J, et al. Age-related clonal hematopoiesis associated with adverse outcomes. N Engl J Med. 2014;371(26):2488–2498.
- Mazumdar C, Shen Y, Xavy S, et al. Leukemia-associated cohesin mutants dominantly enforce stem cell programs and impair human hematopoietic progenitor differentiation. Cell Stem Cell. 2015;17(6):675–688.
- Demir S, Boldrin E, Sun Q, et al. Therapeutic targeting of mutant p53 in pediatric acute lymphoblastic leukemia. Haematologica. 2020;105(1):170–181.
- Montesinos P, Beckermann BM, Catalani O, et al. MIRROS: a randomized, placebo-controlled, phase III trial of cytarabine ± idasanutlin in relapsed or refractory acute myeloid leukemia. Future Oncol. 2020;16(13):807–815.
- Maslah N, Salomao N, Drevon L, et al. Synergistic effects of PRIMA-1Met (APR-246) and 5-azacitidine in TP53-mutated myelodysplastic syndromes and acute myeloid leukemia. Haematologica. 2020;105(6):1539–1551.
- Sallman DA, DeZern AE, Garcia-Manero G, et al. Eprenetapopt (APR-246) and azacitidine in TP53-mutant myelodysplastic syndromes. J Clin Oncol. 2021;39(14):1584–1594.