
Transcription of the immunoglobulin heavy chain (IgH) locus is controlled in cis by the 3’regulatory region (3’RR) [Citation1]. The 3’RR thus control somatic hypermutation, class switch recombination (CSR), Ig secretion and B-cell fate in mature B-cells. Previous studies with transgenic mice (IgH-KI-c-myc) bearing an IgH inserted c-myc (i.e. under transcriptional dependence of the 3’RR) have suggested that targeting the 3’RR with histone deacetylase inhibitors (HDACi) would be of interest in order to down regulate c-myc deregulated transcripts leading to B-cell lymphomagenesis [Citation2,Citation3]. The 3’RR is a complex element with four transcriptional enhancers (namely hs3a, hs1,2, hs3b and hs4) encompassed in a unique and functional 3 D palindromic architecture [Citation4,Citation5]. The aim of this study was to compare 3’RR HDAC binding on normal mouse B-cells and B-cell lymphomas and if the effect of the HDACi SAHA (suberanilohydroxamic acid also known as vorinostat) on B-cell responses was mediated by a direct effect on 3’RR enhancer activation.
Mice were housed and procedures were conducted in agreement with European directive 2010/63/EU on animals used for scientific purposes (APAFiS ≠ 13855). CD43- spleen cells from wt mice (and ΔIRIS mice for ChIP experiments) were cultured at 1 × 10⁶ cells/ml in RPMI 1640 with 10% FCS, 5 µg/ml LPS with or without 20 ng/ml IL4 in presence or not of SAHA. At day 2, cells were recovered and ChIP experiments were done as described [Citation6,Citation7] with HDAC1, HDAC2, HDAC3 and CBP specific antibodies (Abcam). At day 3, cell proliferation (six replicates) was evaluated using the MTS assay [Citation6]. At day 3, cells were recovered and RNA extracted using miRNeasy kit from QIAGEN. RNA libraries were obtained using TruSeq Stranded Total RNA with Ribo-Zero Gold (Illumina). Libraries were sequenced on a NextSeq500 sequencer, using NextSeq 500/550 High Output Kit (Illumina) (Nice Sophia-Antipolis Functional Genomics Platform, France) [Citation7]. RNAseq data were deposited (https://www.ncbi.nlm.nih.gov/geo/query/acc.cgi?acc) under accession numbers GSE169690/GSE169691. At day 3, 1 × 10⁶ cells were cultured for 24 h in medium without LPS/cytokine/SAHA. Supernatants were used for Ig quantification (specific IgG1/IgG3 ELISA assays) [Citation4,Citation6]. At day 4, CSR was evaluated by incubating cultured B-cells with anti-B220-SpectralRed-labeled antibodies and anti-IgG1/anti-IgG3-fluorescein-isothiocyanate labeled antibodies and analyzed on a Fortessa LSR2 (Beckton-Dickinson).
A schematic representation of the IgH locus (not to scale) is reported in . The IgH 3’RR palindromic structure (to scale) with its four enhancer elements (hs3a, hs1,2, hs3b and hs4) and the intervening response inverted sequences (IRIS) are represented. We investigated CD43- mature spleen B-cells (i.e. depleted CD43+ T-cells/monocytes). The vast majority (>90%) of spleen B-cells had a mature B220+CD19+IgM+IgD+ phenotype. The remaining cells consisted of transitional B-cells (IgM+IgD-). Less than 1% expressed the CD138 plasmocyte antigen (data not shown). Confirming a previous study [Citation8], ChIP assays indicated that HDAC1 bound to the 3’RR hs1,2 enhancer in LPS-stimulated B-cell splenocytes (). No significant HDAC1 binding was found for the 3 other 3’RR enhancers (). No HDAC2 and HDAC3 binding to hs1,2 was found (not shown). Deconstructing the palindromic 3’RR structure by deleting the 5’IRIS [Citation4], precluded hs1,2 HDAC1 binding (). SAHA selectively inhibited HDAC I/II classes. We thus investigated the role of SAHA on B-cell growth, CSR and Ig synthesis. As shown in , SAHA decreased B-cell growth in two experimental conditions (LPS ± IL4). SAHA decreased IgG3 CSR (LPS stimulation) and increased IgG1 CSR (LPS + IL4 stimulation) (). The effects of SAHA on IgG3 and IgG1 CSR paralleled those on IgG3 and IgG1 secretion () suggesting that levels of Ig production depend on the number of switched cells. CSR and Ig synthesis are controlled through IgH locus transcription with 3’RR as a conductor [Citation1]. RNAseq experiments indicated that SAHA treatment had no effect on 3’RR activation judging by the expression of 3’RR sense and antisense enhancer RNAs (eRNAs) (). RNAseq data indicated no effect on IgM transcription and increased IgG1 transcription in response to LPS + IL4 (). This result would be related to the increased amount of IgG1 switched cells in response to SAHA. RNAseq experiments indicated 112 genes down regulated by SAHA with genes implicated in epigenetic-related processes (Smyd2, Nek2, Trmt10a, Rnmtl1) and histone markers (Hist1h2ai/2an/2ah/2ag/2af/2ab/3b/3g) highlighting effectiveness of SAHA treatment. Seventy seven genes were up regulated by SAHA including genes of DNA reparation (Msh5) and inflammation processes (Tnf/Tnfrsf18, Naip5) without evident links with HDAC/AID pathways and switch processes (data not shown). Convincing demonstrations of the essential contributions of 3’RR in B-cell lymphomagenesis have been provided by knock-in (KI) animal models which bring the oncogene c-myc under 3’RR transcriptional control [Citation2,Citation9]. We next examined the effect of SAHA on growth of IgH-KI-c-myc mouse B-cell lymphomas. As shown in , results indicated an inconsistent effect (when using iMycEµ, iMycCµ and iMycCα IgM+IgD+ B-cell lymphomas) of SAHA on B-cell lymphoma growth; some increased their LPS stimulated growth, some had unchanged growth and some reduced their growth (despite same B220+IgM+IgD+ mature B-cell phenotype). ChIP assays indicated no HDAC1 binding to the 3’RR hs1,2 enhancer in these freshly isolated mice B-cell lymphomas (). In contrast, the histone acetyl transferase (HAT) CBP was recruited to hs3a and hs3b in IgH-KI-c-myc mature B-cell lymphomas () when absent in normal mature B-cell splenocytes (not shown).
Figure 1. HDAC, HDACi and wt B-cells. (A) IgH locus (not to scale). The locations of V-D-J segments, Eµ enhancer, constant genes and 3’RR are indicated. The palindromic structure of the IgH 3’RR (to scale) with its four enhancer elements (hs3a, hs1,2, hs3b and hs4) and the IRIS sequences are represented. (B) HDAC1 fixation on enhancer elements of the 3’RR. ChIP experiments were performed on 2-day LPS-stimulated wt B-cell splenocytes (mean ± SEM of 5 experiments) and on 2-day LPS-stimulated ΔIRIS B-cell splenocytes (mean ± SEM of 6 experiments). The mock immunoprecipitation (IP) during ChIP is the control IP to avoid unspecific antigen-antibody reactions. Quantitative PCR experiments were compared between samples treated with HDAC1 antibodies (white bars) and unspecific antibodies (mock, black bars). Significance with the student-t-test for paired data. PCR primers for quantitative PCR are the following: hs4-Fw-ChIP 5'-CCATGGGACTGAAACTCAGGGAACCAGAAC-3'; hs4-Rev-ChIP5'-CTCTGTGACTCGTCCTTAGC-3'; hs3b-Fw-ChIP 5'-TGGTTTGGGCCACCTGTGCTGAG-3’; hs3b-Rev-ChIP 5'-GGGTAGGGCAGGGATGTT CACAT-3'; hs3a-Fw-ChIP 5'-GGGTAGGGCAGGGATGCTCACAT-3'; hs3a-Rev-ChIP 5'-GCTCTGGTTTGGGGCACCTGTGC-3'; hs1,2-Fw-ChIP 5'-AGCATACACTGGGACTGG-3'; hs1,2-Fw-ChIP 5'-CTCTCACTTCCCTGGGGTGTT-3'. ChIP experiments were done with HDAC1 (ab7028, Abcam) specific antibodies. (C) Influence of SAHA on in vitro B-cell growth, CSR and Ig secretion. Proliferation (six replicates) was evaluated with the MTS assay after 3 days stimulation with LPS (5 µg/ml) ± IL-4 (20 ng/ml) in the presence of 2µM and 200 nM SAHA. Results (mean ± SEM of 4 experiments) are reported as % of variations as compared to stimulated cells without SAHA (Mann-Whitney U-test for significance). IgG3 CSR (LPS stimulation) and IgG1 CSR (LPS + IL4 stimulation) were evaluated by flow cytometry. Results are reported as mean ± SEM of 4 and 5 experiments for IgG3 and IgG1, respectively (Mann-Whitney U-test for significance). In vitro Ig secretion was evaluated at day 4 by specific ELISAs. Results are reported as mean ± SEM of 4 and 5 experiments for IgG3 and IgG1, respectively (Mann-Whitney U-test for significance). (D) Influence of SAHA on 3’RR eRNAs. Sense (in black) and antisense (in grey) transcription in two-day LPS (5µg/ml) ± SAHA (200 nM) stimulated B-cell splenocytes of wt mice. One representative experiment out of two (pooled cells from three mice per group) is reported. The locations of the various 3’RR enhancer elements are reported. (E) Influence of SAHA on IgH locus transcription. IgM and IgG1 sense (in black) and antisense (in grey) transcription in LPS (5µg/ml) ± SAHA (200 nM) stimulated B-cell splenocytes of wt mice. Same samples as in D.
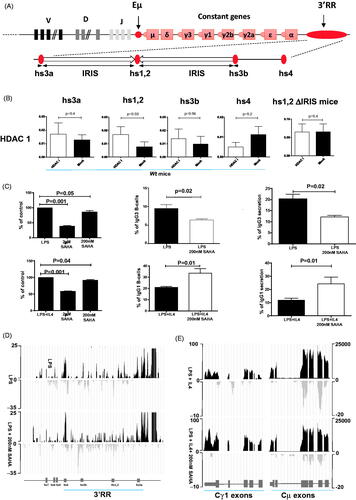
Figure 2. HDAC, HDACi and mature B-cell lymphomas. (A) Effect of SAHA on in vitro proliferation of mature B-cell lymphomas. Freshly isolated B-cell mature B220+CD19+IgM+IgD+ lymphomas from i Myc Eμ, i Myc Cμ and i Myc Cα; mice [2] were used. Each line represents one B-cell lymphoma. Each point represents the % of proliferation in response to LPS with or without 200nM SAHA (14 different mouse B-cell lymphomas). Each point is the mean of six replicates. B-cell lymphoma proliferation was evaluated with the MTS assay The first part of each graph shows the effect of LPS on the B-cell lymphoma proliferation Only B-cells lymphomas with a higher proliferation in response to LPS were investigated for SAHA treatment to withdrawn lymphomas unable to survey during the experimental conditions. (B) hs1,2 HDAC1 binding on freshly isolated mouse mature B-cell lymphomas. hs1,2 HDAC1 binding (mean ± SEM of 10 experiments) was analyzed by ChIP on freshly isolated mouse mature B-cell lymphomas (significance with the Wilcoxon matched paired test) from IgH-KI-c-myc mice. (C) 3’RR enhancer CBP binding on freshly isolated mouse mature B-cell lymphomas. CBP ChIP experiments were performed on freshly isolated B-cell lymphomas from IgH-KI-c-myc mice. Mean ± SEM of 4 experiments. Significance with the student-t-test for paired data. ChIP experiments were done with CBP (ab2832) specific antibodies
![Figure 2. HDAC, HDACi and mature B-cell lymphomas. (A) Effect of SAHA on in vitro proliferation of mature B-cell lymphomas. Freshly isolated B-cell mature B220+CD19+IgM+IgD+ lymphomas from i Myc Eμ, i Myc Cμ and i Myc Cα; mice [2] were used. Each line represents one B-cell lymphoma. Each point represents the % of proliferation in response to LPS with or without 200nM SAHA (14 different mouse B-cell lymphomas). Each point is the mean of six replicates. B-cell lymphoma proliferation was evaluated with the MTS assay The first part of each graph shows the effect of LPS on the B-cell lymphoma proliferation Only B-cells lymphomas with a higher proliferation in response to LPS were investigated for SAHA treatment to withdrawn lymphomas unable to survey during the experimental conditions. (B) hs1,2 HDAC1 binding on freshly isolated mouse mature B-cell lymphomas. hs1,2 HDAC1 binding (mean ± SEM of 10 experiments) was analyzed by ChIP on freshly isolated mouse mature B-cell lymphomas (significance with the Wilcoxon matched paired test) from IgH-KI-c-myc mice. (C) 3’RR enhancer CBP binding on freshly isolated mouse mature B-cell lymphomas. CBP ChIP experiments were performed on freshly isolated B-cell lymphomas from IgH-KI-c-myc mice. Mean ± SEM of 4 experiments. Significance with the student-t-test for paired data. ChIP experiments were done with CBP (ab2832) specific antibodies](/cms/asset/30beb2f8-48f8-41e3-98a0-f0f173698ecb/ilal_a_1961239_f0002_b.jpg)
We observed that in LPS-activated mature B-cell splenocytes HDAC1 was recruited to the hs1,2 element of the 3’RR. Evolution maintained the unique 3’RR palindromic arrangement in mammals suggesting that it is functionally significant [Citation10]. Deconstructing the palindromic IgH 3’RR in ΔIRIS mice strongly impacts its function [Citation4]. In agreement with this result we report that HDAC1 is not efficiently recruited to the hs1,2 enhancer in LPS-stimulated ΔIRIS B-splenocytes. Histone acetylation has been associated with key remodeling events of the IgH locus including CSR [Citation11]. The HDACi SAHA decreased in vitro B-cell growth in response to various stimulatory conditions. In contrast, SAHA decreased CSR toward IgG3 and stimulated CSR toward IgG1. The effect of SAHA on Ig production (stimulation for IgG1 and inhibition for IgG3) paralleled its effect on CSR. This result differs markedly from previously reported results with primary spleen B-cells from MRL-lpr mice (a mouse strain prone to develop an autoimmune disease resembling systemic lupus erythematosus) [Citation8]. RNAseq analysis of IgH locus transcription in wt B-cells in response to LPS revealed no evident effect of SAHA on 3’RR eRNAs suggesting no direct effect on 3’RR activation. The effect of SAHA on CSR and Ig production was thus not through a direct effect on 3’RR activation but through another mechanism (such as isotype-dependent acetylation/deacetylation of switch regions) that remains to be determined. Our results indicated that HDC1 does not bind to the hs1,2 enhancer element in murine mature B-cell lymphoma; a major difference compared to stimulated normal mature B-cells. Another major difference, previously reported with the human Raji Burkitt’s cell line [Citation12], was the binding of HAT CBP to hs3a/hs3b enhancers that bound the 3’RR palindrome indicating that the HAT/HDAC pathway is not identically regulated in normal mature B-cells and mature B-cell lymphomas. Furthermore if mature B-cell growth was consistently down regulated in vitro by SAHA, this was not the case in mature B-cell lymphomas where SAHA sometimes had no effect or a decreased/stimulatory effect without evident links to a B-cell lymphoma phenotype. This effect is consistent with the fact that despite similar primom movens (c-myc insertion in the IgH locus) mature B-cell lymphomas arise with different kinetics, KI67 indices and locations due to the numerous different oncogenic hits favoring lymphoma emergence [Citation2]. Our results clearly indicated that even though SAHA affects normal mature B-cell growth [Citation13], this effect is not consistently found in mature B-cell lymphomas and that trying to use HDACi to down regulate 3’RR activation in order to down regulate its effect on oncogene transcription (c-myc in our animal models) is utopic. Translocations in B-cell lymphomas undoubtedly induce epigenetic changes [Citation14] and epigenetic drugs targeting histone acetylation (HDACi) are already used to treat several lymphoid malignancies [Citation15]. The precise mechanism underlining their beneficial use remains to be elucidated but is clearly not mediated by direct action on IgH 3’RR enhancers. As the HAT CBP, rather than HDAC1, was recruited to the 3'RR in mature B-cell lymphomas but not normal mature B-cells, it would be interesting to see whether targeting CBP would be active against B-cell lymphomas. It is possible that recruitment of CBP, instead of HDAC1, causes the intrinsic resistance to HDAC inhibitors in some types of B-cell lymphomas.
In this study only mature splenic B220+CD19+IgM+IgD+ wt B-cells were specifically considered because 3’RR is the major driver of CSR and Ig synthesis. It is also why we explored HDAC binding and HDACi effects only in mature B-cell lymphomas (B220+IgM+IgD+). It is evident that similar studies on the whole spectrum of B-cell subsets (from pro-B cells to plasmocytes) and B-cell lymphomas would be of interest. Finally, despite wide functional/structural similarities between mouse and human 3’RR [Citation10], our results cannot be directly translated into human counterparts requiring further studies to clarify this point.
Author contributions
Y.D designed research and obtained financial grants. N.G., M.F., and H.I. performed research. M.F, S.LN., J.CM., J.P. and Y.D. analyzed transcriptomic data. N.G., M.F., S.LN., J.P., J.CM. and Y.D. wrote the paper.
Acknowledgments
Authors are “Equipe Labellisée LIGUE 2018”. This work was in part supported by ANR (projet EpiSwitch-3’RR 2016). N.G. and H.I were supported by a grant from ANR (projet EpiSwitch-3’RR 2016). M.F. is supported by University of Limoges and “Région Nouvelle Aquitaine”. We thank the animal and bioinformatics facilities of Limoges University (BISCEm, France) and the Nice/Sophia Antipolis microarray facility (France) for RNAseq experiments.
Disclosure statement
The authors declare no conflict of interest.
Additional information
Funding
References
- Oudinet C, Braikia FZ, Dauba A, et al. Mechanism and regulation of class switch recombination by IgH transcriptional control elements. Adv Immunol. 2020;147:89–137.
- Ghazzaui N, Issaoui H, Ferrad M, et al. Eμ and 3'RR transcriptional enhancers of the IgH locus cooperate to promote c-myc-induced mature B-cell lymphomas. Blood Adv. 2020;4(1):28–39.
- Saintamand A, Saad F, Denizot Y. 3'RR targeting in lymphomagenesis: a promising strategy? Cell Cycle. 2015;14(6):789–790.
- Saintamand A, Vincent-Fabert C, Garot A, et al. Deciphering the importance of the palindromic architecture of the immunoglobulin heavy-chain 3' regulatory region. Nat Commun. 2016;7:10730.
- Le Noir S, Boyer F, Lecardeur S, et al. Functional anatomy of the immunoglobulin heavy chain 3' super-enhancer needs not only core enhancer elements but also their unique DNA context. Nucleic Acids Res. 2017;45(10):5829–5837.
- Saintamand A, Rouaud P, Saad F, et al. Elucidation of IgH 3' region regulatory role during class switch recombination via germline deletion. Nat Commun. 2015;6:7084.
- Saintamand A, Vincent-Fabert C, Marquet M, et al. Eµ and 3'RR IgH enhancers show hierarchic unilateral dependence in mature B-cells. Sci Rep. 2017;7(1):442.
- Lu ZP, Ju ZL, Shi GY, et al. Histone deacetylase inhibitor trichostatin a reduces anti-DNA autoantibody production and represses IgH gene transcription. Biochem Biophys Res Commun. 2005;330(1):204–209.
- Ferrad M, Ghazzaui N, Issaoui H, et al. Mouse models of c-myc deregulation driven by IgH locus enhancers as models of B-cell lymphomagenesis. Front Immunol. 2020;11:1564.
- D'Addabbo P, Scascitelli M, Giambra V, et al. Position and sequence conservation in amniota of polymorphic enhancer HS1.2 within the palindrome of IgH 3'Regulatory Region. BMC Evol Biol. 2011;11:71.
- Nambu Y, Sugai M, Gonda H, et al. Transcription-coupled events associating with immunoglobulin switch region chromatin. Science. 2003;302(5653):2137–2140.
- Hu HM, Kanda K, Zhang L, et al. Activation of the c-myc P1 promoter in Burkitt's lymphoma by the hs3 immunoglobulin heavy-chain gene enhancer . Leukemia. 2007;21(4):747–753.
- Waibel M, Christiansen AJ, Hibbs ML, et al. Manipulation of B-cell responses with histone deacetylase inhibitors. Nat Comm. 2015;6:6838.
- Lindström MS, Wiman KG. Role of genetic and epigenetic changes in burkitt lymphoma. Semin Cancer Biol. 2002;12(5):381–387.
- Sborov DW, Canella A, Hade EM, et al. A phase 1 trial of the HDAC inhibitor AR-42 in patients with multiple myeloma and T- and B-cell lymphomas. Leuk Lymphoma. 2017;58(10):1218–2310.