
Abstract
Real-world data are lacking to identify patients with secondary immunodeficiency (SID) who may benefit most from anti-infective interventions. This retrospective analysis used the IQVIA PharMetrics® Plus database to assess baseline characteristics associated with risk of severe infections post-SID diagnosis in patients with hematological malignancies. In 4066 patients included, the mean number of any and severe infections per patient in the one-year pre-SID diagnosis period was 9.5 and 0.7, respectively. Post-SID diagnosis, the mean annualized number of any and severe infections was 19.1 and 1.5, respectively. Receiver operating characteristic curve analysis identified a threshold (cutoff) of three bacterial infections at baseline as optimally predictive of severe infections post-SID diagnosis. Multivariate analysis indicated that hospitalizations, infections (≥3), or antibiotic use pre-SID diagnosis were predictive of severe infections post-SID diagnosis. Evaluation of these risk factors could inform clinical decisions regarding which patients may benefit from prophylactic anti-infective treatment, including immunoglobulin replacement if warranted.
Introduction
Secondary immunodeficiency (SID) refers to the immune system being compromised by nonhereditary (acquired) factors including certain hematological malignancies such as chronic lymphocytic leukemia (CLL), multiple myeloma (MM) and non-Hodgkin lymphoma (NHL), B-cell depleting therapies, radiation, protein-losing conditions, trauma, malnutrition and age [Citation1,Citation2]. While the presentation of SID is heterogeneous, SID is often diagnosed by the occurrence of recurrent, prolonged, unusual or severe infections; low immunoglobulin G (IgG) levels (hypogammaglobulinemia) and poor vaccine response [Citation1,Citation2].
CLL affects 1.34 (95% confidence interval [CI]: 1.21–1.54) people per 100,000 globally, MM 2.01 (95% CI: 1.77–2.23) per 100,000 and NHL 5.91 (95% CI: 5.39–6.45) per 100,000 [Citation3]. Hypogammaglobulinemia is a predictor of shorter overall survival in CLL [Citation4], and infections are the leading cause of death in patients with CLL, MM and NHL who develop SID, highlighting the serious consequences of SID [Citation5,Citation6]. Infections related to SID may account for up to 50% of deaths of patients with CLL [Citation7], and up to 22% and 33% of deaths of patients with MM and NHL, respectively [Citation6,Citation8]. Additionally, infections in the 12 months following diagnosis of CLL have been linked to shorter overall survival [Citation9]. Risk factors for developing infections in patients with CLL include: older age, male sex, low IgA levels, high B-2-microglobulin levels, Binet stage B or C, multiple prior chemotherapeutic treatments, poor response for underlying disease, multiple relapses, and type of anti-neoplastic treatment (e.g. purine analogs, alkylating agents, monoclonal antibodies, chemotherapy, and immune-suppressive drugs, including cumulative steroid use) [Citation2,Citation10–12]. In patients with MM, the risk of infection is reported to be highest in the 3–4 months following diagnosis [Citation13]. Infection risk factors for patients with MM include: age, prior infections, immunodeficiency related to B-cell dysfunction, type and intensity of treatment, hypogammaglobulinemia and poor response to vaccines [Citation8,Citation13]. In patients with NHL, risk factors for developing infections include: treatment with combination chemotherapy or with rituximab, and hypogammaglobulinemia [Citation6,Citation14].
Existing guidelines and treatment algorithms have partly been driven by knowledge of identified risk factors for severe infections [Citation15–17], yet there is wide variation in global practice [Citation18–21]. Arguably, quantification of known risk factors such as the relationship between the number of prior infections and heightened risk of subsequent severe infections, could guide more targeted translation of evidence to practice, including need for interventions [Citation19,Citation22].
This real-world analysis aimed to: (1) characterize patients with hematological malignancies with diagnosed SID, in terms of known risk factors and downstream outcomes, primarily severe infections; (2) identify independent predictors of the risk of severe infections; and (3) to quantify risk of severe infections post-SID diagnosis at varying levels of infections pre-SID diagnosis, to identify patients that would most benefit from treatment to prevent infections.
Methods
A retrospective database analysis was conducted among patients in the US from the IQVIA PharMetrics® Plus Database with data from January 2011 to September 2018 (Figure S1). The aggregated IQVIA PharMetrics® Plus claims database comprises adjudicated claims for more than 150 million unique patients across the United States. The data are sourced directly from health insurance companies and the population is comprised of commercially managed enrollees. Standard fields include: inpatient and outpatient diagnosis codes, procedures, retail and mail order prescription records, administered drugs, inpatient stays, and associated costs, demographic variables and start and stop dates of health-plan enrollment. Due to the broad reach of the data, records in the PharMetrics Plus database are representative of the national, commercially insured population in terms of age and gender. All data are HIPAA compliant to protect patient privacy.
Adult patients with an incident (new) SID diagnosis were identified using the following inclusion criteria: a diagnosis for SID (ICD-9-CM 279.0x immunodeficiency with predominantly antibody defects [excluding 279.04 which indicates congenital hypogammaglobulinemia, i.e., not secondary immunodeficiency by definition], 279.3 unspecified immunity deficiency and corresponding ICD-10-CM codes: D80.x [excluding D80.0], D84.9); ≥12 months continuous health plan enrollment (CE) pre-SID diagnosis (baseline); minimum of 3 months CE post-SID diagnosis (variable follow-up); CLL, MM or NHL diagnosis in the 12 months pre-SID diagnosis; and all of the above in the absence of any immunoglobulin replacement therapy (IgRT) in the 12 months immediately preceding the incident SID diagnosis. Patients were followed for a minimum of 3 months (variable follow-up), which ended at the end of CE, the end of study (September 30, 2018) or the day before use of any Ig therapy. The end of CE could have been due to death, which was not directly observable in this dataset if it occurred outside the healthcare setting. Any infection was counted at the unique diagnosis-date level, using infection diagnosis code level in any position (outpatient or inpatient), and adjusting for identical diagnosis codes on the same day; the full list of diagnosis codes used for infections can be found in Table S1. Severe infections were defined by either intravenous (IV) antibiotics or IV antivirals in an outpatient setting, or hospitalization with any infection diagnosis codes. Diagnosis codes for a bacterial, viral, fungal, parasitic, other or unspecified causal pathogen infection were considered.
Pre-SID diagnosis
Demographic and clinical characteristics were assessed over the 12-month baseline period (pre-SID diagnosis). The patient population was characterized at baseline in terms of age, sex, underlying malignancy, cancer treatment, comorbidities, frequency of severe infections and any infections by type of infection and anatomic site, prior antibiotic or antiviral use (separately by IV or oral), testing serum Ig levels, and hospitalizations (overall and for infections). Comorbid conditions were characterized in terms of their association with baseline (pre-SID diagnosis) infections (<3 versus ≥3 infections).
Post-SID diagnosis
The following outcomes were assessed during the post-SID diagnosis follow-up period: (1) use of antibiotics/antivirals, (2) frequency of any infection, (3) occurrence and number of severe infections and (4) where specified, characterization of pathogen type and anatomical location of infection. Outcomes over the post-SID diagnosis period were annualized where applicable.
Descriptive analyses
Descriptive statistics were generated for all relevant study measures: frequency distributions, univariate and cross-tabulations for categorical variables and mean and standard deviation (SD) for continuous variables. Analyses were conducted using SAS® Release 9.3 (SAS Institute Inc., Cary, NC, USA).
Multivariate analyses: Cox proportional hazard model (PHM)
A multivariate Cox PHM was developed to evaluate patient characteristics associated with risk of severe infection. Results were presented in terms of adjusted hazard ratios and 95% CI. A stepwise model-building approach was utilized (p < 0.10 for inclusion and retention) with the following variables forced: (1) pre-SID diagnosis underlying condition (mutually exclusive), (2) pre-SID diagnosis use of B-cell targeting therapies, (3) pre-SID diagnosis number of ‘any infection’, (4) use of any antibiotic over the variable follow-up period, and (5) use of any antiviral over the variable follow-up period. Variables 4 and 5 were assessed until first severe infection or end of variable follow-up. Collinearity among the variables of interest was evaluated during model development.
Predictive analytics
Receiver operating characteristics (ROC) analysis: number of pre-diagnosis infections
To identify the specific threshold for the number of pre-SID diagnosis infections that would offer the best tradeoff between sensitivity and specificity in predicting risk of a severe post-SID diagnosis infection, a time-dependent ROC analysis was conducted. This analysis incorporated all distinct event times and selection of the ROC curve with the largest area under the curve of all the distinct event times as a whole [Citation23,Citation24]. This identified threshold was used as a categorical variable in the Cox PHM on risk of severe infection.
Sensitivity to false-positive risk ratio analysis: baseline comorbidities and anatomic sites
We also evaluated the predictive value of baseline comorbid conditions in terms of sensitivity versus false positive rate ratios for identifying risk of ≥4 severe infections post-SID diagnosis [Citation25]. We compared the proportion of patients with specific baseline comorbid conditions among those with ≥4 severe infections (sensitivity) versus those with <4 severe infections (false-positive rate) in the post-SID diagnosis period. The comorbidities were ranked by discrimination in terms of the ratio of sensitivity to false-positive risk (also known as the positive likelihood ratio) in identifying those at risk of ≥4 severe infections in the post-SID diagnosis period; higher ratios indicate better discriminating ability of that comorbidity in this case [Citation26–28].
Results
Of 155,255 patients with a SID diagnosis identified, 4066 patients met the inclusion criteria. The mean age of the cohort was 56.9 years and 56.0% (n = 2276) were male (Table S2). Among patients, 17.1% (n = 695), 25.0% (n = 1017), and 44.8% (n = 1823) were diagnosed with CLL, MM or NHL alone, respectively; 13.0% (n = 531) had >1 of these malignancies (e.g. concomitant CLL and NHL diagnoses). In total, 3074 (75.6%) patients were undergoing cancer treatment, of whom, 800 (19.7%) were receiving B-cell targeting therapies. In total, 3536 (87.0%) patients received antibiotics of any type (oral antibiotics: 3487 [85.8%]; IV antibiotics: 1101 [27.1%]). In addition, 1875 (46.1%) patients received oral antivirals and one patient (0.02%) received IV antivirals. Overall, 2365 (58.2%) patients had previously been hospitalized.
Post-SID diagnosis, patients were followed for a mean (SD) of 20.2 (17.38) months (615.1 [528.5] days). Antibiotics or antivirals were administered to 87.6% (n = 3560) and 54.8% (n = 2227) of patients, respectively, during this follow-up period.
Occurrence of infections
Pre-SID diagnosis
The annualized mean (SD) number of ‘any infection’ in the 12-month pre-SID diagnosis period was 9.5 (18.6) (); 79.5% (n = 3231) of patients experienced ≥1 ‘any infection’ during this period (). In total, 56.3% (n = 2290) of patients experienced ≥3 infections in this pre-SID diagnosis period, approximately a third (31.2%) experienced ≥8 infections, and 25.9% experienced ≥10 infections (). The annualized mean (SD) number of ‘any infection’ by malignancy subtype was 6.4 (12.9) for CLL, 7.9 (15.4) for MM and 11.4 (22.3) for NHL (Table S3). The most common anatomic sites of ‘any infection’ were the upper respiratory tract (40.4%; n = 1641) and lower respiratory tract (38.2%; n = 1553).
Figure 1. Number of infections (any and severe) in the 12-month pre-SID diagnosis period (mean) and the post-SID period (mean annualized). SD: standard deviation; SID: secondary immunodeficiency.
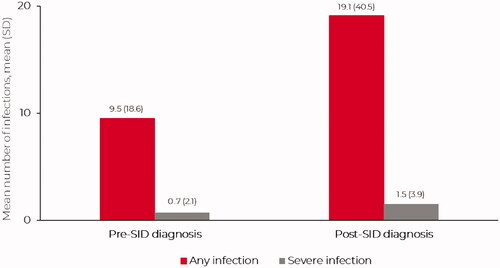
Figure 2. Percentage of patients who experienced a given number of any infections (A) or severe infections (B) in the 12-month pre-SID diagnosis period (absolute numbers) and post-SID periods (annualized numbers). *Absolute numbers of infections in the pre-SID period; annualized number of infections in the post-SID period (hence, a patient can have an annualized number of infections >0 and <1 infection during this period). SID: secondary immunodeficiency.
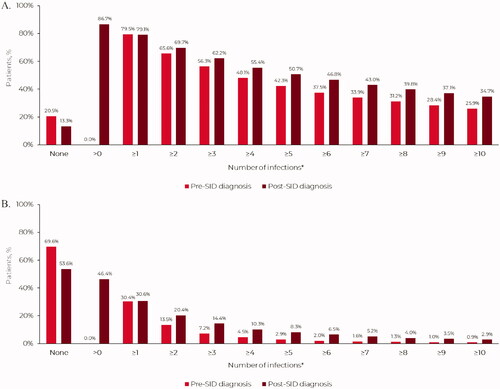
The annualized mean (SD) number of severe infections in the 12-month pre-SID diagnosis period was 0.7 (2.1) (); 30.4% (n = 1236) of patients experienced severe infections during this period, with over 5.0% (7.2%) experiencing ≥3 severe infections (). The annualized mean (SD) number of severe infections by malignancy subtype was 0.4 (1.2) for CLL, 0.8 (2.9) for MM and 0.9 (2.1) for NHL (Table S3).
Comparing patients with <3 versus ≥3 infections in the pre-SID diagnosis period, bronchitis, sinusitis, COPD and renal failure/dialysis were the most common comorbid conditions across both groups, yet significantly more prevalent among the latter group. In contrast, HIV and hepatitis, although less common overall, were most discriminating between those with ≥3 versus <3 infections (Figure S2).
Post-SID diagnosis
The annualized mean (SD) number of ‘any infection’ in the post-SID diagnosis period was 19.1 (40.5) (). The annualized mean (SD) number of ‘any infection’ by malignancy subtype was 13.1 (28.7) for CLL, 16.1 (34.9) for MM and 22.2 (45.4) for NHL (Table S3). The annualized mean (SD) number of severe infections in the post-SID diagnosis period was 1.5 (3.9) (). The annualized mean (SD) number of severe infection by malignancy subtype was 0.9 (2.6) for CLL, 1.7 (4.5) for MM and 1.6 (4.1) for NHL (Table S3). In total, 46.4% (n = 1888) of patients experienced 10,208 severe infections in the post-SID diagnosis period, with 15.4% of patients experiencing ≥3 severe infections over the variable follow-up period ().
Of 10,208 severe infections, 34.0% (n = 3468) were bacterial, 11.6% (n = 1183) were viral and 6.3% (n = 641) were fungal; 48.2% (n = 4916) had no causal pathogen specified. Where specified, the anatomic sites of severe infections were bacteremia/septicemia 27.5% (n = 2808), lower respiratory 26.2% (n = 2679), skin/subcutaneous tissue 7.6% (n = 772), gastrointestinal (GI) 4.8% (n = 485), urinary tract infection (UTI) 4.8% (n = 485) and upper respiratory 3.9% (n = 396) (Figure S3).
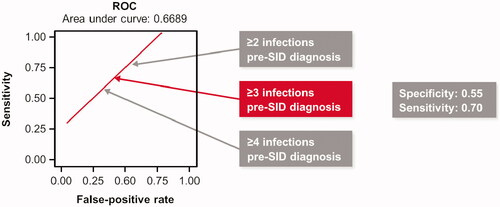
Figure 3. A ROC curve for infections pre-SID diagnosis as a predictor of risk of severe infections post-SID diagnosis. ROC: receiver operating characteristic; SID: secondary immunodeficiency.
When comparing anatomic sites of severe (n = 10,208) versus non-severe (n = 38,862) infections, a similar proportion were observed in the lower airways (26.2% and 24.5%, respectively), while there were more non-severe upper respiratory infections (17.6%) than severe (3.9%). As expected, bacteremia/septicemia was generally considered severe, accounting for only 7.5% of non-severe infections, versus 27.5% of severe infections (Figure S4).
Predictive analytics: risk of severe infections post-SID diagnosis
ROC analysis: number of prior infections
A ROC curve analysis was performed to optimize sensitivity versus false-positive rate, in identifying those at risk of severe infections post-SID diagnosis in terms of number of all infections pre-SID diagnosis (). The ROC identified a cutoff point of three infections (any severity) pre-SID diagnosis as a potential optimal trigger for treatment. In the multivariate Cox PHM analysis, significant (p < 0.0001) predictors for risk of severe infections post-SID diagnosis were a prior history (≥3) of infections (any infection), prior hospitalizations or antibiotic use prior to SID-diagnosis ().
Table 1. Multivariate Cox proportional hazards model evaluating characteristics associated with risk of severe infections post-SID diagnosis.
Sensitivity versus false-positive rates in identifying risk of severe infections
We also evaluated sensitivity versus false-positive rates in identifying risk of severe infections post-SID diagnosis by baseline comorbidity. We compared the top 10 baseline comorbid conditions with a significant (p < 0.0001) difference between those with <4 versus ≥4 severe infections post-SID diagnosis and sorted these in terms of their predictive value: relative sensitivity versus false-positive rate in identifying risk of post-SID diagnosis severe infections (Figure S5). HIV, paralysis and epilepsy/seizure disorder were the comorbidities with the greatest predictive positive likelihood ratios (sensitivities divided by false-positive rates), although the absolute frequencies of these comorbidities were quite low. By contrast, Figure S5 indicates that renal failure/dialysis and congestive heart failure were each characterized by both high absolute baseline prevalence and a relatively high positive likelihood ratio. There was also a high baseline prevalence of neutropenia, combined with a relatively high sensitivity (48.1% versus 29.0% of patients with neutropenia had ≥4 versus <4 post-SID diagnosis infections, respectively; risk ratio: 1.66; p < 0.0001).
Discussion
To our knowledge, this is the largest real-world study in patients with hematological malignancies and SID. In keeping with the literature, we found that infections are extremely common in patients with hematological malignancies, both before and after SID diagnosis, in the absence of/prior to any IgRT, and even with standard-of-care antibiotic use. We identified patients at greatest risk of severe infections and, by implication, likely to benefit most from interventions such as IgRT.
In the literature, several risk factors for serious infections in hematological malignancies have been identified: age [Citation8,Citation11], multiple prior chemotherapeutic treatments, B-cell depleting therapies, such as anti-CD20 monoclonal antibodies (e.g. rituximab [Citation14,Citation19,Citation29]) and CD-19 chimeric antigen receptor T-cell (CAR T) therapy [Citation30], other anti-neoplastic agents (i.e. purine analogs, alkylating agents, idelalisib [Citation10,Citation31]), poor cancer treatment response, multiple relapses and steroids [Citation2]. Partly reflecting this evidence, global prerequisite guidelines for treatment with IgRT include hypogammaglobulinemia, recurrent infections, severe infections, progressive disease and/or failure of antibiotic or pneumococcal polysaccharide and polypeptide antigen immunization [Citation7,Citation15,Citation17,Citation32–34].
However, there is wide variation in global practice [Citation18–20], potentially due to variation in regional guidelines [Citation15–17], divergence from the relevant guidelines [Citation18–21] or lack of clarity around definitions of what constitutes recurrent infections and response to prophylactic antibiotics [Citation15,Citation17,Citation22,Citation34–36]. While most regional and national practice guidelines include quantification of Ig levels (< 4 g/L or < 5 g/L) as evidence of hypogammaglobulinemia [Citation15–17,Citation35,Citation37], until recently, there has been no consensus on what number of prior infections define recurrent infections to consider IgRT initiation [Citation15–17,Citation36]. A European Expert Consensus aimed to unify clinical practice, producing six statements to clarify the criteria for initiating IgRT [Citation38]. They suggest IgRT should be considered if: IgG levels <4 g/L, and the patient has received appropriate anti-infective therapy, has a single severe infection or recurrent or persistent infections and if test immunization has failed. IgRT could still be considered for patients with mild hypogammaglobulinemia (4–6 g/L IgG) or at least a twofold rise in specific antibody levels after test immunization.
Currently, some countries, notably France and Germany, go beyond regional guidelines by initiating IgRT in over half of patients in the absence of infections and/or antibiotic use [Citation18–20], while in others, such as the United Kingdom, almost 90% of patients have evidence of antibiotic use prior to IgRT initiation [Citation37]. In the United States, there has been vigorous discussion regarding the advantages and disadvantages of antibiotic use and resistance [Citation39,Citation40]. The evidence in this current study of US practice suggests that almost 90% of patients with hematological cancers included received antibiotics; 80% had at least one infection, and over a quarter received IV antibiotics prior to diagnosis of SID or any evidence of IgRT utilization. The European Expert Consensus on treating patients with hematological malignancies and SID offers somewhat improved clarity and guidance on when to use IgRT [Citation38]. However, with reported discrepancies in regional and national guidelines, and divergence from national guidelines, it has been suggested that future studies should identify specific criteria regarding when IgRT should be utilized [Citation41].
Our study is the first to utilize predictive analytics to identify a specific threshold for the number of prior infections that increases the risk of infection-related hospitalization and/or use of IV antibiotics (the definition of severe infection used). A history (≥3) of infections within the 12-month pre-diagnosis timeframe was identified as a threshold for considering IgRT, balancing the sensitivity to downstream risk of severe infections with misdiagnosis of SID and associated time and resource costs. Furthermore, by comparing baseline comorbid conditions, we found that HIV, paralysis, and epilepsy (possibly related to drug-induced SID) [Citation42,Citation43], though rare, were the most predictive in terms of discriminating risk of ≥4 severe infections in the follow-up period. Other comorbid conditions, including renal failure/dialysis and congestive heart failure, were more prevalent but slightly less discriminating. In addition, prior hospitalizations, antibiotic use, COPD, hypertension, and smoking history were also identified as significant risk factors. Finally, regarding CD-20 or CD-52 targeted monoclonal antibody-related risk, our study found that rituximab in particular was associated with an elevated risk of SID-related infections. These data suggest that patients susceptible to SID with these comorbidities or receiving these treatments should be carefully monitored, and their care optimized, in light of their higher risk of SID-related severe infections. We believe our findings constitute actionable insights into which patients would probably benefit most from consideration of early IgRT, especially once a diagnosis of SID has been made, and we hope this will inform future guidelines as well as practice.
The number of infections reported prior to any IgRT in this US study are similar to some contemporary studies; for example, Spadaro et al. found in the year before IgRT, patients in Italy with NHL/CLL and hypogammaglobulinemia experienced a mean number of infectious events equal to 11.1 ± 3.0 [Citation45]. In contrast, Benbrahim et al, reported IgRT use in France in patients with as few as 2.2 infections on average [Citation45], and Reiser et al reported similar findings in Germany [Citation20], indicative of wide variations in global IgRT use [Citation35]. Similar to Spadaro et al, the most frequent infections were in the upper respiratory tract (49.4% of all infections, n = 77), lower respiratory tract (41.7%, n = 65) or gastrointestinal tract (9.0%, n = 14) [Citation44].
A considerable number of patients in our study experienced ≥3 infections (56.3%), with approximately one-third having >8 and approximately one quarter having >10 infections or ≥1 severe infection (35.2%) in the 12 months prior to SID diagnosis. This suggests an inordinate delay in terms of cumulative burden of infections, including serious infections, and could be mitigated by evidence-based consideration of risk factors, including those highlighted in this study, and associated optimization of therapeutic options.
In our study, a substantial number of infections were still seen in patients following SID diagnosis, yet preceding IgRT, suggesting improvements could be made to treatment strategies for patients diagnosed with hematological malignancies and SID (87.6% of patients were administered antibiotics, while 81.0% of patients still experienced non-severe infections and 46.4% of patients experienced severe infections). This highlights the need for individualized assessment to better identify patients at particular risk of infections based on their medical history, as soon as a diagnosis of SID occurs, if not earlier, and consideration of IgRT, instead of or combined with antibiotics. In terms of the type of infections experienced, bacteremia/septicemia was the most common severe infection, followed by severe lower respiratory tract infections. The prevalence of bacteremia/septicemia in the major infection category is not necessarily surprising as standard of care is to treat promptly with IV antibiotics to prevent sepsis, therefore fitting the severe infection definition used in this study. However, we considered the high frequency of severe lower respiratory tract infections to be unusual and this may suggest that patients with SID may experience infections with more complications/greater severity than experienced by otherwise healthy individuals.
One limitation of this study was that the infection rates were based on administrative claims reported in a US healthcare system commercially insured database and may not necessarily be representative of experience in other countries, for example, those with more liberal use of IgRT [Citation20,Citation45]. An inherent limitation of the study is the use of ICD-9/10 codes to classify infection in both cancer and noncancer populations. Due to the variable performance of this method of classification, not all true cases of infection (as defined using clinical/surveillance case definitions) are reflected in the administrative coding data. Another limitation was that Ig levels were not available for all patients, and unobserved Ig levels may introduce unmeasured confounding in terms of impact of severity of underlying baseline SID on subsequent events including mortality. This unobserved level of severity may also have a cumulative, lagged effect; however, any time varying effect of continuing SID severity on downstream outcomes was not captured, since our study was designed to characterize risk factors at the point of incident SID diagnosis and implications for post-SID practice. The need to establish an incident SID diagnosis based on a clean 12-month look-back period and a minimum of 3 months post-SID diagnosis data may also have excluded some patients with shorter survival immediately prior to or after SID diagnosis. An additional limitation was that during the 12-month pre-SID diagnosis period, the line of therapy or duration of cancer treatments and immunosuppressive drugs was not specifically assessed (given the limited baseline period). Finally, the rate of severe fungal infections may have been underestimated and antifungal use was not measured.
One key strength of this study is that it is the largest study in hematological cancer with SID as we identified 155,255 patients assessed with a diagnosis of SID, of whom 4066 patients met the inclusion criteria. Furthermore, as infection data were collected over a mean two-year period and the study evaluated patients beginning in the year prior to diagnosis with SID, the results are representative of those in real-world patients at risk of infection prior to Ig therapy.
Conclusion
In this large, real-world study of patients with hematological malignancies and newly diagnosed SID, infections were extremely common and importantly, a prior history of ≥3 infections was identified as a specific threshold for risk of subsequent severe infections.
GLAL-2021-0880-File009.pdf
Download PDF (741.6 KB)GLAL-2021-0880-File008.docx
Download MS Word (259.5 KB)GLAL-2021-0880-File007.docx
Download MS Word (258.5 KB)Acknowledgements
Editorial assistance was provided by Meridian HealthComms, funded by CSL Behring.
Disclosure statement
This study was funded by CSL Behring. RM and GE are employees and shareholders of CSL Behring. VD is an employee of IQVIA which received funding from CSL Behring for this study. BDS received fees from CSL Behring for advisory board activity and travel support. SJ has been a speaker and involved in advisory boards, conferences, clinical trials, DSMB or projects with CSL Behring, Shire, Takeda, Thermofisher, Swedish Orphan Biovitrum, Biotest, Binding Site, BPL, Octapharma, Sanofi, LFB, Pharming, Biocryst, Zarodex, Weatherden and UCB Pharma. MD has received consulting fees from IQVIA. DCV has received salary support (clinician-scientist, Junior 2) from Fonds de la recherche en santé du Québec and travel fees from CSL Behring and has been involved in clinical studies with Cidara Therapeutics and Janssen Pharmaceuticals; DCV has been a speaker and/or involved in advisory boards with CSL Behring, Merck Canada, Novartis Canada, Shire/Takeda, and UCB Pharma.
Data availability statement
The data that support the findings of this study are available from the corresponding author, SJ, upon reasonable request.
Additional information
Funding
References
- Patel SY, Carbone J, Jolles S. The expanding field of secondary antibody deficiency: causes, diagnosis, and management. Front Immunol. 2019;10:33.
- Chinen J, Shearer WT. Secondary immunodeficiencies, including HIV infection. J Allergy Clin Immunol. 2010;125(2 Suppl 2):S195–S203.
- IHME. Global Burden of Disease Results Tool 2019. Available from: http://ghdx.healthdata.org/gbd-results-tool.
- Andersen MA, Vojdeman FJ, Andersen MK, et al. Hypogammaglobulinemia in newly diagnosed chronic lymphocytic leukemia is a predictor of early death. Leuk Lymphoma. 2016;57(7):1592–1599.
- Nucci M, Anaissie E. Infections in patients with multiple myeloma in the era of high-dose therapy and novel agents. Clin Infect Dis. 2009;49(8):1211–1225.
- Ostrow S, Diggs CH, Sutherland J, et al. Causes of death in patients with non-Hodgkin's lymphoma. Cancer. 1981;48(3):779–782.
- Oscier D, Dearden C, Eren E, British Committee for Standards in Haematology, et al. Guidelines on the diagnosis, investigation and management of chronic lymphocytic leukaemia. Br J Haematol. 2012;159(5):541–564.
- Blimark C, Holmberg E, Mellqvist U-H, et al. Multiple myeloma and infections: a population-based study on 9253 multiple myeloma patients. Haematologica. 2015;100(1):107–113.
- Andersen MA, Niemann CU. Immune failure, infection and survival in chronic lymphocytic leukemia in Denmark. Haematologica. 2018;103(7):e330.
- Teh BW, Tam CS, Handunnetti S, et al. Infections in patients with chronic lymphocytic leukaemia: Mitigating risk in the era of targeted therapies. Blood Rev. 2018;32(6):499–507.
- Andersen MA, Eriksen CT, Brieghel C, et al. Incidence and predictors of infection among patients prior to treatment of chronic lymphocytic leukemia: a Danish nationwide cohort study. Haematologica. 2018;103(7):e300–e303.
- Rusu RA, Sîrbu D, Curşeu D, et al. Chemotherapy-related infectious complications in patients with hematologic malignancies. J Res Med Sci. 2018;23:68.
- Dumontet C, Hulin C, Dimopoulos MA, et al. A predictive model for risk of early grade ≥3 infection in patients with multiple myeloma not eligible for transplant: analysis of the FIRST trial. Leukemia. 2018;32(6):1404–1413.
- Casulo C, Maragulia J, Zelenetz AD. Incidence of hypogammaglobulinemia in patients receiving rituximab and the use of intravenous immunoglobulin for recurrent infections. Clin Lymphoma Myeloma Leuk. 2013;13(2):106–111.
- Guideline on core SmPC for human normal immunoglobulin for intravenous administration (IVIg). In: Agency EM, editor. London, 2018.
- Jolles S, Chapel H, Litzman J. When to initiate immunoglobulin replacement therapy (IGRT) in antibody deficiency: a practical approach. Clin Exp Immunol. 2017;188(3):333–341.
- Clinical guidelines for immunoglobulin use. In: (UK) DoH, editor. 2nd ed. 2011.
- Benbrahim O, Viallard J-F, Choquet S, et al. The use of octagam and gammanorm in immunodeficiency associated with hematological malignancies: a prospective study from 21 French hematology departments. Hematology. 2019;24(1):173–182.
- Barmettler S, Ong M-S, Farmer JR, et al. Association of immunoglobulin levels, infectious risk, and mortality with rituximab and hypogammaglobulinemia. JAMA Netw Open. 2018;1(7):e184169.
- Reiser M, Borte M, Huscher D, et al. Management of patients with malignancies and secondary immunodeficiencies treated with immunoglobulins in clinical practice: long-term data of the SIGNS study. Eur J Haematol. 2017;99(2):169–177.
- Legendre P, Chahwan D, Marjanovic Z, et al. Utilization of intravenous or subcutaneous immunoglobulins in secondary immune deficiency (ULTIMATE): a retrospective multicenter study. Clin Immunol. 2020;215:108419.
- Agostini C, Blau IW, Kimby E, et al. Prophylactic immunoglobulin therapy in secondary immune deficiency - an expert opinion. Expert Rev Clin Immunol. 2016;12(9):921–926.
- Hanley JA, McNeil BJ. The meaning and use of the area under a receiver operating characteristic (ROC) curve. Radiology. 1982;143(1):29–36.
- Akobeng AK. Understanding diagnostic tests 3: receiver operating characteristic curves. Acta Paediatr. 2007;96(5):644–647.
- Trevethan R. Sensitivity, Specificity, and Predictive Values: Foundations, Pliabilities, and Pitfalls in Research and Practice. Front Public Health. 2017;5:307.
- Ruddy JD, Cormack SJ, Whiteley R, et al. Modeling the risk of team sport injuries: a narrative review of different statistical approaches. Front Physiol. 2019;10:829.
- Whiteley R. Screening and likelihood ratio infographic. Br J Sports Med. 2016; 50(14):837–838.
- Kesson A. Predictive Values, Sensitivity and Specificity in Clinical Virology 2009. [18.01.2021]. Available from: http://www.virologyresearch.unsw.edu.au/virology/wp-content/uploads/2013/08/VIM09_AlisonKesson_ClinicalVirology.pdf.
- Kelesidis T, Daikos G, Boumpas D, et al. Does rituximab increase the incidence of infectious complications? A narrative review. Int J Infect Dis. 2011;15(1):e2–e16.
- Park JH, Romero FA, Taur Y, et al. Cytokine release syndrome grade as a predictive marker for infections in patients with relapsed or refractory B-Cell acute lymphoblastic leukemia treated with chimeric antigen receptor T cells. Clin Infect Dis. 2018;67(4):533–540.
- Hilal T, Gea-Banacloche JC, Leis JF. Chronic lymphocytic leukemia and infection risk in the era of targeted therapies: Linking mechanisms with infections. Blood Rev. 2018;32(5):387–399.
- Anderson D, Ali K, Blanchette V, et al. Guidelines on the use of intravenous immune globulin for hematologic conditions. Transfus Med Rev. 2007;21(2 Suppl 1):S9–S56.
- Snowden JA, Ahmedzai SH, Ashcroft J, Haemato-oncology Task Force of British Committee for Standards in Haematology and UK Myeloma Forum, et al. Guidelines for supportive care in multiple myeloma 2011. Br J Haematol. 2011;154(1):76–103.
- Criteria for the Clinical Use of Intravenous Immunoglobulin in Australia. In: (Australia) NBA, editor. 2nd ed. 2012.
- Na IK, Buckland M, Agostini C, et al. Current clinical practice and challenges in the management of secondary immunodeficiency in hematological malignancies. Eur J Haematol. 2019;102(6):447–456.
- Perez EE, Orange JS, Bonilla F, et al. Update on the use of immunoglobulin in human disease: A review of evidence. J Allergy Clin Immunol. 2017;139(3S):S1–S46.
- Edgar JDM, Richter AG, Huissoon AP, United Kingdom Primary Immunodeficiency Network (UKPIN) Immunoglobulin Decision to Treat Study Group, et al. Prescribing immunoglobulin replacement therapy for patients with non-classical and secondary antibody deficiency: an analysis of the practice of clinical immunologists in the UK and republic of Ireland. J Clin Immunol. 2018;38(2):204–213.
- Jolles S, Michallet M, Agostini C, et al. Treating secondary antibody deficiency in patients with haematological malignancy: European expert consensus. Eur J Haematol. 2021;106(4):439–449.
- Cullen M, Steven N, Billingham L, et al. Antibacterial prophylaxis after chemotherapy for solid tumors and lymphomas. N Engl J Med. 2005;353(10):988–998.
- Freifeld AG, Bow EJ, Sepkowitz KA, Infectious Diseases Society of America, et al. Clinical practice guideline for the use of antimicrobial agents in neutropenic patients with cancer: 2010 update by the infectious diseases society of America. Clin Infect Dis. 2011;52(4):e56–e93.
- Compagno N, Malipiero G, Cinetto F, et al. Immunoglobulin replacement therapy in secondary hypogammaglobulinemia. Front Immunol. 2014;5:626.
- Eom TH, Lee HS, Jang PS, et al. Valproate-induced panhypogammaglobulinemia. Neurol Sci. 2013;34(6):1003–1004.
- Ozdemir H, Sumer S, Karabagli H, et al. B cell aplasia and hypogammaglobulinemia associated with levetiracetam. Ann Saudi Med. 2018;38(1):65–68.
- Spadaro G, Pecoraro A, De Renzo A, et al. Intravenous versus subcutaneous immunoglobulin replacement in secondary hypogammaglobulinemia. Clin Immunol. 2016;166-167:103–104.
- Benbrahim O, Viallard JF, Choquet S, et al. A French observational study describing the use of human polyvalent immunoglobulins in hematological malignancy-associated secondary immunodeficiency. Eur J Haematol. 2018;101(1):48–56.