
Abstract
Many patients with lower-risk myelodysplastic syndromes (LR MDS) require long-term red blood cell (RBC) transfusions to manage anemia. The consequences of RBC transfusions in LR MDS with ring sideroblasts (LR MDS-RS) are not well known. We estimated the association between cumulative RBC dose density and clinical and patient-reported outcomes using data from the MDS-CAN registry for patients enrolled between January 2008 and December 2018. Outcomes included overall survival, hospitalization, and health-related quality of life (HRQoL). A total of 145 enrolled patients with LR MDS and RS ≥5% had a median follow-up time of 27.1 months; 45 had no transfusions during follow-up, 51 had <1 transfusion per month, and 49 had ≥1 transfusion per month. The cumulative density of RBC transfusions was associated with significantly greater mortality, hospitalization, and inferior HRQoL, suggesting that exposure to RBC transfusion may constitute a significant treatment burden in patients with LR MDS-RS.
Introduction
Myelodysplastic syndromes (MDS) are a rare group of bone marrow disorders characterized by morphologic dysplasia, progressive bone marrow failure, ineffective hematopoiesis, peripheral blood cytopenias, and other cytogenetic/molecular abnormalities [Citation1–3]. The estimated annual incidence is 21,000 new cases annually in the United States [Citation4], and an estimated 1400 new cases per year in Canada [Citation5]. International Prognostic Scoring System (IPSS) risk categories correspond to varying mortality risk and risk of acute myeloid leukemia (AML) progression, with Revised IPSS (IPSS-R) scores <3.5 considered to be lower-risk (LR) [Citation6,Citation7]. Although patients with LR MDS have favorable overall survival (OS) and leukemia-free survival compared to those with higher-risk (HR) MDS, they have inferior OS compared to the general population, with a mean life-year loss estimated at 6.3 years [Citation8]. Common symptoms of LR MDS are related to peripheral blood cytopenias and include fatigue, infections, bruising, bleeding, falls, and lower quality of life (QoL) [Citation3]. Frailty and comorbidities, whether preexisting, disease-related, or treatment-related, can also increase the risk of mortality in both LR and HR MDS [Citation9–11].
Treatment options to improve anemia in patients with LR MDS include erythropoiesis-stimulating agents (ESAs), immunosuppressive therapy, and luspatercept, each focusing on the amelioration of cytopenias and reversal/avoidance of transfusion dependence of red blood cells (RBCs). Additionally, lenalidomide is approved only for del(5q) MDS in Canada, while decitabine was recently approved for de novo and secondary MDS, including MDS with ring sideroblasts (MDS-RS). Hypomethylating agents are generally used for the treatment of adults with HR MDS who are either not eligible for or as a bridge to hematopoietic stem cell transplant. For most patients, MDS eventually becomes refractory to these therapies, and many require long-term RBC transfusions to manage anemia [Citation12,Citation13]. However, long-term exposure to RBC transfusion is associated with adverse outcomes, including reduced OS, increased risk of AML progression, iron overload, and diminished QoL [Citation14–17].
RS are formed by the irregular accumulation of iron in the mitochondria [Citation18]. MDS-RS is a rare subtype of MDS characterized by the presence of <5% of bone marrow blasts and ≥15% of RS (or ≥5% of RS if the cells carry a mutation in the SF3B1 gene) [Citation19] that is generally classified into lower-risk categories per IPSS and IPSS-R. However, anemia may be prominent in these cases as most patients eventually become dependent on RBC transfusions. Response rates to first-line treatment with ESAs range from 30 to 60% in LR MDS [Citation19]. In a study of patients with MDS-RS who did not respond to treatment with ESAs, the response rates for second-line agents lenalidomide and azacitidine were approximately 45% and 30%, respectively [Citation20].
Despite previous research investigating the consequences of RBC transfusions in LR MDS, their specific burden among patients with MDS-RS is less well known. Furthermore, most studies have focused on clinical outcomes such as OS and AML progression rather than patient-reported or economic/healthcare resource utilization (HCRU) outcomes. Therefore, the main objectives of this study were to estimate the association between RBC transfusions and OS, as well as HCRU (specifically hospitalization) and QoL (i.e. EuroQoL 5-dimension 3-level questionnaire [EQ-5D-3L] utility index) outcomes.
Materials and methods
Study design, setting, and participants
This was a comparative observational study based on individual patient data extracted from the Canadian MDS (MDS-CAN) registry (NCT02537990). The registry was initiated in August 2005 and is ongoing in 15 tertiary care centers across 8 of 10 provinces in Canada. Adults aged ≥18 years who were diagnosed with MDS, MDS/myeloproliferative neoplasms (MPN) (including chronic myelomonocytic leukemia [CMML]), and low blast count AML (20–30%), as defined by the World Health Organization (WHO) 2008 classification [Citation21], were eligible for enrollment. Patients whose bone marrow assessment occurred ≥2 years prior to signed consent, with AML and bone marrow blasts ≥31% at time of consent, or who previously received allogenic stem cell transplant, were not eligible for enrollment.
Analyses were conducted separately for this sample and with a subsample of patients with RS ≥15% at diagnosis.
Ethics
All patients provided written informed consent at enrollment, and all 15 participating medical centers received Institutional Review Board approval for the registry study.
Data collection
Demographic, disease, and retrospective diagnostic characteristics were recorded at the time of registry enrollment. Retrospective diagnostic information, including RS, bone marrow blasts, IPSS, and IPSS-R categories, were captured. MDS-related treatments (e.g. iron chelation therapy [ICT], ESAs) and RBC transfusions were recorded from enrollment through end of follow-up. For RBC transfusions, the date of the procedure and quantity of RBC units transfused were recorded. Dates of AML progression, death, and last contact were also captured. Data collected prospectively included hospitalizations (events within the preceding 3 months were recorded using patient information sheets (PIS) completed by the patient’s physician every 6–12 months from enrollment), laboratory test results, and patient-reported health outcomes (EuroQoL 5-dimension questionnaire, 3-level or 5-level [EQ-5D-3L/5L]) (measured every 6–12 months from enrollment). Further details are provided in Supplementary Appendix 1.
Outcomes
The primary outcome of interest was OS, defined as time in months from registry enrollment to death or end of follow-up. Survival times were censored at the date of last follow-up or death. Hospitalization events were used as a surrogate for HCRU. Four types of hospitalization events were used as outcomes: hospitalization (1) for any reason; (2) for any reason other than transfusion or elective surgery; (3) for infections or fever; and (4) for cardiac complications. Patients were included in the analysis if they had ≥6 months post-enrollment follow-up and ≥1 completed PIS. In addition to these outcomes, the EQ-5D-3L scalar index was used as a composite of patient-reported outcomes over the study period. Patients were included in the analysis of EQ-5D-3L responses if they had ≥6 months post-enrollment follow-up and completed ≥1 EQ-5D instrument (i.e. no missing responses to all five components of the EQ-5D composite scale).
Exposure to RBC transfusions
The primary exposure of interest was RBC dose density rate, calculated as the ratio of the cumulative number of RBC units received during registry enrollment to the number of days enrolled, expressed as a rate per 16 weeks [Citation17]. RBC dose densities were derived for each calendar day after registry enrollment, then linked to the calendar day for each outcome observation for analysis. For OS, dose densities were measured on each post-enrollment day until the patient’s date of death or end of follow-up. For hospitalization events, dose densities were assessed on the date of completion of the PIS. For the EQ-5D instrument, dose densities were calculated as cumulative RBC transfusions divided by number of days until completion of the EQ-5D.
Descriptive statistics
Descriptive statistics were calculated using the means and standard deviations (SDs) of continuous variables and proportions for categorical variables and stratified by cumulative dose density over follow-up. Further details are provided in Supplementary Appendix 1.
Adjustment for covariates
Baseline adjustment factors included age at enrollment, sex, IPSS-R at enrollment, and Eastern Cooperative Oncology Group performance status (ECOG PS) at enrollment. Time-varying adjustment factors included receipt of ESAs, receipt of ICT, serum ferritin (SF) levels, and the Charlson Comorbidity Index (CCI). Where possible, missing data for SF level or the CCI were imputed using last observation carried forward.
Statistical models
The aim of each analysis was to estimate the incremental effect of a unit increase in exposure to RBC transfusions on the outcome of interest, after adjusting for fixed baseline and time-varying covariates (see Adjustment for covariates).
For OS, a Cox proportional hazards regression model was used to estimate the association between the risk of death and exposure to RBC transfusions [Citation22,Citation23]. The incremental effect of an increase in the level of exposure to RBC transfusions on the rate of mortality was reported via hazard ratios (HRs) and 95% confidence intervals (CIs). CIs that did not cross unity (i.e. 1.0) were considered statistically significant.
Hospitalization events and EQ-5D responses were examined using generalized linear mixed models (GLMMs) with the same set of covariates and accounting for repeat observations using random patient-level intercepts [Citation24,Citation25]. GLMMs were fitted using a Bayesian framework [Citation26,Citation27]; as such, 95% credible intervals (CrIs) instead of CIs were used to represent the uncertainty of statistical estimates [Citation28–30].
Hospitalization events were modeled using a logistic regression (i.e. binomial distribution and logit link), and relative effect estimates were summarized using odds ratios (ORs) and 95% CrIs; CrIs that excluded unity (i.e. 1.0) were considered to be statistically significant. The EQ-5D index was modeled with a Gaussian distribution and identity link. Results from the fitted model were summarized by the mean change in index per unit increase in exposure and 95% CrI. For this outcome, CrIs that excluded 0 were considered statistically significant.
For each outcome, the analysis sample included patients who met the study eligibility criteria (see Study design, setting, and participants) and had ≥1 post-enrollment outcome assessment (i.e. a completed EQ-5D-3L instrument). For multivariable adjustments, the analysis sample was further restricted to patients who had non-missing data for all covariates, after imputation by last observation carried forward. All analyses were conducted in R [Citation31].
Sensitivity analysis
A sensitivity analysis was conducted to assess the impact of modifications to the exposure variable on each outcome. For this sensitivity analysis, exposure was changed to the monthly rate of RBC transfusions over a period of 16 weeks prior to the event of interest. Unlike dose density rate, which captures each patient’s cumulative history of transfusions received during the enrollment period, the interval rate only considers transfusions received within distinct 16-week periods. Additionally, for the primary outcome of OS, Kaplan–Meier curves were stratified by cumulative RBC transfusion density throughout follow-up. Patients were categorized as having transfusion independence (0 RBC units received throughout follow-up), moderate transfusion dependence (<1 RBC units received per 4 weeks throughout follow-up), or high transfusion dependence (≥1 RBC units received per 4 weeks throughout follow-up).
Reporting
A Strengthening the Reporting of Observational Studies in Epidemiology statement is included in Supplementary Appendix 2 [Citation32,Citation33].
Results
Study population
Overall, 1168 patients were enrolled in the MDS-CAN registry as of 15 May 2020. Of this cohort, 191 patients had RS ≥5% at diagnosis and were enrolled in the registry between 1 January 2008 and 31 December 2018. The study cohort included 145 patients who had an IPSS-R of very low, low, or intermediate (). The median time from diagnosis to registry enrollment was 6.6 (interquartile range [IQR]: 2.2–18.8) months, and median follow-up time from enrollment was 27.1 (IQR: 16.0–47.4) months. Mean age at enrollment was 73.0 (SD: 10.4) years, 64.8% (n = 94) of patients were women, 69.0% (n = 100) had a very low or low IPSS-R score, and 89.2% (n = 129) had an ECOG PS of 0 or 1 (). Baseline characteristics ( and Supplementary Table 1 in Appendix 3) were similar for the sub-sample (n = 104; 71.7%) of this cohort that also had RS ≥15% at diagnosis (Supplementary Table 2 in Appendix 3). A total of 17 (11.7%) patients progressed to AML during follow-up. Due to the limited number of AML events for this cohort, this outcome was not further assessed.
Figure 1. Cohort attrition diagram. Note: Sample sizes for the multivariable analyses were smaller than the number of patients eligible for inclusion in the study (N = 145) due to missing data for the covariates or outcomes of interest. EQ-5D-3L: EuroQoL 5-dimension 3-level questionnaire; IPSS-R: Revised International Prognostic Scoring System; MDS: myelodysplastic syndromes; MDS-CAN: Canadian MDS registry; PIS: patient information sheet; RS: ring sideroblasts.
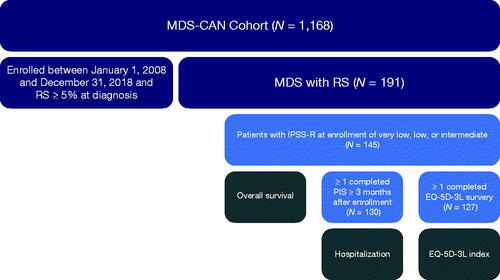
Table 1. Demographic and clinical characteristics of patients with lower-risk MDS-RS.
Exposure to RBC transfusions
The mean dose density of RBC exposure over follow-up was 0.95 (SD: 1.32) units per month, and 69.0% (n = 100) of patients received ≥1 RBC transfusion with a median time from enrollment to transfusion dependency of 26.0 (95%CI: 14.3–40.6) months. Among patients with ≥1 RBC transfusion, 51% (n = 51) had <1 RBC transfusion per month, with a mean of 0.39 (SD: 0.30) RBCs units per month, and 49% (n = 49) had ≥1 RBC transfusion per month, with a mean of 2.42 (SD: 1.33) RBCs units per month ().
Os
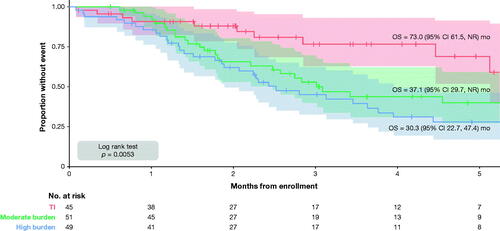
A total of 71 patients died after registry enrollment, with a median OS of 43.6 (95%CI: 34.0–73.0) months, a 1-year survival probability of 90.1%, and a 5-year survival probability of 42.4% (). Stratified Kaplan–Meier analysis demonstrated shorter survival in patients with moderate-to-high burden of RBC transfusion compared to patients who remained transfusion-independent throughout follow-up (, ). Prior to adjusting for baseline and time-varying covariates, the cumulative dose density of RBC exposure was associated with a significantly greater risk of mortality (HR: 1.017; 95%CI: 1.010–1.024). The mean (SD) dose density over study follow-up was 1.28 (1.41) units per month for patients who died versus 0.55 (0.97) units per month for those alive at end of study follow-up. The median (IQR) was 0.83 (0.09–1.87) per month for patients who died versus 0.02 (0.00–0.85) for those alive at the end of study follow-up (Supplementary Figure 1 in Appendix 3).
Figure 2. Kaplan–Meier curves for OS by burden of RBC transfusion (TI: 0 RBC units during follow-up; moderate: <1 RBC units per 4 weeks over follow-up; high: ≥1 RBC units per 4 weeks over follow-up) in patients with low-risk MDS at enrollment. The shaded area surrounding each curve represents the 95% CI. CI: confidence interval; MDS: myelodysplastic syndromes; NR: not reached; OS: overall survival; RBC: red blood cell; TI: transfusion independence.
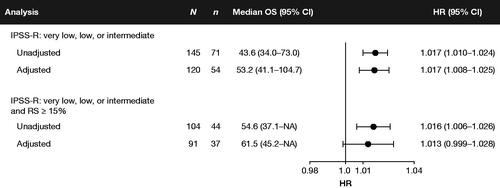
Estimates were similar after adjusting for baseline and time-varying covariates: an additional unit of RBC transfused per month was associated with a 1.7% increase in the hazard of death (HR: 1.017; 95%CI: 1.008–1.025) (). Estimates were also similar for the overall cohort and in patients with RS ≥15% at diagnosis (Supplementary Figure 2 in Appendix 3). A sensitivity analysis whereby exposure was defined as the monthly rate of RBC transfusions received over 16 weeks prior to observation produced larger effect estimates (HR: 1.189; 95%CI: 1.027–1.377) (Supplementary Figure 3 in Appendix 3).
Figure 3. Forest plot of the estimated association between the hazard rate of mortality and dose density of RBC transfusions. Notes: HRs may be interpreted as the estimated impact of a 1-unit increase in the monthly rate of RBC transfusions on the hazard rate of mortality. HRs >1 indicate that exposure to RBC transfusions is a risk factor for mortality. The exposure is the dose density rate, calculated as the cumulative ratio of RBC transfusion units received to the total number of days enrolled, expressed in monthly rates. CI: confidence interval; HR: hazard ratio; IPSS-R: Revised International Prognostic Scoring System; NA: not available/not reached; OS: overall survival; RBC: red blood cell; RS: ring sideroblasts.
Hospitalizations
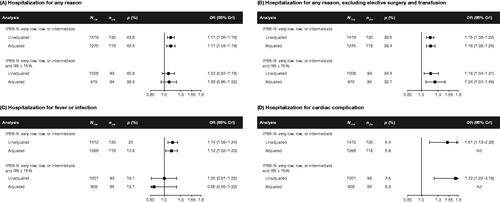
Out of the 130 patients who had ≥1 completed PIS, 57 (43.8%) had ≥1 hospitalization for any reason, 50 (38.5%) had ≥1 hospitalization for reasons other than transfusion or elective surgery, 26 (20.0%) had ≥1 hospitalization for fever or infection, and 7 (5.4%) had ≥1 hospitalization for cardiac complications. Prior to adjusting for baseline and time-varying covariates, every unit increase in RBC transfused per month was associated with 11% greater odds of hospitalization for any reason (OR: 1.11; 95% CrI: 1.05–1.18), 15% greater odds for reasons other than transfusion or elective surgery (OR: 1.15; 95% CrI: 1.08–1.22), 14% greater odds for fever or infection (OR: 1.14; 95% CrI: 1.06–1.24), and 51% greater odds for cardiac complication (OR: 1.51; 95% CrI: 1.13–2.38). After adjusting for baseline and time-varying covariates, the dose density of RBC exposure remained a significant risk factor for hospitalizations for reasons other than transfusion or elective surgery. Point estimates for other hospitalization events were of a similar magnitude but were not statistically significant. Hospitalization due to cardiac complication was relatively rare, and attempts to fit multivariable models for this outcome did not achieve convergence (). Estimates were of a similar magnitude among patients with RS ≥15% at diagnosis. A sensitivity analysis whereby exposure was defined as the monthly rate of RBC transfusions received over 16 weeks prior to completion of the PIS produced larger effect estimates (e.g. OR for any-cause hospitalization: 1.33; 95% CrI: 1.14–1.56) (Supplementary Figure 4 in Appendix 3).
Figure 4. Forest plots of the estimated association between the odds of hospitalization (A) for any reason; (B) for any reason, excluding elective surgery and transfusion; (C) for fever or infection; (D) for cardiac complication and dose density of RBC transfusions. Note: The adjusted association between dose density and the odds of hospitalization for cardiac complications did not achieve stable estimates due to lack of model convergence. ORs may be interpreted as the estimated impact of a 1-unit change in mean exposure to RBC transfusions on the odds of hospitalization. ORs >1 indicate that exposure to RBC transfusions is a risk factor for hospitalization. The exposure is the dose density rate, calculated as the cumulative ratio of RBC transfusion units received to the total number of days enrolled, expressed in monthly rates. CrI: credible interval; IPSS-R: Revised International Prognostic Scoring System; Nobs: number of observations (completed patient information sheets); Npts: number of patients; P: proportion of patients with ≥1 hospitalization; NE: not estimable; OR: odds ratio; RBC: red blood cell; RS: ring sideroblasts.
Health-related QoL
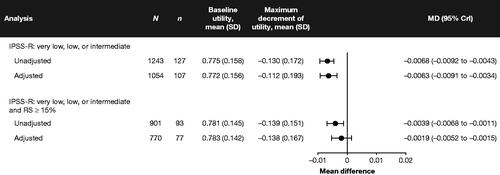
Overall, 127 (87.6%) patients had ≥1 complete EQ-5D-3L questionnaire, with a median of 4 (IQR: 2–8) fully completed questionnaires and a mean baseline index of 0.786 (SD: 0.189). Over follow-up, the average maximum post-enrollment decrease in the EQ-5D-3L index across all patients was −0.130 (SD: 0.172). Dose density of RBC transfusions was associated with a statistically significant reduction in EQ-5D-3L index scores before (mean difference [MD]: −0.0068; 95% CrI: −0.0092 to −0.0043) and after (MD: −0.0063; 95% CrI: −0.0091 to −0.0034) adjusting for baseline and time-varying covariates (). Estimates were generally similar for the rate of RBC transfusion but were numerically smaller and did not achieve significance after adjusting for baseline and time-varying covariates. A sensitivity analysis whereby exposure was defined as the monthly rate of RBC transfusions received over 16 weeks prior to measurement produced larger effect estimates (e.g. MD: −0.0186; 95%CI: −0.0247 to −0.0126) (Supplementary Figure 5 in Appendix 3).
Figure 5. Forest plot of the estimated association between the mean of the EQ-5D-3L composite index and dose density of RBC transfusions. Note: MDs may be interpreted as the estimated impact of a 1-unit change in mean exposure to RBC transfusions on the level of HRQoL as measured by the EQ-5D-3L composite index. MDs <0 indicate that exposure to RBC transfusions reduces patient-reported HRQoL. The maximum decrement of utility is the maximum negative change in the patient’s composite EQ-5D-3L index between baseline and end of follow-up. The exposure is the dose density rate, calculated as the cumulative ratio of RBC transfusion units received to the total number of days enrolled, expressed in monthly rates. CrI: credible interval; EQ-5D-3L: EuroQoL 5-dimension 3-level questionnaire; HRQoL: health-related quality of life; IPSS-R: Revised International Prognostic Scoring System; N: sample size; MD: mean difference; RBC: red blood cell; RS: ring sideroblasts; SD: standard deviation.
Discussion
The objective of this study was to assess the impact of RBC transfusion exposure on OS, HCRU, and patient-reported QoL in patients with MDS and RS ≥5%. The analysis was conducted using individual patient data from the MDS-CAN database, a comprehensive and mature clinical registry that has been ongoing for over 10 years. RBC transfusion remained an independent risk factor for mortality among LR MDS patients with RS, even after adjustment for potential confounders.
For the lower-risk cohort examined in this study, the median OS was 43.6 months, with a 1-year survival rate of 90.1% and 5-year survival rate of 42.4%. As observed in the European LeukemiaNet lower-risk MDS registry, the OS of transfusion-dependent patients was inferior to that of transfusion-independent patients [Citation34]. The 5-year survival rate of transfusion-independent patients was 68.9%, compared with 27.8% for patients who averaged ≥1 RBC units per month throughout enrollment. Patient demographics and median OS derived for this cohort were within the range of those reported for LR MDS patients (including non-RS patients) in the European MDS Registry (EUMDS) (median OS: 2.4–11.8 years) and Düsseldorf registries (median OS: 26 months for RS-positive patients, 28 months for RS-negative patients) [Citation35,Citation36].
Two measures of exposure were used to estimate the impact of RBC transfusion on the outcomes of interest: transfusion dose density and RBC rate. Prior to adjusting for baseline and time-varying covariates, the dose density of RBC transfusions was a significant risk factor for mortality, hospitalization for any reason, for reasons other than transfusion or elective surgery, and for fever or infection, and was associated with lower QoL. This is not unexpected, since a large study of patients with LR MDS in the EUMDS registry showed that higher RBC dose density was an indicator of reduced survival, even at relatively low rates of transfusion [Citation17]. The independent association of transfusion dependency with inferior QoL aligns with that of the European LeukemiaNet low-risk MDS registry, but the present study provides a more refined numerical association between RBC density and QoL [Citation37]. After adjustment for covariates, point estimates were of a similar magnitude but significant only for OS, hospitalizations for reasons other than elective surgery or transfusion, and the EQ-5D-3L index. Estimates for the monthly rate of RBC transfusions received over 16 weeks prior to endpoint ascertainment were similar, though numerically greater. Analyses of hospitalization events for cardiovascular complication were based on a relatively small number of events, making it difficult to draw robust conclusions regarding cardiovascular risk from this analysis.
We recognize that this study has some methodological limitations inherent to any ‘real-world’ observational study. Notably, multivariable adjustments were limited to prognostically relevant variables reported in the registry. The hospitalization rate reflected only the immediate 3-month assessment during the 6-month follow-up periods and would likely underestimate the total hospitalization rate. Although it is virtually impossible to adjust for all factors that could impact the outcomes of interest and exposure to RBC transfusions, consistent results were derived for both measures of exposure, before and after adjusting for patient demographic, disease, or treatment characteristics. Furthermore, although the registry was mature and included a rich set of variables for each patient, only 145 patients were included in the unadjusted analyses of the primary outcome (OS). A somewhat smaller sample was included in the multivariable analyses due to missing data for some of the covariates, even after imputation via last observation carried forward. Although the sample size may have had limited power, it is reassuring that the results were consistent, with increased RBC exposure associated with worse outcomes in all analyses. Finally, this study was conducted in patients with RS ≥5% at diagnosis without SF3B1 testing available. The presence/absence of the SF3B1 mutation in MDS with RS ≥5% is a defining subtype of RS-positive MDS, which is typically considered as LR per IPSS or IPSS-R [Citation38]. According to the new International Consensus Classification [Citation39], patients with RS expressing wild-type SF3B1 are reclassified as MDS, not otherwise specified with single or multilineage dysplasia, and only the 2022 WHO Classification of Haematolymphoid Tumours maintains the entity MDS with low blasts and RS [Citation40].
Although the absolute RS percentage may not have prognostic relevance [Citation19,Citation41,Citation42], it is possible that we included patients who would not be defined as RS according to the current WHO classification, had the SF3B1 mutation status been available routinely. However, alternative analyses conducted in patients with RS ≥15% at diagnosis were consistent with the primary analyses, though some estimates failed to reach statistical significance in part due to a small sample size (N = 104 in unadjusted analyses of OS). Additionally, as no mutational analysis was performed, the impact of co-expression of other adverse mutations (e.g. BCOR, BCORL1, RUNX1, NRAS, STAG2, and SRSF2) could not be performed.
Conclusions
This study used data from the MDS-CAN registry to determine the clinical and economic burden of exposure to RBC transfusion in patients with LR MDS-RS. Almost half of this cohort died within 5 years of MDS diagnosis, nearly 70% received ≥1 RBC transfusion, with a mean dose of 1 RBC per month throughout follow-up. A higher burden of RBC transfusion was a significant risk factor for mortality in this cohort and was also associated with an increased risk of hospitalization and lower health-related QoL. These results suggest that prolonged exposure to RBC transfusion may constitute a significant burden of morbidity and mortality in patients with LR MDS-RS. Further studies and SF3B1 testing may be required to better understand the implications of RBC transfusion in recently defined MDS-RS with/without mutated SF3B1. To our knowledge, these are the first data addressing RBC transfusion dependence and its association with clinical outcomes in RS subtypes of MDS.
GLAL-2022-0682-File007.docx
Download MS Word (266.8 KB)Acknowledgements
The authors would like to thank all the patients and their families, nurses, study personnel, and investigators who participated in the MDS-CAN registry and made this study possible, the clinical study teams who participated in the study, and the protocol managers for this study.
Disclosure statement
PS and CC are paid employees of EVERSANA™, which was contracted by Celgene Inc. (Bristol-Myers Squibb) to work on this project; CC is also a shareholder of EVERSANA™. HAL served on the advisory board and received honoraria and research funding from AbbVie, Alexion Pharmaceuticals, AstraZeneca, Bristol Myers Squibb/Celgene, Janssen Pharmaceuticals, Novartis, and Taiho Oncology. JS received research support from AbbVie, Astellas Pharma, Bristol Myers Squibb/Celgene Canada, Novartis, and Janssen Pharmaceuticals; and served on the advisory board for AbbVie, Astellas Pharma, Bristol Myers Squibb/Celgene Canada, Janssen Pharmaceuticals, Novartis, and Taiho Oncology. BL served on the advisory board and received honoraria from AbbVie, Alexion Pharmaceuticals, AMGEN, Astellas Pharma, Astex Pharmaceuticals, Bristol Myers Squibb/Celgene, F. Hoffmann-La Roche, Janssen Pharmaceuticals, Jazz Pharmaceuticals, Novartis, Otsuka Pharmaceutical, Paladin Labs, Pfizer, and Treadwell Therapeutics; and was a consultant for AbbVie, Novartis, and Pfizer. KWLY was a consultant for Bristol Myers Squibb/Celgene, F. Hoffmann-La Roche, Jazz Pharmaceuticals, Novartis, Pfizer, Shattuck Labs, Taiho Oncology, and Takeda Pharmaceutical Company; received research funding from Astex Pharmaceuticals, F. Hoffmann-La Roche, Forma Therapeutics, Genentech, Geron Corporation, Gilead Sciences, Janssen Pharmaceuticals, Jazz Pharmaceuticals, Novartis, and Treadwell Therapeutics; and received honoraria from AbbVie and Novartis. TN served on the advisory board and received honoraria for AbbVie, Alexion Pharmaceuticals, Bristol Myers Squibb/Celgene, Jazz Pharmaceuticals, Novartis, and Taiho Oncology; and received research funding from Alexion Pharmaceuticals and Bristol Myers Squibb/Celgene. M-MK served on the advisory board for Celgene and Taiho Oncology. RB received research support from Bristol Myers Squibb/Celgene and Takeda Pharmaceutical Company; received funding for the national MDS registry from Bristol Myers Squibb and Taiho Pharma Canada; received honoraria from Bristol Myers Squibb, Taiho Oncology, and Takeda; served on the advisory board for Bristol Myers Squibb and Taiho Oncology; and had an unpaid role in the scientific advisory board of the MDS Foundation and the MDS guidelines committee of the Aplastic Anemia & MDS International Foundation. CW and DT are paid employees of Bristol Myers Squibb; DT is also a stockholder/shareholder of Bristol Myers Squibb. MG received research support (institutional clinical trial contract) from AbbVie, Amgen, Bristol Myers Squibb/Celgene, Geron Corporation, Gilead Sciences, Janssen Pharmaceuticals, and Novartis; received honoraria from Bristol Myers Squibb/Celgene; was an expert witness for Novartis and Taiho Oncology; and served on the advisory board for AbbVie, Amgen, Bristol Myers Squibb/Celgene, Jazz Pharmaceuticals, Novartis, Paladin Labs, Pfizer, and Taiho Oncology. VB had a role as content expert, paid or unpaid, in the CLL Society, CLL Canada, and The Leukemia & Lymphoma Society of Canada; was a consultant for AbbVie, AstraZeneca, BeiGene, and Janssen Pharmaceuticals; and received honoraria from AbbVie, AstraZeneca, Janssen Pharmaceuticals, Medicom, and Oncology Education and royalties or licenses from Biogen. ES-H served on the advisory board for Bristol Myers Squibb and Taiho Oncology. LC served on the advisory board for AbbVie. NF was a consultant for Alexion Pharmaceuticals, Amgen, AstraZeneca, Bristol Myers Squibb/Celgene, F. Hoffmann-La Roche, Ipsen, Janssen Pharmaceuticals, Lundbeck, Merck & Co., Novartis, Pfizer, Sanofi, Takeda Pharmaceutical Company; and received honoraria from AstraZeneca, Bristol Myers Squibb/Celgene, F. Hoffmann-La Roche, FORUS Therapeutics, Novartis, and Pfizer. GC, DK, AP, and AT have no disclosures to reports
Data availability statement
The data that support the findings of this study are available in the supplementary material of this article and from the corresponding author upon reasonable request.
Additional information
Funding
References
- Mohamedali A, Gaken J, Twine NA, et al. Prevalence and prognostic significance of allelic imbalance by single-nucleotide polymorphism analysis in low-risk myelodysplastic syndromes. Blood. 2007;110(9):3365–3373.
- Issa JP. The myelodysplastic syndrome as a prototypical epigenetic disease. Blood. 2013;121(19):3811–3817.
- Cogle CR. Incidence and burden of the myelodysplastic syndromes. Curr Hematol Malig Rep. 2015;10(3):272–281.
- Carraway HE, Saygin C. Therapy for lower-risk MDS. Hematology Am Soc Hematol Educ Program. 2020;2020(1):426–433.
- Slack J, Nguyen L, Naugler C, et al. Incidence of myelodysplastic syndromes in a major Canadian metropolitan area. J Appl Lab Med. 2018;3(3):378–383.
- Pfeilstocker M, Tuechler H, Sanz G, et al. Time-dependent changes in mortality and transformation risk in MDS. Blood. 2016;128(7):902–910.
- Cuker A, Altman J, Gerds A, et al. editors. American society of hematology self-assessment program. 7th ed. Washington (DC): American Society of Hematology; 2019.
- Li Z, Tang D, Tang J, et al. Estimating life-year loss of lower-risk myelodysplastic syndromes in. Europe. HemaSphere. 2019;3(S1):693.
- Abel GA, Buckstein R. Integrating frailty, comorbidity, and quality of life in the management of myelodysplastic syndromes. Am Soc Clin Oncol Educ Book. 2016;35:e337–e344.
- Starkman R, Alibhai A, Wells RA, et al. An MDS-specific frailty index based on cumulative deficits adds independent prognostic information to clinical prognostic scoring. Leukemia. 2020;34(5):1394–1406.
- Wan BA, Nazha A, Starkman R, et al. Revised 15-item MDS-specific frailty scale maintains prognostic potential. Leukemia. 2020;34(12):3434–3438.
- Fenaux P, Adès L. How we treat lower-risk myelodysplastic syndromes. Blood. 2013;121(21):4280–4286.
- Santini V. Treatment of low-risk myelodysplastic syndromes. Hematology Am Soc Hematol Educ Program. 2016;2016(1):462–469.
- Malcovati L, Porta MG, Pascutto C, et al. Prognostic factors and life expectancy in myelodysplastic syndromes classified according to WHO criteria: a basis for clinical decision making. J Clin Oncol. 2005;23(30):7594–7603.
- Platzbecker U, Hofbauer LC, Ehninger G, et al. The clinical, quality of life, and economic consequences of chronic anemia and transfusion support in patients with myelodysplastic syndromes. Leuk Res. 2012;36(5):525–536.
- Shenoy N, Vallumsetla N, Rachmilewitz E, et al. Impact of iron overload and potential benefit from iron chelation in low-risk myelodysplastic syndrome. Blood. 2014;124(6):873–881.
- de Swart L, Crouch S, Hoeks M, EUMDS Registry Participants, et al. Impact of red blood cell transfusion dose density on progression-free survival in patients with lower-risk myelodysplastic syndromes. Haematologica. 2020;105(3):632–639.
- Ohba R, Furuyama K, Yoshida K, et al. Clinical and genetic characteristics of congenital sideroblastic anemia: comparison with myelodysplastic syndrome with ring sideroblast (MDS-RS). Ann Hematol. 2013;92(1):1–9.
- Patnaik MM, Tefferi A. Refractory anemia with ring sideroblasts (RARS) and RARS with thrombocytosis: 2019 update on diagnosis, risk-stratification, and management. Am J Hematol. 2019;94(4):475–488.
- Park S, Hamel J-F, Toma A, et al. Outcome of lower-risk myelodysplastic syndrome with ring sideroblasts (MDS-RS) after failure of erythropoiesis-stimulating agents. Leuk Res. 2020;99:106472.
- Vardiman JW, Thiele J, Arber DA, et al. The 2008 revision of the world health organization (WHO) classification of myeloid neoplasms and acute leukemia: rationale and important changes. Blood. 2009;114(5):937–951.
- Cox DR. Regression models and life‐tables. J R Stat Soc B. 1972;34(2):187–202.
- Zhang Z, Reinikainen J, Adeleke KA, et al. Time-varying covariates and coefficients in cox regression models. Ann Transl Med. 2018;6(7):121.
- Breslow NE, Clayton DG. Approximate inference in generalized linear mixed models. J Am Stat Assoc. 1993;88(421):9–25.
- Gelman A, Hill J. Data analysis using regression and multilevel/hierarchical models. Cambridge: Cambridge University Press; 2006.
- Gelman A, Carlin JB, Stern HS, et al. Bayesian data analysis. Boca Raton (FL): CRC Press; 2013.
- Bürkner PC. Advanced bayesian multilevel modeling with the R package brms. R Journal. 2018;10(1):395–411.
- Kruschke JK. Rejecting or accepting parameter values in bayesian estimation. Adv Methods Pract Psychol Sci. 2018;1(2):270–280.
- Wagenmakers E-J, Marsman M, Jamil T, et al. Bayesian inference for psychology. Part I: theoretical advantages and practical ramifications. Psychon Bull Rev. 2018;25(1):35–57.
- Afrabandpey H, Peltola T, Piironen J, et al. A decision-theoretic approach for model interpretability in bayesian framework. Mach Learn. 2020;109(9-10):1855–1876.
- R Core Team. R: a language and environment for statistical computing. Vienna, Austria: r Foundation for Statistical Computing; 2018.
- von Elm E, Altman D, Egger M, et al. The Strengthening the Reporting of Observational Studies in Epidemiology (STROBE) Statement: Guidelines for Reporting Observational Studies. 2022 [Accessed 14 July 2022]. https://www.equator-network.org/reporting-guidelines/strobe/
- Vandenbroucke JP, von Elm E, Altman DG, STROBE Initiative, et al. Strengthening the reporting of observational studies in epidemiology (STROBE): explanation and elaboration. Epidemiology. 2007;18(6):805–835.
- de Swart L, Smith A, Fenaux P, et al. Management of 1000 patients with low- and intermediate-1 risk myelodysplastic syndromes in the European LeukemiaNet MDS registry. Leuk Res. 2011;35(Suppl 1):s3.
- Germing U, Strupp C, Giagounidis A, et al. Evaluation of dysplasia through detailed cytomorphology in 3156 patients from the düsseldorf registry on myelodysplastic syndromes. Leuk Res. 2012;36(6):727–734.
- de Swart L, Reiniers C, Bagguley T, EUMDS Steering Committee, et al. Labile plasma iron levels predict survival in patients with lower-risk myelodysplastic syndromes. Haematologica. 2018;103(1):69–79.
- Stauder R, Yu G, Koinig KA, et al. Health-related quality of life in lower-risk MDS patients compared with age- and sex-matched reference populations: a European LeukemiaNet Study. Leukemia. 2018;32(6):1380–1392.
- Malcovati L, Germing U, Kuendgen A, et al. Time-dependent prognostic scoring system for predicting survival and leukemic evolution in myelodysplastic syndromes. J Clin Oncol. 2007;25(23):3503–3510.
- Arber DA, Orazi A, Hasserjian RP, et al. International consensus classification of myeloid neoplasms and acute leukemia: integrating morphological, clinical, and genomic data. Blood. 2022;140(11):1200–1228.
- Khoury JD, Solary E, Abla O, et al. The 5th edition of the world health organization classification of haematolymphoid tumours: myeloid and histiocytic/dendritic neoplasms. Leukemia. 2022;36(7):1703–1719.
- Patnaik MM, Hanson CA, Sulai NH, et al. Prognostic irrelevance of ring sideroblast percentage in world health organization-defined myelodysplastic syndromes without excess blasts. Blood. 2012;119(24):5674–5677.
- Patnaik MM, Lasho TL, Hodnefield JM, et al. SF3B1 mutations are prevalent in myelodysplastic syndromes with ring sideroblasts but do not hold independent prognostic value. Blood. 2012;119(2):569–572.