
Abstract
To evaluate the effects of gene mutations on Bruton tyrosine kinase inhibitor, zanubrutinib’s effectiveness in patients with diffuse large B-cell lymphoma (DLBCL), we examined pooled data from four single-arm studies (BGB-3111-AU-003 [NCT02343120], BGB-3111-207 [NCT03145064], BGB-3111_GA101_Study_001 [NCT02569476], BGB-3111-213 [NCT03520920]; n = 121). Objective response rate (ORR) was higher, though not statistically significant, in patients with activated B-cell-like (ABC)- and unclassified DLBCL (42.9% [21/49]) versus those with germinal-center B-cell-like DLBCL (14.3% [1/7]; p = 0.15). Patients with CD79B mutations had better ORR (60%) versus patients with wild-type alleles (25.9%, p < 0.01). Higher TCL1A expression correlated with better zanubrutinib response (p = 0.03), longer progression-free survival (p = 0.01), and longer overall survival (p = 0.12). TCL1A expression was higher in ABC-DLBCL (p < 0.001) and MYD88/CD79B-mutated subtypes (p < 0.0001). Eighteen patients with high MYC/BCL-2 expression responded better to zanubrutinib (ORR = 61 vs. 29%, p = 0.02). Our results support assessing CD79B mutations, co-expressor DLBCL, and TCL1A expression status to identify patients with DLBCL who will benefit from zanubrutinib.
Introduction
Diffuse large B-cell lymphoma (DLBCL) accounts for ∼30% of all non-Hodgkin lymphomas and cyclophosphamide, doxorubicin, vincristine, prednisone, and rituximab (R-CHOP) therapy has resulted in striking improvements in survival outcomes [Citation1–4]. Regardless, ∼40.0% of patients with DLBCL relapse or develop primary refractory disease—with some eventually succumbing to the disease [Citation5,Citation6].
Among patients with DLBCL, gene expression profiling (GEP) studies have identified molecular subtypes with the prognostic value representing the cell of origin including germinal-center B-cell-like (GCB)-DLBCL, activated B-cell-like (ABC)-DLBCL, and unclassified cases [Citation7,Citation8]. ABC and GCB subtypes depend on different signaling pathways and ABC-DLBCL is associated with substantially poorer outcomes [Citation7,Citation9]. Subsequent genetic profiling studies have divided DLBCL into groups (MCD, BN2, N1, and EZB) that differ phenotypically and genetically and correlate with DLBCL biology [Citation10] and into seven genetic subtypes reflecting different signaling pathways, regulatory pathways, and/or tumor microenvironment [Citation11]. Furthermore, some patients exhibit aggressive double-expressor DLBCLs with poor prognosis characterized by the overexpression of MYC and BCL-2 proteins [Citation12].
Most novel agents for frontline DLBCL treatment target ABC-DLBCL, via the B-cell receptor (BCR) pathway or downstream pathways. One hallmark of ABC-DLBCL is constitutive activation of the nuclear factor kappa B (NF-kB) pathway, which promotes cell viability and prevents apoptosis [Citation13]. CARD11 and BCL10, two components of this pathway, form a signaling complex upon BCR stimulation by antigen, leading to its activation, while MYD88, an adaptor protein, stimulates the NF-kB pathway via toll-like receptors (TLRs) [Citation13]. Gain-of-function mutations in CD79A/B, CARD11, and MYD88 [Citation14], or loss-of-function mutations in negative regulatory genes, such as TNFAIP3, promote cell survival and avert apoptosis [Citation15]. ABC-DLBCL patients possessing at least one of these mutations had inferior overall survival (OS) compared to those without mutations (OS: 26.0 vs. 67.0%, p = 0.03) [Citation14]. Additionally, in several B-cell lymphomas, expression of oncoprotein TCL1A, a co-activator of cell survival kinase AKT, is highly variable and may contribute to chronic activation of the NF-kB pathway [Citation16–18].
Bruton tyrosine kinase inhibitors (BTKi) impede BTK near the BCR signaling cascade and are currently approved to treat several B-cell lymphomas. Zanubrutinib (BGB-3111) is a novel, highly specific BTKi that covalently and irreversibly binds to BTKCys481, and compared to other BTKi, has minimal off-target effects that may mediate adverse events [Citation19]. Zanubrutinib shows modest antitumor activity in non-GCB-DLBCL, especially in patients with co-occurring mutations in CD79B and MYD88 [Citation20]. Because BTK bridges the activity of the BCR and NF-kB pathways central to ABC-DLBCL cell line pathogenesis, it is hypothesized that zanubrutinib may be more effective in ABC-DLBCL patients with mutations in these pathways.
Here, pooled data from four studies were examined to (1) evaluate the role of DLBCL subtype and treatment outcomes with zanubrutinib, (2) identify associations of mutations and GEP in treatment outcomes in non-GCB-DLBCL patients, and (3) explore potential mechanisms where a combined regimen of zanubrutinib and anti-CD20 antibody may improve outcomes in ABC-DLBCL cells.
Materials and methods
Study overview
One hundred twenty-one adult (≥18 years) participants with relapsed/refractory non-GCB DLBCL were enrolled in one of four phase 1/2, single-arm, multicenter studies (BGB-3111-AU-003 [NCT02343120], BGB-3111-207 [NCT03145064], BGB-3111_GA101_Study_001 [NCT02569476], BGB-3111-213 [NCT03520920]) that have been described previously (Figure S1) [Citation19–22]. Two studies (BGB-3111-AU-003, BGB-3111-207) presented zanubrutinib as monotherapy (n = 79) and two studies (BGB-3111_GA101_Study_001, BGB-3111-213) presented zanubrutinib with anti-CD20 antibodies obinutuzumab or rituximab, respectively (n = 42; Figure S1). All patients received the recommended phase 2 dose of 160 mg BID or 320 mg QD of zanubrutinib. Tumor biopsy samples were collected at screening with informed consent. All trials were approved by the Institutional Review Board or Independent Ethics Committee at each study site and conducted in accordance with applicable regulatory requirements, the principles of the Declaration of Helsinki, and Good Clinical Practice guidelines of the International Conference on Harmonization.
Exploratory endpoints included objective response rate (ORR), progression-free survival (PFS), and OS in DLBCL molecular subtypes according to the 2014 International Working Group in Non-Hodgkin Lymphoma criteria [Citation23]. Additional endpoints included the association of zanubrutinib response in non-GCB-DLBCL patients harboring genetic aberrations in genes that alter BCR and NF-kB signaling (CD79A/B, MYD88, CARD11, TNFAIP3, BCL10) as well as aberrant genes in patients with high expression of MYC and BCL2.
GEP subtyping
Fifty-six (46.3%) patients had evaluable GEP results (Figure S1). Tumors were categorized as ABC-DLBCL, GCB-DLBCL, unclassified DLBCL, or as having high expression of MYC and BCL2 using the HTG EdgeSeq DLBCL Cell of Origin Assay using RNA from FFPE samples; 92 transcripts associated with B-cell lymphomas were represented.
Targeted sequencing
DNA sequencing data were available for 79 (65.3%) patients (Figure S1). A consensus panel of 97 lymphoma-related genes from three different platforms across the original studies [Citation19–22] was utilized for mutation analyses (Figure S2 (A)). Each gene was represented by a minimal sequencing depth of 500X, limit of detection of 5%, and variant allele frequency of 5%. Briefly, for studies BGB-3111-AU003 and BGB-3111-GA101, targeted sequencing of 220 genes recurrently mutated in lymphomas was performed per manufacturer’s instructions using the FOCUS:Lymphoma NGS panel (Cancer Genetics Inc.) on FFPE samples using the Illumina Nextseq500 System to an average sequencing depth of 540×. In the China study, BGB-3111-207, targeted sequencing of 1053 genes was performed per manufacturer’s instructions using the BGI Genomics Human Tumor Care Sequencing on FFPE samples using an Illumina HiSeq4000 to an average sequencing depth of 1000×. In the China study, BGB-3111-213, targeted sequencing of 619 genes was performed using the GenePlus 619 Panel on FFPE samples on an Illumina NovoSeq 6000 sequencer to an average sequencing depth of 500×.
Data analysis
p-values are reported for descriptive purposes without multiplicity adjustment. ORR in subgroups defined by biomarkers were compared using Chi-Square (χ2) tests. Distributions of OS and PFS were estimated using the Kaplan-Meier method and compared using log-rank tests.
Transcript levels were normalized with log2 TPM (transcripts per million reads) according to HTG instrument. Comparisons using B-H-adjusted p-values ≤0.05 were regarded as significantly different. Associations of transcript levels to response (complete response [CR], partial response [PR], stable disease, progressive disease, not evaluable [NE]) were performed using Kruskal-Wallis tests. Associations between CD79B mutations and GEP were performed using Gene Set Enrichment Analysis (GSEA) using R fgsea package [Citation24] and Kyoto Encyclopedia of Genes and Genomes (KEGG) pathways.
To evaluate TCL1A expression, co-expression with other genes, and association with genetic subtypes and survival, GEP data from four studies and The Cancer Genome Atlas were analyzed (Table S1) [Citation10,Citation25–27]. Meta-analysis with Pearson’s correlation was performed using the R meta package [Citation28,Citation29]. Genes with absolute correlation coefficient (random effect in meta-analysis) >0.3 and B-H adjusted p-values of <0.01 were regarded as significant. Significant genes were analyzed for gene set or pathway enrichment using R enrichr package [Citation30] by GO_biology_Process_2021, MsigDB_Hallmark_2020, KEGG_2021_Human. GSEA was performed using R fgsea package [Citation24] and ranked by Pearson’s correlation with TCL1A.
Median GEP values (log2TPM) were used as a cutoff to discriminate between high and low expression of TCL1A (log2 TPM <12.34), TCL1A from Schmitz et al. [Citation10] (log2 TPM ≥11.59), BCL2 (log2 TPM ≥12.21), and MYC (log2 TPM ≥11.90).
The Supplemental Methods include details about cell lines and CD20 analysis.
Results
Patient demographics
The distribution of patients across monotherapy and combination therapy groups did not differ in the International Prognostic Index (IPI) (Table S2). Median follow-up time varied across studies (BGB-3111-207: 17.9 months; BGB-3111-213: 11.3 months; BGB-3111-AU-003: 20.5 months; BGB-3111-GA101-001: 25.3 months). Numbers of samples available for biomarker analysis are shown in Figure S1.
Response to zanubrutinib
The pooled ORR of non-GCB-DLBCL patients across studies (n = 121) was 29.8% (range: 22.7–35.0%; ). ORR in non-GCB-DLBCL patients was similar between monotherapy (ORR = 30.4%) and combination therapy (ORR = 28.6%) ().
Figure 1. ORR to zanubrutinib treatment across four trials. Response to zanubrutinib (A) in all non-GCB-DLBCL patients (n = 121) from (B) four individual studies shown on the horizontal axis, and (C) from pooled zanubrutinib monotherapy and zanubrutinib + anti-CD20 antibody studies. Percentage is given above each bar with the total sample size shown as n/total number of patients. Combo: combination therapy; DLBCL: diffuse large B-cell lymphoma; GCB: germinal-center B-cell-like; Mono: monotherapy; ORR: overall response rate.
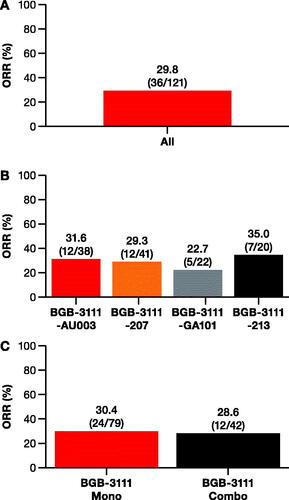
In non-GCB-DLBCL patients with GEP subtyping data available (non-GCB DLBCL: 46.3% [56/121]; verified ABC-DCBL: 87.5% [49/56]), ORR was 39.3% and comparable to the overall study population (Figure S3 (A)). ORR for confirmed ABC-DLBCL compared to GCB-DLBCL or unclassified patients was 42.9% (21/49) and 14.3% (1/7), respectively (p = 0.15; Figure S3 (B)). In non-GCB-DLBCL patients with DNA sequencing data (79/121), the unadjusted ORR was 36.7%.
Non-GCB-DLBCL patients with CD79B mutations responded better to zanubrutinib
CD79B mutations were detected in 31.6% (25/79) of patients and most (21/25, 84.0%) occurred in the immunoreceptor tyrosine-based activation motif (ITAM) region (). IPI scores were similarly distributed between patients with or without CD79B mutations (Fisher’s exact test: p = 0.62; Table S3). Patients harboring CD79B mutations exhibited significantly better response to zanubrutinib (ORR = 60.0%, 15/25) compared to the wild-type (WT) population (ORR = 25.9%, 14/54, χ2 test: p = 0.004; ). Of patients with mutations in the ITAM region, 61.9% (13/21) had a significantly better ORR to zanubrutinib compared to 27.6% (16/58) with WT or non-ITAM mutations (χ2 test: p = 0.005; ). In patients with CD79B/MYD88 double mutations, a 60% ORR (6/10) was observed, which was numerically similar to the ORR of patients with only CD79B mutations ().
Figure 2. Impact of mutations in genes regulating the BCR and NF-kB signaling pathways on zanubrutinib response. (A) Patients with mutations in CD79B (left) and patients with mutations specifically in the immunoreceptor tyrosine-based activation motif region of CD79B (center left) had a higher ORR than patients with WT alleles. While there was no significant difference in ORR between patients with MYD88L265P mutations versus other MYD88 mutations (center right), patients with co-occurring MYD88 and CD79B mutations had a better ORR than patients with WT CD79B (χ2, p = 0.04) (right). (B) Patients with mutations in negative regulators of BCR and NF-kB (BCL10, CARD11, and TNFAIP3) did not have improved ORR relative to patients with WT alleles. (C) Patients with mutations in CD79B had a longer OS (log-rank: p = 0.02), but not PFS (log-rank: p = 0.13) than patients with WT alleles. (D) No differences were observed in ORR or OS between patients who received monotherapy of zanubrutinib versus patients who received combination therapy of zanubrutinib combined with anti-CD20 antibody. BCR: B-cell receptor; Combo: combination therapy; Mono: monotherapy; Mut: mutated; ORR: overall response rate; OS: overall survival; oth: other; PFS: progression-free survival; WT: wild-type.
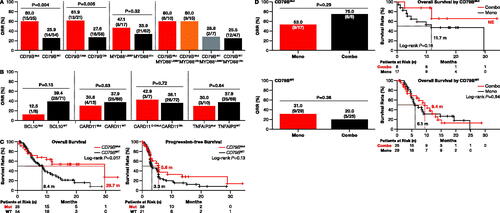
Patients with CD79B mutations treated with zanubrutinib had significantly longer median OS (29.6 months) compared to patients with WT alleles (8.4 months; log-rank: p = 0.02; ). The median PFS was numerically longer in patients with CD79B mutations (5.6 months) compared to patients with WT CD79B (3.3 months; log-rank: p = 0.13; ). Patients with CD79B mutations who received combination therapy had a similar ORR and OS compared to patients on the monotherapy regimen ().
Response to zanubrutinib in patients with BCR/NF-kB pathway mutations
Of eight patients with BCL10 mutations (four truncation, two frameshift, and two point mutations), one (12.5%) responded to zanubrutinib, whereas 28 (39.4%) patients with the WT allele responded (χ2 test: p = 0.13; ). Zanubrutinib had similar antitumor activity in patients with CARD11 mutations (4/13, 30.8%) as compared to patients with WT tumors (25/66, 37.9%; χ2 test: p = 0.63; ).
MYD88L265P mutations were identified in 21.5% (17/79) of non-GCB-DLBCL patients. However, response rates were not different (χ2 test: p = 0.32) between tumors with MYD88L265P mutations (8/17; 47.1% ORR) and those with non-L265P MYD88 mutations (21/62; 33.9% ORR) (). Patients with a CD79B mutation, either alone or co-occurring with MYD88L265P, were more responsive to zanubrutinib versus patients with WT CD79B (χ2 test: p = 0.04; ).
Mutations in TNFAPI3 were observed in 12.7% (10/79) of patients. Non-GCB-DLBCL patients with TNFAIP3 mutations demonstrated a similar response to zanubrutinib compared to patients with the WT allele, with an ORR of 30 and 37.7%, respectively (χ2 test: p = 0.64; ).
High TCL1A-expressing non-GCB-DLBCL patients responded better to zanubrutinib
Expression levels of seven genes (TCL1A [p = 0.001], FOXP1 [p < 0.01], PAX5 [p = 0.02], CD79A [p = 0.02], CD37 [p = 0.02], BCL2 [p = 0.03], CCND2 [p = 0.04]) were significantly associated with better CR/PR and eight genes were associated with improved PFS (TCL1A [p < 0.001], PAX5 [p < 0.001], FOXP1 [p < 0.01], RPL19 [p < 0.01], CD37 [p < 0.01], BCL2 [p = 0.04], CD8A [p = 0.04], CD79A [p = 0.05]; Table S4).
Compared to patients with low TCL1A expression, patients with high expression demonstrated better ORR (53.6% [15/28] vs. 25.0% [7/28], χ2 test: p = 0.03), longer median PFS (5.5 vs. 2.5 months, log-rank: p = 0.01), and numerically longer OS (11.8 vs. 4.8 months, log-rank, p = 0.12) (). Further analysis revealed significantly different TCL1A expression in groups with different best overall responses where CR or PR patients exhibited higher TCL1A expression (Kruskal-Wallis test: p = 0.002; ).
Figure 3. Correlation of TCL1A gene expression with zanubrutinib. (A) Pooled results from all four studies (n = 56) demonstrate that patients with high TCL1A expression had higher ORR than patients with low TCL1A expression (χ2 test, p = 0.03; top left). Patients with high TCL1A expression had better PFS (log-rank: p = 0.01) but showed no difference in OS (log-rank: p = 0.12) (bottom-center panels). Patients with higher TCL1A expression had a better BoR where CR or PR patients exhibited higher TCL1A expression (Kruskal-Wallis test, p < 0.01; top right). (B) In pooled results from zanubrutinib monotherapy studies (n = 44), patients with higher TCL1A expression had better ORR (χ2, p = 0.05; top left), better PFS (log-rank: p < 0.01; bottom left), and better OS (log-rank: p = 0.06; bottom right). Higher TCL1A transcript levels among responders were indicative of better BoR (Kruskal-Wallis test: p < 0.01; top right). (C) Pooled results from combination zanubrutinib and CD20 antibody studies (n = 12) also demonstrated that patients with high TCL1A levels had better ORR (χ2, p = 0.03; top), but not PFS (log-rank: p = 0.58; bottom left) or OS (log-rank: p = 0.95; bottom right). ABC: activated B cell; BoR: best overall response; CR: complete response; GCB: germinal-center B-cell-like; NE: not evaluable; ORR: overall response rate; OS: overall survival; PD: progressive disease; PFS: progression-free survival; PR: partial response; SD: stable disease.
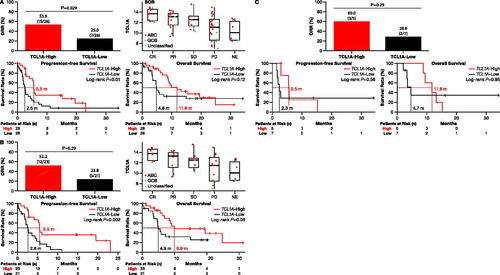
Among patients administered zanubrutinib as monotherapy (n = 44; ), TCL1A high-expressing patients had better response compared to low-expressing patients (ORR: 52.2 vs. 23.8%; χ2 test: p = 0.05) with longer survival (PFS: 5.5 vs. 2.6 months, p = 0.002; OS: 9.9 vs. 4.9 months, p = 0.06) (). Patients on combination therapy (n = 12; ) with high TCL1A expression demonstrated significantly better ORR (3/5, 60.0%) compared with low-expressing patients (2/7, 28.6%; χ2 test: p = 0.03); no differences in PFS or OS were observed between these groups (PFS: 5.5 vs. 2.3 months, p = 0.60; OS: 11.8 vs. 4.7 months, p = 0.95) (). No correlation between TCL1A expression and CD79B mutations was observed (Kruskal-Wallis test: p = 0.65; Figure S5).
To further characterize TCL1A transcript levels, we re-analyzed data from Schmitz et al. [Citation10] (n = 562) to reveal a bimodal distribution of TCL1A expression, where significantly higher expression was observed in ABC-DLBCL compared to GCB- or unclassified DLBCL (Kruskal-Wallis test: p < 0.001; ). Notably, significantly higher TCL1A expression was observed in MCD [Citation10], MYD88/CD79B-mutated DLBCL (Kruskal-Wallis test: p < 0.0001) ().
Figure 4. Characterization of high TCL1A expression in DLBCL. (A) High TCL1A expression was associated with COO subtyping groups (Kruskal-Wallis: p < 0.001; left) and genetic subtypes (Kruskal-Wallis: p < 0.0001; center). (B) KEGG analysis of genes enriched in high-expressing TCL1A patients. (C) Survival analysis based on TCL1A expression demonstrated that patients with high TCL1A expression had lower PFS and lower OS relative to patients with low TCL1A expression in ABC-DLBCL patients given frontline treatment. ABC: activated B cell; COO: cell of origin; DLBCL: diffuse large B-cell lymphoma; GCB: germinal-center B-cell-like; NE: not evaluable; OS: overall survival; PFS: progression-free survival.
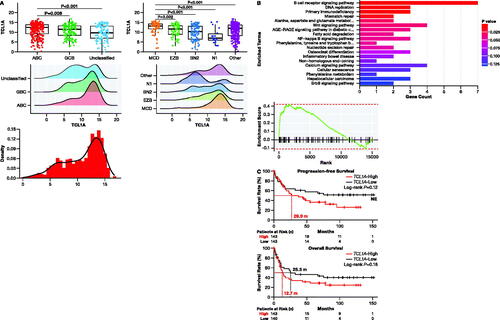
KEGG pathway and GSEA analysis (Normalized Enrichment Score = 1.70, p < 0.01) on data from four studies (Table S2) [Citation10,Citation25,Citation31] revealed that high TCL1A expression was enriched in the BCR signaling pathway () and 21 leading-edge genes were identified: CD79B, CD72, CARD11, NFATC1, CD79A, SYK, BLNK, INPP5D, PRKCB, CD19, LYN, PIK3CA, MAPK1, AKT2, VAV3, PLCG2, RASGRP3, PIK3AP1, PIK3CG, NFATC3, and BTK.
Further analysis of data from Schmitz et al. [Citation10] revealed that high TCL1A expression (log2 TPM ≥11.59) is indicative of a worse prognosis in ABC-DLBCL (). Patients with high TCL1A expression had lower PFS (26.9 months vs. NE) and lower OS (12.7 vs. 25.3 months) relative to patients with low TCL1A expression ().
High MYC/BCL2 expression and zanubrutinib response
Non-GCB-DLBCL patients (n = 56) with high BCL2 expression had higher ORR (57.1 vs. 21.4%, Fisher’s exact test: p < 0.01); BCL2 expression was significantly higher among responders (Kruskal-Wallis test: p = 0.02; ). Median PFS was longer in high-expressing patients (5.3 months) versus patients with low BCL2 expression (2.8 months, log-rank: p = 0.03), and OS was numerically longer in high- (9.9 months) versus low-expressing patients (6.1 months, log-rank: p = 0.21; ). No correlation was observed between high expression of only MYC and response to zanubrutinib treatment (χ2 test: p = 0.27; ). MYC expression was similar between responder and non-responder patients (Kruskal-Wallis test: p = 0.41; ).
Figure 5. Correlation of high expression of BCL2/MYC and zanubrutinib response. (A) Patients with high BCL2 expression had significantly higher ORR (Fisher’s exact test: p = 0.006; top left) and longer PFS (log-rank: p = 0.03; bottom left) compared to patients with low BCL2 expression. Expression of BCL2 was significantly higher among responders (Kruskal-Wallis test: p = 0.02; top right), and the OS was longer in high- vs. low-expressing patients (log-rank: p = 0.21; bottom right). (B) No correlation was observed between high expression of only MYC and response to zanubrutinib treatment (χ2 test: p = 0.27; left). MYC expression was similar between responder and non-responder patients (Kruskal-Wallis test: p = 0.41; right). (C) In patients with high expression of both BCL2 and MYC, ORR higher than in patients with low expression of these genes (60.0 vs. 28.6%, Fisher’s exact test: p = 0.0.02; top); survival outcomes were similar (median PFS: 5.4 vs. 3.6 months, log-rank: p = 0.16; median OS: 9.9 vs. 7.3 months, log-rank: p = 0.32; bottom. ABC: activated B cell; CR: complete response; DLBCL: diffuse large B-cell lymphoma; GCB: germinal-center B-cell-like; NE: not evaluable; ORR: overall response rate; OS: overall survival; Other: patients without high expression of both BLC2 and MYC; PD: progressive disease; PFS: progression-free survival; PR: partial response; SD: stable disease.
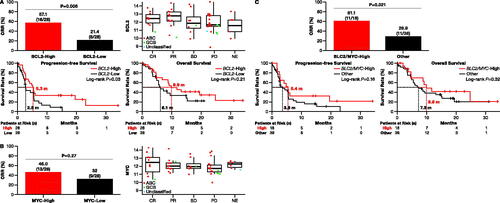
Among 56 patients, 18 (32%) had high expression of both BCL2 and MYC; 61% of these patients were more responsive to zanubrutinib treatment (ORR: 61.1 vs. 28.9%, Fisher’s exact test: p = 0.021; ) but had similar survival outcomes (median PFS: 5.4 vs. 3.6 months, log-rank: p = 0.16; median OS: 9.9 vs. 7.3 months, log-rank: p = 0.32; ) compared to patients with low expression of BLC2 and MYC.
Anti-CD20 antibody may synergize with zanubrutinib
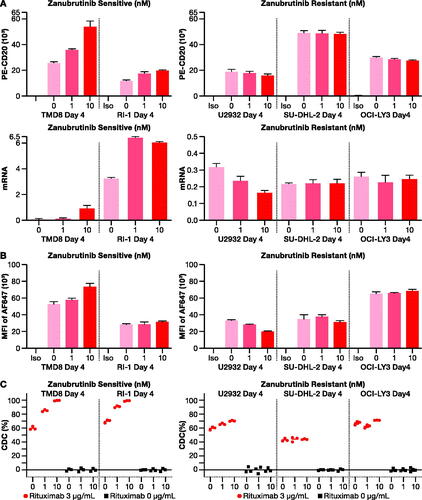
To explore potential mechanisms where a combined regimen of zanubrutinib and anti-CD20 antibody could improve outcomes in ABC-DLBCL cells, flow cytometric analysis was performed on zanubrutinib-sensitive (TMD8, RI-1) and zanubrutinib-resistant (U2932, SU-DHL-2, OCI-LY3) cell lines. A direct proportionality was observed between zanubrutinib concentration (0, 1, and 10 nM) and CD20 receptor density and CD20 mRNA in zanubrutinib-sensitive ABC-DLBCL cells, but not in zanubrutinib-resistant cells (). Zanubrutinib increased the binding of rituximab to CD20 receptors () and boosted rituximab-mediated complement-dependent cytotoxicity (CDC) in zanubrutinib-sensitive ABC-DLBCL cells ().
Figure 6. In vitro analysis of synergistic effects of rituximab with zanubrutinib. (A) CD20 receptor density (top panel) and mRNA expression (bottom panel) increased upon exposure to increasing concentration of zanubrutinib in zanubrutinib-sensitive cell lines (left), but not in zanubrutinib-resistant cell lines (right). (B) Rituximab binding increased with increasing concentration in zanubrutinib-treated cells (left), but not in zanubrutinib-resistant cell lines (right). (C) Treatment with zanubrutinib increased rituximab-mediated complement-dependent cytotoxicity as exemplified by data from five donors. CDC: complement-dependent cytotoxicity.
Discussion
In this study, responsiveness of non-GCB-DLBCL patients to zanubrutinib, effects of gene mutations in the BCR pathway, and potential mechanisms where combined zanubrutinib and CD20 antibody treatment may improve outcomes in ABC-DLBCL cells were evaluated. A higher, though not statistically significant (p = 0.15), ORR in patients with confirmed ABC-DLBCL compared to patients with GCB- or unclassified DLBCL was possibly due to the small number of non-ABC-DLBCL patients; enrollment targeted non-GCB-DLBCL patients.
Most non-GCB-DLBCL samples contained gain-of-function mutations in the CD79B subunit of BCR in the ITAM region. Such mutations are reported to enhance cell surface BCR expression by inhibiting receptor-mediated endocytosis [Citation32]. Like treatment with the BTKi ibrutinib [Citation31], tumors in this study with CD79B mutations responded more frequently to zanubrutinib versus CD79B WT tumors. Still, 25.9% of tumors with WT CD79B also responded to zanubrutinib, consistent with a previous study where 31.0% of tumors with WT CD79B responded to ibrutinib [Citation31], suggesting a possible undefined genetic pathway or non-genetic mechanism leading to BCR pathway dependency in these patients [Citation31].
Mutations in MYD88 create isoforms that constitutively activate the NFKB pathway. Here, mutations in MYD88 alone did not confer significantly different response rates to zanubrutinib. Wilson et al. [Citation31] reported response rates to ibrutinib in MYD88-mutated versus WT tumors (33.3 vs. 40.0%, p = 0.49), where co-occurrence of MYD88 and CD79B tumors conferred better response to ibrutinib (80.0%, p = 0.06). Although tumors with CD79B mutations, either alone or in combination with MYD88 mutations, that disrupt the BCR signaling pathway appear to be more sensitive to zanubrutinib, insensitivity of MYD88-only mutations to BTKi suggests a second pathway that is independent of BCR, but dependent on TLRs and the MYD88 pathway [Citation31].
Constitutive activation of the NF-kB pathway in ABC-DLBCL is often due to mutations [Citation33], yet here, as also shown in ibrutinib treatment [Citation31], response rates were not significantly different between patients with mutated CARD11, BCL10, or TNFAIP3 versus patients with WT alleles. Additionally, though co-expression of BCL2/MYC is more common in ABC-DLBCL and is associated with inferior outcomes to R-CHOP [Citation34], in this study, better response rates and survival times were observed in patients with high BCL2 expression and/or high BCL2/MYC co-expression. Similarly, in patients with relapsed/refractory non-GCB double-expressor lymphoma who were treated with ibrutinib, the ORR was 60% [Citation35] and the PHOENIX trial reported that double-expressor patients were more sensitive to ibrutinib with R-CHOP [Citation36].
In this study, high TCL1A expression in DLBCL patients was positively correlated with improved response to zanubrutinib. Although high expression of TCL1A in non-GCB-DLBCL has been associated with a worse prognosis, the reason is poorly understood [Citation17]. In our reanalysis of data from another study that examined the response of patients with DLBCL to ibrutinib, patients with higher TCL1A expression responded better and had longer PFS compared to low-expressing patients (p = 0.06) [Citation31]. Further, all ABC-DLBCL patients with CR to ibrutinib revealed higher TCL1A expression. Combined, data from this study and our reanalysis of data from Wilson et al. [Citation31] suggest that non-GCB-DLBCL patients with high TCL1A expression may respond more favorably to BTKi.
TCL1A functions as a co-activator of AKT kinase and mediates normal cell growth and survival signals, but dysregulation can lead to lymphomagenesis and cancer progression [Citation16]. The way that high TCL1A expression contributes to poor prognosis in DLBCL is not well understood [Citation16,Citation17]. In malignant T cells, a chromosomal translocation (14q31.2) results in TCL1A regulation by T-cell receptor enhancer elements [Citation37], but the cause of aberrant expression of TCL1A in DLBCL is still unknown. Non-GCB-DLBCL is characterized by chronic BCR signaling via oncogenic cross-talk between MYD88 and constitutively active BCR, making the tumor cells highly dependent on BTK to chronically activate the NF-kB pathway [Citation38]. Over-expressed TCL1A may lead to phosphorylation of AKT and phosphorylation of downstream targets, resulting in constitutively activated NF-kB signaling [Citation18]. Inhibition of targets upstream of AKT may help ameliorate these effects, though further studies are needed.
In this pooled analysis of four studies, the addition of anti-CD20 antibody to zanubrutinib in non-GCB-DLBCL patients did not confer a significantly better response rate, consistent with a recent report where similar ORR was observed between patients administered ibrutinib as a monotherapy versus in combination with rituximab [Citation39]. However, Yu et al. 2021 demonstrated that adding rituximab to orelabrutinib, a second-generation BTKi, restrained tumor growth in TMD8 cell lines by 99.2% compared to 30.2% when only treated with orelabrutinib [Citation40]. In patients who received combination therapy, no differences in ORR or OS were observed between patients with CD79B mutations and patients with WT CD79B. Further, patients with high TCL1A expression responded better to a combination regimen versus those with lower TCL1A expression. In vitro, zanubrutinib with rituximab synergistically upregulated the expression of CD20 receptor density in zanubrutinib-sensitive cell lines, leading to the increased rituximab binding and tumor-killing effect of rituximab by CDC. Rituximab may potentially synergize with zanubrutinib in ABC-DLBCL cells that are sensitive to zanubrutinib treatment.
In conclusion, these results provide evidence that zanubrutinib has clinical benefits in non-GCB-DLBCL patients with mutated CD79B, co-expressor (BCL2/MYC) DLBCL, or high expression of TCL1A. Nevertheless, the study was limited due to its retrospective design, small sample size, variable follow-up times, and use of different mutation analysis platforms. Further randomized, prospective clinical trials will aid in clarifying the conclusions of this study. These data provide a foundation for developing tailored therapy for the treatment of DLBCL and suggest a more favorable outcome for zanubrutinib therapy in some patients with non-GCB-DLBCL.
Supplemental Material
Download PDF (552.5 KB)Acknowledgments
The authors wish to thank the study patients, their supporters, the investigators, and the clinical research staff at the study centers. Results of TCL1A analysis were partly based upon data generated by the TCGA Research Network: https://www.cancer.gov/tcga.
Disclosure statement
All authors are employees of and hold stocks/shares in BeiGene Co.
Data availability statement
BeiGene voluntarily shares anonymous data on completed studies responsibly and provides qualified scientific and medical researchers access to anonymous data and supporting clinical trial documentation for clinical trials in dossiers for medicines and indications after submission and approval in the United States, China, and Europe. Clinical trials supporting subsequent local approvals, new indications, or combination products are eligible for sharing once corresponding regulatory approvals are achieved. BeiGene shares data only when permitted by applicable data privacy and security laws and regulations. In addition, data can only be shared when it is feasible to do so without compromising the privacy of study participants. Qualified researchers may submit data requests/research proposals for BeiGene review and consideration through BeiGene’s Clinical Trial Webpage at https://www.beigene.com/our-science-and-medicines/our-clinical-trials/.
References
- Habermann TM, Weller EA, Morrison VA, et al. Rituximab-CHOP versus CHOP alone or with maintenance rituximab in older patients with diffuse large B-cell lymphoma. J Clin Oncol. 2006;24(19):3121–3127. doi:10.1200/JCO.2005.05.1003
- Chaganti S, Illidge T, Barrington S, et al. Guidelines for the management of diffuse large B‐cell lymphoma. Br J Haematol. 2016;174(1):43–56. doi:10.1111/bjh.14136
- Teras LR, Desantis CE, Cerhan JR, et al. 2016 US lymphoid malignancy statistics by world health organization subtypes. CA Cancer J Clin. 2016;66(6):443–459. doi:10.3322/caac.21357
- Al‐Hamadani M, Habermann TM, Cerhan JR, et al. Non‐Hodgkin lymphoma subtype distribution, geodemographic patterns, and survival in the US: a longitudinal analysis of the national cancer data base from 1998 to 2011. Am J Hematol. 2015;90(9):790–795. doi:10.1002/ajh.24086
- Morrison VA, Shou Y, Bell JA, et al. Evaluation of treatment patterns and survival among patients with diffuse large B-cell lymphoma in the USA. Future Oncol. 2019;15(9):1021–1034. doi:10.2217/fon-2018-0788
- Friedberg JW. Relapsed/refractory diffuse large B-cell lymphoma. Hematology Am Soc Hematol Educ Program. 2011;2011(1):498–505. doi:10.1182/asheducation-2011.1.498
- Alizadeh AA, Eisen MB, Davis RE, et al. Distinct types of diffuse large B-cell lymphoma identified by gene expression profiling. Nature. 2000;403(6769):503–511. doi:10.1038/35000501
- Rosenwald A, Wright G, Chan WC, et al. The use of molecular profiling to predict survival after chemotherapy for diffuse large-B-cell lymphoma. N Engl J Med. 2002;346(25):1937–1947. doi:10.1056/NEJMoa012914
- Swerdlow SH, Campo E, Pileri SA, et al. The 2016 revision of the world health organization classification of lymphoid neoplasms. Blood. 2016;127(20):2375–2390. doi:10.1182/blood-2016-01-643569
- Schmitz R, Wright GW, Huang DW, et al. Genetics and pathogenesis of diffuse large B-cell lymphoma. N Engl J Med. 2018;378(15):1396–1407. doi:10.1056/NEJMoa1801445
- Wright GW, Huang DW, Phelan JD, et al. A probabilistic classification tool for genetic subtypes of diffuse large B cell lymphoma with therapeutic implications. Cancer Cell. 2020;37(4):551–568.e14. doi:10.1016/j.ccell.2020.03.015
- Nowakowski GS, Czuczman MS. ABC, GCB, and double-hit diffuse large B-cell lymphoma: does subtype make a difference in therapy selection? American Society of Clinical Oncology Educational Book American Society of Clinical Oncology Annual Meeting; 2015. p. e449–e457. doi:10.14694/EdBook_AM.2015.35.e449
- Turturro F. Constitutive NF-κB activation underlines major mechanism of drug resistance in relapsed refractory diffuse large B cell lymphoma. Biomed Res Int. 2015;2015:484537. doi:10.1155/2015/484537
- Bohers E, Mareschal S, Bouzelfen A, et al. Targetable activating mutations are very frequent in GCB and ABC diffuse large B-cell lymphoma. Genes Chromosomes Cancer. 2014;53(2):144–153. doi:10.1002/gcc.22126
- Shembade N, Ma A, Harhaj EW. Inhibition of NF-kappaB signaling by A20 through disruption of ubiquitin enzyme complexes. Science. 2010;327(5969):1135–1139. doi:10.1126/science.1182364
- Stachelscheid J, Jiang Q, Herling M. The modes of dysregulation of the proto-oncogene T-cell leukemia/lymphoma 1A. Cancers. 2021;13(21):5455. doi:10.3390/cancers13215455
- Gao HX, Li SJ, Niu J, et al. TCL1 as a hub protein associated with the PI3K/AKT signaling pathway in diffuse large B-cell lymphoma based on proteomics methods. Pathol Res Pract. 2020;216(2):152799. doi:10.1016/j.prp.2019.152799
- Laine J, Künstle G, Obata T, et al. The protooncogene TCL1 is an Akt kinase coactivator. Mol Cell. 2000;6(2):395–407. doi:10.1016/s1097-2765(00)00039-3
- Tam CS, Quach H, Nicol A, et al. Zanubrutinib (BGB-3111) plus obinutuzumab in patients with chronic lymphocytic leukemia and follicular lymphoma. Blood Adv. 2020;4(19):4802–4811. doi:10.1182/bloodadvances.2020002183
- Tam CS, Lamanna N, O'Brien SM, et al. Zanubrutinib monotherapy for relapsed or refractory non-germinal center diffuse large B-cell lymphoma. Curr Med Res Opin. 2022;6(6):1–7. doi:10.1182/bloodadvances.2020003698
- Tam CS, Trotman J, Opat S, et al. Phase 1 study of the selective BTK inhibitor zanubrutinib in B-cell malignancies and safety and efficacy evaluation in CLL. Blood. 2019;134(11):851–859. doi:10.1182/blood.2019001160
- Trotman J, Opat S, Gottlieb D, et al. Zanubrutinib for the treatment of patients with Waldenström macroglobulinemia: 3 years of follow-up. Blood. 2020;136(18):2027–2037. doi:10.1182/blood.2020006449
- Cheson BD, Fisher RI, Barrington SF, et al. Recommendations for initial evaluation, staging, and response assessment of Hodgkin and non-Hodgkin lymphoma: the Lugano classification. J Clin Oncol. 2014;32(27):3059–3068. doi:10.1200/JCO.2013.54.8800
- Korotkevich G, Sukhov V, Budin N, et al. Fast gene set enrichment analysis. Cold Spring Harbor Laboratory, Cold Spring Harbor, NY, USA 2016.
- Kuo H-P, Ezell SA, Schweighofer KJ, et al. Combination of ibrutinib and ABT-199 in diffuse large B-cell lymphoma and follicular lymphoma. Mol Cancer Ther. 2017;16(7):1246–1256. doi:10.1158/1535-7163.MCT-16-0555
- Roider T, Seufert J, Uvarovskii A, et al. Dissecting intratumour heterogeneity of nodal B-cell lymphomas at the transcriptional, genetic and drug-response levels. Nat Cell Biol. 2020;22(7):896–906. doi:10.1038/s41556-020-0532-x
- Steen CB, Luca BA, Esfahani MS, et al. The landscape of tumor cell states and ecosystems in diffuse large B cell lymphoma. Cancer Cell. 2021;39(10):1422–1437.e10. doi:10.1016/j.ccell.2021.08.011
- Balduzzi S, Rücker G, Schwarzer G. How to perform a meta-analysis with R: a practical tutorial. Evid Based Ment Health. 2019;22(4):153–160. doi:10.1136/ebmental-2019-300117
- R Core Team (2017). R: A Language and Environment for Statistical Computing. R Foundation for Statistical Computing, Vienna, Austria. https://www.R-project.org.
- Radke J, Ishaque N, Koll R, et al. The genomic and transcriptional landscape of primary central nervous system lymphoma. Nat Commun. 2022;13(1):2558. doi:10.1038/s41467-022-30050-y
- Wilson WH, Young RM, Schmitz R, et al. Targeting B cell receptor signaling with ibrutinib in diffuse large B cell lymphoma. Nat Med. 2015;21(8):922–926. doi:10.1038/nm.3884
- Davis RE, Ngo VN, Lenz G, et al. Chronic active B-cell-receptor signalling in diffuse large B-cell lymphoma. Nature. 2010;463(7277):88–92. doi:10.1038/nature08638
- Compagno M, Lim WK, Grunn A, et al. Mutations of multiple genes cause deregulation of NF-κB in diffuse large B-cell lymphoma. Nature. 2009;459(7247):717–721. doi:10.1038/nature07968
- Li L, Li Y, Que X, et al. Prognostic significances of overexpression MYC and/or BCL2 in R-CHOP-treated diffuse large B-cell lymphoma: a systematic review and meta-analysis. Sci Rep. 2018;8(1):6267. doi:10.1038/s41598-018-24631-5
- Landsburg DJ, Hughes ME, Koike A, et al. Outcomes of patients with relapsed/refractory double-expressor B-cell lymphoma treated with ibrutinib monotherapy. Blood Adv. 2019;3(2):132–135. doi:10.1182/bloodadvances.2018026401
- Johnson PWM, Balasubramanian S, Hodkinson B, et al. Clinical impact of ibrutinib plus R-CHOP in untreated DLBCL coexpressing BCL2 and MYC in the phase 3 PHOENIX trial. Blood Adv. 2023;7(10):2008–2017. doi:10.1182/bloodadvances.2022009389
- Paduano F, Gaudio E, Mensah AA, et al. T-cell leukemia/lymphoma 1 (TCL1): an oncogene regulating multiple signaling pathways [perspective]. Front Oncol. 2018;8:317. doi:10.3389/fonc.2018.00317
- Wilson WH, Wright GW, Huang DW, et al. Effect of ibrutinib with R-CHOP chemotherapy in genetic subtypes of DLBCL. Cancer Cell. 2021;39(12):1643–1653.e3. doi:10.1016/j.ccell.2021.10.006
- Burger JA, Sivina M, Jain N, et al. Randomized trial of ibrutinib vs ibrutinib plus rituximab in patients with chronic lymphocytic leukemia. Blood. 2019;133(10):1011–1019. doi:10.1182/blood-2018-10-879429
- Yu H, Wang X, Li J, et al. Addition of BTK inhibitor orelabrutinib to rituximab improved anti-tumor effects in B cell lymphoma. Mol Ther Oncolytics. 2021;21:158–170. doi:10.1016/j.omto.2021.03.015