
 ?Mathematical formulae have been encoded as MathML and are displayed in this HTML version using MathJax in order to improve their display. Uncheck the box to turn MathJax off. This feature requires Javascript. Click on a formula to zoom.
ABSTRACT
ICT-intensive firms are often found to have a better performance than their non-ICT-intensive counterparts. Along with investing in ICT capital they have to adapt their production and business processes in order to reap the potentials implied by the use of ICT. Are these firms also more resilient in times of crisis? We study this question by exploiting a novel and unique data set from the Micro Moments Database. Covering 12 countries, 7 industries and the period from 2001 to 2010, the data allow us to distinguish between ICT-intensive and non-ICT-intensive firms within industries. We find evidence that indeed during the crisis in 2008 and 2009, ICT-intensive firms were hit less hard with respect to their productivity. This holds in particular for firms from service industries. Moreover, ICT-intensive firms were also more successful in introducing process innovations during that period which could explain their better productivity performance compared to non-ICT intensive firms.
1. Introduction
An economic crisis comes with huge economic and social costs such as firm exits, unemployment and lower productivity. To reduce these costs it is important to understand what makes firms, industries and countries more resilient, i.e. what fosters their ability to resist to shocks and to recover quickly afterwards.Footnote1 ICT may be one, especially potent, source of firms' resilience. It has been shown to be a general purpose technology (Bresnahan and Trajtenberg Citation1995; Jovanovic and Rousseau Citation2005 as well as Van Ark and Inklaar Citation2005) facilitating both product and process innovations as well as spurring (longer-term) productivity growth. Specifically, firms using ICT in a clever way may be able to deal with economic shocks more flexibly through easier reorganization of their production processes, i.e. through process and organizational innovations, and that way possibly can achieve a higher productivity and competitiveness, while firms lagging in the adoption of new technology face the risk of being driven out of the market.
To provide evidence on the potential role of ICT for firms' resilience, here rather narrowly defined as firms' ability to keep productivity up during times of crisis, we exploit a novel and unique dataset: the Micro Moments Database (MMD). It comprises information at the meso-level for 12 countries and 7 industries and allows us going beyond the traditional growth accounting setting where industries – rather than firms – are classified according to their intensity of ICT usage. Instead, the MMD focuses more on the firm level distribution and on heterogeneity within industries, allowing us to study more detailed aggregates by firm characteristics such as ICT intensity.
Our analysis comprises three steps. In a first step, the data are analysed descriptively comparing productivity levels and growth rates as well as innovation rates during the economic crisis with the pre-crisis period. In a second step, we apply the analytical framework of production functions relating firms' productivity in levels and growth rates to ICT intensity. A difference-in-differences approach (see for instance McGuckin and Stiroh Citation2001 and Stiroh Citation2002) allows identifying significant differences with respect to the productivity contribution of firms' ICT intensity during the economic crisis compared to the period before the crisis. In a third step, we analyse the contribution of ICT intensity to firms' innovation output measured as product innovation and process innovation.
The empirical results support our hypothesis that ICT-intensive firms, especially from service industries, indeed were hit less hard by the economic crisis. Their productivity level and growth hardly decreased during the period 2008–2009 whereas non-ICT-intensive firms experienced a strong reduction in productivity. Also, ICT-intensive firms became relatively more innovative in terms of realizing process innovations. This latter finding fits to the hypothesis that ICT allow firms to adjust their production processes in times of crisis and in that way allow them to cope better with the increased competitive pressure during an economic crisis. Our paper contributes to the literature in two ways: Firstly, we provide first evidence on the role of ICT for the resilience of firms and countries in times of an economic crisis. Such knowledge is important for economic policy that is in search for strategies to improve resilience towards potential future crises. Secondly, we contribute to the wider literature on ICT and productivity by illustrating the benefits of micro-aggregated industry data, which so far has not been used to study the ICT-productivity relationship.
The paper is structured as follows: Section 2 summarizes the related literature. Section 3 introduces the MMD database, describes our estimation sample and presents descriptive evidence on the relationship between ICT and performance during the crisis. Section 4 lays out our analytical framework and presents our estimation results. Finally, Section 5 concludes.
2. Literature
The link between productivity and ICT has been studied extensively both at the macro- and micro-level. At the macro- or industry-level, there exist studies using either single- or multiple-country data (e.g. Jorgenson and Stiroh Citation1999; Stiroh Citation2002; Van Ark, O'Mahony, and Timmer Citation2008; Jorgenson and Timmer Citation2011). In contrast, at the micro-level so far most studies are conducted based on data for a single country (see the surveys by Draca, Sadun, and Van Reenen Citation2007; Bertschek Citation2012; Cardona, Kretschmer, and Strobel Citation2013). The reason for this gap is the scarcity of data which would allow for cross-country micro-level studies.Footnote2 Finally, more recently, studies, such as ours, started using meso-level data sets, like the Micro Moments Database (see e.g. Bartelsman, van Leeuwen, and Polder Citation2016), which allow in a cross-country setting focusing more on the firm level and on heterogeneity within industries and which allow studying more detailed aggregates by firm characteristics such as ICT intensity.
The ICT-productivity literature shows that the measured size of the contributions of ICT to productivity seems to depend on the available data and on the methodology used. In particular, the evidence on excess returns to ICT compared to other capital is mixed (O'Mahony and Vecchi Citation2005; Draca, Sadun, and Van Reenen Citation2007). Moreover, there are different routes how ICT may affect firm performance. An important link between ICT and productivity is innovation. As so-called general purpose technologies (Bresnahan and Trajtenberg Citation1995; Jovanovic and Rousseau Citation2005), ICT diffuse throughout the whole economy and enable innovation in adopting firms and sectors (see, e.g. Brynjolfsson and Saunders Citation2010; Brynjolfsson and McAfee Citation2011) leading to higher productivity. Hall, Lotti, and Mairesse (Citation2013), for example, consider investment in ICT and in research and development (R&D) as potential sources of innovation which in turn may enhance labor productivity. Based on Italian firm-level data they show that R&D and ICT contribute directly to labor productivity but also indirectly through enabling innovation, the latter result confirming the findings in Polder, van Leeuwen, and Mohnen (Citation2010). Empirical evidence also shows that the relationship between ICT and firm performance is heterogeneous with respect to firms and industries, i.e. some firms or industries are more successful in exploiting ICT than others. Chun et al. (Citation2008), for instance, analyse the relationship between ICT intensity and performance heterogeneity for a panel of U.S. firms from 1971 to 2000. They find that heterogeneity in firm performance (i.e. variability in stock return and sales growth) is positively and significantly correlated with ICT intensity (measured as ICT capital relative to total capital) and that firm heterogeneity is associated with faster productivity growth at the industry level. They consider this result as evidence of creative destruction (i.e. increased competition) at the firm level. That is, through their use of ICT, more productive firms displace less productive firms. In a more recent and related paper, Chun, Ha, and Kim (Citation2014) demonstrate that firm heterogeneity leads to more R&D investment which in turn leads to higher long-run growth.
Besides leading to increased heterogeneity in firm performance, ICT itself is a heterogeneous concept. Some studies take account of this fact and analyse the effects of ICT infrastructure or of specific types of ICT. For the case of broadband infrastructure, for example, Grimes, Ren, and Stevens (Citation2012) find for New Zealand that firms with broadband internet have a significantly higher labor productivity. By contrast, Bertschek, Cerquera, and Klein (Citation2013) find a positive and significant effect of broadband internet on German firms' innovation activity but not on their labor productivity. The results by Polder, van Leeuwen, and Mohnen (Citation2010) for the Netherlands suggest that broadband internet is particularly important for the innovative activities of services firms. Engelstaetter (Citation2013), using German firm-level data, reveals that productivity gains based on enterprise system usage can be maximized by jointly employing three widely established enterprise software systems, i.e. Enterprise Resource Planning (ERP), Supply Chain Management (SCM), and Customer Relationship Management (CRM).
Up until now, there is no analysis explaining whether ICT-induced productivity gains help firms enduring or surviving the recent European economic and financial crisis. Given that ICT capital deepening was responsible for up to 27 % of the increase in European labor productivity in the beginning of this century (Van Ark and Inklaar Citation2005) it seems natural to consider its potential for fostering recovery. Our work aims at providing evidence on this issue based on micro-aggregated data.
3. Data
This section describes the MMD, the sample we derive from it and presents first descriptive evidence on the role of ICT for the resilience of firms during a period of economic crisis.
3.1. The MMD
The data used in this study come from the MMD.Footnote3 The MMD has been created through a series of international collaborative projects of national statistical offices.Footnote4 In each country the following firm-level data sets were linked: the Community Innovation Surveys, (below called IS), the Survey on ICT usage and e-commerce in enterprises (EC), the Structural Business Survey or Production Survey (PS) and the underlying business register (BR). Using the linked firm-level data a common computer code was used to create aggregated data at the industry level and combined it into a harmonized cross-country database. The database includes measures of ICT usage and innovative activity together with measures of business performance, various firm characteristics and industry dynamics. A big advantage and unique feature of the database is that it not only provides industry-level aggregates but also contains aggregates created for subsets of firms within an industry, such as e.g. firms using ICT more or less intensively.Footnote5 Although other breakdowns are available, for the empirical applications in this paper we mainly exploit this distinction between ICT-intensive and non-ICT-intensive firms and compare their developments over time.
Our empirical analysis consists of two parts: in the first part, we compare firms' productivity developments, in the second part we compare firms' innovation activity. The productivity analysis is based on a combined sample of firms surveyed both within the Production Survey (PS) and the Survey on ICT usage and e-commerce in enterprises (EC). Our sample covers up to 12 countries (AT, DE, DK, FI, FR, IE, IT, NL, NO, SE, SI, UK), seven industries, namely ‘Electrical machinery, post and communication services’ (Elecom), ‘Consumer manufacturing’ (ConsG), ‘Intermediate manufacturing’ (IntmdG), ‘Investment goods, excluding hightech’ (InvesG), ‘Distribution’ (Distr), 'Finance and business, except real estate' (FinBu), ‘Personal services’ (Pers), two subgroups (ICT-intensive and non-ICT-intensive firms) and 10 years (2001–2010). This results in an unbalanced panel of 866 observations. Basic continuous variables considered include ‘nominal value added’ and ‘gross output’, ‘full-time employment’, the ‘total wage-bill’, ‘nominal expenditures on intermediates’ and a ‘capital service measure’. In addition, it includes derived variables such as ‘gross output based labor productivity’. Firms are classified as ICT-intensive and non-ICT-intensive according to an indicator, which is equal to zero (non-ICT-intensive firm) if the firm has no broadband access or if less than 40 % of the workers have access to broadband, otherwise, it is equal to one and the firm is classified as ICT-intensive. We use this measure of ICT intensity since common alternatives like PC use or internet access in general might be not very informative anymore, since their use and adoption is meanwhile nearly universal, whereas with respect to the access to fast internet and the share of workers having internet access there is still a substantial heterogeneity.Footnote6
For the innovation analysis the same classifier for the distinction between ICT-intensive and non-ICT-intensive firms is used. However, the sample here consists of firms surveyed both for the Community Innovation Surveys (IS) and the Survey on ICT usage and e-commerce in enterprises (EC). It covers only 10 countries (since for Germany and the UK no data are available) but the same set of industries, subcategories and years.Footnote7 The main outcome variables for this analysis are ‘product innovations’ (inpd) and ‘process innovations’ (inps).Footnote8 Further control variables, which reduce the sample size, include a measure of ‘total innovation expenditures’ (rtot) and a measure of 'cooperation arrangements on innovation activities' (co). in the Appendix provides further details.
3.2. Descriptive evidence
presents summary statistics for the productivity growth of both ICT-intensive and non-ICT-intensive firms and compares their development for the pre-crisis and crisis period. It confirms the dramatic overall productivity decline during the economic crisis, showing that productivity for the 12 countries covered was increasing by 3.5 % annually during the pre-crisis period (2002–2007), but was negative during the economic crisis, resulting in a productivity decrease of 1.1 % a year. Comparing ICT-intensive and non-ICT-intensive firms, the results show that during the pre-crisis period (2002–2007) the average annual productivity growth of the former ones was positive (0.4 percentage points) but lower than that of non-ICT-intensive firms. The latter group increased its productivity on average by 1.3 percentage points a year. Thus, non-ICT-intensive firms increased their relative productivity by 0.9 % annually in the years preceeding the crisis, compared to their ICT-intensive counterparts. Given the productivity-enhancing character of ICT this might be surprising. However, as in the Appendix shows, ICT-intensive firms are more productive than their non-ICT counterparts in both the pre-crisis and the crisis period. Also, during the crisis this development was reversed, since ICT-intensive firms experienced a much lower reduction in their productivity growth rate. The productivity of ICT-intensive firms decreased by only 0.5 percentage points a year during the crisis, whereas that of non-ICT-intensive firms decreased by 2.3 percentage points. This suggests that ICT-intensive firms, despite a lower productivity growth trend and higher levels of productivity, were hit less hard during the crisis, compared to non-ICT-intensive firms. Their productivity growth rate during the crisis was 0.9 percentage points lower than that of the pre-crisis period whereas that of non-ICT-intensive firms decreased by 3.6 percentage points. In addition, productivity growth, though negative, was 1.8 percentage point higher for the ICT-intensive group. This finding holds not only for the total economy but also for most of the industries examined. Only for ‘Investment goods, excluding hightech’ (InvesG) and 'Finance and business, except real estate' (FinBu) the relative productivity of non-ICT-intensive firms has improved during the crisis compared to the pre-crisis period.
Table 1. Labor productivity growth by ICT-intensity – before and during crisis.
4. Is resilience linked to ICT use?
This section examines econometrically the link between firms' productivity growth during the crisis and their ICT intensity. If ICT are a driving force behind firms' resilience in times of crisis, then those firms using ICT more intensively should exhibit smaller productivity decreases than those using ICT less intensively. To study this relationship, we exploit the unique feature of the MMD, which allows comparing groups of firms differing in ICT intensity within the same industry. Previous studies were either only able to compare ICT-intensive industries with less ICT-intensive industries, thereby ignoring within-industry heterogeneity, or had to rely on firm-level data, which typically precludes cross-country comparisons.
4.1. Difference-in-difference estimates
Following McGuckin and Stiroh (Citation2001) and Stiroh (Citation2002) the main approach we apply is a difference-in-difference methodology, which uses a binary classification of ICT-intensive firms and compares their relative productivity level or development to that of other firms. Using the binary information is useful, as Stiroh (Citation2002) suggests, because it is less sensitive to how ICT are measured, but is limited in that it does miss variation in ICT intensity across firms.
Difference-in-difference estimation extends the test for differences in means with an additional constant, an indicator for the crisis period, and an interaction term for the group of ICT-intensive firms. In short, it tests for whether the difference in productivity (growth) between the intensive and non-intensive groups is significantly different during the crisis, compared to the productivity differential in the other years. The main estimation equation, in growth rates, is:(1)
(1) where
represents gross output-based labor productivity growth of country–industry combination i, j denotes the group of ICT- and non-ICT-intensive firms within i and t represents the respective year. In addition,
if
and
otherwise, whereas
if a subgroup contains the ICT-intensive firms and
otherwise. The vector
contains a set of control variables such as capital, labor and intermediate inputs. α is the mean growth rate for non-ICT-intensive firms in the non-crisis period (before 2008 and in 2010), whereas
equals the growth rate of ICT-intensive firms during that time. β captures the change in productivity growth during the crisis for non-ICT-intensive firms, whereas
is the change for ICT-intensive firms. The coefficient of main interest is δ, since it represents the difference in the adjustment during the crisis, i.e. it can be considered a measure of differences in the resilience between ICT-intensive and non-ICT-intensive firms. We also estimate a specification with productivity levels rather than growth as dependent variable. Standard errors are corrected for heteroscedasticity and for correlation across industries within countries.
contains our baseline results describing the link between ICT intensity and productivity during the times of crisis. It exhibits eight columns, where the first two columns contain specifications with labor productivity levels as the dependent variable. In column 1 the productivity level is explained by the crisis dummy, the ICT dummy, their interaction and our three inputs: capital, labor and materials. In addition, we include country and industry dummies. All variables, except the capital coefficient, are significant. The crisis dummy, as expected, shows a strongly negative and significant coefficient. In contrast, the interaction term, the variable of interest, is positive and significant, equal to 0.157, indicating that during the crisis in 2008 and 2009 the difference in productivity between ICT-intensive and non-ICT-intensive firms relative to that of the other firms has increased by around 15.7 %. More precisely, the results indicate that during the crisis non-ICT-intensive firms suffered from a productivity decline of around 10.2 %, whereas ICT-intensive firms experienced an improvement in productivity levels on average. In specification 2, we include country–industry-subcategory fixed effects to control for the differences in mean productivity levels of each group. The ICT dummy has to be dropped in this specification to avoid multicollinearity. Doing so results in very similar findings.
Table 2. Labor productivity and IT – baseline results.
Columns 3–8, by applying specifications in growth rates, also largely confirm these findings. Compared to the specifications in levels, which control for permanent differences in labor productivity levels between groups, e.g. among ICT- and non-ICT-intensive firms, specifications in growth rates control, through fixed effects, for differences in growth trends between groups. Such differences in productivity trends, if they exist and are not controlled for, could drive the findings of the levels specification. If e.g. ICT-intensive firms have on average a higher productivity growth rate, then a specification in levels would indicate that ICT-intensive firms compared to non-ICT-intensive ones have in later periods a relatively higher productivity level, and thus would indicate that they were hit less strongly by the crisis just because of the difference in growth trends and not because of a higher resilience during the crisis. Column 3 provides a simple specification without country–industry-subcategory fixed effects, which results again in a negative significant coefficient for the crisis-dummy, indicating that the productivity growth of non-ICT-intensive firms during the crisis was lower than in the pre-crisis period. The ICT-dummy is insignificant which indicates that there is on average no difference in the productivity growth rate between those two groups of firms. However, the interaction term is significant and positive, which suggests, despite the insignificant difference in the pre-crisis growth rates of ICT- and non-ICT-intensive firms, that the relative growth rate of ICT-intensive firms during the crisis increased. Just as in the levels specifications, this suggests that ICT-intensive firms were hit less strongly during the crisis. Column 4, controlling for country–industry subindustry average labor productivity growth rates, capital, labor and intermediate input growth rates, results in similar findings, where again the crisis dummy is, as can be expected, negative significant, whereas the interaction term is positive and significant. The labor and intermediate input variables show significant signs in line with values which can be expected from production theory. In contrast, for capital we find a negative value, whereas theory suggests that it should be positive.Footnote9 However, as the following robustness checks show, the negative capital coefficient becomes insignificant and disappears in several alternative specifications (columns 5 and 6). In column 5 we add the share of workers with higher formal education as a control variable, which is important to capture potential sources of omitted variables related to complementary inputs to ICT, such as high-skilled labor.Footnote10 Column 6 restricts the production technology to constant returns to scale by replacing the input levels with capital and materials to labor ratios (i.e. capital and intermediate input levels divided by the employment level). Doing so does not change our conclusion with respect to the role of ICT during the crisis. Column 7 studies the robustness of our results towards the exclusion of the Elecom industry, i.e. the ICT-producing industry. The results confirm our previous findings and thus suggest that our findings are not driven by the ICT-producing sector. Column 8 excludes France, since for this country there is only data available from 2007 onwards, and including it makes the sample highly unbalanced.Footnote11 All specifications confirm the baseline findings from column 4, indicating that ICT-intensive firms seem to be hit less during the crisis and thus seem to be more resilient, at least in terms of their productivity, to an economic crisis.
The next subsection aims at providing evidence on a potential explanation for these findings, namely on potential differences of ICT- and non-ICT-intensive firms with regard to their innovation behavior during the crisis. Following that, Subsection 4.3 provides further robustness checks aimed at establishing the main results more rigorously.
4.2. A potential explanation: process innovations
ICT have been shown to improve firms' capacity to innovate (see e.g. Brynjolfsson and Saunders Citation2010; Brynjolfsson and McAfee Citation2011 as well as the literature review in Section 2 of the paper). This section aims at providing evidence on whether ICT-intensive and non-ICT-intensive firms were differing with respect to their innovation behavior during the crisis and whether their relative innovativeness changed in that time. If this was the case, it could help explaining why ICT-intensive firms were hit less strongly with respect to productivity during the crisis.Footnote12 Indeed as shows, there are differences between ICT-intensive and non-ICT-intensive firms with respect to product and process innovativeness. During the pre-crisis period ICT-intensive firms were more innovative, i.e. ICT-intensive firms have implemented more new processes and introduced more new or significantly improved products or services. Half of the ICT-intensive firms had introduced product innovations during the pre-crisis period, whereas only 35 % of non-ICT-intensive firms did so. For process innovations the difference is smaller: 42 % of ICT-intensive firms did introduce innovative processes, whereas 36 % of non-ICT-intensive firms had a process innovation. These differences are consistent across industries, and moreover were amplified during the crisis period. For product innovations, the innovation gap of 14 percentage points between ICT-intensive and non-ICT-intensive firms increased to 16 percentage points. For process innovations this change was more pronounced, whereas before the crisis the difference between those two groups of firms was equal to 6 percentage points, it increased to 10 percentage points during the crisis.
Table 3. Product and process innovation by IT-intensity before and during crisis.
contains estimation results disentangling the effect of ICT intensity, the crisis and, their joint effect on innovation rates, i.e. shares of innovating firms by group. The results confirm the descriptive evidence from . Columns 1–4 contain estimates for product innovations, whereas columns 5–8 contain those for process innovations. Columns 1 and 5 (which do not contain country–industry-subgroup fixed effects) show that the group of ICT-intensive firms are on average more innovative both in terms of product and process innovations. As the summary statistics already indicate, overall firms became less innovative during the crisis, but only slightly. For product innovations, the baseline specification (column 2) allowing for country–industry-subgroup-specific fixed-effects indicates that firms on average decreased innovations by around 3 percentage points. This finding also holds if the ‘Elecom’ industry is neglected (column 3), but becomes insignificant if Austria and Finland are excluded from the estimation sample (column 4), the two countries showing the largest difference in innovation performance between ICT- and non-ICT-intensive firms during the crisis.
Table 4. Product and process innovation – baseline results.
For process innovations, we also find only in one out of four specifications a significant reduction in the share of innovating firms. Most interestingly, however, we find for process innovations in all four specifications a positive, significant interaction effect, indicating that during the crisis, ICT-intensive firms were relatively more innovative with respect to processes. For product innovations, however, we find no significant interaction effect, indicating that, although ICT-intensive firms are more innovative overall, there is no significant change during the crisis with respect to the relative innovation behavior of ICT-intensive and non-ICT-intensive firms there.
The results suggest that ICT-intensive firms did introduce process innovations during the crisis at the same rate as before the crisis, whereas non-ICT-intensive firms slightly reduced their innovation activity. This could explain, at least to some extent, why ICT-intensive firms experienced a smaller reduction in productivity during the crisis. These findings are in line with the hypothesis that ICT-intensive firms are better able to adapt their production processes through process innovations in times of crisis thereby increasing their resilience and ensuring a higher competitiveness relative to less ICT-intensive firms. In addition, an interpretation could be that in a crisis, as product demand and innovation budgets are becoming tight it is more difficult to expand through (product) innovation. So to become more productive a firm needs to work on cost efficiency (process innovation). It makes sense that ICT-intensive firms can implement these more easily, for example through digitally supported and interconnected business functions.
4.3. Robustness checks
In order to establish the robustness of the main results more rigorously, we provide additional results describing the relationship between ICT intensity, the economic crisis and firms' productivity.
provides evidence indicating that the relationship between ICT intensity and firms' performance during the crisis is driven mainly by service industries. To analyze differences between manufacturing and service industries, we split our sample into manufacturing industries (ConsG, IntmdG, InvesG) and service industries (Distr, FinBu, Pers). Columns 1 to 4 contain only observations from manufacturing industries whereas columns 5 to 8 contain only observations from service industries. Each specification contains a different (sub)set of industries. Surprisingly, in each of the four specifications covering manufacturing industries, the interaction term becomes insignificant whereas in each of the four specifications covering service industries the interaction term remains positive and significant. This indicates that our findings with respect to the role of ICT for firms' resilience is mainly driven by service industries which are typically more ICT-intensive.Footnote13
provides specifications aimed at testing the robustness of the results with respect to the definition of the economic crisis. To exclude the possibility that our results are driven by factors correlated with the economic crisis, but are not caused by it directly, we repeat our baseline specification using alternative crisis dummies. In specification 1, we define the crisis period only as the year 2009, which however does not affect our results in a qualitative way. The crisis dummy remains negative and highly significant whereas the interaction term is positive and significant. Specification 2 contains a measure of the crisis that is more broadly defined as the period from 2008 to 2010, thus including a year which is typically already denoted as a post-crisis year. Doing so, we still find significant, but slightly weaker results, in particular the interaction term remains only slightly significant. The results become gradually weaker in the following columns, where we add the year 2007 (column 3) and even 2006 (column 4) as 'artificial' crisis years. In both columns, both the crisis dummy and the interaction are insignificant. Thus, these results indicate that our results are closely related to the crisis and do not reflect broader trends which existed before or after the crisis. Columns 5 and 6 provide further evidence by interacting our two variables of interest with another dummy which is equal to one if productivity in a country was hit particularly strong by the crisis. In column 5, the additional dummy is equal to one if the country experienced a productivity decline in 2008 or 2009 of more than 1%, whereas in column 6 it is equal to one if the decline was bigger than 5%. Unsurprisingly, in both specifications the crisis dummy for countries with a strong productivity drop is highly negative and significant. At the same time, also for other countries the crisis dummy remains negative, although at a lower level of significance. Reassuringly, the interaction term of interest, the one between the crisis dummy and the ICT intensity dummy remains positive and significant in column 5 but becomes insignificant in column 6. More interestingly, the interaction term of the crisis dummy for countries where productivity was hit hard by the crisis with the ICT intensity dummy is also positive, although insignificant. This is a weak indication that in countries with a stronger drop in productivity during the crisis the ICT-intensive firms showed an even stronger resilience, such that the gap with non-ICT-intensive firms increased there even more than in the other countries.
Taken together, our results are robust with respect to the use of alternative sets of controls and are clearly related to the (strength of) crisis. Overall, ICT-intensive firms have been more resilient, with respect to productivity and innovation, during the crisis relative to firms using ICT less intensively, a result that is particularly driven by the service sector.
5. Conclusion
For firms, industries and countries, ICT are considered a potential driver of resilience in times of an economic crisis. To analyze this question, we exploit a novel and unique cross-country cross-industry meso-level panel data set, the Micro Moments Database. The MMD comprises information at the meso-level for 12 countries and 7 industries. This dataset allows us going beyond the traditional growth accounting setting where industries – rather than firms – are classified according to their intensity of ICT usage. Instead, the MMD focuses more on the firm level and on heterogeneity within industries, allowing to study more detailed aggregates by firm characteristics such as ICT intensity. Applying a difference-in-difference framework we find evidence that support the idea of ICT-related resilience. The results show that ICT-intensive firms, relative to less ICT-intensive ones, especially from service industries, were hit less hard during the economic crisis in 2008 and 2009. Firms using ICT more intensively improved their relative productivity. In addition, they were also more innovative with respect to process innovations (but only slightly with respect to product innovations). This result indicates that with ICT firms can adjust their production processes more easily during a crisis allowing them to improve their relative productivity, and to cope better with the increased competitive pressure. Our results provide evidence in favor of the hypothesis that ICT make firms and industries more resilient in times of crisis. The results are robust with respect to the inclusion of different control variables, the use of various estimation samples and alternative ways of measuring the crisis. Nonetheless, our findings have to be interpreted with care given the low number of observations and the empirical framework which precludes a causal interpretation of our findings. Thus, these findings should be considered as first evidence on an important question. The contribution of our study is twofold: Firstly, we provide novel evidence on the role of ICT for the resilience of firms and countries in times of an economic crisis. Such knowledge is important for economic policy in search of strategies to improve resilience towards potential future crises. Secondly, we contribute to the broader literature on ICT and productivity thereby illustrating the benefits of micro-aggregated industry data, which so far has been used only scarcely to study the ICT-productivity relationship.
Acknowledgments
We are grateful for helpful comments from an anonymous referee, the editor, Eric Bartelsman, Eva Hagsten, Mary O'Mahony and to the participants of seminars at ZEW, ECB as well as the University of Giessen and the VfS annual conference 2017. The paper benefited greatly from financial support within the scope of the SEEK research programme and was written mainly at ZEW. For further information on projects of the authors see http://www.zew.de/de/team/ibe/ and http://www.zew.de/de/team/pse/ as well as the ZEW annual report on http://www.zew.de/en. This paper represents the authors' personal opinions and does not necessarily reflect the views of the Deutsche Bundesbank and Statistics Netherlands.
Disclosure statement
No potential conflict of interest was reported by the authors.
Notes
1 Resilience is a complex concept, which can be defined, e.g. as the capacity of an economy to reduce vulnerabilities, to resist to shocks and to recover quickly (OECD Citation2016). We use the term ‘resilience’ in a rather specific and narrow way concentrating on productivity, i.e. how firms' productivity reacts to adverse economic shocks.
2 Although there are publicly accessible commercial cross-country firm-level data sets, such as Amadeus or Orbis, these data sets typically contain only a limited set of variables necessary for comprehensive econometric analyses and at the same time exhibit problems of comparability and coverage. Also, until recently, hardly any (cross-country) databases from national statistical offices did exist which would have allowed for such studies. Recently, also the OECD and the ECB embarked on distributed microdata projects (Dynemp/Multiprod and CompNet, respectively) although ICT and innovation data are not part of these endeavours yet, see Berlingieri et al. (Citation2017) and Lopez-Garcia (Citation2018).
3 More information about the database is provided in the Data Appendix. This description is based on Bartelsman, van Leeuwen, and Polder (Citation2016) as well as the technical documentation (see Bartelsman, Hagsten, and Polder Citation2018).
4 Specifically, the ESSnet projects ICT Impact and Linking of Microdata on ICT Usage (ESSLimit), and Linking of Microdata to Analyse ICT Impact (ESSLait) are to be mentioned. Studies which made use of the data from these projects include Bartelsman, van Leeuwen, and Polder (Citation2016), Hagsten (Citation2016), and Pantea, Sabadash, and Biagi (Citation2017).
5 The distributed micro data methodology and the resulting MMD is not the only way to allow cross-country analysis of firm-level data. Commercially available sources, such as ORBIS from Bureau van Dijk are sourced from Chamber of Commerce or mandatory filings of publically traded firms. However, the coverage and sources vary significantly across countries and it is costly to combine these data with other firm-level indicators.
6 We are aware that broadband access is not a perfect measure of all aspects of ICT-intensity, especially that it might not capture the use of applications which do not necessarily access the internet, such as certain IT manufacturing tools (like robots). Nonetheless, we still consider this proxy an appropriate choice since a broadband access and the usage thereof are the basis underlying many modern ICT applications and should thus be highly correlated with the use of a wide range of such applications in companies.
7 For four countries however, namely Denmark, France, Ireland and Sweden, the innovation data is available only from 2006 on.
8 Unfortunately, the innovation data in the CIS refer to product/process innovations of a firm in a three-year period, and are observed only in even years. For odd years, the MMD uses the t+1 value if the firm is present in both years in the ECIS sample. So, for the crisis period, the 2008 innovation rates concern innovation taking place in the time bracket (2006–2008). For 2009, they concern innovations taking place in the time bracket (2008–2010). This might have a downward bias on the differences over time, i.e. innovation rates in crises years might be overestimated as they refer to adjacent years as well.
9 This could be the consequences of a downward bias due to the endogeneity of capital. We also tested whether the negative coefficient is due to multi-collinearity problems between our ICT variable and the capital services measure. However, excluding the ICT variable from the regression did not affect the sign and significance of the capital coefficient.
10 Note that we can do this only for a subset of countries and years for which this information is available. Also, in an additional robustness check we added a lagged dependent variable to allow for a dynamic productivity process. This did not change our results significantly. The results are available upon request.
11 The definition of the measure of ICT intensity is fixed over the whole period of observation, i.e. in each year firms with more than 40% of employees having access to broadband internet are defined to be ICT intensive in that year of observation. To take into account that in the early years of observation only a few firms are ICT intensive whereas in later years a lot of firms belong to this category because of higher availability and adoption rates of broadband we conduct another robustness check. We exclude all observations from the period up to 2004 focusing on the later years when broadband was more widely available and adopted. The results confirm our previous findings and are available upon request.
12 Dachs et al. (Citation2016) analyse the employment effects of product and process innovation over the business cycle. They show that process innovation may increase the resilience of firms by reducing production costs and thus increasing demand for the firms' less costly products or by improving its cost efficiency relative to non-innovative firms.
13 In our data, approximately 32 (51)% of firms in the manufacturing (service) sector are classified as being ICT-intensive.
14 This subsection describing distributed micro data analysis and the micro moments database has been taken from Bartelsman, van Leeuwen, and Polder (Citation2016).
References
- OECD. 2016. “Strengthening Economic Resilience – Insights from the Post-1970 Record of Severe Recessions and Financial Crises.” OECD Economic Policy Papers 20: 1.
- Bartelsman, E., E. Hagsten, and M. Polder. 2018. “Micro Moments Database for Cross-Country Analysis of ICT, Innovation, and Economic Outcomes.” Journal of Economics & Management Strategy 27 (3): 626–648. doi: 10.1111/jems.12256
- Bartelsman, E., J. Haltiwanger, and S. Scarpetta. 2009. “Measuring and Analyzing Cross-Country Differences in Firm Dynamics.” In Producer Dynamics: New Evidence from Micro Data, 15–76. University of Chicago Press.
- Bartelsman, E., G. van Leeuwen, and M. Polder. 2016. “CDM Using a Cross-Country Micro Moments Database.” Economics of Innovation and New Technology 26 (1–6): 1–15.
- Berlingieri, G., P. Blanchenay, S. Calligaris, and C. Criscuolo. 2017. “The Multiprod Project: A Comprehensive Overview.” In OECD Science, Technology and Industry Working Papers.
- Bertschek, I. 2012. “ICT, Internet and Worker Productivity.” The New Palgrave Dictionary of Economics 6.
- Bertschek, I., D. Cerquera, and G. J. Klein. 2013. “More Bits – More Bucks? Measuring the Impact of Broadband Internet on Firm Performance.” Information Economics and Policy 25 (3): 190–203. doi: 10.1016/j.infoecopol.2012.11.002
- Bresnahan, T. F., and M. Trajtenberg. 1995. “General Purpose Technologies: Engines of Growth?.” Journal of Econometrics 65 (1): 83–108. doi: 10.1016/0304-4076(94)01598-T
- Brynjolfsson, E., and A. McAfee. 2011. Race Against the Machine. Lexington, MA: Digital Frontier.
- Brynjolfsson, E., and A. Saunders. 2010. Wired for Innovation. Cambridge, MA: The MIT Press.
- Cardona, M., T. Kretschmer, and T. Strobel. 2013. “ICT and Productivity: Conclusions from the Empirical Literature.” Information Economics and Policy 25 (3): 109–125. doi: 10.1016/j.infoecopol.2012.12.002
- Chun, H., J. Ha, and J.-W. Kim. 2014. “Firm Heterogeneity, R&D, and Economic Growth.” Economic Modelling 36: 149–156. doi: 10.1016/j.econmod.2013.09.028
- Chun, H., J.-W. Kim, R. Morck, and B. Yeung. 2008. “Creative Destruction and Firm-Specific Performance Heterogeneity.” Journal of Financial Economics 89 (1): 109–135. doi: 10.1016/j.jfineco.2007.06.005
- Dachs, B., M. Hud, C. Koehler, and B. Peters. 2016. “Employment Effects of Innovations over the Business Cycle: Firm-Level Evidence from European Countries.” In CREA Discussion Paper 2016-20.
- Draca, M., R. Sadun, and J. Van Reenen. 2007. “Productivity and ICT: A Review of the Evidence.” In The Oxford Handbook of Information and Communication Technologies, edited by C. Avgerou, R. Mansell, D. Quah, and R. Silverstone, 100–147. Oxford: Oxford University Press.
- Engelstaetter, B. 2013. “Enterprise Systems and Labor Productivity: Disentangling Combination Effects.” International Journal of Engineering Research and Applications 3: 1095–1107.
- Grimes, A., C. Ren, and P. Stevens. 2012. “The Need for Speed: Impacts of Internet Connectivity on Firm Productivity.” Journal of Productivity Analysis 37 (2): 187–201. doi: 10.1007/s11123-011-0237-z
- Hagsten, E. 2016. “Broadband Connected Employees and Labour Productivity: A Comparative Analysis of 14 European Countries Based on Distributed Microdata Access.” Economics of Innovation and New Technology 25 (6): 613–629. doi: 10.1080/10438599.2015.1105547
- Hall, B. H., F. Lotti, and J. Mairesse. 2013. “Evidence on the Impact of R&D and ICT Investments on Innovation and Productivity in Italian Firms.” Economics of Innovation and New Technology 22 (3): 300–328. doi: 10.1080/10438599.2012.708134
- Jorgenson, D. W., and K. J. Stiroh. 1999. “Information Technology and Growth.” The American Economic Review 89 (2): 109–115. doi: 10.1257/aer.89.2.109
- Jorgenson, D. W., and M. P. Timmer. 2011. “Structural Change in Advanced Nations: A New Set of Stylised Facts.” The Scandinavian Journal of Economics 113 (1): 1–29. doi: 10.1111/j.1467-9442.2010.01637.x
- Jovanovic, B., and P. L. Rousseau. 2005. “General Purpose Technologies.” In Handbook of Economic Growth, Volume 1B, 1182–1224.
- Lopez-Garcia, P. 2018. “CompNet's 6th Vintage of Data: Novelties and Main Stylised Facts.” CompNet Documentation.
- McGuckin, R. H., and K. J. Stiroh. 2001. “Do Computers Make Output Harder to Measure?.” The Journal of Technology Transfer 26 (4): 295–321. doi: 10.1023/A:1011170416813
- O'Mahony, M., and M. Vecchi. 2005. “Quantifying the Impact of ICT Capital on Output Growth: A Heterogeneous Dynamic Panel Approach.” Economica 72 (288): 615–633. doi: 10.1111/j.1468-0335.2005.0435.x
- Pantea, S., A. Sabadash, and F. Biagi. 2017. “Are ICT Displacing Workers in the Short Run? Evidence from Seven European Countries.” Information Economics and Policy 39: 36–44. doi: 10.1016/j.infoecopol.2017.03.002
- Polder, M., G. van Leeuwen, P. Mohnen, and W. Raymond. 2010. “Product, Process and Organization Innovation: Drivers, Complementarity and Productivity Effects,” Discussion paper, UN University. UNU-MERIT Working Paper Series 2010–035.
- Stiroh, K. J. 2002. “Information Technology and the US Productivity Revival: What Do the Industry Data Say?.” The American Economic Review 92 (5): 1559–1576. doi: 10.1257/000282802762024638
- Van Ark, B., and R. Inklaar. 2005. “Catching Up Or Getting Stuck?: Europe's Troubles to Exploit ICT's Productivity Potential.” Groningen Growth and Development Centre.
- Van Ark, B., M. O'Mahony, and M. P. Timmer. 2008. “The Productivity Gap Between Europe and the United States: Trends and Causes.” The Journal of Economic Perspectives 22 (1): 25–44. doi: 10.1257/jep.22.1.25
Appendix
A.1. Data appendix
Setting up firm-level datasets for multi-country research is difficult and costly because most of the firm-level information that is collected by national statistical agencies is confidential.Footnote14 This means that the legal framework protecting the data does not allow for direct analysis on a merged cross-country firm-level dataset. In the past decade, several projects have been using the method of distributed micro data analysis as developed by Bartelsman, Haltiwanger, and Scarpetta (Citation2009) to conduct cross-country research using firm-level information. In this approach, depicted in , a common protocol is used to extract information from each countries' harmonised firm-level datasets. This involves the assembly of micro-data by participating national statistical offices (NSO), and the running of the same program code in each country to retrieve the indicators and statistical moments or to conduct statistical analyses. By proceeding in this way, the cross-country MMD containing harmonized indicators of underlying distributions and correlations can be made public without breaking national rules of confidentiality.
Figure A.1. Distributed micro data analysis (taken from Bartelsman, van Leeuwen, and Polder Citation2016).
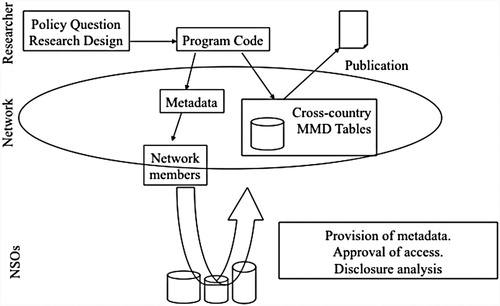
The MMD has been created through international collaborative projects of national statistical offices. The description below summarizes the technical documentation by Bartelsman, van Leeuwen, and Polder (Citation2016). The projects harmonized the firm-level linking in each country of the Community Innovation Surveys, (below called IS), the Survey on ICT usage and e-commerce in enterprises (EC), the Structural Business Survey or Production Survey (PS) and the underlying business register (BR). Using the linked firm-level sources, each statistical agency ran common computer code, the results of which were ultimately combined into a cross-country datasets at a meso-level of industry disaggregation that include measures of ICT usage and innovative activity together with measures of business performance and industry dynamics. These measures include typical aggregates, such as sums and means, but also higher moments of distributions of variables of interest, as well as joint moments from multivariate distributions. Further, information is aggregated not just over firms in an industry, but also over subsets of firms in an industry, for example by size or age, or by innovation characteristics.
The MMD is composed of a set of related cross-country tables. There are tables that provide metadata and coverage information about the underlying datasets, tables with firm demographics (birth, death, size, age) based on the BR, tables of summary statistics from each underlying survey, PS, EC, and IS, and combined survey samples (e.g. PS-EC, IS-EC or PS-EC-IS), a table with industry dynamics indicators, and a set of tables with detailed information on distributions and joint distributions of variables.