
 ?Mathematical formulae have been encoded as MathML and are displayed in this HTML version using MathJax in order to improve their display. Uncheck the box to turn MathJax off. This feature requires Javascript. Click on a formula to zoom.
ABSTRACT
The deployment of new broadband networks (NBNs) based on fiber-optic transmission technologies promises high gains in terms of productivity and economic growth. It has attracted subsidies worth billions from governments worldwide through various state aid programs. Yet, such a program's effectiveness and efficiency still need to be studied. We employ panel data from 32 OECD countries from 2002 to 2019 to provide robust empirical evidence that state aid significantly increases NBNs by facilitating the deployment of new connections to 22 percentage points of households in the short term and 39.3 percentage points in the long term. We find it highly cost-efficient, as the programs break even after three years on average. We also discuss possible efficiency improvements in future funding programs, particularly requirements of technology neutrality, consideration of mobile broadband solutions, and integration of demand-side funding.
1. Introduction
Similar to the societal benefits of ‘old’ (copper or coaxial cable-based) broadband networks that entirely rely on legacy infrastructures in the access network, the importance of high-speed, and hence ‘new’ (fiber-optic transmission based), broadband networks (NBNs)Footnote1 relates to their general-purpose technology character (Bresnahan and Trajtenberg Citation1995), which promises significant productivity improvements, product innovations, and economic growth across all major business sectors. For this reason, deploying NBNs has become a hot policy topic. Governments in most developed countries have defined ambitious broadband targets in terms of desirable coverage levels. At the supranational level, the European Commission (EC) first described in 2010, in its Digital Agenda Europe (DAE) objectives for 2020, the requirement, among other things, that ‘all Europeans have access to much higher internet speeds of above 30 Mbps’ (European Commission Citation2010, 19). The EC expressed more ambitious and long-term objectives for 2025 in its ‘Gigabit society strategy’, which intends to promote ‘gigabit-ready’ networks requiring, among other things, ‘[a]ll European households, rural or urban, to have access to internet connectivity offering a downlink of at least 100 Mbps, upgradable to gigabit speed’ (European Commission Citation2016, 35–36). Most developed countries have implemented similar broadband plans with ubiquitous coverage targets (OECD Citation2018).
Replacing existing broadband networks with fiber-optic networks requires high investment volumes. As private investors are not ready to roll out NBNs in remote and unprofitable regions, state aid is necessary to achieve ubiquitous household coverage targets in most countries. Accordingly, the DAE encouraged using national and European Union (EU)-related funding instruments to meet the broadband coverage targets (European Commission Citation2010). The use of state aid to foster broadband infrastructure started in the mid-2000s, but it has been expanded starting with the DAE. In the last two decades, public authorities in individual EU and non-EU OECD member states have become increasingly inclined to see state aid for NBNs as a necessary policy. Past and current state aid programs in some of the major economies in Europe (and elsewhere) add up to two-digit billions of Euros (Feasey, Bourreau, and Nicolle Citation2018). State aid programs have been determined predominantly at national government levels and show considerable variation in design and volumes in international comparison. In the EU, state aid policies are meant mainly to increase coverage directly and thus only indirectly increase consumers’ adoption of broadband services.
The actual effect of the state aid programs on the NBN rollout needs to be carefully studied. According to the state aid guidelines in the EU (Feasey, Bourreau, and Nicolle Citation2018) and other developed countries (OECD Citation2018), state aid is typically restricted to the ‘white’ areas, meaning only the areas where the NBN deployment is considered unprofitable under normal market conditions. Still, it might be subject to various inefficiencies, even if the allocation of funds is subjected to competitive tender processes. First, the extent of white areas is endogenously determined by chosen public targets and their specific definition of desired bandwidth levels (and other quality parameters). Usually, national or supranational targets are derived from a political process and not based on empirical evidence (Briglauer, Stocker, and Whalley Citation2020). Second, public broadband targets might result in regulatory games on the side of network operators. They might wait and postpone investment in otherwise profitable areas if they expect state aid funds and no preemption by other operators. Third, as policymakers appear to have become less patient about the fast deployment of NBNs, these networks exhibit many more white areas, which already received state aid. It seems that NBN-related funding is much more likely to be subject to the crowding out of private investment compared to the funding of old broadband networks, which entirely rely on legacy infrastructures, as state aid might be used too early for operators to address user demand for new services. Fourth, concerns are aggravated given multiple institutional funding platforms at supranational, national, and local levels with substantial risks of coordination failure and crowding out of private investments due to institutional overprovisioning of state aid (Bourreau, Feasey, and Ambre Citation2020). Against this background, overall efficiency properties and the effectiveness of state aid programs for NBN are a priori unclear.
Despite its growing financial importance and the widespread use of state aid for NBNs in most developed countries, it is astonishing that their effectiveness and efficiency have yet to receive academic consideration in terms of theoretical or empirical analysis (Bourreau, Feasey, and Ambre Citation2020). In this paper, we aim to provide (i) an empirical ex-post evaluation that informs policymakers about the causal effects of NBN-specific state aid programs in developed (OECD) countries, and (ii) contrast our estimates with average public funding expenditures to perform a rudimentary cost–benefit analysis of state aid programs. Answering the first research question allows us to assess the effectiveness, whereas answering the second research question allows us to shed some light on the overall efficiency of state aid programs.
In our empirical investigation, we employ comprehensive panel data for OECD countries comprising most of the NBN deployment period (2002–2019). Our data covers real NBN investment measured in physical units rather than less direct accounting measures. Taking various sources of endogeneity into account, we employ panel estimation techniques, including instrumental variables with different sets of external and internal instruments. In our estimation strategy, we further accommodate the dynamics of the investment adjustment process underlying NBN deployment. Our approach not only captures real-world characteristics with disproportionally increasing deployment costs but also allows us to disentangle the effects of state aid programs on total NBN coverage and the effects on the speed of NBN deployment.
The remainder of this paper is organized as follows. Section 2 reviews the empirical literature related to broadband state aid policies. Section 3 describes the relevant institutional and legal background of state aid programs. Section 4 presents our regression model framework and the identification strategy. Section 5 describes the data, and section 6 reports our main results. Section 7 provides a cost–benefit analysis contrasting our estimation results with external estimates on the impact of NBNs on economic output (GDP) and average funding expenditures, as well as the potential for efficiency improvements in the design of future funding programs. The final section concludes the paper with a review of its main results and compiles relevant policy conclusions from our analysis.
2. Literature review
A sizable literature studying the effect of state aid on broadband deployment and adoption exists. The early studies focus on the old broadband networks, the predecessor of NBN, and use data aggregated at the country level. Belloc, Nicita, and Rossi (Citation2012) are the first to examine the impact of state aid measures on broadband coverage and adoption by utilizing a dataset for 30 OECD countries from 1995 to 2010. The authors demonstrate that demand-side policies’ positive and statistically significant effect is more substantial when broadband adoption is already developed. In contrast, the impact of supply-side policies decreases as the broadband market moves into its later stages. Montolio and Trillas (Citation2013) measure how the level of broadband adoption is affected by an industrial policy variable that acts as a proxy for public policies and is calculated as government funding to private and public companies as a percentage of GDP. The authors utilize panel data for OECD and EU countries from 1999 to 2006. The estimation results indicate a positive, albeit insignificant, effect of public funding in all model specifications. Ghosh (Citation2017) examines the impact of national broadband policies on broadband penetration (fixed and mobile) and economic growth, using data from 15 MENA countries from 2001 to 2014. The broadband policy variable is measured as a dummy variable which equals one beginning from the year a country has implemented national broadband policies in terms of a national broadband plan, else zero. The authors find that broadband policies are associated with an increase in fixed broadband penetration, but not mobile broadband penetration.
Other empirical studies use more disaggregated data. Akerman, Gaarder, and Mogstad (Citation2015) examine a Norwegian national broadband program that rolled out old broadband networks, using Norwegian firm-level data from 2000 to 2008. The authors find that broadband coverage improves the labor market outcomes and productivity of skilled workers but worsens it for unskilled workers. Boik (Citation2017) examines universal service policies to expand high-speed wired broadband to rural areas using a cross-sectional sample of the U.S. state of North Carolina’s roughly 4.7 million households in 2014. The author finds that while universal access is feasible, it is unreasonable to expect universal adoption. Duso, Nardotto, and Sledeslachts (Citation2018) employ panel data on all municipalities in western Germany from 2010 to 2015 to assess the impact of German state aid programs. The authors find that state aid significantly increased broadband availability in aid-receiving areas without impeding competition in broadband markets. Briglauer et al. (Citation2019) also investigate the impact of the German state aid program for broadband deployment from 2010 to 2015, focusing only on municipalities in Bavaria. The authors find that aided municipalities have higher broadband coverage than non-aided municipalities. This increase in broadband coverage results in a slight increase in employed individuals living in the respective aid-receiving municipalities (reducing depopulation). Canzian, Poy, and Schüller (Citation2019) provide an impact evaluation of a local policy program to adopt basic broadband in underserved rural and sparsely populated areas in the Italian province of Trento. Utilizing data on the infrastructure upgrade between 2011 and 2014, the authors find a positive impact of broadband availability on companies’ economic performance in terms of revenues and total factor productivity but no indication that these effects are associated with changes in employment. Matteucci (Citation2019) analyzes the impact of Italian state aid schemes on the first-generation broadband networks’ deployment. The author discusses cases from 2009 to 2017 to find that state aid has increased broadband coverage in rural areas. The effect, however, is found to be delayed and falls short of the DAE broadband targets. Kandilov and Renkow (Citation2020) estimate the rate of return of broadband loan and grant programs on the average payroll per worker using US zip code-level data from 1997 to 2007. The authors find that two smaller broadband programs likely did not affect local payroll per worker. In contrast, the most extensive program in terms of funding and coverage probably had a positive impact. Zuo (Citation2021) examines the effects of discounted broadband using U.S. data for local broadband coverage before and after 2012. The author finds that program enrollment increases the probability that an eligible low-income individual is employed, driven by greater labor force participation and decreased probability of unemployment. Beard, Ford, and Stern (Citation2022) analyze the effect of different U.S. public funding programs established by the ‘American Reinvestment and Recovery Act of 2009’ on broadband adoption. Using U.S. census data for the years 2007, 2009, 2011, 2013, and 2015 and estimating a linear probability and a difference-in-differences model, the authors find no positive effect on broadband adoption from programs funded by the ‘Broadband Technology Opportunity Program’. The authors conclude that direct subsidies to low-income households may prove to be a more efficient funding mechanism than past spending programs targeted at broadband infrastructure deployment in unserved areas.
The discussion of state aid for broadband has been also shaped by influential policy reports. For instance, Feasey, Bourreau, and Nicolle (Citation2018) provide an extensive reportFootnote2 that examines how public funds have been used for broadband infrastructure deployment in Europe between 2003 and 2018. The authors examine 157 broadband measures notified to the European Commission by the EU Member States in terms of the objective of the state aid measures, the form of aid and budget size, the sources of funding and the institutional approval process. In their conclusions, the authors recommend, among other things, stimulating demand for state aid, formalizing stronger incentives to ensure that broadband targets are met, clearer limits on when and how public funds should be used, and consistency with universal broadband regimes that are emerging in parallel. WIK, VVA, Squire Patton Boggs, & LE Europe (Citation2020) is another related policy report that examines broadband funding policies in EU Member States from 2013 to 2019. The authors examine the extent to which the EU broadband guidelines have been effective in stimulating NBN deployment. While state aid has been effective in supporting the rollout of NBN, the authors have also reported complexity and delays in the awarding process in some cases. In their conclusions, the authors recommend, among other things, ensuring competition in the award process, effective wholesale access on state aid-supported broadband networks, and effective monitoring and clawback measures. Finally, Hatch (Citation2022) provides a recent empirical investigation of a large demand-side subsidy program first introduced in the UK. So-called gigabit vouchers offered subsidies towards the cost of installing gigabit broadband connections and were one of a number of demand-side interventions used by the ‘Building Digital UK programme’. The evaluation assessed the impact of 15,000 vouchers over a two-year period between October 2018 and September 2020. The authors found that vouchers had a significant additional effect on the availability of NBN, but only for vouchers connected in 2020. In contrast, there is insufficient evidence that vouchers connected in 2019 had an additional effect on the availability of NBN.
Regarding econometric analysis using NBN deployment data, Whitacre and Gallardo (Citation2020) are the first to include fiber-based broadband technology and basic broadband availability utilizing US county-level panel data from 2012 to 2018 to assess the impacts of state aid policies on total and rural broadband availability. The authors find a positive and significant impact of state aid programs on both measures of broadband availability. Although state aid had a measurable impact across all US counties and a slightly higher one for rural areas, the average impact was small; for a typical county with an average rural broadband availability rate of 71.5% in 2018, the presence of state aid would raise it to 73.3%. Wilson (Citation2021) is the first to examine the impact of public spending supporting broadband deployment on private investment. Using a game theoretic setting and nationwide U.S. data for 2014, the author finds that public investment crowds out private investment to some extent. However, this effect is dominated by a dynamic preemption effect, whereby the threat of public broadband provision induces private firms to pre-empt investment in NBN. As a result, a ban on public provision would reduce welfare by $86 billion over 20 years. Finally, Bourreau, Grzybowski, and Muñoz-Acevedo (Citation2022) use data on NBN deployment in more than 34,000 municipalities in France from 2014 to 2019. The authors find that the state aid program ‘Plan France Très Haut Débit’ was efficient and helped to increase NBN coverage in the early stages of the deployment. The additional coverage in aided municipalities was substantial; it amounted to 47% in 2014, 29% in 2015, 21% in 2016, 15% in 2017, and 8% in 2018.
In summary, except for three recent papers using US county-level and French municipality-level panel data, all available empirical studies are based on data measuring old broadband networks. The disaggregated data studies mainly indicate that the state aid programs targeting either the demand or the supply side have been effective. As argued in the introductory section, broadband state aid policies entail the danger of crowding out private investment and various other inefficiencies. These concerns appear to have some support from the empirical literature, which points to minor and, in some studies, also insignificant statistical effects of state aid programs. A few studies also examine indirect welfare-related effects of state aid, such as local labor market effects.
As far as NBN-specific state aid programs are concerned, empirical evidence is still limited. Available studies use data from individual countries, and none use cross-national panel data. This raises the question of the external validity of the results, which were obtained based on country-specific studies. These gaps are remarkable given the enormous state aid funds that policymakers have provided in the last two decades. Our analysis contributes to the existing literature by providing an ex-post evaluation of the effectiveness and efficiency of state aid programs aimed at expanding wired NBN deployment across 32 OECD countries from 2002 to 2019.
3. Institutional and legal background
This section first outlines relevant broadband access technologies and their evolution from narrowband internet to high-speed NBNs (section 3.1). We then describe the main economic rationales for funding NBNs (section 3.2) and the relevant EU state aid rules and state aid practices in developed non-EU countries (section 3.3).
3.1. Evolution of broadband internet access technologies
Narrowband access networks were first upgraded via xDSL technologies capable of delivering broadband services via twisted-pair copper lines some 20 years ago. Even though xDSL broadband access technologies can support the simultaneous use of voice, video, and data services on an IP basis, their performance and capabilities were technically limited by the remaining length of the copper-based part of the local access network. This technological restriction in old broadband technologies can be mitigated by deploying NBNs based on fiber-optic transmission technologies and network infrastructures. The closer fiber connections are deployed to the customer’s premise in the access network, the higher the quality characteristics (such as bandwidth levels) that can be offered to customers; wireline ‘fiberization’ scenarios include various technologies and network architectures and give rise to different deployment costs (Briglauer, Stocker, and Whalley Citation2020; Timmers et al. Citation2018). In simplified terms, fiber-optic cables can either be deployed to the premises of consumers (‘high-end fiber’) or still partly rely on ‘old’ copper wire and coaxial cable connections in the remaining segment of the access network (‘hybrid-fiber’) connecting the customer premises with the last distribution point. From that point on, all data transmission is fiber-based.
Given the coverage targets defined in the EC’s gigabit strategy (European Commission Citation2016) and in most other developed countries (OECD Citation2018), NBNs must be at least partly fiber-based in the access network to enable bandwidth levels of at least 100 Mbit/s. Whereas NBNs include hybrid-fiber technologies, 4G/LTE mobile access technologies could not fully realize these targeted bandwidth levels given our analysis period. Although 4G enabled working cases with specific wireless access solutions (ITU Citation2021), this related to individual deployment projects and a comparatively short time interval of our observation period. For this reason, we did not consider 4G mobile broadband solutions in our empirical analysis. Likewise, high-performance 5G networks have not been deployed before 2020 and are excluded from our empirical analysis, which covers the deployment period from 2002 to 2019.
3.2. Economic rationales for state aid
The primary economic rationale for state aid refers to positive externalities from broadband networks (NBNs). Market failure can refer to suboptimal geographic coverage levels, network deployment speed, and suboptimal quality levels of broadband services (or all three). Bertschek et al. (Citation2016) review more than 60 studies investigating the causal effects of broadband networks and related services. The authors generally find positive effects for the most relevant economic outcomes, such as economic growth (e.g. Czernich et al. Citation2011) and employment and productivity (e.g. Akerman, Gaarder, and Mogstad Citation2015). NBNs are expected to provide a similar or even higher potential regarding productivity increases and economic growth. However, few empirical studies (e.g. Briglauer and Gugler Citation2019) exist that explicitly include NBN data.
Furthermore, consumers’ adoption of (high-speed) broadband services and the corresponding usage of a large variety of broadband services are most likely to create a substantial consumer surplus in aggregate. Early estimates on basic broadband adoption (Greenstein and McDevitt Citation2011) and newer studies on NBNs (Katz and Callorda Citation2020) indeed suggest massive gains in consumer surplus. Overall, empirical evidence supports the expectations underlying state aid programs according to which NBNs generate massive externalities and rents for consumers.
On this basis, state aid programs to cover unprofitable and mostly rural so-called white areas might accrue substantial welfare gains if implemented effectively and without substantially crowding out private investment. White areas will be present in most countries because broadband deployment is particularly investment-intensive in local access networks due to construction costs related to civil work for digging and laying down optical cables, accounting for 60% to 70% of the total deployment costs, followed by duct costs and fiberglass (Curram et al. Citation2019). These costs are mostly fixed and sunk. Since access networks branch out in a tree-like structure, renewing access infrastructure benefits fewer customers the deeper fiber is deployed to customer premises. This means that rollout costs will be distributed among fewer customers, and hence average cost per customer will be higher (‘economies of density’). Given the economics of broadband (NBN) deployment, it is unlikely that market conditions on a nationwide scale, including areas with low population densities, will induce private investment. Accordingly, most EU member states and other non-EU developed countries implemented national broadband plans, including state aid measures, mainly since the DAE was published in 2010, to realize predefined ubiquitous broadband coverage targets (Feasey, Bourreau, and Nicolle Citation2018).
Reference is sometimes also made to equality concerns demanding ubiquitous service provision and affordability of basic broadband services for all citizens and households. These policy issues are, however, typically not part of state aid programs but tackled under the so-called ‘universal service obligation’ frameworks (the latter also provide industry or state-funded financial resources for providing universal access to (very) basic internet services). Whereas affordability can be a problem in urban and rural areas, the availability of basic broadband infrastructure is a problem specific to remote areas. Not all EU and OECD member states include broadband in their universal service framework (OECD Citation2018, 22). In these cases, political concerns about a digital divide between rural and urban areas or across income groups are embedded as a goal in national broadband targets and related to state aid programs.
3.3. State aid rules in the European Union and international funding practice
State aid is subject to legal constraints in most jurisdictions. Compliance with broadband-specific state aid rules – adopted in 2009 (European Commission Citation2009), first revised in 2013 (European Commission Citation2013), and recently revised in 2022 (European Commission Citation2022), should ensure that state aid does not crowd out private investment or lead to overcompensation of the funded network operator and thus to unfair advantages vis a vis non-funded competitors.Footnote3 In order to reach ubiquitous coverage targets and to accrue positive externalities, the EC supports state aid for broadband network (NBN) deployment in rural and underserved white areas where no broadband infrastructure exists or where no plans by private investors to roll out such infrastructure exist for the near future. In monopolistic or so-called ‘gray’ areas where only one private broadband network operator is present currently (and for the foreseeable future), a more detailed assessment is required for state aid approval, as market distortions and crowding out of private investment become more likely (European Commission Citation2013, §44–46). State aid in competitive ‘black’ areas with two or more broadband infrastructures existing in parallel is not permissible (European Commission Citation2013, §43).Footnote4 About 91% of all state aid cases in the EU reference extending NBNs to white areas, whereas the other cases refer to increasing competition and technological upgrades in gray areas as primary reasons (Feasey, Bourreau, and Nicolle Citation2018, 73). The recently adopted guidelines (European Commission Citation2022, § 54–56; 64), provide more ambitious funding targets and allow both fast fixed and mobile access networks to receive state aid. In order to qualify, fixed broadband networks must provide a download speed of at least 1 Gbit/s and an upload speed of 150 Mbit/s, and mobile networks, including 5G, must improve the quality of existing or planned mobile networks.
provides an overview of public funding programs targeted at NBN deployment for 34 OECD states (three-digit country codes in column 1). We only included major national broadband and NBN programs implemented in our observation period (with their designation in column 2). From , we infer that targeted quality characteristics, particularly bandwidth levels, must be reached until a specific target year (column 3). Only a small group of OECD states did not provide for national funding programs as integral parts of their national broadband plans (column 4). As expected among the developed countries, national broadband funds are mostly and, in some cases, entirely targeted to deploy broadband in rural (white) areas (column 5),Footnote5 in case broadband plans also include public funding. For the European Member states examined by Feasey, Bourreau, and Nicolle (Citation2018, 73), almost 87% of state aid projects were confined to white areas. Moreover, more than 95% of all notified EU state aid cases aimed to expand network coverage on the supply side rather than adoption on the demand side (Feasey, Bourreau, and Nicolle Citation2018, 74). Direct supply-side stimuli primarily consist of direct grants or soft loans subsidizing a network operator to upgrade or deploy its infrastructure. In this case, the funding authority is not involved in the broadband deployment projects. Governmental intervention is sometimes also based on partial public ownership and engagement models such as ‘private-public partnerships’, where both partners contribute with certain comparative advantages. The most interventionist form of public engagement consists of direct infrastructural investment where the government builds, operates, and owns parts of or the entire network infrastructure. Australia and New Zealand favored such interventionist approaches and have provided the highest per capita state aid funds.
Table 1. Major national broadband/NBN programs introduced in 34 OECD states until 2018.
The typical funding projects are subject to an open tender with a funding period of three to five years (Feasey, Bourreau, and Nicolle Citation2018, 73). Open tenders allow non-discriminatory participation based on known selection criteria (European Commission Citation2013, §12). The EC´s state aid rules (European Commission Citation2013, § (10)) allow for multiple state aid funds combined at the EU, national, and local levels. Within the EU, member states provided approximately 65% of all state aid funds at the national level, and 35% came from various European funds. In addition to regional funds provided by the EC, the European Investment Bank has lent between €2–3 billion per year in soft loans to private NBN operators since 2014 (Feasey, Bourreau, and Nicolle Citation2018, 36–39). As financing broadband deployment projects is less interventionist than public funding via state aid, it is not subjected to strict legal constraints similar to those specified in the EU state aid guidelines; to the extent that the EIB’s financing conditions are more favorable than comparable market-based financing conditions, conventional lending by the EIB is, however, de facto also subject to elements of state aid.
4. Estimation framework
In what follows, we first discuss the economics of NBN investment (section 4.1) and then describe our estimation and identification strategy (section 4.2).
4.1. The economics of investment in NBN
4.1.1. Dynamics of investment
We use a dynamic approach to incorporate actual NBN deployment patterns. As the broadband-related empirical literature (e.g. Bacache, Bourreau, and Gaudin Citation2014; Briglauer, Cambini, and Grajek Citation2018; Citation2022; Grajek and Röller Citation2012; Whitacre and Gallardo Citation2020) suggests, static models are not appropriate, as these would only account for effects that have an immediate impact on the infrastructure stock. We use a partial-adjustment model since network operators are most likely not able to adjust their broadband infrastructure stock to prevalent market conditions within one period due to significant market rigidities related to, for example, construction work (such as shortages in civil engineering capacities) or regulations (such as rights of way, negotiations with house owners or co-investing operators, or rigidities related to complex and bureaucratic application procedures for state aid funds). Thus, adjusting to current market shocks will affect the infrastructure stock contemporaneously and in future periods, and hence, adjustment to a long-run optimal infrastructure stock takes time. We first assume that this targeted or desired NBN infrastructure stock is given by.
(1)
(1) where
reflects the long-run optimal infrastructure stock for country i at time t,
is a vector of observations on all relevant explanatory variables, i.e. all available determinants of costs and revenues of NBN,
represents country-specific fixed effects, and
is an idiosyncratic error term. We further assume that the change in infrastructure stock follows a partial adjustment process:
(2)
(2) where
is the actual number of deployed NBN connections in country i at time t. For every period, a constant share of the remaining gap between the desired (*) and previous infrastructure stock (t−1) is closed, with
and
representing the ‘speed of adjustment’ coefficient. Next to capturing rigidities, the adjustment coefficient also captures increasing marginal costs of NBN deployment across areas; deployment costs are lowest in (sub-)urban areas and (much) higher in (very remote) rural areas. As discussed in section 3, white areas that received most of the available state aid funds in the past are characterized by low population densities and, hence, high average deployment costs per customer premises.
Substituting Equation (1) in Equation (2) yields:
(3)
(3) where
,
and
Short-run effects are given by
, and estimates of
reflect the long-run effects of the variables in vector
on the desired infrastructure stock. The dynamic specification of Equation (3) can be empirically tested. If
is equal to 0, then there are no dynamics or inertia. In contrast, coefficient estimates between 0 and 1 are consistent with a dynamic adjustment process leading to the long-term desired infrastructure stock. Besides testing the average level of dynamics in our specification, we can also test if the dynamics depend on some variables in X (we will be particularly interested in knowing if state aid changes the dynamics) by including appropriate interaction terms.
4.1.2. Determinants of investment
Network operators will base their investment decision on the net present value of a specific infrastructure project j (NPVj). The project will be undertaken in case the project earns a higher discounted profit than the next best investment opportunity over a certain period (t = 1, … , T), that is, if.Footnote6
(4)
(4) where the parameter r is the discount or ‘hurdle’ rate capturing opportunity costs of the next best alternative and uncertainty about future profit streams, and the parameter
denotes net cash flows in period t, that is, revenues from operation minus costs in terms of capital and operating expenditures. During the first periods of an NBN project, capital expenditure (CAPEX) typically yields negative cash flows due to substantial physical deployment costs, including labor costs for construction work, which also includes replacement of internal wiring within buildings in the case of high-end fiber deployments, network planning, and administration, equipment, and materials costs. In later periods, revenues from sales to retail consumers or wholesale access to reselling operators will typically dominate the operating cost (OPEX), yielding positive net cash flows. Revenues are typically subject to much higher uncertainty than costs but are expected to outweigh operation costs as the latter constitute only a minor share of total costs.Footnote7
CAPEX crucially depends on population or household density as average deployment costs tend to be lower in (sub-)urban areas due to shorter distances to individual households and businesses and as more people can be reached by a specific investment activity (economies of density). Next to population density, major CAPEX determinants of NBN deployment are further related to topographical factors such as ground conditions, preexisting network infrastructure elements (such as the quality of ducts and poles and space for new fiber-optical cables or the availability of dark fiber as an alternative to ducts and poles), and finally regulations such as rights of way and provisions on network cooperation or wholesale access obligations. Note that most of these CAPEX determinants, such as the population density, either show no or only very low variation over time. In contrast, OPEX-related determinants, such as leases paid to owners of ducts and dark fiber and energy and maintenance costs, tend to be time-variant but represent a small share of overall costs (Curram et al. Citation2019).
Ultimately, all determinants of an NBN project’s costs or revenues will affect its profitability and therefore constitute the relevant set of variables that may enter vector X in our theoretical model described by Equations (1)–(3). In addition, the time-invariant determinants, e.g. many of the CAPEX determinants, need not even be observed, as they are captured by the country-specific fixed effects, in Equation (1) and
in Equation (3).
4.2. Estimation and identification strategy
We estimate Equation (3) by instrumental variables (IV) and generalized method of moments (GMM) techniques and use different sets of external and internal instruments for endogenous variables in X. In particular, our main variable of interest, the state aid supporting NBN, is likely to be endogenous for several reasons. The state aid variable may be subject to reverse causality in Equation (3), as the regulators may speed up or slow down the introduction of state aid programs depending on the current levels of NBN infrastructure deployment and the gap between the current and the desired levels. Moreover, other regulatory interventions may complement or substitute for state aid. Most importantly, the access regulations, which aim at creating more competition in the broadband provision markets, can lead to omitted variable bias in Equation (3). While we add access regulation variables as a robustness check for our main results, the more general endogeneity concerns still require an appropriate estimation technique.Footnote8
Since Equation (3) represents a dynamic panel data model with unobserved country-specific effects, we apply the Arellano-Bond estimator (Arellano and Bond Citation1991), also known as a difference GMM estimator. GMM panel data estimators have been commonly used in ICT-related empirical studies to address the issue of endogeneity in the absence of appropriate external instruments (Bloom, Sadun, and Van Reenen Citation2012; Briglauer, Cambini, and Grajek Citation2018; Cardona, Kretschmer, and Strobel Citation2013; Dimelis and Papaioannou Citation2011; Whitacre and Gallardo Citation2020). Additionally, we utilize the Anderson-Hsiao IV estimator (Anderson and Hsiao Citation1981). Both types of estimators allow for the inclusion of additional external instruments or moment conditions in the case of GMM. While the IV estimator is less efficient than the GMM, it is less subject to the overfitting problem (Roodman Citation2009) and allows additional specification tests on the first-stage results.
As regards external instruments, we employ the following distinct sources of exogenous variation. First, we construct geographic Hausman-type instrumental variables measuring the average levels of NBN deployment and state aid in all other OECD member states in the sample (Briglauer and Gugler Citation2019). Both variables are defined as the ratio of total NBN deployment (total number of implemented state aid programs) in 31 OECD states (i.e. other than the focal country i) to the total number of other countries (i.e. 31). Due to NBN target-related benchmarking effects, we expect that below-average states, in terms of state aid provision or average NBN deployment, urge national politicians to catch up. For instance, in its gigabit strategy, the EC explicitly acknowledges the tremendous success of the former broadband policy target in that ‘[a]t national level, setting objectives has become the cornerstone of broadband deployment public policy. … Many member states have indeed aligned their national or regional NGN [ = next generation networks = NBN in our context] plans to the DAE speeds’ (European Commission Citation2016, 31). This indicates that national politicians are under pressure not to fall behind broadband market developments in other comparable countries, both in terms of target setting and actual deployment levels; such benchmarking effects get reinforced under the supranational EU framework.
Second, we construct instruments related to political ideology measuring the overall degree of governmental intervention in the economy (Montolio and Trillas Citation2013) as well as the share of left-liberal legislators (Whitacre and Gallardo Citation2020) in a country, hypothesizing that a high share of public expenditures in general and more left-liberal governments are good predictors for (NBN) state aid programs. These political economy variables capture the level of public participation in infrastructure projects, and we expect them to correlate positively with the state aid for NBN deployment.
5. Data
We employ a balanced panel data set of 32 OECD member states from 2002 to 2019 for dependent and independent variables, with a maximum number of 576 observations.Footnote9 In constructing our data, we use the following sources. First, our source for the dependent variables is the FTTH (Fiber to the Home) Council Europe database, which includes annual numbers of deployed and adopted fiber-based broadband lines for OECD member states (section 5.1). Second, we use several OECD databases, particularly data from ‘Digital Economy Outlook’ and ‘Economic Outlook’. The construction of state aid variables (section 5.2) is based on our research, publicly available information published by national government departments and regulatory agencies, and personal correspondence with representatives of these institutions. Finally, we employ several other data sets to construct our control and instrumental variables (sections 5.3 and 5.4).
shows descriptive statistics of all variables used to estimate Equation (3). in the Appendix lists the sources and provides definitions of the variables. lists the sources for our state aid variable.
Table 2. Summary statistics.
5.1. Dependent variable: NBN investment
There are two main approaches to measuring NBN in the empirical literature: One stream of the literature focuses on measuring the impact of specific quality characteristics such as actual up- and downlink bandwidth levels provided to end-users by NBNs (e.g. Ahlfeldt, Koutroumpis, and Valletti Citation2017; Briglauer, Dürr, and Gugler Citation2021; Gallardo et al. Citation2021; Katz and Callorda Citation2020; Kongaut and Bohlin Citation2014; Rohman and Bohlin Citation2012; Zaber, Bohlin, and Lindmark Citation2017). Another stream of the literature measures NBN in terms of the underlying network architectures and fiber-optical technologies (Bourreau, Grzybowski, and Hasbi Citation2019; Briglauer and Gugler Citation2019; Briglauer, Cambini, and Grajek Citation2018). Whereas measures based on bandwidth levels define a specific range of broadband speed and a minimum bandwidth level as NBN, measures based on network architectures provide a broader and more flexible definition of NBN which widens as innovations in NBN technologies occur. For instance, fiber technologies, including hybrid-fiber copper and coaxial cable lines, could enable minimum bandwidth requirements as foreseen in the DAE targets issued in 2010 already with the beginning of our analysis periodFootnote10 and higher minimum bandwidth levels of at least 100 Mbit/s as requested by the Gigabit society strategy issued in 2016 for the last years of our observation period.Footnote11 For this reason, we consider technology-based NBN measures as appropriate. It also incorporates technological upgrades as an evolutionary process that has taken place during the last two decades and will continue in the future.
In contrast, bandwidths in the gigabit range or exclusively based on high-end fiber connections would not represent average network investment activities of our analysis period (2002–2019) but only a minor share of investment activities during the last years of our observation period. Note also that broadband speed is only a single dimension of quality of service; other technical measures include jitter, latency, packet loss, and reliability, which determine the specific quality of service level. Against this background, a technology-based measure appears to be the more holistic one. Also, in its European Electronic Communications Code (European Commission Citation2018, Article 2), the European Commission defined NBN as ‘Very High Capacity Networks’, referring to network architectures and infrastructural elements.
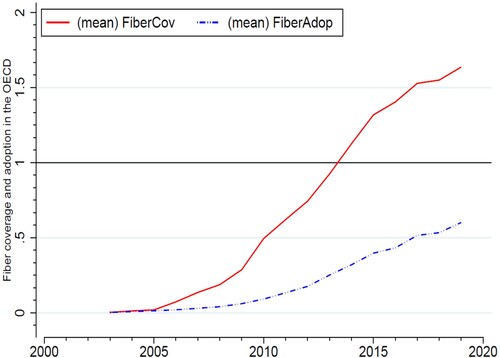
Our dependent variable measures household-weighted investments in new fiber-based broadband networks denoted with FiberCov. Fiber investment is measured as the number of physical connections deployed, representing the NBN infrastructure stock in a given country. Related to NBN investment, NBN adoption, denoted with FiberAdop, measures the number of adopting consumers and businesses willing to pay for NBN-related content and services under a commercial contract.
In constructing our dependent variable, FiberCov, we include all relevant fiber-based broadband access architectures, which either deploy fiber-optic cables directly to the premises of consumers (‘high-end fiber’) or partly rely on ‘old’ copper wire and coaxial cable connections in the remaining segment of the access network (‘hybrid-fiber’). describes the relevant fiber-based architectures (‘Fiber to the x’, FTTx). Note that by considering all relevant FTTx network architectures, we employ a measure of NBN investments targeted by the various state aid programs during our period of analysis.
depicts the mean values of household-weighted numbers of NBN investment (FiberCov) and adoption (FiberAdop) in OECD countries from 2003 to 2019. One can first infer that only a fraction of installed NBN connections are also adopted by consumers. Second, operator investment and consumer adoption follow a dynamic and non-linear adoption process. Third, one can observe overprovisioning of households on average due to multiple infrastructures in some (sub-)urban areas since 2013 (see the horizontal line at 1). The Netherlands, for instance, exhibits the second highest population density in Europe, duopolistic legacy infrastructures, and about eight million private households covered with multiple FTTx technologies in parallel; about 7.3 million homes are passed by FTTC/VDSL technologies based on former monopolist infrastructures and also by FTTN/DOCSIS technologies based on coaxial cable infrastructures in 2020. In addition, new entrants deployed about 3.3 million FTTH/B connections based on their infrastructure elements (including municipalities) until the end of our analysis period. This market situation results in an average household coverage of 2.24 FTTx lines per household. Note, however, that high average household coverage does not imply ubiquitous household coverage. On the contrary, most countries still exhibit low household coverage in rural areas (European Commission Citation2020), where average deployment costs are high, and the speed of adjustment is low. Fourth, low fiber adoption rates represent a severe welfare concern, as only (output-oriented) adoption of NBN connections and consumers utilizing related services and applications enable broadband as a general-purpose technology and generates the concomitant welfare effects; the latter are expected to be much higher than those related to direct investment-related multiplier effects.
Figure 1. NBN investment and adoption household shares (OECD mean values for 2003–2019). Source: Own calculations based on data from FTTH Council Europe.
5.2. Main independent variable: state aid
Almost all funding programs in the past have been implemented at national levels and targeted the supply side (section 3.3). Therefore, in constructing our state aid variable, our variable of interest in vector X, we focused on supply-side oriented funding programs provided by national governments in OECD member states. Based on publicly available information published by governmental departments and regulatory agencies we collected information on funding programs that targeted the rollout of the NBN technologies ( lists all relevant sources of national- and EU-level state aid programs in OECD countries).
In line with most empirical contributions (e.g. Whitacre and Gallardo Citation2020), we construct a binary variable, denoted StateAid, indicating if there is a national state aid program supporting NBN deployment in a given year in a specific country. We test the short-term and long-term effects of introducing state aid programs, which allows us to answer our research questions and derive relevant policy implications.
5.3. Control variables
As discussed in section 4.1, our controls entering vector X include multiple measures related to the revenues and costs of NBN. First, we recognize multiple variables affecting revenues through the intensity of competitive rivalry and the regulatory interventions in the broadband markets. The variable FixMobSub measures competition stemming from broadband wireless mobile networks. According to the discussion in section 3.1, 4G-based mobile broadband technologies have exerted significant competitive pressure on wireline NBN technologies since 2010. Competition within broadband wireline markets further depends on the extent of the market share of the legacy xDSL technology and infrastructure, ShareDSL, owned by former monopolistic incumbent operators. It measures the degree of remaining market power of incumbent operators. Next to the infrastructure-based competition from both wireline and wireless networks, service-based competition can also exist. Various mandatory access regulations, which can interfere with the state aid regulations, aim at inducing additional competition in the broadband service provision by allowing new entrants to use parts of the existing infrastructure. The variables AccessReg and AccessPrice capture those regulations imposed on dominant operators’ NBN infrastructure and older broadband infrastructure, respectively.Footnote12
Further revenue-related controls include the determinants of demand, such as the households’ income measured by GDP per capita, GDPpc, and the households’ ICT spending, CommExp. The age dependency ratio, AgeDepRatio, measures the number of users who typically exhibit lower ICT affinity or willingness to pay for ICT services. Revenues for future NBN services can also be positively affected by the price level for telecommunications services in general, TeleServP. The total number of internet users, IntUsers, measures the potential market size of consumers eventually adopting NBN services and content. Content is measured by the market entrance of Netflix, Netflix. Meanwhile, video streaming services represent more than 60% of global internet download traffic, hence the ‘killer app’ of NBN. As one of the most famous streaming service providers, Netflix represents about 15% of global internet download traffic.Footnote13
Second, the relevant cost controls include the long-term interest rate, IntRate, to capture opportunity costs related to NBN deployment projects. Deployment costs also depend on topographic and demographic characteristics, hence the extent of urban and rural areas and housing structure. The variables RuralPop and ShareAppr capture the number of people living in rural areas and the number of apartments per building. Finally, the variable Wages proxies the construction work costs, representing the largest share of total deployment costs.
5.4. Instrumental variables
As noted in section 4.2, external instrumental variables include the variable LftWng, which measures the share of left-liberal legislators, and the variable GovExp, which measures the share of public expenditures. Hausman-type geographic instruments related to the average development regarding state aid and NBN deployment in all other 31 states are denoted with StateAid31 and FiberCov31, respectively.
6. Estimation results
reports the main estimation results of our empirical model, as captured by Equation (3). The estimations include only those from the complete set of explanatory variables – described in and – that were statistically significant at least once and report the other results as further tests and robustness checks in and .
Table 3. Main estimation results.
Table 4. Tests and robustness checks.
Columns (1) through (5) in all use the same explanatory variables but a different set of internal and external instruments. In particular, columns (1) through (3) follow Anderson and Hsiao’s (Citation1981) two-stage least squares (2SLS) approach; these estimations use lagged values of the lagged dependent variable, FiberCov(t−1), and the endogenous variables, StateAid and FixMobSub, as internal instruments, and differenced or lagged values of StateAid31, FiberCov31, LftWng, and GovExp, as external instruments.Footnote14 Columns (4) and (5) follow Arellano and Bond’s (Citation1991) one-step GMM approach, which includes additional instruments, or (stacked) moment conditions, for the lagged dependent variable in addition to the set of internal and external instruments used in columns (1) and (3), respectively. Because the increased efficiency of the Arellano-Bond estimator over the Anderson-Hsiao estimator may come at the cost of overfitting the model (Roodman Citation2009), we keep the number of instruments used low and report it at the bottom of next to the number of clusters and observations used in the estimations.
The results in are robust to using alternative estimators, 2SLS or GMM, and various sets of instruments across columns. We also present the key specification tests in – i.e. the test of second-order serial correlation in the residuals and the Hansen test of over-identifying restrictions – to check the assumptions behind the empirical model. The test statistics give us additional confidence in the results, as the respective null hypotheses cannot be rejected even at the 10% significance level.Footnote15
For the interpretation of the results, it is important to stress that this is the cross-time variation in our data that identifies the coefficients, as the cross-sectional variation is removed using first differencing by both the Anderson and Hsiao’s (Citation1981) and the Arellano and Bond’s (Citation1991) estimators. As a result, the estimations in account for the complete set of country-specific effects, as in Equation (3), but do not yield the estimates of .
The coefficient on the lagged dependent variable is statistically significant and ranges from 0.440 in column (1) to 0.676 in column (5), with an average of 0.563. Thus, using a partial-adjustment model in capturing the dynamics of NBN investment is warranted, and the speed of adjustment is about 0.437. In other words, more than 40% of the gap between the current and the long-run infrastructure stock closes within a year, according to our estimates. The remaining gap gradually closes in the following years; after three years, the gap amounts to around 10%.
The impact of control variables on NBN deployment is both non-negligible and economically meaningful in our model. The competition from mobile broadband, as captured by the variable FixMobSub, shows a statistically significant (in four out of five columns in ) and positive effect. Its coefficient equals 0.66 on average across columns, which means that an increase in mobile competition by one standard deviation increases NBN coverage by some 12.5 percentage points in the short term (0.66*0.19 = 0.1254) and 28.7 percentage points in the long term (0.1254/(1 − 0.563) = 0.2870).
The demand shifters show a weaker impact in our model. The age dependency ratio, AgeDepRatio, is positive but only marginally significant when using the 2SLS estimator and insignificant when using the GMM estimator in . The coefficient AgeDepRatio equals 0.011 on average, which means that an increase of the share of the young and the old in the population by one standard deviation leads to some 6.2 percentage points more NBN infrastructure in the short term (0.011*5.67 = 0.06237) and 14.3 percentage points in the long term (0.06237/(1 − 0.563) = 0.1427). Though statistically weak, this result is unexpected. A possible interpretation is that this is the impact of the young, which more than offsets the demand of the old for NBN-based services compared to working-age groups. The impact of GDP per capita is positive, as expected, but significant at the 10% level in only one out of five estimations in .
The cost shifters show a more substantial impact on the NBN investment than the demand shifters. The share of the rural population, RuralPop, and the long-term interest rate, IntRate, are statistically significant across all five columns in and return an average coefficient of −4.127 and −0.017, respectively. The negative sign on the coefficients is as expected. The estimated magnitude of the effect of the rural population appears high; one standard deviation increase in RuralPop decreases the NBN coverage by 49.5 percentage points in the short term (–4.127*0.12 = −0.4952) and 113 percentage points in the long term (−0.4952/(1 − 0.563) = −1.133). However, the rural population is a slow-changing variable; even small changes over a short period may indicate a longer trend, which is more critical for long-term infrastructure investments.Footnote16 The impact of interest rate is an order of magnitude smaller; one standard deviation increase lowers the NBN coverage by 4.9 percentage points in the short term (−0.017*2.87 = −0.0488) and 11.2 percentage points in the long term (−0.0488/(1 − 0.563) = –0.1116).
Most importantly, our variable of interest, StateAid, is statistically and economically significant. The coefficients are significant at the 1% level in each of the five specifications in , and the average magnitude across specifications equals 0.290. This means that a state aid program directed at NBNs increases the coverage in the studied countries by 29 percentage points on average in the short term. The most conservative estimate in amounts to 22 percentage points, and the resulting long-term impact equals 39.3 percentage points (0.220/(1 − 0.440) = 0.393).
Including additional controls, as shown in and , generally leaves the main results unaffected.Footnote17 In particular, including time-trend variables in does not significantly change the results. One noticeable exception is column (4) in , in which we control for regulated access to the NBN infrastructure in a subsample of our data. In this specification, the StateAid coefficient equals 0.209 and is significant at the 10% level. Whereas this shows the robustness of our result on state aid to controlling for other forms of sector-specific intervention (and to a significant reduction of the estimation sample size), it also behooves us to interpret the estimated magnitude of the StateAid coefficient cautiously.
Last, provides additional evidence on the dynamic effects of state aid policies. As explained in section 4.1.1 and motivated in the introductory section, by including the interaction term FiberCov(t−1)*StateAid(t), we can test whether the state aid has a real long-term impact by increasing total NBN coverage or merely whether it speeds up the investments that would take place anyway. For instance, a negative coefficient on the interaction term would mean that goes down; hence the adjustment speed, as measured by λ, goes up in the presence of state aid regulations. A sufficient increase of the coefficient on StateAid accompanying this could leave the long-term impact of StateAid unchanged. The state aid policy would then only affect the speed, not the ultimate level of deployed infrastructure. However, the statistically insignificant coefficient on the interaction term in column (3) suggests that the state aid had no impact on the speed of adjustment. In contrast, its direct impact on NBN coverage remains strong, as evidenced by the positive and significant coefficient on StateAid in column (3).
7. Policy implications
7.1. Efficiency of previous state aid programs: costs and benefits
Given substantial expenditures for state aid programs during NBN deployment in the last two decades, it is essential to quantify total benefits and costs when evaluating the overall efficiency of such programs. In order to conduct a rudimentary cost–benefit calculation, we first relate our estimates of the average impact of state aid programs on NBN deployment to the average effects of NBN on GDP using an external study (Briglauer and Gugler Citation2019). In order to make a conservative assessment, we evaluate benefits on lower bounds of respective coefficient estimates. We then contrast the imputed GDP per capita benefit with external estimates on average per capita state aid expenditures (Bourreau, Feasey, and Ambre Citation2020; Feasey, Bourreau, and Nicolle Citation2018).
According to our analysis in section 6, state aid significantly and positively impacts NBN investment. The lowest coefficient estimate for the variable StateAid (as reported for our main estimation results in in column 1) is 0.220, implying that having a state aid program in place increased household-weighted NBN investment on average by about 22 percentage points, or 28.2% when evaluated at the grand mean value (: ) in the short term. The long-term values equal 39.3 percentage points (0.220/(1 − 0.44)) and 50.4% (28.2%/(1 − 0.44)), respectively. Next, to find an elasticity of GDP with respect to NBNs, we refer to Briglauer and Gugler (Citation2019), who estimate the incremental impact of NBN adoption on GDP using various NBN-adoption variables (holding basic broadband adoption constant). The authors identify the elasticity to be in the interval of 0.002–0.005. However, as one can infer from , NBN adoption lags far behind NBN investment. Therefore, we must consider that adoption rates, which relate NBN adoption to NBN investment, are substantially below 1. From the data underlying , we infer that after the initial years with very low fiber deployment (and adoption), the average adoption rate was about 0.33 from 2005 to 2019. Taking all these estimates into account and evaluating at the grand mean of GDP per capita in our data (:
$40,000), we find a conservative estimate of the impact of state aid on the increase in GDP per capita per year. The short-term impact is about $7.45 (0.002*0.282*0.33*$40,000), which gradually rises to $13.30 in the long term (0.002*0.504*0.33*$40,000).
Next, we must identify per capita expenditures on NBN-specific state aid programs. presents country-specific estimates of the expenditures. Within the EU, several member states spent less than $5 per capita in total over 16 years (2003–2018), whereas Italy and France, which top the list, spent $145.4 and $214.8 per capita, or $9.09 and $13.43 per capita per year, respectively. Thus, Europe’s highest state aid spending roughly corresponds to the average values in terms of the calculated GDP increase. Outside Europe, state aid was highest in Australia ($101.24 per capita per year), Korea ($32.91 per capita per year), and New Zealand ($24.55 per capita per year). Overall, based on the data from 29 out of 32 countries in our analysis over the last decade, the average state aid spending was $9.32 per capita per year. Contrasting this cost figure with the average benefit, as reported above, shows that the state aid programs are highly efficient. On average, the benefits outweigh the costs as early as in the program’s second year, and the programs ‘break even’ in the third year.Footnote18 It must be stressed that the NBN infrastructure’s lifetime vastly exceeds 18 years, the period of our analysis, so the cost–benefit calculation is even more advantageous than these numbers suggest, as the benefits remain even if the state aid spending runs out.
Table 5. State aid expenditures on NBN.
These figures reveal that total benefits, as measured by GDP, outweigh total costs; hence, state aid programs, on average, have created value in the past. Moreover, we likely underestimate the total benefits related to NBNs. First, we must acknowledge the imperfect nature of GDP as a measure of the economic benefits of broadband (NBNs), as not all value created by broadband deployment is captured in standard GDP measures. In particular, GDP measures just income and not economic welfare. Second, if more broadband leads to more product innovations in other sectors of the economy but with a time lag, we would also be underestimating the overall benefits since we capture only the contemporaneous benefits (Briglauer and Gugler Citation2019). Finally, the COVID-19 pandemic crisis has shown the utmost importance of the digital economy to mitigate the damages of global economic and social shutdowns; this exhibits another source of a positive externality during an economic crisis not captured in the literature so far.
7.2. Efficiency gains for future state aid programs
State aid criteria regarding required network quality parameters will determine the set of eligible broadband access technologies. According to the principle of technological neutrality (European Commission Citation2009, recital 18), none of the feasible broadband access technologies should be favored a priori. Instead of picking winners by, e.g. explicitly mandating specific network topologies, market forces should identify winning technologies based on entrepreneurial search processes and future demand patterns. Most national broadband plans formally adhere to technological neutrality as none of the feasible wireline and wireless access technologies is explicitly excluded from the tendering process. Note, however, that in some cases, the specific wording of formal quality requirements de facto excludes some network topologies and complementary technologies (OECD Citation2018, 24).
Mobile (wireless) broadband services have become very popular since the rollout of 4G networks began in 2010. Even though corresponding mobile broadband technologies have been deployed on a nationwide scale in most countries, the average quality and stability of data transmission available to individual consumers depend on a host of factors, such as the number of active users in a cell and, on average, was below quality levels provided by wireline (hybrid-)fiber networks during our period of analysis. This could, however, change drastically with further advances in mobile access technologies. 5G is expected to yield disruptive changes in quality dimensions with, for example, bandwidth levels up to several Gbit/s (Briglauer, Stocker, and Whalley Citation2020). In addition to wireless technologies that provide seamless mobile broadband access services, so-called fixed wireless access (FWA) technologies, including WLAN/WiFi, satellite-based broadband, and WiMax, provide broadband services using wireless links between fixed points. The latter appeared to be a cost-effective and quick alternative to connect households and businesses in rural or remote areas, as economies of density are much less pronounced than in the access part of fixed networks. With the advent of 5G deployment, gigabit-level broadband access became feasible with 5G FWA-based solutions. 5G FWA is gaining further momentum in the industry, given network performance, spectrum availability, and cost efficiency (ITU Citation2021).Footnote19 Whereas most state aid programs have been mainly targeted at wireline broadband networks in the past, mobile broadband access technologies (incl. FWA) will increasingly compete with fixed broadband access solutions. They should be explicitly incorporated in future programs as these technologies will most likely be part of the long-term desired infrastructure stock. It is, therefore, to be seen as positive that the recently adopted state aid guidelines for broadband networks (European Commission Citation2022) will enable Member States to support mobile networks (incl. FWA) and hybrid-fiber-based networks under certain conditions. This also adheres to the Commission’s definition of VHCN (European Commission Citation2018, recital 14), which, by the principle of technological neutrality, neither excludes high-performance hybrid-fiber nor wireless connections.
Our analysis focused on supply-side programs, which accounted for the vast majority of public funding programs during the period under review. However, demand-side programs have a vital complementary role once the infrastructure is established to avoid costly over-capacities in the case of (otherwise) low take-up rates on the side of consumers. In an early empirical analysis, Belloc, Nicita, and Rossi (Citation2012) suggested that demand-side policies should be enhanced in the late phase of broadband deployment, where coverage is already at high levels. This resonates well with the data in , which shows that subscribers use only 33% of all available NBN connections. Indeed, given still relatively low NBN adoption rates, a one-sided supply funding focus is unlikely to be efficient in realizing potential welfare gains. Whereas digital infrastructures represent a necessary prerequisite, digital services constitute the actual value for consumers. However, consumers with a limited willingness to pay for more expensive NBN connections could receive public support, for example, via vouchers or tax reliefs, closing the gap to the actual deployment costs of the local network operators. The UK government was the first authority to launch voucher programs in 2018. This program provided vouchers to cover the installation costs of bringing gigabit connectivity to people’s homes and businesses in eligible areas.Footnote20 The UK government has recently provided £210 million in funding with vouchers valued at up to £1500 for domestic properties and £3500 for businesses.Footnote21 Meanwhile, the program has been evaluated based on a counterfactual analysis. The main findings indicate that vouchers significantly affected the availability of ultra-fast broadband in 2020 (Hatch Citation2022). While still unstudied, the demand-side programs have the potential to generate similar, or even higher, welfare gains and should thus be integrated into future state aid programs. Interestingly, the recently adopted broadband state aid guidelines of the European Commission (Citation2022) explicitly included demand-side measures, such as vouchers, as a remedy that may qualify for state aid to mitigate the market failure of low adoption rates.
8. Conclusion
Some of the available empirical studies found only minor and even insignificant effects of broadband (NBN)-specific state aid programs. In contrast, our results point to a strong effect of state aid, which will increase the total NBN coverage by facilitating additional connections for 40 percentage points of households (or more) in the long term. These results are robust concerning a variety of econometric specifications and control variables. Interestingly, while our results reveal strong positive effects on average, the underlying data shows significant discrepancies across countries regarding the extent to which they applied state aid. The most striking difference is between Australia and the Netherlands, which spent $1721 and $1.5 per capita, respectively, from 2003 to 2018. The market conditions explain the differences across countries to some extent, but they also point to an unutilized potential for those countries which lag behind.
Whereas the state aid programs increase the total NBN coverage, they do not affect the speed of NBN deployment. At first glance, this result seems counterintuitive but could be explained by at least two things. First, state aid is typically subject to highly bureaucratic processes; in Europe, for instance, all the EU, national, and local government levels are involved, creating a complex system to navigate for infrastructure providers and local fund applicants and may slow down the investment process. Second, there is some anecdotal evidence of regulatory gaming. Since the private infrastructure providers expect the politicians to grant state aid, if broadband targets are not met, they delay investments that would otherwise be economically viable and wait for a subsidy (Valletti Citation2016, 15).
Despite these potential problems, our cost–benefit analysis clearly suggests that state aid programs have been effective and efficient, as related public expenditures generated significantly higher per capita benefits, as measured by the additional GDP growth. This finding is based on conservative estimates and is further reinforced given other disregarded sources of significant externalities of NBN, which are difficult to measure and not yet considered in the empirical literature. For instance, resilience to shocks, such as the one caused by the COVID-19 pandemic, and consumer surplus related to the use of digital services and applications. Future research should be directed to quantify the positive societal impact of NBN-specific services in terms of generated consumer surplus and increasing the resilience of economies to crises.
Moreover, future research should investigate the complementary role of demand-side NBN policies, as almost all state aid programs in the past were based on supply-side stimuli, such as direct grants. Further efficiency gains could be realized in future funding programs if technology neutrality is implemented better, especially since mobile broadband solutions appear to be a cost-efficient and fast alternative to bringing high-speed broadband to rural areas.
Whereas the positive externalities associated with modern broadband infrastructures and services are in principle common to all regions and countries, regional heterogeneity nevertheless remains. For example, it is well known that mobile broadband, which was excluded from our analysis, plays an important role in the group of developing countries (Ghosh Citation2017). For this reason, our results – stemming from the group of developed countries and NBN wireline technologies – cannot be generally applied to all countries and regions; rather, more research is needed here.
Acknowledgments
The authors are grateful to two anonymous referees for their helpful comments.
Disclosure statement
No potential conflict of interest was reported by the author(s).
Additional information
Funding
Notes
1 NBN stands for new broadband network.
2 This report was later published as Bourreau, Feasey, and Ambre (Citation2020).
3 We focus on the EU legal framework, as most of the OECD states in our data set are EU member states.
4 Only a very few of the developed countries refrained from providing state aid due to country-specific features related to high levels of infrastructure competition or demographic and topographic characteristics.
5 In some countries, ‘white spots' within suburban and urban areas have also been targeted (WIK et al. Citation2020, 20).
6 A report prepared for BEREC cites survey-based evidence according to which network operators indeed conduct NPV-based analysis when evaluating individual NBN projects (Curram et al. Citation2019).
7 Virtually all CAPEX costs for a given area are fixed and sunk. The OPEX costs include both the fixed (but not sunk) elements as well as variable components.
8 Simple correlation analysis reveals positive relation between our measure of state aid and access regulation on one hand and net neutrality, another regulatory intervention in the broadband markets, on the other hand. While the correlations are not very strong, 0.361 and 0.227, respectively, the coefficients are statistically significant. Since net neutrality has been shown to discourage NBN investment (Briglauer et al. Citation2022), the potential omitted variable bias goes against our expected result on state aid, thereby making our estimates more conservative. Similarly to net neutrality, access regulation has also been shown to discourage infrastructure investment (Grajek and Röller Citation2012; Briglauer, Cambini, and Grajek Citation2018).
9 Because our estimators involve first differencing and internal instruments lagged by two periods, up to 512 observations are used in the estimations. We do not include all 38 OECD member states, as we do not have data for Costa Rica, Columbia, Lithuania, and Latvia, which joined the OECD in 2021, 2020, 2018, and 2016, respectively. Mexico and Chile also had OECD membership status during our period of analysis. However, they were excluded because of missing information on some variables which ultimately yielded a total number of 32 countries.
10 At that time, early variations of xDSL broadband access (Very-high-rate Digital Subscriber Line (VDSL)) have already been capable of delivering bandwidth levels ≥ 30 Mbit/s over shorter distances using copper-wire infrastructure in the remaining part of the network. Similarly, cable modem versions could deliver downlink bandwidth levels ≥ 30 Mbit/s over the coaxial cable network (Spirent Communications Citation2003).
11 During the years 2016-2019, technological innovations in hybrid ‘second-life copper/coax’ technologies allowed for delivering public broadband targets set out in the Gigabit strategy in 2016; from today´s perspective, these technologies even appear to be gigabit-able (Timmers et al. Citation2018; Stocker Citation2019; Briglauer, Stocker, and Whalley Citation2020).
12 These variables are only available for a subset of our sample, however.
13 Information available at: https://variety.com/2018/digital/news/netflix-15-percent-internet-bandwidth-worldwide-study-1202963207/ (last accessed on January 15th, 2023).
14 Next to StateAid, we also suspect FixMobSub to suffer from reverse causality, as the mobile operators may react to the NBN-enabled broadband offerings of wireline operators. Table A.4 in the Appendix reports an exemplary set of first-stage results corresponding to column (3) in , that is, the model with the smallest set of instruments. The instruments are strong, as evidenced by the F-tests of excluded instruments and the partial R2 statistics; the coefficients have economically meaningful signs. The models in columns (1) and (2) in add instruments by substituting the instruments based on differenced values with the ones based on levels and/or including the instruments lagged by more periods. The first-stage results of these models are available from the authors upon request.
15 We have also performed Hausman tests to confirm that StateAid and FixMobSub are endogenous in our model.
16 Note that the rural population has a two-fold impact on the NBN profitability: an immediate one on the deployment costs and a long-term one on future revenues. If the rural population migrates to small towns, for instance, this makes the case for covering small towns with NBN stronger, especially if the migration trend continues in the long term. We also need to reiterate that the NBN coverage measure in our sample can exceed 100% because the parallel coverage of multiple alternative infrastructures, particularly in black (sub-)urban areas, leads to duplication of access lines. Coverage goes as high as 286% for the tiny state of Luxembourg, where the state-owned incumbent operators offer NBN services based on FTTx technologies. In light of this, the coefficient on RuralPop is not unreasonably high.
17 For the expositional purpose, the robustness checks in and take column (5) in as the baseline specification. The results of the robustness checks are, however, representative of the other specifications.
18 The term ‘break even' is slightly abused here, as the GDP increase is hardly a revenue, which would be required for a proper break-even analysis. Still, we stick to this notion, as it captures well some of the significant NBN-related externalities that we have in mind, and the main result is insensitive to the discount rate applied.
19 Li and Forzati (Citation2020) provide an analysis on the cost, energy consumption, and performance trade-offs of optical fiber versus 5G FWA-based solutions.
20 Information available at: https://www.gov.uk/government/news/government-launches-new-5bn-project-gigabit (last accessed on January 15th, 2023).
21 Information available at: https://www.broadwaybroadband.co.uk/rural-gigabit-voucher-scheme/ (last accessed on January 15th, 2023).
References
- Ahlfeldt, Gabriel M., Pantelis Koutroumpis, and Tommaso Valletti. 2017. “Speed 2.0: Evaluating Access to Universal Digital Highways.” Journal of the European Economic Association 15 (3): 586–625. https://doi.org/10.1093/jeea/jvw013.
- Akerman, A., I. Gaarder, and M. Mogstad. 2015. “The Skill Complementarity of Broadband Internet.” Quarterly Journal of Economics 30 (4): 1781–1824. https://doi.org/10.1093/qje/qjv028.
- Analysis Mason. 2010. Contemporary FTTH Stimulus Packages Study – v.3. Report for the FTTH Council Europe.
- Anderson, T. W., and C. Hsiao. 1981. “Estimation of Dynamic Models with Error Components.” Journal of American Statistical Association 76 (375): 598–606. https://doi.org/10.1080/01621459.1981.10477691.
- Arellano, M., and S. Bond. 1991. “Some Tests of Specification for Panel Data: Monte Carlo Evidence and an Application to Employment Equations.” Review of Economic Studies 58 (2): 277–297. https://doi.org/10.2307/2297968.
- Atene KOM. 2014. Study on National Broadband Plans in the EU-28. Study Prepared for the European Commission (SMART Number 2014/077). Brussels: European Union.
- Atene KOM. 2021. Study on National Broadband Plans in the EU-27. Study Prepared for the European Commission (SMART 2019/0007). Brussels: European Union.
- Bacache, M., M. Bourreau, and G. Gaudin. 2014. “Dynamic Entry and Investment in New Infrastructures: Empirical Evidence from the Telecoms Industry.” Review of Industrial Organization 44 (2): 179–209. https://doi.org/10.1007/s11151-013-9398-4.
- Beard, T. R., G. S. Ford, and M. Stern. 2022. “Bridging the Digital Divide: An Empirical Analysis of Public Programs to Increase Broadband Adoption.” Telematics and Informatics 67:101754. https://doi.org/10.1016/j.tele.2021.101754.
- Belloc, F., A. Nicita, and M. A. Rossi. 2012. “Whither Policy Design for Broadband Adoption? Evidence from 30 OECD Countries.” Telecommunications Policy 36 (5): 382–398. https://doi.org/10.1016/j.telpol.2011.11.023.
- Beltrán, F. 2014. “Fibre-to-the-home, High-Speed and National Broadband Plans: Tales from Down Under.” Telecommunications Policy 38 (8–9): 715–729. https://doi.org/10.1016/j.telpol.2013.08.006.
- Berkman Center. 2010. “Next Generation Connectivity: A Review of Broadband Internet Transitions and Policy from Around the World.” Final Report at Harvard University.
- Bertschek, I., W. Briglauer, K. Hüschelrath, B. Kauf, and T. Niebel. 2016. “The Economic Impacts of Telecommunications Networks and Broadband Internet: A Survey.” Review of Network Economics 14: 201–227. https://doi.org/10.1515/rne-2016-0032.
- Bloom, N., R. Sadun, and J. Van Reenen. 2012. “Americans Do IT Better: Us Multinationals and the Productivity Miracle.” American Economic Review 102 (1): 167–201. https://doi.org/10.1257/aer.102.1.167.
- Boik, A. 2017. “The Economics of Universal Service: An Analysis of Entry Subsidies for High Speed Broadband.” Information Economics and Policy 40:13–20. https://doi.org/10.1016/j.infoecopol.2017.04.004.
- Bourreau, M., R. Feasey, and N. Ambre. 2020. “Assessing Fifteen Years of State Aid for Broadband in the European Union: A Quantitative Analysis.” Telecommunications Policy 44 (7): 101974. https://doi.org/10.1016/j.telpol.2020.101974.
- Bourreau, M., L. Grzybowski, and M. Hasbi. 2019. “Unbundling the Incumbent and Deployment of High-Speed Internet: Evidence from France.” International Journal of Industrial Organization 67: 102526. https://doi.org/10.1016/j.ijindorg.2019.102526.
- Bourreau, M., L. Grzybowski, and A. Muñoz-Acevedo. 2022. “Entry into Fiber and State Aid for the Deployment of High-Speed Internet: Evidence from France.” Working Paper. https://www.strategie.gouv.fr/sites/strategie.gouv.fr/files/atoms/files/etude_imt_entry_into_fiber_and_state_aid_for_the_deployment_of_high_speed_internet.pdf.
- Bresnahan, T., and M. Trajtenberg. 1995. “General Purpose Technologies ‘Engines of Growth’?” Journal of Econometrics 65 (1): 83–108. https://doi.org/10.1016/0304-4076(94)01598-T.
- Briglauer, W., C. Cambini, and M. Grajek. 2018. “Speeding Up the Internet: Regulation and Investment in the European Fiber Optic Infrastructure.” International Journal of Industrial Organization 61:613–652. https://doi.org/10.1016/j.ijindorg.2018.01.006.
- Briglauer, W., N. Dürr, O. Falck, and K. Hüschelrath. 2019. “Does State Aid for Broadband Deployment in Rural Areas Close the Digital and Economic Divide?” Information Economics and Policy 46:68–85. https://doi.org/10.1016/j.infoecopol.2019.01.001.
- Briglauer, W., N. Dürr, and K. Gugler. 2021. “A Retrospective Study on the Regional Benefits and Spillover Effects of High-Speed Broadband Networks: Evidence from German Counties.” International Journal of Industrial Organization 74:102677. https://doi.org/10.1016/j.ijindorg.2020.102677.
- Briglauer, W., and K. Gugler. 2019. “Go for Gigabit? First Evidence on Economic Benefits of High-Speed Broadband Technologies in Europe.” Journal of Common Market Studies 57 (5): 1071–1090. https://doi.org/10.1111/jcms.12872.
- Briglauer, W., K. Gugler, C. Cambini, and V. Stocker. 2022. “Net Neutrality and High-Speed Broadband Networks: Evidence from OECD Countries.” European Journal of Law and Economics. https://doi.org/10.1007/s10657-022-09754-5.
- Briglauer, W., V. Stocker, and J. Whalley. 2020. “Public Policy Targets in EU Broadband Markets: The Role of Technological Neutrality.” Telecommunications Policy 44 (5): 101908. https://doi.org/10.1016/j.telpol.2019.101908.
- Canzian, G., S. Poy, and S. Schüller. 2019. “Broadband Upgrade and Firm Performance in Rural Areas: Quasi-Experimental Evidence.” Regional Science and Urban Economics 77:87–103. https://doi.org/10.1016/j.regsciurbeco.2019.03.002.
- Cardona, M., T. Kretschmer, and T. Strobel. 2013. “ICT and Productivity: Conclusions from the Empirical Literature.” Information Economics and Policy 25 (3): 109–125. https://doi.org/10.1016/j.infoecopol.2012.12.002.
- Curram, S., D. Exelby, R. Cadman, K. Warren, and A. Graham. 2019. “Study on the Determinants of Investment in VHCN – A System Dynamics Approach, report prepared for BEREC BoR (19) 246.” https://berec.europa.eu/eng/document_register/subject_matter/berec/reports/8933-study-on-the-determinants-of-investment-in-vhcn-8211-a-system-dynamics-approach.
- Czernich, N., O. Falck, T. Kretschmer, and L. Woessmann. 2011. “Broadband Infrastructure and Economic Growth.” Economic Journal 121 (552): 505–532. https://doi.org/10.1111/j.1468-0297.2011.02420.x.
- Dimelis, S. P., and S. K. Papaioannou. 2011. “ICT Growth Effects at the Industry Level: A Comparison Between the US and the EU.” Information Economics and Policy 23 (1): 37–50. https://doi.org/10.1016/j.infoecopol.2010.03.004.
- Duso, T., M. Nardotto, and J. Sledeslachts. 2018. A Retrospective Study of State Aid Control in the German Broadband Market. Mimeo DIW, Berlin. Presentation available at: https://www.iwf.rw.fau.de/files/2018/12/Presentation-Tomaso-Duso.pdf.
- European Commission. 2009. Community Guidelines for the Application of State Aid Rules in Relation to Rapid Deployment of Broadband Networks. COM (2009) 235/04, Brussels.
- European Commission. 2010. A Digital Agenda for Europe. Brussels. https://eur-lex.europa.eu/legal-content/en/ALL/?uri=CELEX%3A52010DC0245.
- European Commission. 2013. EU Guidelines for the Application of State Aid Rules in Relation to the Rapid Deployment of Broadband Networks. Official Journal C/25/2013, Brussels.
- European Commission. 2016. Connectivity for a Competitive Digital Single Market – Towards a European Gigabit Society. Brussels: COM(2016)587 final.
- European Commission. 2018. Directive (EU) 2018/1972 of the European Parliament and of the Council of 11 December 2018 Establishing the European Electronic Communications Code (Recast)Text with EEA Relevance. Brussels.
- European Commission. 2020. Digital Economy and Society Index (DESI) 2020 Connectivity. Brussels. https://ec.europa.eu/digital-single-market/en/connectivity.
- European Commission. 2022. Guidelines on State Aid for Broadband Networks. C(2022) 9343 final, Brussels.
- Feasey, R., M. Bourreau, and A. Nicolle. 2018. State Aid for Broadband Infrastructure in Europe – Assessment and Policy Recommendations. CERRE Report. https://cerre.eu/publications/state-aid-broadband-infrastructure-assessment-policy-recommendations/.
- Gallardo, R., B. Whitacre, I. Kumar, and S. Upendram. 2021. “Broadband Metrics and job Productivity: A Look at County-Level Data.” The Annals of Regional Science 1: 1–24. https://doi.org/10.1007/s00168-020-01015-0.
- Ghosh, S. 2017. “Broadband Penetration and Economic Growth: Do Policies Matter?” Telematics and Informatics 34 (5): 676–693. https://doi.org/10.1016/j.tele.2016.12.007.
- Given, J. 2010. “Take Your Partners: Public Private Interplay in Australian and New Zealand Plans for Next Generation Broadband.” Telecommunications Policy 34 (9): 540–549. https://doi.org/10.1016/j.telpol.2010.07.012.
- Grajek, M., and L. H. Röller. 2012. “Regulation and Investment in Network Industries: Evidence from European Telecoms.” Journal of Law and Economics 55 (1): 189–216. https://doi.org/10.1086/661196.
- Greenstein, S., and R. McDevitt. 2011. “The Broadband Bonus: Estimating Broadband Internet's Economic Value.” Telecommunications Policy 35 (7): 617–632. https://doi.org/10.1016/j.telpol.2011.05.001.
- Hatch. 2022. “Evaluation of BDUK Gigabit Vouchers: Initial Impacts and Benefits. Report prepared for Department for Culture Media and Sport.” https://www.gov.uk/government/publications/evaluation-of-bduk-gigabit-vouchers-initial-impacts-and-benefits–2.
- Howell, B., and B. Sadowski. 2018. “Anatomy of a Public-Private Partnership: Hold-up and Regulatory Commitment in Ultrafast Broadband.” Telecommunications Policy 42 (7): 552–565. https://doi.org/10.1016/j.telpol.2018.05.001.
- ITU. 2021. The State of Broadband: People-Centred Approaches for Universal Broadband. Geneva: International Telecommunication Union. https://www.itu.int/dms_pub/itu-s/opb/pol/S-POL-BROADBAND.23-2021-PDF-E.pdf.
- Kandilov, K., and M. Renkow. 2020. “The Impacts of the USDA Broadband Loan and Grant Programs: Moving Towards Estimating a Rate of Return.” Economic Inquiry 58 (3): 1129–1145. https://doi.org/10.1111/ecin.12872.
- Katz, R., and F. Callorda. 2020. Assessing the Economic Potential of 10G Networks. NCTA (US), October. http://www.teleadvs.com/wp-content/uploads/Assessing-the-Economic-Potential-of-10G-Networks.pdf.
- Kongaut, C., and E. Bohlin. 2014. “Impact of Broadband Speeds and Economic Outputs: An Empirical Study of OECD Countries.” Paper presented at the 25th European Regional Conference of the International Telecommunications Society (ITS), Brussels, June 22–25.
- WIK, VVA, Squire Patton Boggs, and LE Europe (2020). The Role of State Aid for the Broadband Networks Rapid Deployment of in the EU. Report prepared for the European Commission, Directorate-General for Competition, Brussels.
- Li, J., and M. Forzati. 2020. “Cost, Performance and Energy Consumption of 5G Fixed Wireless Access Versus Pure Fiber-Based Broadband in Sweden.” Paper presented at ITS Online Event, June 14–17. Calgary: International Telecommunications Society (ITS).
- Matteucci, N. 2019. “The EU State aid Policy for Broadband: An Evaluation of the Italian Experience with First Generation Networks.” Telecommunications Policy 43 (9): 101830. https://doi.org/10.1016/j.telpol.2019.101830.
- Montolio, D., and F. Trillas. 2013. “Regulatory Federalism and Industrial Policy in Broadband Telecommunications.” Information Economics and Policy 25 (1): 18–31. https://doi.org/10.1016/j.infoecopol.2013.01.002.
- OECD. 2011. National Broadband Plans. OECD Digital Economy Papers, No. 181, Paris.
- OECD. 2018. Bridging the Rural Digital Divide. OECD Digital Economy Papers No. 265, Paris.
- OECD. 2021. Bridging Connectivity Divides. OECD Digital Economy Papers No. 315, Paris.
- Rohman, I. K., and E. Bohlin. 2012. “Does Broadband Speed Really Matter for Driving Economic Growth? Investing OECD Countries.” International Journal of Management and Network Economics 2 (4): 336–356. https://doi.org/10.1504/IJMNE.2012.051888.
- Roodman, D. 2009. “Practitioners’ Corner: A Note on the Theme of Too Many Instruments.” Oxford Bulletin of Economics and Statistics 71 (1): 135–157. https://doi.org/10.1111/j.1468-0084.2008.00542.x.
- Spirent Communications. 2003. Broadband Access Testing Methodology and Case Studies. White Paper. https://tts.kiev.ua/PDF/Library/Applications/Broadband%20Access%20Test%20Methodics%20SMB.pdf.
- Stocker, V. 2019. Innovative Capacity Allocations for All-IP Networks (2019), A Network Economic Analysis of Evolution and Competition in the Internet Ecosystem. Freiburger Studien zur Netzökonomie 22, Nomos: Baden-Baden.
- Timmers, M., R. Zhao, J. Mau, and J. Salgado. 2018. Migrating from Copper to Fibre: The Telco Perspective. A White Paper by the Deployment & Operations Committee. http://www.ftthcouncil.eu.
- Valletti, T. 2016. “The Role of Broadband Targets.” In The Future of Broadband Policy: Public Targets and Private Investment. European University Institute: Report prepared by the Florence School of Regulation.
- Whitacre, B., and R. Gallardo. 2020. “State Broadband Policy: Impacts on Availability.” Telecommunications Policy 44 (9): 102025. https://doi.org/10.1016/j.telpol.2020.102025.
- WIK. 2009. Breitband/Bandbreite für alle: Kosten und Finanzierung einer nationalen Infrastruktur. WIK-Diskussionsbeitrag Nr. 330, Bad Honnef.
- Wilson, K. 2021. “Does Public Competition Crowd Out Private Investment? Evidence from Municipal Provision of Internet Access.” NET Institute Working Paper No. 16-16. Available at SSRN: https://ssrn.com/abstract=2848569.
- Zaber, M., E. Bohlin, and S. Lindmark. 2017. What is the Impact of Broadband Bandwidth Variability on Quality of Life? Lessons from, Sweden: SSRN Working Paper. Dhaka.
- Zuo, G. W. 2021. “Wired and Hired: Employment Effects of Subsidized Broadband Internet for Low-Income Americans.” American Economic Journal: Economic Policy 13 (3): 447–482. https://doi.org/10.1257/pol.20190648.
Appendix
Table A1. Variable descriptions and sources.
Table A2. National NBN state aid programs in OECD member states imposed during 2002–2019.
Table A3. Further robustness checks.
Table A4. First-stage results.