
Abstract
The current investigation extends previous work on citizens' perceptions of police performance. It examines origins of between-community differences in concerned citizens' judgements that police are responding sufficiently to a local social problem. The problem is local unsupervised teen groups, a key indicator for both the revised systemic social disorganisation perspective and the incivilities thesis. Four theoretical perspectives predict ecological determinants of these shared judgements. Less perceived police responsiveness is anticipated in: lower socioeconomic status (SES) police districts by both a political economy and a stratified incivilities perspective; more predominantly minority police districts by a racialised justice perspective; and in higher crime police districts by a proposed extension of Klinger's ecology of policing model. The current work improves upon earlier conflicting work in this area in several ways; most importantly it distinguishes between perceived need for police and perceived police responsiveness. Survey, census and crime data from Philadelphia were used. Results showed residents concerned about this problem and living in lower SES police districts or higher violent crime police districts judged police as less responsive. Results supported political economy and stratified incivilities models and to a lesser extent the proposed extension of Klinger's ecology of policing perspective. Implications for broader understandings of community variation in citizens' reactions to police, and for national programmes to improve police responsiveness, were noted.
Acknowledgements
Survey data collection described here was funded by an award from the Office of the Provost, Temple University, and the Office of the Vice President for Research and Graduate Studies, Temple University. This study would not have been possible without the support of Ira Schwartz, former Provost, and Ken Soprano, former Vice President for Research and Graduate Studies, at Temple University. Revisions were supported by a research and study leave awarded by the Office of the Provost, Temple University, Lisa Staiano-Coico, Provost. Support from Dean Teresa Soufas, College of Liberal Arts, Temple University, is also gratefully acknowledged. Opinions stated are solely those of the authors and reflect neither the opinions nor policies of Temple University. Brian Lawton provided critical, unflagging and extremely valuable support in crafting and cleaning the PAS. Lillian Dote completed the weighting procedures for Philadelphia respondents. Ron Davis, R. Marie Garcia, Liz Groff, Caterina Roman, Travis Taniguchi, Brian Wyant, and several thoughtful reviewers provided helpful comments on previous drafts.
Notes
1. Police work in other types of places like small towns (Kidder Citation1999) is similarly complicated. Some might even argue more complicated.
2. Some might object that not all citizens who report that unsupervised teen groups are a problem in their locale are concerned about the problem, and thus should not be called concerned citizens. The online Oxford English Dictionary includes as one definition of concerned ‘affected, interested’. It is in that frame that the term is used here. If citizens recognise this is a problem it seems reasonable to infer they have some level of interest in this potential detractor from the quality of local life, and have thought how to some degree they themselves are affected by the issue. Whether these citizens are concerned in the sense that they are anxious or made uneasy by this problem is unknown and not inferred here.
3. Concentrated disadvantage is a widely used index of community demographic structure which combines indicators of African-American racial composition with socioeconomic status indicators like unemployment and poverty.
4. The additional leap made here is that controlling for composition of residents, ecological variation in perceived police responsiveness reflects to some degree the ecological variation in how police behave. Of course, community-differences in attitudes toward police also may contribute, but since those link strongly to individual demographics at the individual level, and since the latter are controlled, a stronger case can be made that there is some correspondence between perceived and ‘actual’ police responsiveness. Figuring out this degree of correspondence, and whether it varies and if so based on what conditions, and the police behaviours contributing to perceived responsiveness, of course make for important areas of future work.
5. Two police districts representing the airport and Fairmount Park were excluded.
6. Calculations by the authors from Table 3.110.2003 from the online Sourcebook of Criminal Justice Statistics (http://www.albany.edu/sourcebook/pdf/t31102003.pdf).
7. 2005–2007 American Community Survey demographic and household estimates from the US Census available through www.factfinder.census.gov.
8. This 77% was calculated from a sampling frame of 6098 telephone numbers, 3721 of which were contacted. Of these households, eligibility was not known for 496 and 1881 were ineligible. There were 1344 remaining telephone numbers, from which 1028 interviews were completed for the entire PAS/PLS survey.
Of course, response rates using standardised formulas promoted by the American Association of Public Opinion Researchers prove much lower (http://www.aapor.org/Standard_Definitions/1481.htm). Using their standardised formulas, response rates ranged from 24.4% (AAPOR's RR1: minimum response rate) to 25.4% (AAPOR's RR3: response rate after estimating proportion of unknown eligibility cases would have been eligible) to 27.6% (RR5: computed from the total number of eligible households). These response rates roughly match the modal response rate of 25% for RDD surveys reported in a recent analysis of telephone survey response rates for over 200 studies done at a large state university survey research centre (McCarty et al. Citation2006).
The contact rate, which is a household level rate and ‘measures the proportion of all cases in which some responsible member of the housing unit was reached by the survey’ (American Association of Public Opinion Researchers Citation2008, p. 28) ranged from 70.1% (AAPOR's CON1) to 73% (AAPOR's CON2). The cooperation rate which is ‘the proportion of all cases interviewed of all eligible units ever contacted’ (AAPOR 2008, p. 36) was either 34.8% (COOP1) or 36.1% (COOP3). Refusal rates were either 43.2% (REF1) or 45% (RR2) depending on the formula used.
Readers of the opinion that the minimum response rate (25%) is extremely low should bear in mind that this is a typical rate for an RDD survey (McCarty et al. Citation2006). Further, low response rates suggest only potential non-representativeness, and identical surveys with markedly contrasting response rates can generate almost identical patterns of results (Keeter et al. Citation2000). Non-representativeness is more of an issue than non-response (McCarty et al. Citation2006). Actual representativeness is captured for the entire PAS by comparing respondent demographic profiles to 2000 census data, and was quite strong (see Institute for Survey Research Citation2003). Representativeness of the Philadelphia subsample, before and after weighting, is described in the following footnote. In accord with AAPOR (2008) recommendations, the following table is included: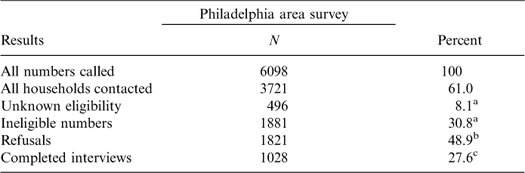
Table assumes all contacted households are eligible. a = percent computed from total number of telephone numbers dialled. b = percent computed from the total number of eligible households. c = Percent computed from the total number of eligible households. This rate is equivalent to the AAPOR Response Rate formula RR5.
9. Randomly sampling one adult from all Philadelphia households in the 2000 Census Public Use Microdata Sample (PUMS) file, a 2 (gender)×2 (race: White/non-White)×2 (education: ≤HS/ > HS) table was created. Sample percentages in each cell were compared with PUMS percentages. Before weighting, the PUMS/interview discrepancies were greater than 5% for only two of the eight cells in this table (Dote Citation2006, p. 83): White male, more than high school (PUMS/interviews = 11%/5%); non-White females with no more than a high school education (PUMS/interviews = 19%/31%). Case weights were constructed and applied. Initial weights were modest (0.61–2.27) before taking multiple phone lines into account, and in only one cell above 2.0 (White males with better than high school education). After weighting, the sample/PUMS discrepancies in the 2×2×2 table ranged from −2 to 4 (average = 0.25%).
10. HLM software labels these odds ratios but they are relative risk ratios because they depend on the base category selected (Gutierrez Citation2005).
11. Analyses (results not shown) with the concerned-satisfied group as the base category also were conducted and provided results that were conceptually identical to those shown here, although of course the relative risk ratios differed.
12. Figures for a standard deviation impact on RRRs were generated by Long and Freese's (2006, pp. 261–262) Stata add-on listcoef using the results from the non-hierarchical models. Key RRRs were the same from both hierarchical and non-hierarchical models.
13. Geographical inspection of the Empirically Adjusted RRRs ratios from the null ANOVA model with no predictors confirmed the statistical results. For example, those concerned citizens with the highest RRRs, i.e. most likely to judge the police responsive versus not, were in the outermost districts in the far northeastern (Districts 7 and 8) and far northwestern (Districts 5 and 14) corners of the city, as well as in a gentrifying and rapidly appreciating ‘museum area’ north and west of Center City (District 9). See Appendix 1 for the full table.
14. One reviewer has commented about this result as follows: ‘this begs the question as to whether there is a resource issue here – the more crime the less responsive police are to other disorder because their time is taken up with criminal incidents. This would be an additional measure which would add validity to the argument’. The reviewer, of course, is completely correct. Violent crime is only a very indirect indicator of how much of officers' time is taken up with directly responding to those events. Preferable indicators would be serious crimes per officer, or per officer hour, for example. This issue is further addressed in the discussion.
15. The logic here commits neither the ecological (Thorndike Citation1939) nor the individual (Alker Citation1969) fallacy. These multilevel models link a macro-level community feature with varying probabilities across communities of membership in different groups for different groups of respondents. Underlying these macro → macro links are, of course, intervening cross-level, causal connections (Coleman Citation1990, pp. 3–22), to be investigated in future works.
16. District racial composition even had no influence if individual race was removed from the model.