
 ?Mathematical formulae have been encoded as MathML and are displayed in this HTML version using MathJax in order to improve their display. Uncheck the box to turn MathJax off. This feature requires Javascript. Click on a formula to zoom.
ABSTRACT
The extensive use of social media platforms, especially during disasters, creates unique opportunities for humanitarian organizations to gain situational awareness as disaster unfolds. In addition to textual content, people post overwhelming amounts of imagery content on social networks within minutes of a disaster hit. Studies point to the importance of this online imagery content for emergency response. Despite recent advances in computer vision research, making sense of the imagery content in real-time during disasters remains a challenging task. One of the important challenges is that a large proportion of images shared on social media is redundant or irrelevant, which requires robust filtering mechanisms. Another important challenge is that images acquired after major disasters do not share the same characteristics as those in large-scale image collections with clean annotations of well-defined object categories such as house, car, airplane, cat, dog, etc., used traditionally in computer vision research. To tackle these challenges, we present a social media image processing pipeline that combines human and machine intelligence to perform two important tasks: (i) capturing and filtering of social media imagery content (i.e., real-time image streaming, de-duplication, and relevancy filtering); and (ii) actionable information extraction (i.e., damage severity assessment) as a core situational awareness task during an on-going crisis event. Results obtained from extensive experiments on real-world crisis datasets demonstrate the significance of the proposed pipeline for optimal utilization of both human and machine computing resources.
1. Introduction
The use of social media platforms such as Twitter and Facebook at times of natural or man-made disasters has increased recently (Hughes & Palen, Citation2009; Starbird, Palen, Hughes, & Vieweg, Citation2010). People post a variety of content such as textual messages, images, and videos (Chen, Lu, Kan, & Cui, Citation2013; Imran, Castillo, Diaz, & Vieweg, Citation2015). Studies show the significance and usefulness of this online information for humanitarian organizations, struggling with disaster response and management (Daly & Thom, Citation2016; Imran, Elbassuoni, Castillo, Diaz, & Meier, Citation2013; Peters & Joao, Citation2015). A majority of these studies have however been relying almost exclusively on textual content (i.e., posts, messages, tweets, etc.) for crisis response and management tasks. Contrary (or complementary) to the existing literature on using social media textual content for crisis management, this work focuses on leveraging the social media visual content (i.e., images) to show humanitarian organizations its utility for disaster response. If processed timely and effectively, information extracted from social media images can enable early decision-making and other humanitarian relief efforts such as gaining situational awareness, for example, through summarization (Rudra et al., Citation2016) or classification (Nguyen, Alam, Ofli, & Imran, Citation2017), and assessing the severity of damage during an on-going disaster event (Nguyen, Ofli, Imran, & Mitra, Citation2017).
Analyzing the large volume of imagery content generated after a major disaster remains to be a challenging task in contrast to the ease of acquiring them from various social media platforms. Typically, humanitarian organizations make a call for human annotators to label features of interest (e.g., damaged shelters and blocked roads) in images. For instance, the United Nations Office for the Coordination of Humanitarian Affairs (UN OCHA) employs volunteers workforce from Digital Humanitarian NetworkFootnote1 for social media filtering. A popular solution is to use a hybrid crowdsourcing and machine learning approach to rapidly process large volumes of imagery data for disaster response in a time-sensitive manner. In this case, human workers (i.e., paid or volunteers (Reuter, Ludwig, Kaufhold, & Pipek, Citation2015)) are employed to annotate a set of images. These human-annotated images are then used to train supervised machine learning models to classify new unseen images automatically (Ofli et al., Citation2016).
1.1. Filtering social media image stream
Social media imagery data stream contains a serious amount of irrelevant or redundant content, which makes the human annotations and automatic processing a challenging problem. For instance, people often just re-tweet an existing tweet. While this “re-tweet” behavior carries important information about social consensus, it does not provide any additional information from a pure image understanding perspective. Some social media users, on the other hand, post irrelevant images, advertisement, or even porn using event-specific hashtags just to promote their own content. However, the time and motivation of human annotators are neither infinite nor free. Every crowdsourcing deployment imposes a cost in humanitarian organizations’ volunteer base and budget. Annotators may burn down (i.e., reducing their effectiveness due to lack of motivation, tiredness, or stress) or drop out completely. This would effect the humanitarian organizations’ volunteer base. Since human annotations have a direct effect on the performance of the machine learning algorithms, deficiencies in the annotations can easily translate to shortcomings in the developed automatic classification systems. Therefore, it is of utmost importance to have many volunteers to provide annotations (i.e., quantity) and mechanisms to keep the annotation quality high.
One way to achieve this is to decrease the workload on the human annotators by filtering out noisy content. For this purpose, we develop an image processing pipeline based on deep learning and perceptual hashing that can automatically (i) detect and filter out images that are not relevant or do not convey significant information for crisis response and management, and (ii) eliminate duplicate or near-duplicate images that do not provide additional information neither to classification algorithms nor to humanitarian organizations. These filtering modules will thus help annotators to focus their time and effort on making sense of useful image content only (Nguyen et al., Citation2017). In addition, they will also help in reducing the load on computational resources and improving further the performance in machine classification.
Relevancy filtering
The concept of relevancy depends strongly on the context and requirements of the task at hand. Therefore, modeling relevancy is a challenging problem, as the context of relevancy varies across disaster events, humanitarian organizations, and even within a long-running event (e.g., wars, conflicts, etc.). For example, one humanitarian organization could be interested in images of damaged buildings while another organization could be interested in images of injured people and so on. On the contrary, what is deemed irrelevant seems consistent across disasters and to many humanitarian organizations. That is, images showing cartoons, celebrities, advertisements, banners, etc., are all examples of irrelevant content (see ), hence not useful for disaster response and management. Therefore, in this study, we propose a relevancy filtering approach that focuses primarily on discarding such irrelevant images from our data processing pipeline.
Figure 1. Examples of irrelevant images in our datasets showing cartoons, banners, advertisements, celebrities, etc

De-duplication filtering
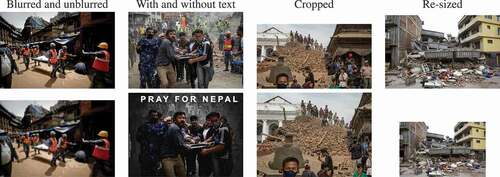
A large proportion of the social media imagery data posted during disaster events contains duplicate or near-duplicate images. For example, there are cases when people simply re-tweet an existing tweet containing an image, or they post images with little modification, for example, cropping/resizing, background padding, changing intensity, embedding text, etc. (see ). Such posting behavior produces a high number of near-duplicate images that do not yield any significant additional information into an online data collection. Therefore, in this study, we develop a de-duplication filtering method to eradicate such redundant images from our data processing pipeline.
Figure 2. Examples of near-duplicate images found in our datasets
1.2. Actionable information extraction: damage assessment
Once the social media imagery data are cleaned from the irrelevant and redundant content, and high-quality annotations are obtained from human annotators, we can then train machine learning models to further analyze the resulting set of clean images to extract actionable information for various situational-awareness tasks such as infrastructural damage assessment, injured people detection, monitoring rescue operations, etc. Among several such potential use cases of the proposed image processing pipeline on social networks, in this study, we focus on the use case of automatic damage severity assessment from images during disasters.
At the onset of a crisis, assessment of the level of damage is one of the key situational awareness requirements of humanitarian response organizations to understand the severity of destruction and to plan relief efforts accordingly. It is important for first-responders to know what type of damage happened and where. Existing research on the use of Twitter during an emergency for damage assessment is mainly focused on the textual content of tweets (Cresci, Tesconi, Cimino, & Dellórletta, Citation2015). Despite the recent advances in computer vision domain, especially in image classification, most of the existing works for emergency management do not yet rely on the image data. We have only recently employed state-of-the-art computer vision techniques to perform an extensive experimentation of damage assessment using images from four major natural disasters (Nguyen et al., Citation2017).
Specifically, our goal is to determine whether an assessment of severity of damage through images is possible or not. For the damage assessment, we consider three levels: severe damage, mild damage, and little-to-no damage (further details regarding each damage level are given in the Data Collection and Annotation section). Given the fact that, during disasters, tens of thousands of images are posted on social media platforms such as Twitter, a simple automatic damage assessment system to learn whether an image contains damage or not will not be considered that helpful for emergency responders. Rather, we need a system that not only detects damage-related images but also determines the level of damage (i.e., severe, mild, or little-to-none). This will greatly help emergency responders prioritize their relief efforts and planning for the most severe cases first. To the best of our knowledge, no prior work has dealt with the task of identifying level of damage (i.e., severe, mild, or little-to-none) from social media images as our work does.
1.3. Our contributions
State-of-the-art studies on duplicate image detection rely on Bag-of-Words (Wu, Ke, Isard, & Sun, Citation2009), entropy-based approaches (Dong, Wang, Charikar, & Li, Citation2012), perceptual hashing (Zauner, Citation2010), and deep features (An, Huang, Chen, & Weng, Citation2017). After feature extraction, most of these studies use hamming distance to compute the similarity between a pair of images. This requires defining a threshold to detect duplicate to near duplicate images. However, there has been less effort in literature on how to define this threshold. In this study, we have focused on finding a good approach to define this threshold while we also explored perceptual hashing and deep features.
On the other hand, most of the work on finding relevant images are from information retrieval domain, for example, finding images based on query (Babenko, Slesarev, Chigorin, & Lempitsky, Citation2014; Jégou, Douze, Schmid, & Pérez, Citation2010; Rui, Huang, & Mehrotra, Citation1997; Siddiquie, Feris, & Davis, Citation2011), except for one particular study that focused on finding visually relevant and irrelevant tweets with images (Chen et al., Citation2013). Unlike existing work, our understanding of relevancy is defined by the conceptualization of “what is actually irrelevant to the crisis event based on the semantics of the situation at hand (e.g., damage severity assessment).”
Though only a few, there are studies on designing classifiers for damage assessment purposes using social media data. These studies rely mainly on the use of traditional Bag-of-Words features together with classical machine learning classifiers such as Support Vector Machines (SVMs) (Daly & Thom, Citation2016; Lagerstrom et al., Citation2016), and hence, achieve limited performance. Whereas recent advances in convolutional neural networks enable further performance improvements. Therefore, we conduct an extensive experimentation of domain adaptation and transfer learning approaches based on convolutional neural networks for damage assessment and disaster response. Another limitation is that currently there is no publicly available dataset for damage assessment. We hope to shed light on this limitation by making our data publicly available.
Consequently, we can summarize main contributions of our work as follows. (i) We propose mechanisms to purify the noisy social media imagery data by removing duplicate, near-duplicate, and irrelevant image content. (ii) We show that the state-of-the-art computer vision deep learning models can be adapted successfully to image relevancy and damage category classification problems on real-world crisis datasets. (iii) We use the proposed mechanisms to demonstrate that a big chunk of the real-world crisis datasets obtained from online social networks consists of redundant or irrelevant content. (iv) Our extensive experimental evaluations underline the importance of the proposed image filtering mechanisms for optimal utilization of both human and machine resources. Specifically, our experimental results show that purification of social media image content enables efficient use of the limited human annotation budget during a crisis event, and improves both robustness and quality of the machine learning models’ outputs used by the humanitarian organizations. (v) Finally, we present a complete system with a real-time image processing pipeline in place for analyzing social media data at the onset of any emergency event. We also evaluated the system’s performance in terms of throughput and latency to demonstrate the scalability of the proposed social media image processing pipeline.
The rest of the article is organized as follows. We present a review of literature in the Related Work section. We provide details about our real-world crisis datasets and their labeling process in the Data Collection and Annotation section. We then introduce our automatic image processing pipeline in the Real-time Social Media Image Processing Pipeline section, and elaborate our experiments and results in the Experimental Framework section. We evaluate the performance of the proposed system in terms of throughput and latency in the System Performance Experiments section. We discuss our findings and observations in the Discussion section. Finally, we summarize our work in the Conclusion section.
2. Related work
Despite the wealth of text-based analyses of social media data for crisis response and management, there are only a few studies analyzing the social media image content shared during crisis events. Among others, one notable work proposes a system called Artificial Intelligence for Digital Response (AIDR) (Imran, Castillo, Lucas, Meier, & Vieweg, Citation2014; Imran et al., Citation2013), which mainly focuses on collecting and analyzing tweets in order to facilitate humanitarian organizations’ needs. The AIDR system employs human volunteers to train machines for the real-time processing of tweets. For a complete survey, mainly on the text processing systems, we refer the reader to Imran et al. (Citation2015). Since this work focuses on image filtering and classification, next we discuss the state-of-the-art approaches in duplicate image detection, image classification in general, and damage assessment from images in particular.
2.1. Importance of social media image analysis
The importance of social media images for disaster management has been recently highlighted in Peters and Joao (Citation2015). The authors analyzed tweets and messages from Flickr and Instagram for the flood event in Saxony in 2013, and found that the existence of images within on-topic messages were more relevant to the disaster event, and the image content also provided important information related to the event. In another study, Daly and Thom, Citation2016 mining focused on classifying images extracted from social media, i.e., Flicker, and analyzed whether a fire event occurred at a particular time and place (Daly & Thom, Citation2016). Their study also analyzed spatio-temporal meta-data associated with the images and suggested that geo-tags proved useful to locate the fire-affected areas. Taking a step further, Chen et al. studied the association between tweets and images, and their use in classifying visually relevant and irrelevant tweets (Chen et al., Citation2013). They designed classifiers by combining features from text, images and socially relevant contextual features (e.g., posting time, follower ratio, the number of comments and re-tweets), and reported an F1-score of 70.5% in a binary classification task, which is 5.7% higher than the text-only classification.
2.2. Duplicate image detection
There are many approaches for duplicate and near-duplicate image detection, including cryptographic hashing like MD5 (Rivest, Citation1992), locality-sensitive hashing (Chum, Philbin, & Zisserman, Citation2008; Ke, Sukthankar, & Huston, Citation2004; Lee, Ke, & Isard, Citation2010), indexing based on uniform randomized trees (Lei, Qiu, Zheng, & Huang, Citation2014), perceptual hashing (Lei, Wang, & Huang, Citation2011; Zauner, Citation2010), and, more recently, deep learning-based approaches (An et al., Citation2017; Zheng, Song, Leung, & Goodfellow, Citation2016).
Perceptual hashing-based approach, in particular, represents the fingerprint of an image derived from various features from its content. An image can have different digital representation, for example, due to cropping, resizing, compression or histogram equalization. Traditional cryptographic hashing techniques are not suitable for capturing such changes in the binary representation, which is a common case in near-duplicate images. Whereas perceptual hash functions maintain perceptual equality of images, and hence, they are robust in detecting even slight changes in the binary representation of two similar images. The success of perceptual hashing for image similarity measure has also been reported in (Gong et al., Citation2015), where they show that perceptual hashing scales well for clustering a very large number of images.
In deep learning-based approach, duplicate image detection is facilitated via extracting deep features (i.e., features obtained from a deep neural network architecture), and then, computing the distance between the resulting deep image features. For example, Zheng et al. showed the success of deep features extracted using adversarial neural networks in detecting near-duplicate images (Zheng et al., Citation2016). Recently, An et al. presented a deep learning-based approach for feature extraction followed by subspace-based learning for hashing (An et al., Citation2017).
2.3. Image classification in general
State-of-the-art studies in image classification range from categorizing images and detecting objects (He, Zhang, Ren, & Sun, Citation2016) to generating captions (Xu et al., Citation2015). Most of these studies employ different convolutional neural network (CNN) architectures on large labeled image collections such as PASCAL VOC (Everingham, Van Gool, Williams, Winn, & Zisserman, Citation2010) or ImageNet (Russakovsky et al., Citation2015). Among different CNN architectures, the most popular are VGG (Simonyan & Zisserman, Citation2014), AlexNet (Krizhevsky, Sutskever, & Hinton, Citation2012), and GoogLeNet (Szegedy et al., Citation2015). The VGG is designed using an architecture with very small (3 × 3) convolution filters and with a depth of 16 and 19 layers. The 16-layer network is referred to as VGG-16 network. The AlexNet was designed using 5 convolutional and 3 fully connected layers. The architecture of GoogLeNet consists of 22 convolutional and pooling layers stacked on top of each other. Recently, in the 2016 ImageNet Large Scale Visual Recognition Challenge (ILSVRC),Footnote2 the best performance on image classification task was reported as 2.99% top-5 classification error by an ensemble method based on existing CNN architectures such as Inception Networks (Szegedy, Vanhoucke, Ioffe, Shlens, & Wojna, Citation2015), Residual Networks (He et al., Citation2016), and Wide Residual Networks (Zagoruyko & Komodakis, Citation2016).
Designing a new network architecture and training it from scratch is a computationally expensive task that also requires millions of images to achieve a competitive result. Hence, the typical approach is to adapt a pre-trained network onto a target task, which is originally trained on a very large dataset, for example, ImageNet, containing a million images with 1,000 categories. In literature, this approach is commonly referred to as transfer learning. For the image classification task, the idea of transfer learning may correspond to either one of the following cases: i) use the pre-trained model as a feature extractor, or ii) use the network with pre-trained weights and fine-tune the network with the data from the new task. Many follow-up studies have shown that the features learned automatically by these deep neural networks are transferable to different target domains (Donahue et al., Citation2014; Girshick, Donahue, Darrell, & Malik, Citation2014; Oquab, Bottou, Laptev, & Sivic, Citation2014; Sermanet et al., Citation2013; Zeiler & Fergus, Citation2014). This proves extremely useful for training a large network without overfitting when the target dataset is significantly smaller than the base dataset, as in our case, and yet achieving state-of-the-art performance in the target domain.
2.4. Image classification for damage assessment
Use of computer vision techniques for damage assessment from images has not been fully explored in literature. There are only a handful of studies in other research domains (e.g., remote sensing) that assess the level of damage from aerial (Attari, Ofli, Awad, Lucas, & Chawla, Citation2017; Fernandez Galarreta, Kerle, & Gerke, Citation2015; Turker & San, Citation2004) and satellite (Feng et al., Citation2014; Pesaresi, Gerhardinger, & Haag, Citation2007) images collected from disaster-hit regions. Most recent studies based on social media data, and also the most relevant ones to our study, are presented by (Lagerstrom et al., Citation2016) and (Daly & Thom, Citation2016) where both studies analyze social media images in a binary classification setting for fire/not-fire detection scenario. In our current work, we address a more challenging problem since we neither limit the task to a particular disaster type nor to a binary classification setting.
For the damage assessment task, most of the aforementioned studies were based on using handcrafted features such as Scale Invariant Feature Transform (SIFT) and Histogram of Oriented Gradients (HOG) together with classical machine learning classifiers such as Support Vector Machines (SVMs) and Random Forest (RF) (Csurka, Dance, Fan, Willamowski, & Bray, Citation2004; Lazebnik, Schmid, & Ponce, Citation2006) in a bag-of-visual-words fashion. Features such as SIFT and HOG detect and describe local information in images. The bag-of-visual-words approach then converts these image features into visual words based on vector quantization. Since there has been only a few studies on damage assessment from images and they are mostly limited to the use of bag-of-visual-words approach, we explored, in our study, the transfer learning approach using CNN for crisis response and management purposes.
3. Data collection and annotation
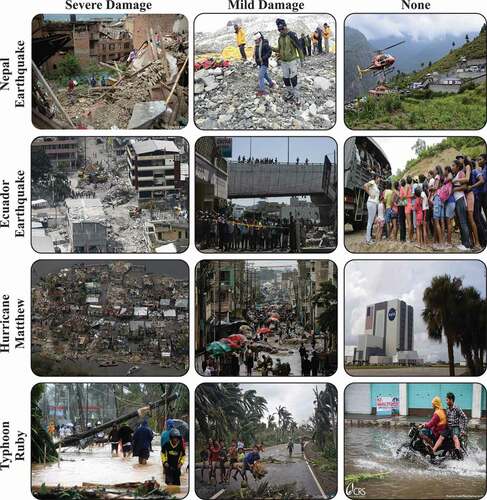
We used publicly available AIDR system (Imran et al., Citation2014) to collect images from social media platforms such as Twitter during four major natural disasters, namely, Typhoon Ruby, Nepal Earthquake, Ecuador Earthquake, and Hurricane Matthew. The data collection was based on event-specific hashtags and keywords. For the data collection, Twitter was chosen over the other social media platforms such as Instagram and Flickr for different reasons. First of all, Twitter provides more convenient and efficient mechanism to automatically collect data through its APIs. Second, images linked with tweets also contain textual content that can be used in a multimodal analysis approach. lists the total number of images initially collected for each dataset. shows example images from these datasets.
Table 1. Dataset details for all four disaster events with their year and number of images
Figure 3. Sample images with different damage levels from different disaster datasets
3.1. Human annotations
We acquired human labels for the purpose of training and evaluating machine learning models for image filtering and classification. Although, there were several other uses of images from Twitter, in this work, we focused on damage severity assessment since it is one of the most critical situational awareness tasks for many humanitarian organizations. For this purpose, we obtained human annotations in two different settings. The first set of annotations were gathered from AIDR for all four disasters using the volunteers of the Standby Task Force (SBTF)Footnote3 community. These volunteers were engaged during an on-going crisis. For example, while the Hurricane Matthew tweets were being collected from Twitter, volunteers were employed to annotate images. This process involved collecting tweets, checking if the tweets contained an image URL, if yes then downloading actual images from the Web, and finally assigning them to the annotators. Under such real-time crowdsourcing scenarios, predetermining the number of images to be annotated is not possible. Moreover, controlling duplicate images is a challenging task. Hence our volunteers were also exposed to such duplicate cases.
In the second setting, we used Crowdflower,Footnote4 which is a paid crowdsourcing platform, to annotate images. A random sample of 1,000 images were picked from the Nepal Earthquake, Ecuador Earthquake, and Typhoon Ruby datasets. To ensure high-quality of the annotations, in both settings, each image was required to be annotated by at least three human annotators, from which a final label was picked using the majority voting technique. Images with less than three annotations were not considered as trustworthy, and hence, discarded.
Annotation instructions
In this task, we opted for representing the severity of damage in an image with three levels. Having a three-level severity assessment scheme as opposed to a finer scale rating scheme (e.g., 0–8) is more convenient for humanitarian responders to quickly analyze, for example, images showing only severe damage instead of looking into different image buckets representing different scales such as 6, 7, 8. Moreover, obtaining accurate and consistent ground truth from human annotators for severity of damage proves to be a much more challenging task when a finer scale rating scheme is assumed.
Below we provide the crowdsourcing task description, damage categories, and their definitions. Annotators were asked to follow the given instructions and annotate images according to the categorical definitions.
Task description: The purpose of this task is to assess the severity of damage shown in an image. The severity of damage in an image is the extent of physical destruction shown in it. We are only interested in physical damages like broken bridges, collapsed or shattered buildings, destroyed or cracked roads, etc. An example of a non-physical damage is the signs of smoke due to fire on a building or bridge—in this particular task, we do not consider such damage types.
1. Severe Damage: Images that show the substantial destruction of an infrastructure belongs to the severe damage category. A non-livable or non-usable building, a non-crossable bridge, or a non-drivable road are all examples of severely damaged infrastructures.
2. Mild Damage: Damage is generally exceeding minor [damage] with up to 50% of a building, for example, in the focus of the image sustaining a partial loss of amenity/roof. Maybe only part of the building has to be closed down, but other parts can still be used. In the case of a bridge, if the bridge can still be used, however, part of it is unusable and/or needs some amount of repairs. Moreover, in the case of a road image, if the road is still usable, however, part of it has to be blocked off because of damage. This damage should be substantially more than what we see due to regular wear or tear.
3. Little-to-no Damage: Images that show damage-free infrastructure (except for wear and tear due to age or disrepair) belong to this category.
Data annotation outcome
shows the combined human annotation results from both annotation settings. Images that received at least three or more annotations from different annotators were considered as trustworthy and hence used in our experiments, otherwise discarded and not shown in . For example, for the Hurricane Matthew dataset only 336 images were labeled by three or more human annotators. Moreover, since the annotation process was performed on the raw image collections, that is, without applying any pre-filtering to clean the datasets, the resulting labeled datasets contain duplicate and irrelevant images. Overall, we gathered a significantly high number of labeled images for events such as Nepal Earthquake (~25,500) and Typhoon Ruby (~7,000) as compared to Ecuador Earthquake (~2,000) and Hurricane Matthew (~350 only).
Table 2. Number of labeled images for each dataset in each damage category
4. Real-time social media image processing pipeline
To be effective during disasters, humanitarian organizations require real-time insights from the data posted on social networks at the onset of an emergency event. To fulfill such time-critical information needs, the data should be processed as soon as it arrives. That means the system should ingest data from online platforms as it is being posted, perform processing and analysis to gain insights in near real-time. To achieve these capabilities, we have recently presented an automatic image processing pipeline (Alam, Imran, & Ofli, Citation2017). shows the pipeline and its various critical components and modules, which we describe next.
Figure 4. Automatic image processing pipeline
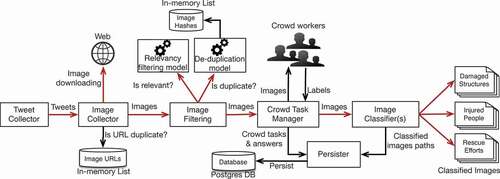
4.1. Tweet collector
The Tweet Collector module is responsible for collecting live tweets from the Twitter streaming API.Footnote5 The system can be set up to collect tweets from multiple disasters happening at the same time. To create a collection in the system for a specific event (e.g., an earthquake), the user specifies either keywords, hashtags, geographical bounding boxes, and/or Twitter users. In the case of geographical bounding box option, only geo-tagged tweets are collected, however, one can use both the keywords and bounding box options to get tweets matching either one of the keywords or tweets within the defined geographical areas. Although the pipeline can be extended to consume images from other social media platforms such as Facebook, Instagram, etc., in this article, we focus only on collecting images that are shared via the Twitter platform.
4.2. Image collector
Tweets collected by the Tweet Collector are ingested by the Image Collector module to extract image URLs from the collected tweets. Next, given the extracted URLs, the Image Collector downloads images from the Web (i.e., in many cases from Flickr or Instagram). Due to re-tweets, a large proportion of collected tweets consist of duplicate URLs. To avoid downloading duplicate images, the system maintains an in-memory list (i.e., linked hash map) of unique URLs (i.e., Image URLs database in ). Each collection in the system maintains its own database. A newly arrived image URL is first checked against the in-memory database to find duplicates. If the URL is unique, it is added to the Image URLs list and also pushed into another queue that keeps all the pending URLs waiting for their corresponding images to be downloaded from the Web. If the URL is found as duplicate, it is simply discarded. This in-memory list has a constant time complexity, O(1), for adding and searching an element, and its space complexity is O(n).
Once image URLs are in the queue, the system starts downloading images that are then published to a collection-specific Redis channel.Footnote6 All subscribers of that channel immediately receive images as they are downloaded.
4.3. Image filtering
This module aims at reducing the noisy content in the incoming imagery data stream. As described earlier, two types of images are considered as noise in this work: (i) images that are duplicate or near-duplicate, and (ii) images that are irrelevant for disaster response. By removing the noisy content in the imagery data stream, the Image Filtering module achieves two important goals: First, to filter-out irrelevant images posted during disasters to provide only relevant and informative content to disaster managers. Second, to boost the performance of human workers, as shown in the pipeline (i.e., the Crowd Task Manager module), by removing irrelevant and near-duplicate images. If human workers, who are supposed to label images for various machine learning tasks, are kept busy to label too many irrelevant or duplicate images, their time will be wasted and so the budget. Hence, the Image Filtering module shown in comprises two submodules, i.e., relevancy filtering and de-duplication filtering, which are described next. The image filtering module passes the image byte stream to these submodules and combines their outputs in a JSONFootnote7 stream to pass it to the Crowd Task Manager module.
Relevancy filtering
The Relevancy Filtering submodule receives an image byte stream as input and passes it through the relevancy classifier, which outputs a class label and a confidence score. Here, one of the state-of-the-art CNN architectures (i.e., VGG-16) is employed to determine whether the given image is relevant or not. Further details regarding the design of the relevancy classifier and its performance are presented later in the Relevancy Filtering Experiments subsection. The Relevancy Filtering submodule then returns the classification outputs to the Image Filtering module.
De-duplication filtering
Similar to the Relevancy Filtering submodule, the De-duplication Filtering submodule receives an image byte stream as input, and implements the perceptual hashing techniqueFootnote8 to determine whether a given image is an exact- or near-duplicate of previously seen images. Put specifically, for each received image, a hash value is computed and compared against the in-memory image hashes to detect duplicate or near-duplicate cases based on their Hamming distances (Hamming, Citation1950). The motivation of using this approach is that it is computationally simpler and performs reasonably well compared to the deep learning-based approach. However, we have also conducted experiments using deep features. We present our experimental findings in the De-duplication Filtering Experiments subsection. The De-duplication Filtering submodule then returns its duplicate-or-not decision to the Image Filtering module.
4.4. Crowd task manager
The Crowd Task Manager module is responsible for assigning image tagging tasks to the Standby Task Force (SBTF) volunteers. An end-user creates a task, which we also call classifier (more details regarding the classifiers follow in the next section), that consists of a set of classes (e.g., severe damage, mild damage, and little-to-no damage). The Crowd Task Manager shows an image and the list of classes to a human labeler. The labeler selects an appropriate label for the image, which is then considered as a training example.
4.5. Image classifiers
After removing duplicate and irrelevant images, the system allows end users (e.g., crisis managers) to define image classifiers specific to their information needs. For instance, to gather images that show some kind of damage, a damage assessment classifier can be created. Similarly, an injured people detection classifier can be created to gather all the images that show people with some injuries. More than one classifier can also be created to classify images in parallel (e.g., both damage assessment and injured people detection classifiers). A classifier can consist of two (binary) or more classes (multi-class). More details on training image classifiers for different use cases are presented later in the Experimental Framework section. As shown in , the Image Classifiers module receives two types of images from the Crowd Task Manager for two purposes. One set is human-labeled images, which are used to train the user-defined image classifiers. The other is un-labeled images, which are automatically labeled using the designed classifiers by the machine. The Image Classifiers module then combines the classified information (i.e., class labels and confidence scores), and passes them to the Persister module to persist.
4.6. Persister
The Persister module is responsible for all database-specific operations such as insertion of images’ meta-data, storage, and retrieval of classifiers’ predictions. Moreover, it also persists machine-tagged images into the file system. We use PostgreSQLFootnote9 database to persist tweets and their meta-data.
All the modules described above communicate with each other (i.e., data flow) using Redis channels. Moreover, each module has a set of RESTFul APIs to enable external interactions (e.g., UI interactions) and to set parameter values, if required. Red arrows in represent live streams carrying data items, whereas black arrows show non-streaming communications. The system is implemented using the Java Enterprise Edition (J2EE)Footnote10 programming language.
5. Experimental framework
In this section, we discuss the design and development of the relevancy classifier, de-duplication filter, and damage assessment classifier. We then present four different experimental settings to evaluate the performance of our image filtering and damage assessment modules. We use several well-known metrics such as accuracy, precision, recall, F1-score, and AUC to evaluate the performance of different components of the system. Accuracy is computed as the proportion of correct predictions, both positive and negative. Precision is the fraction of the number of true positive predictions to the number of all positive predictions. Recall is the fraction of the number of true positive predictions to the actual number of positive instances. F1-score is the harmonic mean of precision and recall. AUC is computed as the area under the precision-recall curve.
5.1. Relevancy filtering experiments
The Relevancy Filtering module employs a convolutional neural network to determine whether an image is relevant or not. Specifically, we use VGG-16Footnote11 (Simonyan & Zisserman, Citation2014) architecture to train a relevancy model using the DeepLearning4J library.Footnote12 It is important to note that the human annotation process presented in the Data Collection and Annotation section was designed mainly for assessing the level of damage observed in an image, but no question was asked regarding the relevancy of the actual image content. Hence, we lack ground truth human annotations for assessing the relevancy of an image content. One solution would be to construct a set of rules or hand-design a set of features to decide whether an image is relevant or not. However, we avoided such an approach in order not to create any biased or restricted definition of relevancy that may lead to discarding potentially relevant and useful data. Instead, we decided to rely on the human-labeled data to learn a set of image features that represent the subset of irrelevant images in our datasets, following a number of steps explained in the sequel.
Ground-truth collection procedure
First, we evaluated all images that have been annotated originally for damage assessment task (see the Data Collection and Annotation section). Second, we considered all images in the severe and mild categories as relevant. Third, we observed that the none category contained two types of images: (i) the ones that were still related to the disaster event but did not simply show any damage, and (ii) the ones that were not related to the disaster event at all, or the relation could not be immediately understood just from the image content. Fourth, we noted that this latter set of images in the none category should be considered as irrelevant. Hence, to identify the set of images in the none category that could be deemed as irrelevant, we used the original VGG-16 model (Simonyan & Zisserman, Citation2014) to classify each image into one of the ImageNet object categories. The aim here was to specify which ImageNet object classes appeared the most for the irrelevant portion of the none category images. For this purpose, we looked at the distribution of the most-frequently-occurring ImageNet object classes for the none category images. We then evaluated the most prevalent 50 object classes (which already accounted for half of the none category images) and kept only those that appeared relatively rarely (e.g., at least 10 times less) across the set of relevant images. As a result of this analysis, we were able to select 14 ImageNet object classes (including website, suit, lab coat, envelope, dust jacket, candle, menu, vestment, monitor, street sign, puzzle, television, cash machine, and screen) that we used to identify irrelevant images in our none category. Consequently, this approach yielded a set of 3,518 irrelevant images. We also randomly sampled an equal number of images from our relevant image set (i.e., images that are originally labeled as severe or mild) to create a balanced dataset of 7,036 images, which we then used to train a binary relevancy classifier.
Relevancy classifier training and fine-tuning
As discussed earlier, the transfer learning approach is effective for visual recognition tasks (Ozbulak, Aytar, & Ekenel, Citation2016; Yosinski, Clune, Bengio, & Lipson, Citation2014) when the dataset in the new domain is a small. Therefore, we adopted a transfer learning approach using the existing weights of the pre-trained VGG-16 network as an initialization for fine-tuning the same network on our own training dataset. We also adapted the last layer of the network to handle binary classification task (i.e., two categories in the softmax layer) instead of the original 1,000-class classification. Hence, this transfer learning approach allowed us to transfer the features and the parameters of the network from the broad domain (i.e., large-scale image classification) to the specific one (i.e., relevant-image classification). We used 60% of our 7,036 images for training and 20% for validation during fine-tuning of the VGG-16 network. We then tested the performance of the fine-tuned network on the remaining 20% of the dataset.
Results
presents the performance of the resulting relevancy filter on the test set. Almost perfect performance of the binary classifier stems from the fact that relevant and irrelevant images in our training dataset have completely different image characteristics and content (as can be seen from the example images in , and ). This meets our original relevancy filtering objective to remove only those images that are surely irrelevant to the task at hand. Note that we reserve these 7,036 images only for relevancy filter modeling, and perform the rest of the experiments presented later using the remaining 27,526 images.
Table 3. Performance of the relevancy filter on the test set
5.2. De-duplication filtering experiments
To detect exact- as well as near-duplicate images, the approach we followed is as follows. For a given pair of images (a,b), a and b are considered near- or exact-duplicate when . Depending on the problem different distance functions can be applied, and the threshold can be learned empirically. In this study, we investigated two different approaches to detect duplicate images: (i) perceptual hashing-based approach, and (ii) deep learning-based approach.
For the first experiment, we analyzed perceptual hashing-based approach. Perceptual hashing technique extracts certain features from each image, and computes a hash value (i.e., a binary string of length 49) for each image based on these features, and compares the resulting pair of hashes to decide the level of similarity between the images. During an event, the system maintains a list (i.e., in-memory data structure) of hashes computed for a set of distinct images it receives from the Image Collector module (see the Image Collector subsection). To determine whether a newly arrived image is duplicate of a previously seen image, hash value of the new image is computed and compared against the list of stored hashes to calculate its distance from the existing image hashes. In our case, we use the Hamming distance to compare two hashes. If the distance between the hash of a newly arrived image and a hash in the list is smaller than d (threshold) then we consider the newly arrived image as a duplicate image. We always keep the recent 100K hashes in the physical memory. This number obviously depends on the size of available memory in the system.
To detect duplicate images, one important factor is to define an optimal distance threshold d. For this purpose, we manually investigated all image pairs with a Hamming distance between 0 to 20. Pairs with distance looked trivially distinct, and thus, were not selected for manual annotation. We then visually examined each remaining image pair and assigned a value of 1, if the images in that pair should be considered duplicate, and 0 otherwise. As a result of this process, we collected 550 image pairs (i.e., 1,100 images in total) with ground truth duplicate-or-not annotations.
For the deep learning-based experiment, we extracted deep features from fc7 layer of the VGG-16 network trained on ImageNet (i.e., last 4,096-dimensional layer before the softmax layer) for all 550 image pairs, and computed the Euclidean distance between each image pair.
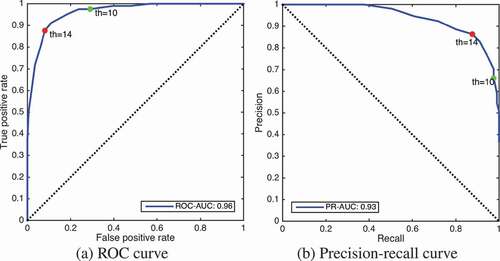
Results
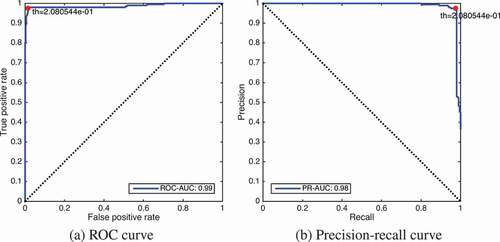
depicts Receiver Operating Characteristic (ROC) and precision-recall curves for the de-duplication experiments. We determine the appropriate threshold value for our de-duplication filter as by analyzing the optimal operation point of the ROC curve plotted in (marked with a red dot). This approach provides us the best trade-off between the cost of failing to detect true positives against the cost of raising false alarms. As can be seen from , this threshold value achieves a score of almost 0.9 for both precision and recall. If, however, one wants to have almost perfect recall (i.e., guarantee almost not to miss any potentially unique image) at the expense of raising false alarms, then setting the threshold value as
(marked with a green dot in ) achieves a recall score of almost 1.0 and a precision score of 0.65. also indicates that the system achieved
for ROC and
for precision-recall curve.
Figure 5. Estimation of distance threshold d for duplicate image detection using perceptual hashing-based approach
In , we present ROC and precision-recall curves for the experiment where we replaced perceptual hash features with deep features for de-duplication filtering. According to these plots, is the appropriate threshold value (i.e., optimal operation point on ROC curve) that achieves almost perfect scores in all measures (i.e., precision, recall, and AUC) on our test set.
Figure 6. Estimation of distance threshold d for duplicate image detection using deep learning-based approach
To illustrate the benefits of the image filtering components as well as to understand what proportion of the data on online social networks is potentially relevant, we apply our proposed relevancy and de-duplication filtering modules on images in our dataset. shows the number of images retained in the dataset after each image filtering operation. As expected, relevancy filtering eliminates 8,886 of 18,186 images in none category, corresponding to an almost
reduction. There are some images removed from the severe and mild categories (i.e., 212 and 164, respectively) but these numbers are in the acceptable range of 2% error margin for the trained relevancy classifier as reported earlier. De-duplication filter, on the other hand, removes a considerable proportion of images from all categories, i.e.,
,
and
from severe, mild and none categories, respectively. The relatively higher removal rate for the severe and mild categories can be explained by the fact that social media users tend to re-post the most relevant content more often. Consequently, our image filtering pipeline reduces the size of the raw image data collection by almost a factor of 3 (i.e., an overall reduction of
) while retaining the most relevant and informative image content for further analyses, which we present in the next section.
Table 4. Number of images that remain in our dataset after each image filtering operation
5.3. Damage assessment experiments with image filtering
One of the important goals of our study was to understand the effect of image filtering on the task-specific subsequent classifier(s). Therefore, we have conducted experiments to analyze the effects of irrelevant and duplicate images on human-computation as well as machine training. For the experiments, we defined the following four settings for image filtering (i.e., relevancy and de-duplication filtering) followed by the damage assessment classification.
S1: We perform experiments on raw data collection by keeping duplicate and irrelevant images intact. The results obtained from this setting are considered as baselines for the next settings.
S2: We refine the S1 dataset by removing only the duplicate images. The aim of this setting is to learn the difference with and without duplicates.
S3: Similarly we remove only the irrelevant images from S1 dataset and keep the rest of the data. The aim here is to investigate the effects of removing irrelevant images from the training set.
S4: We remove both duplicate and irrelevant images. This is the ideal setting, which is also implemented in our proposed pipeline. This setting is expected to outperform others both in terms of budget utilization and machine performance.
To train a damage assessment classifier, we again opted for strategy of fine-tuning a pre-trained VGG-16 network (i.e., similar to designing the relevancy filtering model). However, we followed a slightly different approach while training our damage assessment model as follows: (i) the network is trained for 3-class classification where classes are severe, mild, and none, and (ii) the performance of the resulting damage assessment classifier is evaluated in a 5-fold cross-validation manner rather than using a train/validation/test data split.
Results
To simulate the above listed four settings, we fixed a budget of 6,000 USD. For simplicity, we assume 1 USD is the cost to get one image labeled by human workers.
In S1, the system spends full 6,000 USD budget to get 6,000 labeled images from the raw collection, many of which are potential duplicates. To simulate this, we randomly select 6,000 images from our labeled dataset while maintaining the original class distributions as shown in the S1 column of . We then use these 6,000 images to train a damage assessment classifier as described above, and present the performance of the classifier in the S1 column of .
Table 5. Number of images used in each setting: S1 (with duplicates + with irrelevant), S2 (without duplicates + with irrelevant), S3 (with duplicates + without irrelevant), S4 (without duplicates + without irrelevant)
Table 6. Precision, Recall, F1 and AUC scores: S1 (with duplicates + with irrelevant), S2 (without duplicates + with irrelevant), S3 (with duplicates + without irrelevant), S4 (without duplicates + without irrelevant)
In S2, we take the same subset of 6,000 images used in S1, and run them through our de-duplication filter to eliminate potential duplicates, and then, train a damage assessment classifier on the cleaned subset of images. S2 column of shows the class-wise distribution of the remaining images after de-duplication. We see that 598, 121, and 459 images are marked as duplicate and discarded in severe, mild, and none categories, respectively. Evidently, this indicates a budget waste of 1,178 USD (20%) in S1, which could have been saved if the de-duplication technique was employed. The performance of the damage assessment classifier trained on the cleaned data is shown in S2 column of .
In S3, we first apply relevancy filtering operation on the raw collection and then sample 6,000 images from the clean set of 18,264 images. Note that this 6,000 sample may still contain duplicate or near-duplicate images. Even though the training data for S1 and S3 are not exactly the same, we can still try to compare the performance of the damage assessment model with and without irrelevant images. As we see from S1 and S3 columns of , the scores for none category in S3 are lower than those in S1 whereas the scores for severe and mild categories in S3 are higher than those in S1. After macro-averaging the scores for all categories, we see that overall F1-score for S3 is 1% higher than the overall F1-score for S2 while the macro-averaged AUC scores seem to be the same. However, due to the fact that having duplicate or near-duplicate images in the training and test sets yield untrustworthy model results, we do not intend to elaborate any further on this comparison.
In S4, we discard both duplicate and irrelevant images from the raw data collection and then sample 6,000 images from the remaining clean set of 10,481 images. S4 column of Table 13 presents the results of the damage assessment experiment on the sampled dataset, which does not contain duplicate and irrelevant images. If we compare the performance results for S3 and S4, we see that removing duplicate images from the training data eliminates the artificial increase in the performance scores, which is in agreement with the trend observed between S1 and S2.
6. System performance experiments
To understand the scalability of the proposed system, we conducted simulations to perform extensive stress testing. The experiments have been run on an iMac with a configuration of 32GB RAM, and a GHz processor with 4 cores. The simulation experiments were conducted using
images. We developed a simulator program to mimic the behavior of the Tweet Collector module. The simulator can be tuned to publish varying amounts of images (i.e., batches) to Redis channels in a given unit time, for example,
images/sec or
images/sec. To observe a module’s performance in terms of throughput and latency, we gradually increased the input load (i.e., number of images) while maintaining a unit time (i.e., in our case 1 second). Latency is the time taken by a module to process an image. As we deal with a batch of images, the latency is computed as the sum of processing times taken by a module to process all the images in a batch, which can then be divided by the number of images to get an average latency per image. On the other hand, the throughput is computed as the number of images processed by a module per unit time.
6.1. Image collector module
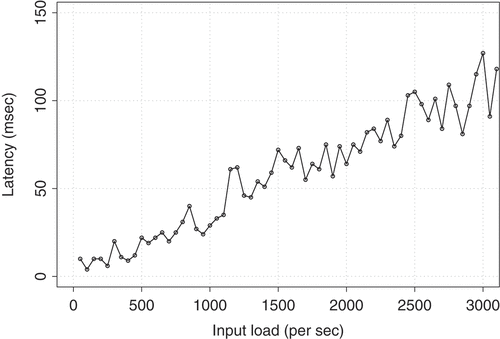
The Image Collector module maintains a list of unique image URLs. One technical challenge here is to determine the optimal size of the URL list so that the search process does not increase system’s latency. To determine the optimal size, we use the simulator to inject tweets with image URLs to the Image Collector module using different input loads. In , we present the latency for the URL de-duplication in the Image Collector module. As discussed in the Image Collector subsection earlier, for the URL de-duplication we maintain an in-memory list (i.e., a linked hash map data structure), which requires constant time complexity of for adding and searching an element. As suggested by , the system is very efficient in removing duplicate URLs while maintaining a low latency. The latency increases slightly as we increase the input load. From a throughput perspective, we observe that the Image Collector module is capable of adding and searching URLs with a linear unit time. Even though the system can handle high input loads efficiently, we have set a limit of
in size for the unique image URL list. Hence, oldest URLs are removed when the in-memory list reaches this limit.
Figure 7. Latency for the URL de-duplication in the Image Collector module
6.2. De-duplication filtering module
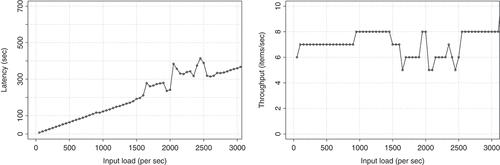
Once images are downloaded, the next step is filtering out duplicate images as discussed in the Image Filtering subsection. The image de-duplication process involves extracting image hashes, storing them into an in-memory list (i.e., a linked hash map data structure), and checking whether a newly arrived image hash matches with existing hashes based on a distance threshold. presents our findings from our simulation experiments for the De-duplication Filtering module. We observe that latency varies as we increase the batch size but the throughput remains quite constant. On average it can process ~8 images per second. For this module, we set the limit of in-memory list to 100K in size. Similar to the URL de-duplication, we also remove the oldest image hashes when the in-memory list reaches its limit.
Figure 8. Latency (left) and throughput (right) for the De-duplication Filtering module
6.3. Relevancy filtering module
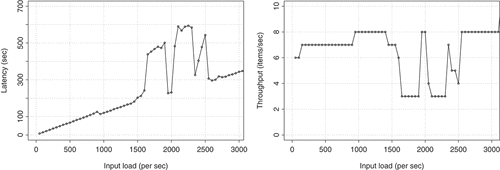
In , we present our findings of latency and throughput from the simulation experiments for the Relevancy Filtering module. Our relevancy classification model is computationally expensive. From , we observe that it can process at most nine images per second, and latency varies depending on the input load. However, it is important to note that one can expect to observe a significant improvement in latency and throughput if the stress testing experiments are performed on a GPU-based system rather than a CPU-based system as in our case.
Figure 9. Latency (left) and throughput (right) for the Relevancy Filtering module
6.4. Damage assessment classifier
In terms of prediction time, the classifier can classify ~10 images per second as presented in a benchmark comparison (Shi, Wang, Xu, & Chu, Citation2016). We observed a similar processing time from our exploratory analysis. With a similar argument to the Relevancy Filtering module experiments, a GPU-based system is expected to yield a significantly better latency and throughput performance than the current CPU-based system.
6.5. Latency of the overall system
It is worthwhile to also look at the latency of the whole image processing pipeline even though some parts of the system depend on external factors such as the local network infrastructure performance, image download speed from the Web, etc. Therefore, in our simulation experiments, we hosted images on the local server. In a real application, this latency will increase as the system will download images from external servers. From our analysis, we observed that if we increase the batch size the latency grows exponentially. We can infer that whole system can process on average ~50 images per minute, which we estimated by computing the sum of individual components' latencies.
7. Discussion
Our experimental results and analytical findings suggest that the proposed social media image processing pipeline consisting of relevancy filtering, de-duplication, and damage assessment modules are helpful in extracting useful information such as severity of the damage observed in an image. In addition, our pipeline reduces human annotation effort and cost required for processing the social media imagery data. Hence, we believe the contributions of the current study will advance the state of art in social media image processing for crisis response and management. However, we also acknowledge that there are some limitations of the current pipeline. Below we elaborate on the implications of our experimental findings, existing limitations of our system, and our future work in more detail.
Social media platforms provide quick access to situational information during time-critical events. However, large amounts of this data consist of irrelevant information, let alone useful, for disaster response. For instance, shows that 62% of the imagery data used in this work is irrelevant or redundant. Hence, to reduce information overload and to make other information processing tasks more efficient and robust (e.g., damage assessment through supervised machine learning), noisy data must be removed. This work presented techniques to prevent two major sources of noise, that is, near-to-exact duplicate and irrelevant images. Our experimental results showed that having such robust filtering techniques in place is quintessential. However, understanding and modeling actually the relevant image content (instead of what is irrelevant) still remains to be a core challenge and needs to be addressed more rigorously. Since different humanitarian organizations have different information needs, the definition of relevancy should be adapted or formulated according to the particular needs of each organization. Adapting a baseline relevancy model or building a new one from scratch is a decision that has to be made at the onset of a crisis event, which is what we aim to address in our future work.
We have also conducted experiments in four different settings (S1–S4) for damage severity assessment after image filtering. Although we observe an overall decrease in all performance scores in S2 as compared to S1, we claim that the performance results for S2 are more trustworthy for the following reason: In S1, due to the appearance of duplicate or near-duplicate images both in training and test sets, the classifier gets biased and thus shows artificially high but unreliable performance. More interestingly, we can see the benefit of removing irrelevant images when the data is already free from duplicates. That is, we can compare the results of the S2 and S4 settings, even though the training data for both settings are not exactly the same. At the category level, we observe a similar behavior as before, where the scores for the none category in S4 are slightly lower than those in S2 while the scores for the severe and mild categories in S4 are slightly higher than those in S2. If we compare the macro-averaged F1-scores, we see that S4 outperforms S2 by a small margin of 2%. In order to assess whether this difference in F1-scores between S2 and S4 is significant or not, we perform a permutation test (or sometimes called a randomization test) in the following manner. We randomly shuffle 1,000 times the input test image labels and the output model predictions within a common pool of S2 and S4 image subsets. Then, for each shuffle, we compute the difference in F1-scores for S2 and S4. Eventually, we compare the observed F1-score distance against the distribution of such sampled 1,000 F1-score differences to see if the observed value is statistically significantly away from the mean of the sample distribution. In our case, we get , which is not statistically significant but shows a certain trend toward the significance.
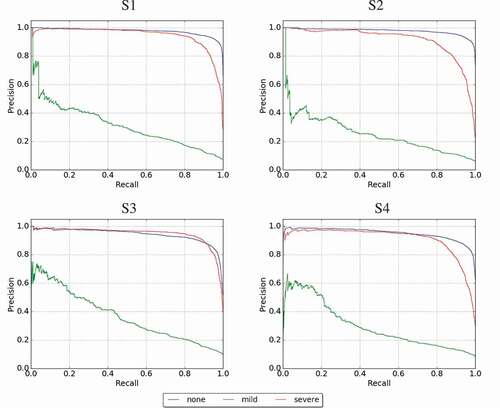
In order to have a closer look at the performance of the damage assessment classifier, we plotted the precision-recall curves for all four aforementioned settings in . It is evident that in three-class classification task, the hardest class (according to the classifier performance) is the mild damage category. In all the settings, we observe a low AUC for the mild category compared to the other two categories. One obvious justification of this is the low prevalence of the mild category compared to other categories (see ). More training data should fix this issue, which we plan as a future work. Otherwise, in all settings, the classifiers achieve high accuracy in classifying images into the severe and none categories. In general, in terms of machine training, the level of noise in a dataset affects the quality of the trained models, and hence, the overall performance of the designed system (i.e., high level of noise leads to a low-quality model, which in turn, leads to a poor system performance). In terms of human annotation, a noisy dataset also causes sub-optimal use of the available budget.
Figure 10. Precision-recall curves for all four settings: S1 (with duplicates + with irrelevant), S2 (without duplicates + with irrelevant), S3 (with duplicates + without irrelevant), S4 (without duplicates + without irrelevant)
At the moment our system considers one universal model for damage assessment that is expected to work for all types of disasters in real-world scenarios. However, images collected after an earthquake potentially have different image characteristics than those collected after a hurricane. How do key features of earthquake images differ from key features of hurricane images? To answer this question, we need to perform an exploratory study to understand the similarities as well as differences between key image features for different event types. This type of analyses will help us to build more robust classifiers, that is, either general classifiers for multiple disaster types or classifiers specific to certain disaster types as it seems quite unlikely that a single universal model can capture the variance of image features across all possible disaster types. Therefore, we state this as a potential limitation of the current study, and anticipate that an ensemble of disaster type-specific damage assessment models would yield better overall performance than a single universal model does.
Regarding the system performance experiments, the overall performance of different modules in the system is at a reasonable level. Given the fact that we employ computationally heavy deep neural network models (e.g., VGG-16) on CPU power, the system’s ability to process about 50 images per minute seems acceptable. During an on-going crisis situation, even if the system is able to produce a handful of most informative images in real-time, formal crisis responders would greatly benefit from these selected images. As stated earlier, we believe other factors such as more powerful computing resources (e.g., GPUs vs. CPUs) will significantly advance the system’s latency and throughput performance.
In the current work, we used labeled data from two different sources (i.e., paid and volunteers). It is worth performing a quality assessment study of these two types of crowdsourcing. In doing so, the goal would be to understand if there are differences in the quality of annotation agreements between annotators from two diverse platforms, i.e., Crowdflower vs. AIDR. We consider this type of quality assessment study as a potential future work.
Besides the relevancy, the veracity of the extracted information is of ultimate importance for humanitarian organizations to gain situational awareness and to launch relief efforts accordingly. We have not considered evaluating the veracity of images for the particular set of events investigated in this study. However, we plan to tackle this important challenge in the future.
In the end, this work is a first step toward building more innovative solutions for humanitarian organizations to gain situational awareness and to extract actionable insights from social media imagery data in real-time. We have only dealt with just the tip of the iceberg and there is a lot of room for improvement to achieve the ultimate goal.
8. Conclusion
User-generated content on social media at the time of disasters is useful for crisis response and management. However, understanding this high-volume, high-velocity data is a challenging task for humanitarian organizations. Existing studies indicate the usefulness of imagery data posted on social networks at the time of disasters. However, due to large amounts of redundant and irrelevant images, efficient utilization of the imagery content both using crowdsourcing or machine learning is a great challenge. In this article, we presented a social media image processing pipeline, which includes two types of noise filtering (i.e., image relevancy and de-duplication) and the damage assessment classifier. To filter out irrelevant image content, we used a transfer learning approach based on the state-of-the-art deep neural networks. For image de-duplication, we employed perceptual hashing techniques. We also performed an extensive experimentation on a number of real-world disaster datasets to show the utility of our proposed image processing pipeline. Moreover, we have performed a number of stress tests to determine the latency and throughput of individual modules. Initial performance results show the capability of our system to help formal crisis responders process images on social media in real-time.
In summary, based on the experimental analyse and findings, we believe the proposed real-time online image processing pipeline can help in extracting useful information from social media imagery content in a timely and efficient manner. Among other use cases, we believe that the presented image processing pipeline can enable humanitarian organizations in early decision-making by gaining situational awareness during an on-going event, or assessing the severity of damage incurred by a disaster.
Additional information
Funding
Notes on contributors
Firoj Alam
Firoj Alam is a Research Associate at QCRI, where he is contributing to the AIDR (Artificial Intelligence for Digital Response, http://aidr.qcri.org) project, specifically investigating semi-supervised deep learning algorithms to categorize social media messages related to emergencies, disasters, and humanitarian crises. His research interests include applied deep/machine learning, natural language processing, affective behavior and speech processing. Dr. Alam received his PhD in Computer Science from the ICT Doctoral School of the University of Trento, Italy, and M.Sc. in Human Language Technology from the same university. He received his B.Sc. in computer science and engineering from BRAC University, Bangladesh. As a part of his PhD, he has worked on behavioral signal processing (empathy, emotion, personality traits) from speech and text. He has been part of an EU conversation summarization project, SENSEI. During his master’s internship at FBK, Italy, in 2011, he worked on information extraction, particularly, Named Entity Recognition as a part of a live memories project (http://www.livememories.org/). As a researcher at BRAC University, he worked on Speech Synthesis from 2007 to 2010, a first contribution for Bangladeshi Bangla. He has published more than 30 research papers in international conferences and journals.
Ferda Ofli
Ferda Ofli is a Scientist at the Qatar Computing Research Institute (QCRI). Prior to joining QCRI, he was a postdoctoral researcher in the Teleimmersion Laboratory at the University of California, Berkeley, CA, USA, from 2010 to 2014. He received the B.Sc. degrees both in electrical and electronics engineering and computer engineering, and the Ph.D. degree in electrical engineering from Koc University, Istanbul, Turkey, in 2005 and 2010, respectively. His research interests cover computer vision, machine learning and multimedia signal processing. In recent years, he primarily focused on leveraging the social media image content in two fronts: one in a crisis computing setting for automated damage assessment and disaster response, and the other one in a healthcare setting for understanding the dietary habits of a population. He has published over 35 papers in refereed conferences and journals including CVPR, WACV, TMM, JBHI, and JVCI. He won the Elsevier JVCI best paper award in 2015, and IEEE SIU best student paper award in 2011. He also received the Graduate Studies Excellence Award in 2010 for outstanding academic achievement at Koc University.
Muhammad Imran
Dr. Muhammad Imran is a Scientist at the Qatar Computing Research Institute (QCRI) where he leads the Crisis Computing team. His interdisciplinary research focuses on natural language processing, text mining, human–computer interaction, applied machine learning, and stream processing areas. Dr. Imran has published over 50 research papers in top-tier international conferences and journals. Two of his papers have received the “Best Paper Award”. He has been serving as a Co-Chair of the Social Media Studies track of the ISCRAM international conference since 2014 and has served as Program Committee (PC) for many major conferences and workshops (ICWSM, ACM DH, ICWE, SWDM, etc.). Dr. Imran has worked as a Post-Doctoral researcher at QCRI (2013–2015). He received his Ph.D. in Computer Science from the University of Trento (2013), where he also used to co-teach various computer science courses (2009–2012).
Notes
11 VGG-16 is one of the state-of-the-art deep learning object classification models that performed the best in identifying 1,000 object categories in ILSVRC 2014 (http://image-net.org/challenges/LSVRC/2014/results#clsloc).
References
- Alam, F., Imran, M., & Ofli, F. (2017, August). Image4act: Online social media image processing for disaster response. In International conference on advances in social networks analysis and mining (ASONAM) (pp. 1–4). Sydney, Australia: IEEE/ACM.
- An, S., Huang, Z., Chen, Y., & Weng, D. (2017). Near duplicate product image detection based on binary hashing. In Proceedings of the 2017 international conference on deep learning technologies (pp. 75–80). Chengdu, China: ACM
- Attari, N., Ofli, F., Awad, M., Lucas, J., & Chawla, S. (2017, October). Nazr-cnn: Fine-grained classification of uav imagery for damage assessment. In Ieee international conference on data science and advanced analytics (dsaa) (pp. 1–10). Tokyo, Japan: IEEE.
- Babenko, A., Slesarev, A., Chigorin, A., & Lempitsky, V. (2014). Neural codes for image retrieval. In European conference on computer vision (pp. 584–599). Zurich, Switzerland: Springer
- Chen, T., Lu, D., Kan, M.-Y., & Cui, P. (2013). Understanding and classifying image tweets. In Acm international conference on multimedia (pp. 781–784). Barcelona, Spain: ACM.
- Chum, O., Philbin, J., & Zisserman, A. (2008). Near duplicate image detection: Min-hash and tf-idf weighting. In British machine vision conference (bmvc) (pp. 1–10). Leeds, UK: The University of Leeds.
- Cresci, S., Tesconi, M., Cimino, A., & Dellórletta, F. (2015). A linguistically-driven approach to cross-event damage assessment of natural disasters from social media messages. In Acm international conference on world wide web (pp. 1195–1200). Florence, Italy: ACM.
- Csurka, G., Dance, C. R., Fan, L., Willamowski, J., & Bray, C. (2004). Visual categorization with bags of key- points. In Workshop on statistical learning in computer vision, eccv(pp. 59–74). Prague, Czech Republic: Springer
- Daly, S., & Thom, J. A. (2016, May). Mining and classifying image posts on social media to analyse fires. In International conference on information systems for crisis response and management (iscram) (pp. 1–14). Rio de Janeiro, Brazil: Scopus.
- Donahue, J., Jia, Y., Vinyals, O., Hoffman, J., Zhang, N., Tzeng, E., & Darrell, T. (2014). Decaf: A deep convolutional activation feature for generic visual recognition. In International conference on machine learning (pp. 647–655). Beijing, China: International Machine Learning Society (IMLS). Retrieved from http://jmlr.org/proceedings/papers/v32/donahue14.html
- Dong, W., Wang, Z., Charikar, M., & Li, K. (2012). High- confidence near-duplicate image detection. In Proceedings of the 2nd acm international conference on multimedia retrieval (p. 1). Hong Kong: ACM.
- Everingham, M., Van Gool, L., Williams, C. K. I., Winn, J., & Zisserman, A. (2010, June). The pascal visual object classes (voc) challenge. International Journal of Computer Vision, 88(2), 303–338.
- Feng, T., Hong, Z., Fu, Q., Ma, S., Jie, X., Wu, H., & Tong, X. (2014). Application and prospect of a high- resolution remote sensing and geo-information system in estimating earthquake casualties. Natural Hazards and Earth System Sciences, 14(8), 2165–2178.
- Fernandez Galarreta, J., Kerle, N., & Gerke, M. (2015). UAV-based urban structural damage assessment using object-based image analysis and semantic reasoning. Natural Hazards and Earth System Science, 15(6), 1087–1101.
- Girshick, R. B., Donahue, J., Darrell, T., & Malik, J. (2014). Rich feature hierarchies for accurate object detection and semantic segmentation. In Ieee conference on computer vision and pattern recognition (pp. 580–587). Columbus, Ohio: IEEE.
- Gong, Y., Pawlowski, M., Yang, F., Brandy, L., Bourdev, L., & Fergus, R. (2015). Web scale photo hash clustering on a single machine. In Proceedings of the ieee conference on computer vision and pattern recognition (pp. 19–27). Hawaii, USA: IEEE.
- Hamming, R. W. (1950, April). Error detecting and error correcting codes. The Bell System Technical Journal, 29(2), 147–160.
- He, K., Zhang, X., Ren, S., & Sun, J. (2016, June). Deep residual learning for image recognition. In ieee conference on computer vision and pattern recognition (cvpr). Washington, DC: IEEE.
- Hughes, A. L., & Palen, L. (2009). Twitter adoption and use in mass convergence and emergency events. International Journal of Emergency Management, 6(3–4), 248–260.
- Imran, M., Castillo, C., Diaz, F., & Vieweg, S. (2015). Processing social media messages in mass emergency: A survey. ACM Computing Surveys, 47(4), 67.
- Imran, M., Castillo, C., Lucas, J., Meier, P., & Vieweg, S. (2014). AIDR: Artificial intelligence for disaster re- sponse. In Acm international conference on world wide web (pp. 159–162). Seoul, Republic of Korea: ACM.
- Imran, M., Elbassuoni, S. M., Castillo, C., Diaz, F., & Meier, P. (2013). Extracting information nuggets from disaster-related messages in social media. In International conference on information systems for crisis response and management. Baden-Baden, Germany: Scopus.
- Jégou, H., Douze, M., Schmid, C., & Pérez, P. (2010). Aggregating local descriptors into a compact image representation. IEEE Conference on Computer Vision and Pattern Recognition (CVPR) (pp. 3304–3311). San Francisco, USA: IEEE.
- Ke, Y., Sukthankar, R., & Huston, L. (2004). An efficient parts-based near-duplicate and sub-image retrieval system. In Acm international conference on multimedia (pp. 869–876). New York, NY: ACM.
- Krizhevsky, A., Sutskever, I., & Hinton, G. E. (2012). Imagenet classification with deep convolutional neural networks. In Advances in neural information processing systems (pp. 1097–1105). Lake Tahoe, USA: ACM.
- Lagerstrom, R., Arzhaeva, Y., Szul, P., Obst, O., Power, R., Robinson, B., & Bednarz, T. (2016). Image classification to support emergency situation awareness. Frontiers in Robotics and AI, 3, 54. doi:https://doi.org/10.3389/frobt.2016.00054
- Lazebnik, S., Schmid, C., & Ponce, J. (2006). Beyond bags of features: Spatial pyramid matching for recognizing natural scene categories. In Ieee conference on computer vision and pattern recognition (Vol. 2, p. 2169–2178). New York, NY: IEEE. doi: https://doi.org/10.1109/CVPR.2006.68
- Lee, D. C., Ke, Q., & Isard, M. (2010). Partition min-hash for partial duplicate image discovery. In European conference on computer vision (eccv) (pp. 648–662). Crete, Greece: Springer.
- Lei, Y., Qiu, G., Zheng, L., & Huang, J. (2014, July). Fast near-duplicate image detection using uniform randomized trees. ACM Trans. Multimedia Comput. Commun. Appl, 10(4), 1–35. 35. 15.
- Lei, Y., Wang, Y., & Huang, J. (2011). Robust image hash in radon transform domain for authentication. Signal Processing: Image Communication, 26(6), 280–288.
- Nguyen, D. T., Alam, F., Ofli, F., & Imran, M. (2017, May). Automatic image filtering on social networks using deep learning and perceptual hashing during crises. In International conference on information systems for crisis response and management (ISCRAM). Albi, France: Scopus.
- Nguyen, D. T., Ofli, F., Imran, M., & Mitra, P. (2017, August). Damage assessment from social media imagery data during disasters. In International conference on advances in social networks analysis and min- ing (ASONAM) (pp. 1–8). Sydney, Australia: IEEE/ACM.
- Ofli, F., Meier, P., Imran, M., Castillo, C., Tuia, D., & Rey, N.,. O. (2016). Combining human computing and machine learning to make sense of big (aerial) data for disaster response. Big Data, 4(1), 47–59.
- Oquab, M., Bottou, L., Laptev, I., & Sivic, J. (2014). Learning and transferring mid-level image representations using convolutional neural networks. In Ieee conference on computer vision and pattern recognition (pp. 1717–1724). Columbus, Ohio: IEEE. Retrieved from doi: https://doi.org/10.1109/CVPR.2014.222
- Ozbulak, G., Aytar, Y., & Ekenel, H. K. (2016, September). How transferable are cnn-based features for age and gender classification? In International conference of the biometrics special interest group (p. 1–6). Darmstadt, Germany: IEEE. doi: https://doi.org/10.1109/BIOSIG.2016.7736925
- Pesaresi, M., Gerhardinger, A., & Haag, F. (2007). Rapid damage assessment of built-up structures using vhr satellite data in tsunami-affected areas. International Journal of Remote Sensing, 28(13–14), 3013–3036.
- Peters, R., & Joao, P. D. A. (2015). Investigating images as indicators for relevant social media messages in disaster management. In International conference on information systems for crisis response and management. Kristiansand, Norway: Scopus.
- Reuter, C., Ludwig, T., Kaufhold, M.-A., & Pipek, V. (2015). Xhelp: Design of a cross-platform social-media application to support volunteer moderators in disasters. In Acm conference on human factors in computing systems (pp. 4093–4102). Seoul, Republic of Korea: ACM.
- Rivest, R. (1992, April). The md5 message-digest algorithm. RFC 1321, MIT Laboratory for Computer Science and RSA Data Security, Inc. (tools.ietf.org/html/rfc1321)
- Rudra, K., Banerjee, S., Ganguly, N., Goyal, P., Imran, M., & Mitra, P. (2016). Summarizing situational tweets in crisis scenario. In Acm conference on hypertext and social media (pp. 137–147). Nova Scotia, Canada: ACM.
- Rui, Y., Huang, T. S., & Mehrotra, S. (1997). Content- based image retrieval with relevance feedback in mars. International Conference on Image Processing (Vol.2, pp. 815–818). California, USA: IEEE.
- Russakovsky, O., Deng, J., Su, H., Krause, J., Satheesh, S., Ma, S., … Fei-Fei, L. (2015). ImageNet Large Scale Visual Recognition Challenge. International Journal of Computer Vision, 115(3), 211–252. doi:https://doi.org/10.1007/s11263-015-0816-y
- Sermanet, P., Eigen, D., Zhang, X., Mathieu, M., Fergus, R., & LeCun, Y. (2013). Overfeat: Integrated recognition, localization and detection using convolutional networks. CoRR, abs/1312.6229. Retrieved from http://arxiv.org/abs/1312.6229
- Shi, S., Wang, Q., Xu, P., & Chu, X. (2016). Benchmark- ing state-of-the-art deep learning software tools. arXiv preprint arXiv:1608.07249.
- Siddiquie, B., Feris, R. S., & Davis, L. S. (2011). Image ranking and retrieval based on multi-attribute queries. IEEE Conference on Computer Vision and Pattern Recognition (CVPR) (pp. 801–808). Colorado, USA: IEEE.
- Simonyan, K., & Zisserman, A. (2014). Very deep convolutional networks for large-scale image recognition. arXiv preprint arXiv:1409.1556.
- Starbird, K., Palen, L., Hughes, A. L., & Vieweg, S. (2010). Chatter on the red: What hazards threat reveals about the social life of microblogged information. In Acm conference on computer supported cooperative work (pp. 241–250). Savannah, USA: ACM.
- Szegedy, C., Liu, W., Jia, Y., Sermanet, P., Reed, S., Anguelov, D., … Rabinovich, A. (2015). Going deeper with convolutions. In Proceedings of the ieee conference on computer vision and pattern recognition (pp. 1–9). Boston, USA: IEEE.
- Szegedy, C., Vanhoucke, V., Ioffe, S., Shlens, J., & Wojna, Z. (2015). Rethinking the inception architecture for computer vision. CoRR, abs/1512.00567.
- Turker, M., & San, B. T. (2004). Detection of col- lapsed buildings caused by the 1999 izmit, turkey earthquake through digital analysis of post-event aerial photographs. International Journal of Remote Sensing, 25(21), 4701–4714. doi:https://doi.org/10.1080/01431160410001709976
- Wu, Z., Ke, Q., Isard, M., & Sun, J. (2009). Bundling features for large scale partial-duplicate web image search. In Computer vision and pattern recognition, 2009. cvpr 2009. ieee conference on (pp. 25–32). Miami, USA: IEEE.
- Xu, K., Ba, J., Kiros, R., Cho, K., Courville, A., Salakhudi- Nov, R.,., … Bengio, Y. (2015). Show, attend and tell: Neuralimage caption generation with visual attention. In International conference on machine learning (pp. 2048–2057). Lille, France: International Machine Learning Society (IMLS).
- Yosinski, J., Clune, J., Bengio, Y., & Lipson, H. (2014). How transferable are features in deep neural networks? In. Advances in Neural Information Processing Systems, 3320–3328. Montr'eal, Canada: NIPS.
- Zagoruyko, S., & Komodakis, N. (2016). Wide residual networks. CoRR, abs/1605.07146. Retrieved from http://arxiv.org/abs/1605.07146
- Zauner, C. (2010). Implementation and benchmarking of perceptual image hash functions. In Phd dissertation.
- Zeiler, M. D., & Fergus, R. (2014). Visualizing and understanding convolutional networks. In F. David, P. Tomas, S. Bernt & T.Tinne (Eds.), European conference on computer vision (ECCV14) (pp. 818–833). Zurich, Switzerland: Springer. doi:https://doi.org/10.1007/978-3-319-10590-1\_53
- Zheng, S., Song, Y., Leung, T., & Goodfellow, I. (2016). Improving the robustness of deep neural networks via stability training. In Proceedings of the ieee conference on computer vision and pattern recognition (pp. 4480–4488). Washington, DC: IEEE.