
ABSTRACT
Ubiquitous environments have considerable potential to provide services supporting daily activities (using public transportation to and from workplace, using ATM machines, selecting and purchasing goods in ticketing or vending machines, etc.) in order to assist people with disabilities. Nevertheless, the ubiquitous service providers generally supply generic user interfaces which are not usually accessible for all potential end users. In this article, a case study to verify the adequacy of the user interfaces automatically generated by the Egoki system for two supporting ubiquitous services adapted to young adults with moderate intellectual disabilities was presented. The task completion times and the level of assistance required by participants when using the interfaces were analyzed. Participants were able to access services through a tablet and successfully complete the tasks, regardless of their level of expertise and familiarity with the service. Moreover, results indicate that their performance and confidence improved with practice, as they required fewer direct verbal and pointer cues to accomplish tasks. By applying observational methods during the experimental sessions, several potential improvements for the automated interface generation process were also detected.
1. Introduction
Personal computing systems have frequently been used to support people with disabilities in different ways. For instance, in the last decade many devices and applications have been designed to assist local and remote communication, to allow users to control their environment, to enhance personal mobility, etc. (Accessible Technologies Observatory, Citationn.d.). More recently, advances in mobile technology and wireless data networks have allowed the development of the ubiquitous computing concept, which can be applied to support people to carry out daily life activities (Aizpurua et al., Citation2013).
Ubiquitous computing allows local computing machines to present and provide the available services directly to the users’ mobile device, as soon and as long as it is within the network range (Weiser, Citation1993). Nowadays, accessing services with mobile devices has become popular for everybody but especially for users with disabilities and, in fact, these devices may be considered as assistive technology (World Health Organization, Citationn.d.), relied on by these users to perform certain daily tasks. Therefore, ubiquitous computing presents a huge opportunity to facilitate access to more services for people with disabilities.
The abovementioned ubiquitous services are usually locally provided through automated machines such as ATMs, ticketing and vending machines, information kiosks, etc. However, the control of almost any available machine may be offered as a ubiquitous service. For instance, lifts can provide a remote control interface on users’ mobile device, escalators and doors can recognize the user and adapt their behavior to the user abilities, etc. This paradigm is frequently referred as Ambient Intelligence (AmI) and aims to proactively support the user with the minimum disturbance (Cook, Augusto, & Jakkula, Citation2009). However, many current services provide unique generic user interfaces for everybody, as they do not consider the specific characteristics of each user. These user interfaces may entail issues, ranging from severe accessibility barriers, which make the service inoperable for users with disabilities, to minor accessibility issues, which make the user experience unpleasant (Brajnik, Citation2008). Nevertheless, this paradigm affords a great opportunity for creating auto-personalization services that can be accessed through different platforms and input devices chosen by the user (Blanck, Citation2015). Evidently, if the provided user interfaces were accessible, numerous ubiquitous services would be very useful to assist people with disabilities to perform common tasks. In fact, people with sensory disabilities, such as blindness, or people with motor restrictions, such as paralysis, can have serious difficulties to operate most automated machines (e.g. to buy transport tickets, to control lifts, or to use ATMs). Nevertheless, they would be able to perform such activities through an accessible interface running on their own user-adapted mobile device.
Therefore, personalized interfaces might provide a solution in this context since generic user interfaces do not usually meet the needs of users with disabilities such as visual, motor, hearing, or speech impairments, or even combinations of impairments due to aging. However, interactions with these services are sporadic and, as a consequence, a new user interface has to be created for each use. Automated interface generation systems are applied in this field as they provide an affordable and maintainable process for addressing and/or modeling diversity of users, contexts, and devices (Antona, Savidis, & Stephanidis, Citation2006; Castillejo, Almeida, & López-de-Ipiña, Citation2014).
In order to provide each user with an accessible interface for ubiquitous services, we developed the Egoki system (Gamecho et al., Citation2015). Egoki automatically generates model-based user interfaces. We apply user, task, and context models in order to create user-tailored interfaces. This system was tested with users with disabilities in different use cases. The objective of this article is to analyze whether the automatically created interfaces are suitable for young adults with intellectual disabilities (IDs).
Our hypothesis is that young adults with ID would benefit from the use of supportive ubiquitous services if they were provided with accessible user-tailored interfaces. They would gain autonomy and self-confidence to perform daily life activities in dynamic outdoor environments such as airports, bus stations, museums, etc.
We conducted a case study in order to verify our hypothesis. First, we wanted to verify whether users were able to interact with a ubiquitous service and successfully perform a daily activity to which they were accustomed. Second, we analyzed their interaction with another service with which they were not familiar. To this end, we built two services with the use of Egoki: for the first case, a lunch menu selection service for the premises of the GUREAK Group (a sheltered workshop for young adults with ID (GUREAK, Citationn.d.)), and for the second one, an accessible user-tailored interface for accessing the city bus information system.
The results obtained show that all the participants involved were able to complete the proposed tasks in the case study by using the interfaces generated by Egoki. Data also indicate that participants improved their performance with a brief training session and gained autonomy in successfully completing tasks via the presented interfaces. Therefore, the automatically generated accessible user interfaces with the Egoki system proved to be suitable for interacting with the selected ubiquitous services.
2. Related work
This article is related to the Design for All (DfA) paradigm which proactively applies principles, methods, and tools to develop services and products accessible and usable for the whole population, thus guaranteeing universal access (Stephanidis, Citation2009). Bearing in mind that each person is unique, DfA has devoted special interest to people with disabilities.
The work presented in this article focuses on users with IDs referred to in the literature as people with ID. Historically, ID was defined by intelligent quotient scores (0–70 points for people with ID) according to the World Health Organization (n.d.). But current approaches focus on individual’s practical capabilities and support requirements according to their adaptive behavior, life skills, and social and physical abilities. The spectrum of these behaviors, skills, and abilities is very broad, so this user collective is quite heterogeneous ranging from those productive individuals who live independently to ones requiring lifelong care and support in all aspects of their daily life (Kennedy, Evans, & Thomas, Citation2011). All individuals with ID experience attention deficit or memory limitation (Stephanidis, Citation2009) among other issues with different levels of severity depending on their particular characteristics. This user collective comprises people from the autism spectrum, Down syndrome, hyperactivity, people with reading/writing difficulties, or even difficulties for memorizing procedures. The heterogeneity among users with ID disabilities led us to narrow down the characteristics of the target users in the case study. Young adults with moderate IDs that work in a sheltered workplace named GUREAK (Citationn.d.), located in San Sebastian (Spain), were recruited for the study. All participants in the study were employed at the time of the case study which was carried out between May 2012 and July 2012.
It is widely recognized that many individuals from this collective can perform daily activities if they have the necessary support (Keskinen, Heimonen, Turunen, Rajaniemi, & Kauppinen, Citation2012). This support may be provided by another person (e.g. a job coach, a tutor, or a relative) or by a suitably programmed device (Shafti, Haya, García-Herranz, & Alamán, Citation2012). However, most experience in this field has been devoted to the development of dedicated applications for stable indoor environments such as at home, in residential homes, or in sheltered workshops (Junestrand, Molin, Tollmar, & Keijer, Citation2003). There is a special interest in developing systems for training purposes with the objective of enhancing the independent task performance of people with IDs in job environments. Several works are focused on the development of prompting systems for picture or verbal cues based on Personal Digital Assistant (PDA) devices and localization mechanisms (Chang, Chen, & Chou, Citation2012; Chang, Chang & Wang, Citation2009) with the aim of reducing job coach intervention for task training. Other approaches have been made using gesture recognition based on Kinect-based prompting systems (Chang, Chen, & Chuang, Citation2011; Chang, Chou, Wang, & Chen, Citation2013). These systems trigger picture and verbal cues when the individuals are training for food preparation tasks alerting about the correctness/incorrectness of the actions performed. Nevertheless, this type of system may be only applied in limited situations and for determined tasks.
The user interface adaptation of existing services may be an adequate approach in order to increase the number of services to which this group of users can access. Some research works have been carried out to study the adaptation of existing web services to people with IDs (Buehler, Easley, Poole, & Hurst, Citation2016; Kennedy et al., Citation2011; Sevilla, Herrera, Martínez, & Alcantud, Citation2007). Most of the studies point out the need to reduce the information presented to individuals with ID as well as providing adequate navigation mechanisms. In this way, mobile web interfaces seem to be more adequate for these individuals as usually they provide a simpler way to access services by presenting only the most significant information (Hoehl & Lewis, Citation2011; Lewis, Citation2011; Zhang, McCrickard, Tanis, & Lewis, Citation2012). A promising approach to produce services for people with IDs may be to adapt the existing ones by applying suitable content visualization techniques and semantic web technologies to specify the priority and role of the information included in the interface (Sevilla et al., Citation2007).
Several examples exist of software that automatically generates or adapts user interfaces to people with disabilities such as Supple (Gajos, Weld, & Wobbrock, Citation2010) or AVANTI (Fink, Kobsa, & Nill, Citation1998). There is also a number of EU-funded projects proposing generic interoperable user models that describe the relevant characteristics (physical, cognitive and sensory characteristics, habits, preferences, and capabilities) to be taken into consideration for interacting with artifacts and user interfaces such as VICON (Citationn.d.), VERITAS (Citationn.d.), GUIDE (Duarte, Costa, Feiteira, & Costa, Citation2013), and MyUI (Peissner, Häbe, Janssen, & Sellner, Citation2012). Nevertheless, these systems are not focused on supporting daily activities of users with IDs.
Ubiquitous computing is an innovative and promising way to accomplish the objective of providing services to support the daily activities of users as it embeds computing capabilities into everyday objects that can be accessed and manipulated through the users’ adapted mobile devices by mobile web-type interfaces (Blanck, Citation2015).
In the last few years, various developments found in the literature show that the interest in applying ubiquitous computing to assist people with special needs has grown (Heng, Minn, & Phooi, Citation2011; Shafti et al., Citation2012). For instance, Heng et al. (Citation2011) present the SmartGuide caregiver monitoring system for wireless technology aimed at assisting visually impaired people to navigate the physical environment, especially in dynamically changing environments.
Regarding AmI environments, Shafti et al. (Citation2012) propose PAIR, a Personal Ambient Intelligent Reminder designed to support people with cognitive disabilities, their caregivers, and health professionals. PAIR provides features for creating a schedule of daily activities and reminds patients and caregivers when these activities must be performed. For an evaluation of PAIR carried out by a group of therapists, 17 activities with different levels of difficulty were given to each participant. In general, the therapists did not have major problems to use this technology. According to them, PAIR could provide great support to patients with cognitive disabilities. However, an evaluation with end users was not performed. Other personal assistive technologies for indoor environments have also been developed in recent years. Zheng and Motti (Citation2018) present WELI, a wearable application designed to assist young adults with intellectual and developmental disabilities in classrooms. It includes features such as behavioral intervention, mood regulation, reminders, checklists, surveys, and rewards. It was evaluated by a group of students and their assistants with positive feedback. Sonne and Grønbæk (Citation2016) evaluated assistive technology to be used in both school and home contexts for children with Attention Deficit Hyperactivity Disorder (ADHD). Some of the lessons learned to be considered when designing the domain of ADHD are presented in the work in order to help with the challenges these children have to face and which are also common in young adults with IDs such as difficulties to remember a sequence of instructions, handling transitions between activities, and in sustaining attention.
A combination of user interface adaptation and ubiquitous computing would benefit from the advantages of both approaches as this would facilitate the creation of personalized user interfaces which take into account both the users and the context features. Some approaches toward adapting interfaces to the context can be found in the literature. Bongartz et al. (Citation2012) proposed a system for creating adaptive user interfaces in work environments. The system generates graphical, vocal, or multimodal user interfaces depending on the type of task the user is performing and the current context of use. However, this system is not devoted to people with disabilities. Daniel, Matera, and Pozzi (Citation2008) presented the Bellerofonte Framework based on Event-Condition-Action paradigm for the development of context-aware applications. This approach is totally focused on context properties and user aspects are not considered. A method and a set of tools for customizing the context-dependent behavior of web applications are presented in Ghiani, Manca, Paternò, and Santoro (Citation2017). They allow users to specify trigger–action rules for adapting the web interfaces, so personalized web application versions are created in specific contexts of use. Miñón, Paternò, Arrue and Abascal (Citation2016) present a model-based user interface development process which considers changes in the context to trigger adaptations at runtime. Two scenarios were studied in order to demonstrate the viability of the proposed user interface development process. One of them is devoted to a service which is adapted depending on the context of use at runtime. Nevertheless, to the best of the authors’ knowledge there is no system that automatically generates adapted user interfaces for different groups of users with disabilities in the context of ubiquitous environments.
In this article, the Egoki system has been applied to the adapted user interface generation of two ubiquitous services for a particular user population: young adults with moderate IDs. The generated interfaces have been evaluated by user testing based on definitions, principles, methods, and tools from User-Centered Design (Usability.gov, Citationn.d.).
According to Keskinen et al. (Citation2012), evaluating the usability and accessibility of technology for people with cognitive disabilities is challenging due to their personal characteristics. Unfortunately, there are no dedicated methods for evaluating technology for people with cognitive disabilities.
One method used by researchers for gathering relevant information about people with moderate-to-severe cognitive disabilities is to interview people in their close environment. This is the case of Dawe (Citation2006), which uses semi-structured interviews with parents and teachers of young people with cognitive disabilities in order to find the role technology plays in their lives, how they find, acquire, and use these technologies, and even what are the key factors that increase or decrease their adoption of technology.
Sutcliffe, Fickas, Sohlberg, and Ehlhardt (Citation2003) state that there is a lack of research on evaluation methods for people with cognitive disabilities. Even so, in some cases ordinary evaluation methods can be adapted to the special characteristics of people with cognitive disabilities. For example, Sohlberg, Ehlhardt, Fickas, and Sutcliffe (Citation2003) adapted the cooperative model in a pilot study into the usability of an e-mail interface designed for people with acquired cognitive-linguistics impairments employing a user-centered approach. The use of some expert evaluation methods, such as Cognitive Walkthrough (Polson, Lewis, Rieman, & Wharton, Citation1992), requires that the researchers understand the cognitive processing of end users. Due to the intrinsic difficulty of this task, some authors use more informal walkthrough methods (Lewis, Citation2005), combining usability testing with other observational methods. Zheng and Motti (Citation2018) propose the adaptation of some existing techniques for designing user studies with students with intellectual and developmental disabilities. The main design considerations are related to the assistants of students whose presence throughout the study is considered essential, the simplified surveys for gathering students opinions, the prevention of fatigue by carrying out short sessions (60 min at most), and preserving the privacy of participants by not logging any personally identifiable information.
Lepistö and Ovaska (Citation2004), instead of a conventional usability test, conducted an informal walkthrough in addition to observation and interviews in a case study with a group of users with cognitive disabilities. According to these authors, many usability problems would have been overlooked without the observational methods. Interviewing is a widely used method for qualitative data collection. However, interviewing a participant with cognitive disabilities requires special consideration. These authors propose using simple and clear language to guide the interview properly and to elicit answers from the participants. Johansson, Gulliksen, and Lantz (Citation2015) analyze user participation in Information Technology development processes when users have mental and cognitive disabilities. They carried out a study with 100 participants where different methods of user participation were studied concluding that a mixed-method approach combining methods and tools enables a fuller and richer participation.
Informal walkthrough is also proposed in Riihiaho (Citation2009). This author suggests that in informal walkthrough sessions, the participants should be asked to explore the objective (i.e. a system or a user interface) as if they were alone and to think aloud while exploring it. According to Riihiaho, the researcher may interrupt the participants to ask questions, but he or she should mainly observe them. In the case of a multiuser system, the setting can be more natural if the users are paired or grouped to explore the given system together instead of doing it individually.
Regarding assistance during the evaluation, authors such as Keskinen et al. (Citation2012) state that the presence of the participant’s caregiver would be required in evaluations with severely cognitively disabled people. This kind of assistance should be measured somehow in order to determine the user autonomy in using the given system or tool, especially for users with cognitive disabilities. For instance, in Stock, Davies, Wehmeyer, and Palmer (Citation2008), apart from the measurement of user accuracy, the amount of assistance needed (i.e. the reverse of the user autonomy) was also measured. If the participant made an error, a prompt was given in order to get him or her back on track and to avoid this error. Moreover, it is usual for the participants to receive training until they are able to use the system autonomously.
In line with these approaches and as explained in detail below, we conducted a use case assessment where both quantitative and qualitative measures were made and the level of assistance was also taken into consideration. Observational methods were also used during the testing. The participants were young adults with moderate IDs, working in a company. Each participant had an associated job coach who was also in the experimental sessions in order to monitor and assist them as well as to mediate in the interviews. The sessions were limited to 1 hr in order to prevent participant fatigue. In our study, we also interviewed the job coaches to obtain a wider knowledge about the participants’ characteristics and their level of expertise with technology.
3. The Egoki system
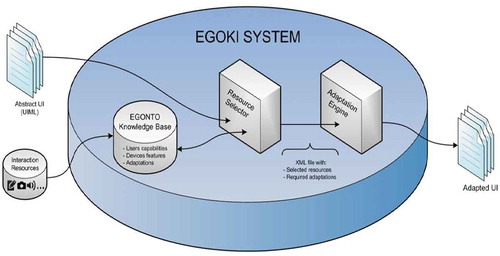
The Egoki-automated user-tailored interface generator was developed with the aim of creating user interfaces tailored to the user and device features. It requires a logical description of the user interface and the provision of suitable multimodal interaction resources. In order to provide the logical description and to univocally specify the functionality of the user interface, a User Interface Description Language is required. For Egoki, we adopted User Interface Markup Language (UIML) (Phanouriou, Citation2000) because it includes the necessary mechanisms to map different types of resources to each interaction element (pictogram, text, audio, etc.) giving us an effective way to provide multimodality in the user interfaces (Gamecho et al., Citation2015). The accessible final user interface is automatically generated from that formal description, also taking into account the information about the user’s characteristics that is stored in an ontology specifically developed for this system and named EGONTO (see ). The EGONTO ontology includes three main models: the user model describing the interaction abilities (cognitive, physical, sensory) of individuals, the device model specifying software and hardware components of their device, and the adaptations model specifying content, presentation, and navigation adaptation techniques for user-tailored interfaces. Some generic rules are also included to cover the needs of specific groups of people with special needs (such as vision, hearing, cognitive, and motor impairments). The set of interface adaptations to be put in place by the Egoki system for creating an adapted user interface is the result of applying these reasoning rules.
Figure 1. Egoki user interface generation process
As regard the resources, any functionality described in the logical description is related to a group of elements. Each element of a group corresponds to a type of resource. Currently, a number of different types of resources are supported, among which the following can be highlighted:
text, the usual text present in the interfaces
simplified text, an alternative to the usual text provided for people with reading difficulties
audio, the usual audio files added to some elements of the interfaces
text transcription, an alternative to audio elements in the interfaces
video, the usual video present in some interfaces
video with subtitles, video with text included as an alternative to audio and where descriptions about the actions that happen in the video are added to the sounds on it and
images or pictograms, which represent interface buttons or an alternative to textual elements for people with reading difficulties.
By taking these inputs into account, the automatic generation of user interface process selects suitable adaptation rules and the most adequate multimedia resources for the user group and the service to interoperate with. The user interface generation consists of three main phases (Gamecho et al., Citation2015):
Retrieving the information on functionalities of the interfaces and the available media resource types for the interaction elements to be included.
Querying models to select resources and interface adaptations according to users and device features.
Constructing the final user-tailored interface.
In this way, providing resources tailored to the requirements of the users and performing, when necessary, additional adaptations, can guarantee the interaction of a person with disabilities.
A study of the adaptation techniques to be applied for the generation of interfaces for people with disabilities was performed in order to include appropriate techniques into the Egoki System. For the case study presented in this article, authors focused on adaptations tailored to young adults with cognitive disabilities. In this case, the participants had IDs which compromised their reading, learning, and memory capabilities. The adaptation rules for this collective were gathered from different resources (Brajnik, Citationn.d.; Bunt, Carenini & Conati, Citation2007; Kurniawan, King, Evans, & Blenkhorn, Citation2006; Kennedy et al., Citation2011; Protocolo NI4, Citationn.d.; Richards & Hanson, Citation2004; WebAim, Citationn.d.-a) and are included in the system based on the taxonomy of Knutov, De Bra, and Pechenizkiy (Citation2009): content adaptation rules, navigation adaptation rules, and presentation navigation rules. The content adaptation rule set includes techniques such as the provision of information in multichannel modality in order to improve the comprehension of the content. The navigation adaptation set includes techniques such as providing a logical task sequence. Finally, the presentation adaptation set includes techniques such as grouping elements in order to reduce the information overload. Section 4.5 provides greater detail of the specific adaptation techniques applied for this case study.
More detailed information on the Egoki system, such as implementation features, can be found in Gamecho et al. (Citation2015)
4. Method and experiment
A case study was carried out in order to perform a user evaluation of the interfaces automatically generated by the Egoki system. Two ubiquitous services were deployed on the premises of GUREAK Group and nine participants were recruited for the experimental sessions. GUREAK (Citationn.d.) is an Industrial Group composed of sheltered workshops that employ more than 4,000 people: 83% of these are people with disabilities and 55% have cognitive disabilities. The interfaces were automatically generated by applying the adaptation techniques for this type of user. They were asked to complete several tasks through the two ubiquitous services. One of them was a service with which they were slightly familiar (a lunch menu selection service). Currently, they can access an intranet where the daily lunch menu is presented but it is only an informational web page. The other service was completely new to them (a local public bus information service).
It is worth mentioning that other evaluations perform comparison studies between an original user interface and a personalized version of it. However, this is not the case since our user interfaces are automatically generated from a service description and, as a consequence, there is no baseline user interface. In addition, despite being able to create one, this case study is not focused on assessing whether the Egoki system improves the interaction of users with disabilities by applying specific adaptation rules to a previously created user interface. By contrast, this case study was designed to explore the following research questions:
Q1: Are the interfaces provided by Egoki accessible enough for participants so that they are able to complete the proposed tasks in both services within a limited time and improve their performance with practice?
Q2: Are the developed ubiquitous services an adequate support for completing daily activities so participants complete the tasks regardless of their expertise in computing and their previous experience with the services?
4.1. Participants
Nine people (five males and four females) with IDs were recruited. All participants were recruited through GUREAK. First, representatives of GUREAK were officially informed about the study purpose and the developed services. Then, it was the job coaches who selected participants from their working groups considering their cognitive abilities and their willingness to be involved in the study. The median age of participants was 35 years, with an age range of 27–43. All of them were working at the GUREAK Group and had moderate IDs which implied a medium level of attention, perception, language processing, learning and memory abilities, and a low level of concentration and concept formation. Their job coach who has been working with them for several years provided us with the information related to their cognitive capabilities. The level of expertise with computers varied among participants: two participants had little expertise with computers, five claimed to have some, and the remaining two admitted having considerable expertise with desktop computers. However, they were not able to give the precise number of years of experience, nor the frequency of use. shows their demographic data and level of expertise.
Table 1. Demographic data and computer expertise of participants (M: male; F: female)
4.2. Apparatus
In order to conduct the test, the following devices were set up for the experimental sessions:
A server where the Egoki system was installed, including all the multimedia resources associated with the two ubiquitous services.
A wireless local network to deploy and provide ubiquitous services.
Two cameras to record the interaction of each user.
A printer to print out the proof of task completion by participants.
An off-the-shelf tablet with Android 4.0.3 operating system and Google Chrome web browser.
The selected access device was a tablet computer, which was recommended by the participants’ job coach. The participants did not use any specific assistive technology for the test. However, the job coach who usually helped them to use technology in their workplace accompanied all the participants. This was a requirement in order to maintain suitable and efficient communication with the participants as well as to provide support to the participants during the test sessions. This support was measured as the level of assistance.
4.3. Design
The study followed a within-subjects design. All involved participants completed two tasks in both services: lunch menu selection service (Service 1) and local bus information service (Service 2). The order of presentation for the services was counterbalanced so five participants started with Service 1 (Order 1) and four participants started with Service 2 (Order 2).
4.4. Tasks
Two different tasks were defined in both services: the first one (Task 1) was a predefined task (the participants had to select specific options from the lunch menu or search for information on a particular bus line); and the second (Task 2) was a free task (they could select any option for lunch or search for information on any bus line). The first one was intended as a training task while the second task was intended to analyze more natural interaction with the service. The order of those tasks was fixed in both services.
In Service 1, users had to select a lunch menu comprised of a first course, a second course, and a dessert. Each course had to be selected in a screen showing three options. Participants were able to move to the next or the previous screen by pushing “next” or “previous” button. After selecting all the courses, users had to confirm their menu choice in a screen showing all the courses they selected by pushing a “confirmation” button. Following the confirmation, their choices were printed out. shows a user interface automatically generated by the Egoki system for one of the steps of Service 1.
Figure 2. User interface for selecting a first course, created by the Egoki system for young adults with intellectual disabilities. [Translation to English: “Primer plato; Segundo plato; Postre; Confirmar” mean First course; Main course; Dessert; Confirm, respectively. “Escoge el plato que quieres comer de primero” means Select a first course. “Ensalada,” “Macarrones,” and “Lentejas” mean Salad, Macaroni, and Lentils, respectively. “Siguiente” means Next.]
![Figure 2. User interface for selecting a first course, created by the Egoki system for young adults with intellectual disabilities. [Translation to English: “Primer plato; Segundo plato; Postre; Confirmar” mean First course; Main course; Dessert; Confirm, respectively. “Escoge el plato que quieres comer de primero” means Select a first course. “Ensalada,” “Macarrones,” and “Lentejas” mean Salad, Macaroni, and Lentils, respectively. “Siguiente” means Next.]](/cms/asset/9e2cf63c-6659-41d4-9155-b40c8eda340e/hihc_a_1559534_f0002_oc.jpg)
In Service 2, users had to search for information about bus services. They had to select between two bus lines shown on a screen. Then, the information regarding the time next bus was due to arrive was presented. Once they had found the required information, it was printed out as a confirmation of task completion after the “print” button was pushed. shows a user interface automatically generated by the Egoki system for one of the steps of Service 2.
Figure 3. User interface for a local bus information service created by the Egoki system for young adults with intellectual disabilities. [Translation to English: “Horario de la línea 33 dirección BERIO” means Schedule of bus line 33 to BERIO. “15:29 Hora de llegada aproximada” means Approximate arrival time 15:29. “10 minutos para que llegue” means 10 min to arrival. “Imprime este horario” means Print schedule.]
![Figure 3. User interface for a local bus information service created by the Egoki system for young adults with intellectual disabilities. [Translation to English: “Horario de la línea 33 dirección BERIO” means Schedule of bus line 33 to BERIO. “15:29 Hora de llegada aproximada” means Approximate arrival time 15:29. “10 minutos para que llegue” means 10 min to arrival. “Imprime este horario” means Print schedule.]](/cms/asset/883c5aa4-2f98-4627-9473-e8f8cdf12976/hihc_a_1559534_f0003_oc.jpg)
4.5. Stimuli
The Egoki System automatically generated the stimuli for the case study (see Section 3). To this end, a logical description for both services was implemented in UIML. Subsequently, these logical descriptions and the required resources were provided as the input of Egoki. Thus, Egoki was able to automatically generate the interfaces from scratch by applying the required adaptations. The main phases of the automated interface generation process are described in Section 3.
In this case study, the following list of adaptation techniques was applied:
4.6. Content adaptation rules
The content of the user interfaces is structured in order to maintain user attention, since the provision of an adequate structure helps people with cognitive impairments to focus on the user interfaces. For instance, several websites provide an excessive number of interaction elements in the same group. By contrast, this adaptation rule endeavors to reduce the number of elements to be provided in a group.
Information redundancy is used for a better understanding of the content by means of the multimodal resources employed. Each interaction element of the user interface is represented by a group of three resources conveying the same message, an image, an audio, and a text. This group of resources is presented as an atomic resource with the text under the image and the audio is reproduced when somebody interacts with the resource to provide additional feedback.
In the case of textual resources, instead of selecting the type of resource normal text, the type simplified text is selected in order to assist the reading comprehension of people with IDs. The simplified text resources are alternative textual elements, usually shorter than the normal text and written in simple language based on the guidelines for “Writing Clearly and Simply” (WebAim, Citationn.d.-b).
The information provided is grouped and outlined in order to help people with IDs who have less memory capacity.
4.7. Navigation adaptation rules
Simple and linear navigation is provided with few choices.
Special components are included in order to provide task sequence and orientation information to guide the users. These informative elements show the whole sequence of steps required to complete a task while highlighting the current step.
The partitioning of interfaces into smaller ones is also applied in order to simplify the interaction, allowing users to maintain their focus on simple steps of the tasks. To achieve this, two types of navigation schemes have been considered:
Sequential partition, for tasks that require a step-by-step interaction (e.g. the meal selection service).
Tree-based navigation, for services that show different information to the user based on their choice (e.g. the bus timetable service)
For the sake of consistency with the users’ possible previous experience, links such as “Previous Page” and “Next page” are used for navigating through partitioned user interfaces.
4.8. Presentation adaptation rules
Related components are grouped so the information is presented in small blocks in order to maintain user attention.
Main content is placed in the center of the screen.
Three types of interfaces were produced by the Egoki system for the two services. One of these is the main screen where the target service is selected. Logically, this contains two options to choose from so users can access the service the tasks are referring to: the lunch menu selection service (Service 1) or the local bus information service (Service 2). shows this screen. As shown in the figure, each service is represented by a picture and a text. In addition, an audio alternative for the text is triggered when selecting the option. The main content is placed at the center of the screen with no need for vertical or horizontal scrolling. Therefore, all the interface components are visible on the screen in order to avoid the user having to struggle with extensive options which are not visible (Buehler et al., Citation2016).
Figure 4. User interface for service selection created by the Egoki system for young adults with intellectual disabilities. [Translation to English: “Kiosko de información Guresare” means Guresare information Kiosk; “Elige tu comida favorita” means Select your favorite meal; “Consulta horarios de autobuses” means Get bus schedule; “Seleccionar el Servicio Escogido” means Select service.]
![Figure 4. User interface for service selection created by the Egoki system for young adults with intellectual disabilities. [Translation to English: “Kiosko de información Guresare” means Guresare information Kiosk; “Elige tu comida favorita” means Select your favorite meal; “Consulta horarios de autobuses” means Get bus schedule; “Seleccionar el Servicio Escogido” means Select service.]](/cms/asset/3609349d-9c34-4c4b-9cd9-2d308978c129/hihc_a_1559534_f0004_oc.jpg)
Another type of interface created by Egoki is the selection interface in which users choose options for the lunch menu or select the bus line. These interfaces have common features:
All options are represented by page-centered pictures. shows the options presented for Service 2 (local bus information service).
All options have a descriptive text and an audio alternative. shows an interface component for an option in Service 1 which includes a picture, text, and audio (the interface component shown represents the “salad” option for first course and the audio says “salad”).
A navigation bar is provided, so “step-by-step” structure is used to help the user in the navigation process. and show the navigation bar included in Service 1 at the top right of the screen. As can be observed in these figures, the active step is represented with color while the other options are shown in shades of gray. The task shown in these figures consists of four steps, one step for selecting each course of the menu and the last step for confirming the selections ( represents the navigation bar of the first step of the task and represents the last step of the task).
A minimal navigation system containing back and next buttons has been included at the bottom of the screen: the back button is located on the left hand side and the next button on the right hand side. and show the interface components included for this purpose.
The action to be performed, in this case, select an option, is represented by a “selection” pictogram. shows the pictogram selected for this purpose; it is a pointing hand.
Figure 5. User interface for option selection in the local bus information service created by the Egoki system for young adults with intellectual disabilities. [Translation to English: “Escoge la línea de autobús que quieres consultar” means Choose the bus line to get information about; “Consulta el horario del autobus 33 que va en direccion a las UNIVERSIDADES” means Get information about line 33 with destination UNIVERSIDADES; “Consulta el horario del autobus 33 que va en direccion a Berio” means Get information about line 33 with destination Berio; “Consulta el horario del autobus 40” means Get information about line 40; “Seleccionar línea de autobus escogido” means Select bus line.]
![Figure 5. User interface for option selection in the local bus information service created by the Egoki system for young adults with intellectual disabilities. [Translation to English: “Escoge la línea de autobús que quieres consultar” means Choose the bus line to get information about; “Consulta el horario del autobus 33 que va en direccion a las UNIVERSIDADES” means Get information about line 33 with destination UNIVERSIDADES; “Consulta el horario del autobus 33 que va en direccion a Berio” means Get information about line 33 with destination Berio; “Consulta el horario del autobus 40” means Get information about line 40; “Seleccionar línea de autobus escogido” means Select bus line.]](/cms/asset/c333122c-099b-4910-9ced-41512b0c3e37/hihc_a_1559534_f0005_oc.jpg)
Figure 6. User interface component for an option presented in Service 1. [Translation to English: “Ensalada” means Salad.]
![Figure 6. User interface component for an option presented in Service 1. [Translation to English: “Ensalada” means Salad.]](/cms/asset/72811f68-95b2-4a6b-989e-2eb93cbb1ed0/hihc_a_1559534_f0006_oc.jpg)
Figure 7. User interface component for the navigation bar representing the first step of the task in Service 1. [Translation to English: “Primer plato; Segundo plato; Postre; Confirmar” mean First course; Main course; Dessert; Confirm, respectively.]
![Figure 7. User interface component for the navigation bar representing the first step of the task in Service 1. [Translation to English: “Primer plato; Segundo plato; Postre; Confirmar” mean First course; Main course; Dessert; Confirm, respectively.]](/cms/asset/d2a37493-d5ef-482a-8b2d-d5789ff66eac/hihc_a_1559534_f0007_oc.jpg)
Figure 8. User interface component for the navigation bar representing the last step of the task in Service 1. [Translation to English: “Primer plato; Segundo plato; Postre; Confirmar” mean First course; Main course; Dessert; Confirm, respectively.]
![Figure 8. User interface component for the navigation bar representing the last step of the task in Service 1. [Translation to English: “Primer plato; Segundo plato; Postre; Confirmar” mean First course; Main course; Dessert; Confirm, respectively.]](/cms/asset/83927b37-abc2-4b0b-b574-7445e432b1ce/hihc_a_1559534_f0008_oc.jpg)
Figure 9. User interface component for going to previous step of the task. [Translation to English: “Anterior” means Previous.]
![Figure 9. User interface component for going to previous step of the task. [Translation to English: “Anterior” means Previous.]](/cms/asset/b0e2dbd1-6ddd-46bc-9592-db339b49aaae/hihc_a_1559534_f0009_oc.jpg)
Figure 10. User interface component for going to next step of the task. [Translation to English: “Siguiente” means Next.]
![Figure 10. User interface component for going to next step of the task. [Translation to English: “Siguiente” means Next.]](/cms/asset/dae40166-325c-4c29-b27e-95095976b019/hihc_a_1559534_f0010_oc.jpg)
Figure 11. “Selection” pictogram used in Egoki for representing selection action

The third type of interface generated by Egoki is the confirmation interface where users can check the options selected during the task and confirm their selection. In this interface, the options selected by the user during the task are presented again by their corresponding pictures, texts, and audios. shows the confirmation interface for Service 1.
Figure 12. Confirmation user interface generated by Egoki for Service 1. [Translation to English: “Confirmar el menu que has escogido” means Confirm your selected menu; “Ensalada” means Salad; “Filete” means steak; “Flan” means Crème Caramel; “Confirma el menu escogido” means Confirm the selected menu.]
![Figure 12. Confirmation user interface generated by Egoki for Service 1. [Translation to English: “Confirmar el menu que has escogido” means Confirm your selected menu; “Ensalada” means Salad; “Filete” means steak; “Flan” means Crème Caramel; “Confirma el menu escogido” means Confirm the selected menu.]](/cms/asset/20eaea61-e5d1-4f83-89f8-37feb0b41d53/hihc_a_1559534_f0012_oc.jpg)
In Service 2, the selection made by participants was printed out following confirmation using the confirmation interface (the confirmation interface for Service 2 can be seen in ). The action of printing is represented by a “printing” pictogram as shown in .
Figure 13. “Printing” pictogram included by Egoki in confirmation interface for Service 2. [Translation to English: “Imprime este horario” means Print this schedule.]
![Figure 13. “Printing” pictogram included by Egoki in confirmation interface for Service 2. [Translation to English: “Imprime este horario” means Print this schedule.]](/cms/asset/a467647d-dd8a-4d0c-8950-85bb7be923b2/hihc_a_1559534_f0013_oc.jpg)
All the interfaces created by Egoki include a descriptive text at the top of the page to allow the users to know what they are expected to do. In addition, the pictogram representing the active step of the task is shown as well. show the descriptive text included in a selection interface for Service 1 and Service 2.
Figure 14. Descriptive text and pictogram included by Egoki in selection interface for Service 1. [Translation to English: “Primer Plato” means First Course and “Escoge el plato que quieres comer de primero” means Select a first course.]
![Figure 14. Descriptive text and pictogram included by Egoki in selection interface for Service 1. [Translation to English: “Primer Plato” means First Course and “Escoge el plato que quieres comer de primero” means Select a first course.]](/cms/asset/a7c5e936-8950-4b81-b028-6e91698dd241/hihc_a_1559534_f0014_oc.jpg)
4.9. Procedure
The sessions with participants were conducted one participant at a time and they took place at the premises of the research department of the GUREAK Group. The whole test was conducted in the participants’ mother tongue, Spanish.
Each session started by providing information about the objectives of the study. Then, they (and their authorized job coach) were asked for their consent for the session to be recorded. They were also asked some questions about demographic data; specifically, information about genre, age, experience with computers, and experience with touch screens was gathered. Some explanations about the use of touch screens were given to those participants who had never used such a device. These explanations were focused on the required actions for interacting with the experimental services: select an option of the menu, go to next step, go to previous step, change the option made, and push a confirmation button. In addition, all participants in the study tried the tablet before starting the test. There was no training on the tested services prior to the experiments. After a short trial with the tablet, the test session started with Task 1 of the corresponding service depending on the order of presentation of services. Having finished the first task, the participant started on Task 2. The participants were interviewed briefly once both tasks had been finished for a service, in order to get their impressions. The participants then started on the tasks for the other service, following the same procedure.
4.10. Data collection
The following methods were used for data collection:
Logs: every user interaction with the ubiquitous services was monitored and stored in log files. These files contain relevant information such as the time at which each task was started.
Video recordings: two cameras were used to record user interactions from different perspectives. One camera was focused on the screen of the device and the other was focused on the participant. The first camera provided us with information about the users’ interaction with the elements of the user interfaces, while the second camera allowed us to analyze more personal aspects of interaction, such as body language and facial expressions, in order to analyze the users’ satisfaction and also to determine the level of assistance provided by the job coach.
Observations: interaction-specific aspects that drew the attention of the experimenters were noted (for instance, problems that occurred during the interaction).
Semi-structured interview: a short post-interaction interview was conducted with each participant which focused on gathering information about users’ satisfaction and opinions on the interfaces and the difficulties encountered when accomplishing tasks. The objective was to gain direct feedback about their experience.
4.11. Data analysis
Task completion rates and times were computed for each task and service. In addition, the level of assistance required by each participant throughout the experimental session was analyzed. Usually, the job coach detected when assistance was needed and provided it accordingly.
The level of assistance was assessed by means of video analysis, and it was measured on a four-level scale. This scale is based on the “Chain of Cues Prompting Hierarchy” (Tobbi Dynavox, Citationn.d.) applied for measuring the skills and assisting users of Augmentative and Alternative Communication tools and is comparable to the prompting system frequently used by teachers and cited in the literature, the System of Least Prompt (Taber-Doughty, Citation2005). This prompting hierarchy allows the progress of an individual toward independence to be demonstrated in very small increments, always using the least intrusive prompt available and waiting for user response. Gradually more intrusive prompts are introduced if required. The original hierarchy consists of five levels of assistance: natural cue, indirect cue, direct verbal cue, direct pointer cue, and physical assistance. This hierarchy was adopted by all job coaches in the GUREAK Group sheltered workshops and they used it in all the activities. However, the lowest level used with the group of participants in this study was the indirect cue due to their compromised memory capabilities, level of attention, and concentration. All of them needed indirect cues in order to understand and remember the tasks. Therefore, the four levels of assistance applied in this study are the following (ordered from most to least intrusive):
Level 3 (Physical assistance): when the job coach needs to physically assist the user to perform an action. For example, the job coach places the user’s finger on a specific interaction element in the user interface or it is the job coach himself who performs the action.
Level 2 (Direct pointer cue): when the job coach indicates verbally and by gestures how to perform an action. For instance, by indicating with her/his finger the appropriate interaction element in the user interface.
Level 1 (Direct verbal cue): when the job coach assists the user with only verbal indications (without gestures) for performing an action.
Level 0 (Indirect cue): the user performs the action without any direct assistance from the job coach. However, they require help for understanding and remembering the tasks.
5. Results
Different performance metric values were considered in order to study the research questions defined for the case study. Success in task completion, time required ( and ), and the level of assistance needed for completing the tasks were considered for exploring research question Q1. The level of expertise in computing, the type of service, and the order of presentation of the services were considered for exploring research question Q2.
Figure 15. Descriptive text and pictogram included by Egoki in selection interface for Service 2. [Translation to English: “Escoge la línea de autobús que quieres consultar” means Choose the bus line to get information about.]
![Figure 15. Descriptive text and pictogram included by Egoki in selection interface for Service 2. [Translation to English: “Escoge la línea de autobús que quieres consultar” means Choose the bus line to get information about.]](/cms/asset/6e0f03a6-0779-41b2-ae18-65f42d99cabc/hihc_a_1559534_f0015_oc.jpg)
Figure 16. Descriptive text and pictogram included by Egoki in confirmation interface for Service 1. [Translation to English: “Confirmar el menu que has escogido” means Confirm your selected menu.]
![Figure 16. Descriptive text and pictogram included by Egoki in confirmation interface for Service 1. [Translation to English: “Confirmar el menu que has escogido” means Confirm your selected menu.]](/cms/asset/34cc9a7d-b953-4d2d-b101-d3b46b851eff/hihc_a_1559534_f0016_oc.jpg)
Figure 17. Completion time for Task 1 and Task 2 in Service 1
Figure 18. Completion time for Task 1 and Task 2 in Service 2
All participants in the study were able to complete both tasks in both services via the interfaces generated by Egoki. However, they required some assistance from their job coach. – show the level of assistance provided by the job coaches to participants. This level of assistance was measured on a four-level scale (see Section 4.8).
Figure 19. Level of Assistance (LoA) required by participants performing individual actions in Task 1 of Service 1
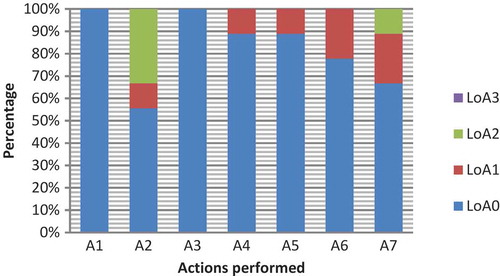
Figure 20. Level of Assistance (LoA) required by participants performing individual actions in Task 2 of Service 1
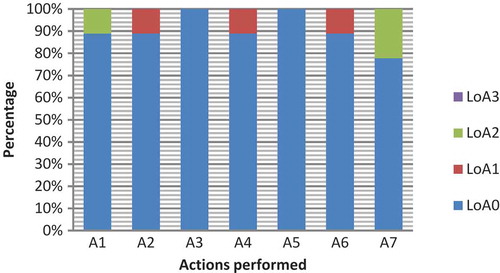
Figure 21. Level of Assistance (LoA) required by participants performing individual actions in Task 1 of Service 2
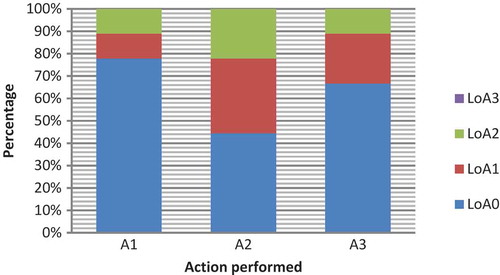
Figure 22. Level of Assistance (LoA) required by participants performing individual actions in Task 2 of Service 2
We assessed the level of support given to participants for each action. The participants’ level of assistance required for each action of a task can be observed in –.
Some analyses of the data gathered were conducted in order to understand the findings for the defined research questions.
5.1. Exploring research question Q1
The data gathered for task completion times and required level of assistance by each participant were analyzed. Two measures were collected for task completion time and required level of assistance for each Service (1: lunch menu selection service, 2: local bus information seeking service). They correspond with the accomplishment of two Tasks (1: predefined task, 2: free task). Therefore, a total number of four measures were analyzed for each participant.
5.1.1. Analysis of task completion times
The mean values for Service 1 are 282.2 s (SD = 167.44) for Task 1 and 177.4 s (SD = 105.45) for Task 2. The medians of Task 1 and Task 2 were 260 and 165, respectively. Six participants took more time to finish the predefined task than the second one for Service 1. Nevertheless, we ran a Mann–Whitney U test to evaluate the difference in the task completion times and no significant difference was found (U = 55.5, p > 0.05).
The mean values for Service 2 are 251.1 s (SD = 156.4) for Task 1 and 79.44 s (SD = 41.26) for Task 2. The medians of Task 1 and Task 2 were 270 and 75, respectively. Eight participants spent more time completing the predefined task than the second one for Service 2. We ran a Mann–Whitney U test to evaluate the difference in the task completion times and we found a significant difference (U = 71, p < 0.05) which suggests that the completion time for Task 2 is significantly lower than for Task 1.
and show the differences between task completion times for both tasks in Service 1 and Service 2, respectively.
Analyzing the cases where the completion time for Task 2 is higher for Service 1 (P1, P3, and P8), we detected that for two of the participants (P1 and P3) the completion time differed slightly (5 and 15 s, respectively). User P8 took longer time to complete Task 2 (45 s). We detected some difficulties when interacting with the tablet, for example, tapping on the screen too gently or too strongly.
Regarding Service 2, only one participant (P9) required a longer time (35 s) to complete Task 2. By analyzing the recordings, we realized that one reason might be that she was unsure about which bus to choose. We did not observe any apparent problems in the interaction with the elements of the user interface.
5.1.2. Analysis of the level of assistance
All involved participants were able to finish the tasks by themselves without receiving physical assistance from their job coach, that is, no one required Level 3 assistance. However, all participants in the study required frequent indirect assistance to remember the objectives of the tasks, due to the difficulties they had in maintaining attention during the test. This is the established Level 0 of assistance for this group of participants, as they need this indirect assistance in any daily activity they perform. There were two participants who required Level 2 assistance (direct verbal and gestural assistance) for both services (P6 in Task 1 of Service 1 and Service 2 and P7 in Task 1 and Task 2 of Service 1 and Task 1 of Service 2). In addition, some participants required this level of assistance only for the service tested first (P1 in Task 1 and Task 2 of Service 1 and P2 in Task 1 of Service 2).
Regarding the increase in autonomy of participants and the amount of practice within a service, there are three cases (P3, P5, and P6) where the assistance required was smaller for Task 2 in Service 1. Nobody needed a higher level of assistance for Task 2 than for Task 1 for either service. Moreover, all involved participants required less assistance when completing the second task in Service 2. We ran a Mann–Whitney U test to evaluate the difference in the level of assistance required by participants performing both tasks. No significant difference was found in Service 1 (U = 52.5, p < 0.2694), whereas we found a significant difference for Service 2 (U = 72, p < 0.05). This suggests that the assistance required by participants for performing Task 2 is significantly lower than for Task 1 in Service 2.
The Spearman’s correlation between the level of assistance and the task completion time indicates a positive correlation (r = 0.78, p < 0.01). Thus, as expected, the greater the level of assistance required by participants, the longer they required for completing the tasks.
In addition, we analyzed qualitatively the level of assistance needed by each participant to perform the individual actions in each task. The objective of this qualitative analysis was to detect interaction barriers encountered by participants in the automatically generated user-tailored interfaces. Each task was broken down into individual actions. and show data relating to the level of assistance required for Service 1. The actions performed by users in Service 1 are the following: “select first course” (A1), “go to the second course selection” (A2), “select second course” (A3), “go to the dessert selection” (A4), “select dessert” (A5), “go to the confirmation” (A6), and “confirm/print selection” (A7).
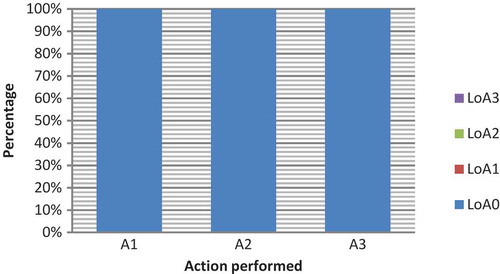
and show data relating to the level of assistance required for Service 2. The actions performed in Service 2 are the following: “select bus line” (A1), “confirm the selection” (A2), and “print the information” (A3). In both services, “Selection” actions require pressing the image of the desired choice in order to select an option, while the “go to” and “confirmation/print” actions involve pressing a link and a button element respectively. It should be noted that, as can be seen in , in all cases the level of assistance needed for Task 2 was 0.
As can be seen, the maximum level of assistance required in the experimental sessions was Level 2. However, only four participants required this (P1, P2, P6, and P7). The level of assistance in the majority of the actions is 0. For instance, P4 and P9 did not ask for any specific direct verbal or pointer cue from their job coach. Moreover, all the participants completed Task 2 of Service 2 with Level 0 of assistance (without the need of specific verbal or gestural assistance from their job coach).
In Service 1, Action A2 in Task 1 is the one in which the highest level of assistance was requested, as there were three participants who required Level 2 assistance (P1, P6, and P7), and one other who required Level 1 assistance (P2). Continuing in Service 1, Action A7 also stands out, as one participant required Level 2 assistance (P7) and two participants required Level 1 assistance (P1 and P3) in the case of Task 1, while in Task 2 two participants required Level 2 assistance (P1 and P7). On the other hand, with respect to Service 2, Action A2 required the highest level of assistance in Task 1: two participants required Level 2 assistance (P2 and P7), and three needed Level 1 assistance (P1, P5, and P8). In the other actions in Task 1 of Service 2, one participant requested Level 2 assistance (P2 in Action A1 and P6 in Action A3).
5.2. Exploring research question Q2
The data gathered were analyzed in order to explore the implications of the level of expertise and experience with the service in the obtained task completion times and the level of assistance for each participant. To this end, participants were ordered into three groups according to their level of expertise: Group 1 was composed of those participants with little expertise (P5 and P7), Group 2 was composed of those participants with some expertise (P1, P4, P6, and P8), and Group 3 was composed of those participants with considerable expertise (P2 and P3). In addition, Service 1 was considered to be more familiar to participants whereas Service 2 was completely new for them.
5.2.1. Analysis of the expertise level
shows the distribution of collected task completion times by level of expertise (1: little expertise, 2: some expertise, and 3: considerable expertise), see .
Figure 23. Distribution of observed completion times by level of expertise
The Spearman correlation value between level of expertise and task completion times is not significant (r = 0.004, p > 0.05).
5.2.2. Analysis of the presentation order
The order in which services are presented to the participants (1: Service 1 is presented first, 2: Service 2 is presented first) influenced the obtained measures for task completion time. The results obtained in the study indicate better values for the service which was presented second. shows the total time (in seconds) required for completing both tasks in each service and the order in which the services were presented to the participant.
Table 2. Total time (in seconds) required for completing tasks in each service and the percentage decrease in total task completion time for the service presented second in Order 1 and Order 2 groups
and show the differences in total task completion times for each order in which the services were presented to the participant. The mean values for total completion time are 560 s (SD = 245.96) for Service 1 and 277 s (SD = 130.5) for Service 2 when Order 1 was used (Service 1 was tested first by the participant; for participants P1, P3, P6, P7, and P9). The mean values for total completion time are 334.2 s (SD = 190.61) for Service 1 and 397.5 s (SD = 236.27) for Service 2 when Order 2 was used (Service 2 was tested first by the participant; for participants P2, P4, P5, and P8).
Figure 24. Total task completion times for Service 1 and Service 2 when Service 1 is tested first by participants
Figure 25. Total task completion times for Service 1 and Service 2 when Service 2 is tested first by participants
The total task completion times for all the participants in both services, see and , show better values for the service tested in second position. shows the percentage decrease in completion time for each participant.
Figure 26. Total task completion times for Service 1 and Service 2 when Service 1 is tested first by participants (Order 1)
Figure 27. Total task completion times for Service 1 and Service 2 when Service 2 is tested first by participants (Order 2)
The time required for completing the tasks is, in all cases, less in the second service tested. In addition, the values in indicate that Service 2 obtains the best completion times when tested second. This suggests that users are more efficient when completing tasks in Service 2 even though they are not familiar with this service.
Regarding the level of assistance required by participants, the measurements obtained are better for the services presented second. shows the data for those participants performing tasks where Service 1 is presented first, while shows the data for participants performing tasks where Service 2 is presented first. It has to be noted that the value assigned to the level of assistance required by each participant in a task in and is the maximum required for each action during the entire task. There is a clear improvement in the case of participants P1 and P8. P1 required Level 2 assistance in both tasks for the service presented first (Service 1) and only Level 1 and Level 0 assistance for tasks in the service which was presented second (Service 2). In the case of P8, she required Level 1 assistance in Task 1 of the experimental session and Level 0 for the rest of tasks. Participants P3, P5, and P6 required the same level of assistance for both services. They only required Level 0 assistance for Task 2 in both services, while they required more assistance for Task 1 in both services (P3 Level 1, P5 Level 1, and P6 Level 2). They seemed to need help each time a new service was presented to them but, with practice, they gained autonomy within the same service.
Figure 28. Level of assistance required by participants in tasks for Service 1 and Service 2 when Service 1 is tested first by participants (Order 1)
Figure 29. Level of assistance required by participants in tasks for Service 1 and Service 2 when Service 2 is tested first by participants (Order 2)
6. Discussion
The main aim of this case study was to test the suitability of the automated generated interfaces by Egoki for young adults with IDs. These interfaces were generated from scratch by providing a logical user interface model and resources to the Egoki system in a three-phase procedure (see Section 3). Participants were selected such that they had no experience with the services selected in the study. However, said services can be considered as helpful everyday life activity supporting services.
All participants in the study were able to perform the tasks in both services by means of the automatically created user interfaces with the Egoki system. The results indicate that participants, with practice, improve their performance in terms of task completion time and level of required assistance. Generally, the second task was performed in less time in both services. This suggests that participants would improve their performance by using this kind of service on a daily basis.
With regard to the required assistance, we identified a positive increase in autonomy as participants became more accustomed to performing the tasks. The assistance required for performing actions in the second task decreased significantly. There were two exceptions (P1 in Service 1 and P9 in Service 2). This increase in the level of assistance is related to the type of action within the task (“selection” and “confirmation”). It seems that it was difficult for some participants to decide on an option and this increased their uncertainty when performing tasks. This suggests that participants could improve their autonomy for performing this type of tasks in the long-term if they are provided with suitable interfaces. It would have a direct implication on their general performance as the assistance required and the task completion time proved to be positively correlated.
The qualitative analysis carried out regarding the required assistance for performing the individual actions in each task revealed some noticeable issues about the automatically generated interfaces. The results, shown in –, indicate that the easiest actions for the participants were those involving “selection” of options. These actions were very intuitive, as they only entail pressing the image of the chosen option. In contrast, the “confirmation/print” and “go to” actions required a greater level of assistance. These require pressing a button to confirm the selected options (Action A7 in Service 1 and Action A3 in Service 2) or clicking a link to continue with the next step (Actions A2, A4, and A6 in Service 1 and Action A2 in Service 2). We observed that for some participants it was difficult to find and press specific elements, such as buttons and links. One reason for this could be the position of the element itself (at the bottom of the screen). Due to the participants’ difficulty to maintain attention, it could be more appropriate to show these elements in the center. The presentation adaptations included in the system should be revised in order to present the buttons in a better position so they are more easily located by users. The other interface components should be rearranged accordingly.
Regarding the different types of interfaces created by the Egoki system, it may be necessary to review the navigation mechanisms created by the system as well as the interface segmentation applied for the tasks. The selection interfaces created by Egoki require two actions to be performed: selecting one option (pressing on a picture or radio button) and confirming the selection (pressing on the next link or button). The first action did not present any difficulties but it was often necessary to remind users about the second action. Segmentation mechanism may be modified so only one action is required from users in each interface. One way to do that could be to show the options in one interface and after one is selected, to present another interface showing only the selection made and a centered button/link/image to confirm and go to the next step. The confirmation interfaces created by Egoki require only one action to be performed by users: confirming the selection during the task (pressing on a button). However, the interfaces are quite similar to the selection interfaces as it shows the selections made by users and a button to finish the task. The information shown in the interface could be rearranged so the confirmation button is located at the center. Visual changes to the layout of this interface in order to highlight the selections made by the user and a bigger icon/button would be good options to improve these interfaces and differentiate them from the selection interfaces. Taking all these considerations into account would improve the implementation of the error prevention guidelines for providing help and support on the interaction defined in the NI4 protocol (Protocolo NI4, Citationn.d.).
Regarding the interface components included by the Egoki system, the components representing options for selecting the lunch menu in Service 1 and the bus line in Service 2 were found to be easily understood by the majority of participants. The lunch menu was represented by simple pictograms especially developed for people with disabilities (ARASAAC, Citationn.d) and the bus line was represented by a real image of the bus stop and the line number. Nevertheless, several participants had difficulties to choose an option although this happened mostly in the free task so it could be related to the participants’ insecurity regarding their selection rather than the interface components presented. However, it would be worthwhile researching into providing mechanisms that could match the resources to be presented in the interface with the preferences or requirements of each user (Sevilla et al., Citation2007). The selection buttons were another type of resource to take into consideration. In some cases, we saw that it would be better to replace the typical buttons currently presented to the users with a suitable icon and an associated audio resource as some studies have shown that users expect and rely on icons they know and had seen in the past and are therefore helpful for helping support memory (Buehler et al., Citation2016). In the post-interaction interview, participants commented that they would have preferred bigger buttons. We also noticed that some buttons contained excessive text, which may have been difficult for users with a low reading level. All these considerations will be taken into account in order to update the automated interface generation process of the Egoki system.
As far as the services tested in this study are concerned, it is clear that they differ in content and complexity. Regarding the content, one service involves tasks that are already familiar to participants (Service 1), as they choose the menu on a daily basis and they usually access an informational web page on the intranet where they can find the lunch menu. The participants are not used to the information contained in the other service (Service 2). Regarding the complexity, both services entail carrying out similar actions in order to select or search for information. However, Service 2 is simpler in terms of the total number of actions required to complete tasks (seven actions in Service 1 and three actions in Service 2). The results indicate that all the participants were able to complete tasks irrespective of their expertise level, even though they were not familiar with the service. In fact, participants required less time to perform tasks in Service 2 and results indicate that there is a significant increment in autonomy with practice (Task 2 obtained Level 0 assistance for all participants in the study). More studies are needed to check whether providing ubiquitous services in order to perform daily routines would be a good option for young adults with IDs. However, the results of this case study suggest that this may be the case. Young adults with IDs may even accomplish these types of tasks in a completely autonomous way if some features, such as regular automatically triggered prompting mechanisms concerning task actions and objectives, were implemented (Chang et al., Citation2011, Citation2013). We think that one prompt reminding the user of the action to be performed when loading each interface would benefit the performance of participants as well as some prompting during pauses or slow interactions. These would be the equivalent of Level 0 assistance provided by their job coach.
We obtained less feedback from participants than expected even though they were interviewed after interacting with each service. Some answers were qualified as not reliable due to the high level social desirability (i.e. answers given apparently in a way that participants deem to be more socially acceptable than their “true” answer would be (Lavrakas, Citation2008)) shown by participants during the experimental sessions. Therefore, the results analysis was mainly based on observational and logged data. Interviewing strategies have to be reconsidered for further experimental sessions involving young adults with IDs.
Observations during the experimental sessions and analysis of the recorded videos suggested that some adaptation techniques included in the interfaces generation are helpful for all the participants involved and almost essential for some of them: well-structured information; grouping similar components; providing textual, auditory, and iconic information; simplified text, etc. This supports previous research on the importance of providing equivalent but alternative content for people with IDs (Sevilla et al., Citation2007). Most standard interfaces fail in some or all of these aspects so interaction with them in an autonomous manner may be unmanageable for the majority of people with IDs. However, more research is needed to improve the adaptations implemented and analyze their implications on participants’ performance and autonomy.
The automatic user interface generation made by the Egoki system seemed adequate to the services and users involved in this case study. However, more studies are needed in order to test its validity with other services and users. Interpretations of the results should be considered carefully as one limitation of our study is the small number of participants. In addition, the heterogeneous nature of IDs is another limitation and replication studies are needed with a greater number of users and with wider range of IDs.
7. Conclusions
This work has studied the adequacy of the interfaces provided by the Egoki system in order to provide young adults with IDs with an appropriate support to carry out daily activities. The Egoki system has been capable of generating ubiquitous interfaces for two different services within a semi-assisted approach instead of generating each of them manually. The outcomes show that, with practice, the performance of the participants improved in terms of task completion time and the required level of assistance. We also detected a learning effect on the service presented second. This suggests the importance of preparing the kind of adequate training plan that this type of user requires in order to adequately perform daily life activities. The results of the study are promising and provide some indications for implementing adapted interfaces to perform daily life activities supported by ubiquitous services. The implementation of such services could provide more autonomy and increased confidence to young adults with IDs in dynamic outdoors environments.
From the analysis of the observations during the sessions and the recorded videos of this study, some improvements to the Egoki-automated interface generation process were suggested. These improvements will be incorporated to future versions of the Egoki system, thus enhanced user-tailored interfaces for ubiquitous services will be generated for young adults with IDs. This will further develop the performance of individuals belonging to this collective and reduce the amount of support required from their caregivers, job coaches, tutors, and relatives.
More studies are required to confirm the findings provided here when applying the Egoki-automated user interface generation system to increasing number of users with IDs.
Disclosure of potential conflicts of interest
The authors declare that this submission contains original work which has not been published previously and that it is not under consideration for publication elsewhere. No potential conflict of interest was reported by the authors. All the authors have made substantial contributions to the conception and design of the study, acquisition of data, analysis and interpretation of data; drafting the article or revising it critically for important intellectual content; and final approval of the version to be submitted.
Acknowledgments
Authors would like to thank to GUREAK group and specially the job coaches and participants in this case study. In addition, authors would like to thank Julio Abascal for the support he gave through this research and Edurne Larraza-Mendiluze for her help while preparing the figures included in this article.
Additional information
Funding
Notes on contributors
Amaia Aizpurua
Amaia Aizpurua received the BsC degree in computing and Ph.D. degree in computing from the University of the Basque Country (UPV/EHU), Donostia-San Sebastian, in 2008 and 2017, respectively. She has been working in Egokituz research group. At the moment she works at Barcelona Supercomputing Center.
Raúl Miñón
Raúl Miñón received the B.Sc. degree in computing and Ph.D. degree in computing from the University of the Basque Country (UPV/EHU), Donostia-San Sebastian, in 2008 and 2015, respectively. He has been working in Egokituz research group. At the moment he works at Tecnalia Research and Innovation.
Borja Gamecho
Borja Gamecho received the B.Sc. degree in computing and Ph.D. degree in computing from the University of the Basque Country (UPV/EHU), Donostia-San Sebastian, in 2009 and 2015, respectively. He has been working in Egokituz research group. At the moment he works at WimbiTek.
Idoia Cearreta
Idoia Cearreta received the B.Sc. degree in computing and Ph.D. degree in computing from the University of the Basque Country (UPV/EHU), Donostia-San Sebastian, in 2004 and 2010, respectively. She has been working in Egokituz research group. At the moment she teaches at preuniversity levels.
Myriam Arrue
Myriam Arrue received the B.Sc. degree in computing and Ph.D. degree in computing from the University of the Basque Country (UPV/EHU), Donostia-San Sebastian, in 1999 and 2008, respectively. She continues working in ADIAN research group. At the moment she is Assistant Professor at the University of the Basque Country.
Nestor Garay-Vitoria
Nestor Garay-Vitoria received the M.S. degree in informatics and Ph.D. degree in computer science from the University of the Basque Country (UPV/EHU), Donostia-San Sebastian, in 1990 and 2000, respectively. He continues working in ADIAN research group. At the moment he is Associate Professor at the University of the Basque Country.
Related Research Data
References
- Accessible Technologies Observatory. (n.d.). Retrieved from https://tecnoaccesible.net/en accessed on July 2nd, 2018.
- Aizpurua, A., Cearreta, I., Gamecho, B., Miñón, R., Garay-Vitoria, N., Gardeazabal, L., & Abascal, J. (2013). Extending in-home user and context models to provide ubiquitous adaptive support outside the home. In E. Martín, P. Haya, & R. Carro (Eds.), User modeling and adaptation for daily routines (pp. 25–59). London, UK: Springer.
- Antona, M., Savidis, A., & Stephanidis, C. (2006). A process-oriented interactive design environment for automatic user-interface adaptation. International Journal of Human–Computer Interaction, 20(2), 79–116. doi:https://doi.org/10.1207/s15327590ijhc2002_2
- ARASAAC, Portal Aragonés de la Comunicación Aumentativa y Alternativa (n.d.). Retrieved July 23th, 2018 from. http://www.arasaac.org.
- Blanck, P. (2015). eQuality: Web accessibility by people with cognitive disabilities. Inclusion, 3(2), 75–91. doi:https://doi.org/10.1352/2326-6988-3.2.75
- Bongartz, S., Yucheng, J., Paternò, F., Rett, J., Santoro, C., & Spano, L. D. (2012). Adaptive user interfaces for smart environments with the support of model-based languages. In Procs of Ambient Intelligence Third International Joint Conference, Ami 2012 (pp. 33–48). LNCS 7683. Pisa, Italy: Springer.
- Brajnik, G. (2008). Measuring web accessibility by estimating severity of barriers. In Procs of the Web Information Systems Engineering – WISE 2008 Workshops, (pp. 112–121). LNCS 5176. Auckland, New Zealand: Springer.
- Brajnik, G. (n.d.). Barrier Walkthrough. Retrieved December 12th, 2017 from. http://sole.dimi.uniud.it/~giorgio.brajnik/projects/bw/bw.html.
- Bunt, A., Carenini, G., & Conati, C. (2007). Adaptive Content Presentation for the Web. P. Brusilovsky, A. Kobsa, W. Nedjl (ed.), The adaptive web: Methods and strategies of web personalization LNCS 4321. 409–432. Berlin, Germany: Springer-Verlag.
- Buehler, E., Easley, W., Poole, A., & Hurst, A. (2016). Accessibility barriers to online education for young adults with intellectual disabilities. In Procs of the 13th Web for All Conference, Article No. 27. Montreal, Canada: ACM.
- Castillejo, E., Almeida, A., & López-de-Ipiña, D. (2014). Ontology-based model for supporting dynamic and adaptive user interfaces. International Journal of Human–Computer Interaction, 30(10), 771–786. doi:https://doi.org/10.1080/10447318.2014.927287
- Chang, Y. J., Chen, S. F., & Chou, L. D. (2012). A feasibility study of enhancing independent task performance for people with cognitive impairments through the use of a handheld location-based prompting system. IEEE Transactions on Information Technology in Biomedicine, 16(6), 1157–1163. doi:https://doi.org/10.1109/TITB.2012.2198484
- Chang, Y. J., Chen, S. F., & Chuang, A. F. (2011). A gesture recognition system to transition autonomously through vocational tasks for individuals with cognitive impairments. Research in Developmental Disabilities, 32, 2064–2068. doi:https://doi.org/10.1016/j.ridd.2011.08.010
- Chang, Y. J., Chih Chang, W., & Wang, T. Y. (2009). Context-aware prompting to transition autonomously through vocational tasks for individuals with cognitive impairments. In Procs of the 11th international ACM SIGACCESS conference on Computers and accessibility (19–26). Pennsylvania, USA: ACM. doi:https://doi.org/10.1016/j.antiviral.2009.10.005
- Chang, Y. J., Chou, L. D., Wang, F. T. W., & Chen, S. F. (2013). A kinect-based vocational task prompting system for individuals with cognitive impairments. Personal and Ubiquitous Computing, 17, 351–358. doi:https://doi.org/10.1007/s00779-011-0498-6
- Cook, D. J., Augusto, J. C., & Jakkula, V. R. (2009). Ambient intelligence: Technologies, applications, and opportunities. Pervasive and Mobile Computing, 5(4), 277–298. doi:https://doi.org/10.1016/j.pmcj.2009.04.001
- Daniel, F., Matera, M., & Pozzi, G. (2008). Managing runtime adaptivity through active rules: The bellerofonte framework. Journal of Web Engineering, 7(3), 179–199.
- Dawe, M. (2006, April). Desperately seeking simplicity: How young adults with cognitive disabilities and their families adopt assistive technologies. In Proceedings of the SIGCHI conference on Human Factors in computing systems (pp. 1143–1152) .Montreal, Canada: ACM.
- Duarte, C., Costa, D., Feiteira, P., & Costa, D. (2013). Building an adaptive multimodal framework for resource constrained systems. In P. Biswas, C. Duarte, P. Langdon, L. Almeida, C. Jung (eds.), A multimodal end-2-end approach to accessible computing (pp. 155–173)). Berlin, Germany: Springer-Verlag.
- Fink, J., Kobsa, A., & Nill, A. (1998). Adaptable and adaptive information provision for all users, including disabled and elderly people. International Journal New Review of Hypermedia and Multimedia, 4(1), 163–188. doi:https://doi.org/10.1080/13614569808914700
- Gajos, K. Z., Weld, D. S., & Wobbrock, J. O. (2010). Automatically generating custom user interfaces for users with physical disabilities. International Journal on Artificial Intelligence, 174(12–13), 910–950. doi:https://doi.org/10.1016/j.artint.2010.05.005
- Gamecho, B., Miñón, R., Aizpurua, A., Cearreta, I., Arrue, M., Garay-Vitoria, N., & Abascal, J. (2015). Automatic generation of tailored accessible user interfaces for ubiquitous services. IEEE Transactions on Human-Machine Systems, 45(5), 612–623. doi:https://doi.org/10.1109/THMS.2014.2384452
- Ghiani, G., Manca, M., Paternò, F., & Santoro, C. (2017). Personalization of context-dependent applications through trigger-action rules. ACM Transactions on Computer-Human Interaction 24(2): 14:1, 14. 33. doi:https://doi.org/10.1145/3057861.
- GUREAK Group. (n.d.). Retrieved December 12th, 2017 from http://www.gureak.com/en/ .
- Heng, T. Z., Minn, A. L., & Phooi, S. K. (2011). A novel application of information communication technology to assist visually impaired people. In L. B. Theng (Ed.), Assistive and augmentative communication for the disabled intelligent technologies for communication, learning and teaching (pp. 103–126). Hershey, PA: IGI Global.
- Hoehl, J., & Lewis, C. (2011). Mobile web on the desktop: Simpler web browsing. In Procs of the 13th international ACM SIGACCESS conference on Computers and accessibility, 263–264. Dundee, Scotland: ACM. doi:https://doi.org/10.1177/1753193411419433
- Johansson, S., Gulliksen, J., & Lantz, A. (2015). User participation when users have mental and cognitive disabilities. In Procs of the 17th international ACM SIGACCESS conference on Computers and accessibility, 69–76. Bamberg, Germany: ACM.
- Junestrand, S., Molin, G., Tollmar, K., & Keijer, U. (2003). User study of video-mediated communication in the domestic environment with intellectually disabled persons. International Journal of Human–Computer Interaction, 15(1), 87–103. doi:https://doi.org/10.1207/S15327590IJHC1501_07
- Kennedy, H., Evans, S., & Thomas, S. (2011). Can the web be made accessible for people with intellectual disabilities? The Information Society, 27, 29–39. doi:https://doi.org/10.1080/01972243.2011.534365
- Keskinen, T., Heimonen, T., Turunen, M., Rajaniemi, J.-P., & Kauppinen, S. (2012). SymbolChat: A flexible picture-based communication platform for users with intellectual disabilities. Interacting with Computers, 24(5), 374–386. doi:https://doi.org/10.1016/j.intcom.2012.06.003
- Knutov, E., De, B. P., & Pechenizkiy, M. (2009). AH 12 years later: A comprehensive survey of adaptive hypermedia methods and techniques. New Review of Hypermedia and Multimedia, 5(1), 5–38. doi:https://doi.org/10.1080/13614560902801608
- Kurniawan, S. H., King, A., Evans, D. G., & Blenkhorn, P. L. (2006). Personalising web page presentation for older people. Interacting with Computers, 18, 457–477. doi:https://doi.org/10.1016/j.intcom.2005.11.006
- Lavrakas, P. J. (2008). Encyclopedia of survey research methods. Thousand Oaks, CA: SAGE Publications Ltd.
- Lepistö, A., & Ovaska, S. (2004, October). Usability evaluation involving participants with cognitive disabilities. In Procs. 3rd Nordic Conf. on Human-Computer Interaction (pp. 305–308). Tampere, Finland: ACM.
- Lewis, C. (2005). HCI for people with cognitive disabilities. SIGACCESS Accessibility and Computing, 83, 12–17. doi:https://doi.org/10.1145/1102187.1102190
- Lewis, C. (2011). Issues in web presentation for cognitive accessibility. In Procs of the International Conference on Universal Access in Human-Computer Interaction UAHCI2011. Design for all and eInclusion, 244–248. LNCS 6765. Florida, USA: Springer.
- Miñon, R., Paternò, F., Arrue, M., & Abascal, J. (2016). Integrating adaptation rules for people with special needs in model-based UI development process. Universal Access in the Information Society, 15(1), 153–168. doi:https://doi.org/10.1007/s10209-015-0406-3
- Peissner, M., Häbe, D., Janssen, D., & Sellner, T. (2012, June). MyUI: Generating accessible user interfaces from multimodal design patterns. In Procs of the 4th ACM SIGCHI Symp. on Engineering Interactive Computing Systems (EICS) (pp. 81–90). Copenhagen, Denmark: ACM.
- Phanouriou, C. (2000). UIML: A device-independent user interface markup ( Doctoral dissertation). Dept. Comput. Sci., Virginia Polytech. Inst. State Univ., Blacksburg, VA.
- Polson, P. G., Lewis, C., Rieman, J., & Wharton, C. (1992). Cognitive walkthroughs: A method for theory- based evaluation of user interfaces. International Journal of Human-Computer Studies, 36, 741–773. doi:https://doi.org/10.1016/0020-7373(92)90039-N
- Protocolo NI4. (n.d.). Pautas de Diseño de Navegación Fácil [NI4 Protocol. Guidelines for Designing Easy Navigation] Retrieved December 12th, 2017 from. http://iae.es/index.php?m=Descargas&tipo=10
- Richards, J. T., & Hanson, V. L. (2004, May). Web accessibility: A broader view. In Proceedings of the Thirteenth International ACM World Wide Web Conference, WWW2004 (pp. 72–79). New York, NY: ACM.
- Riihiaho, S. (2009). User testing when test tasks are not appropriate. In Procs. European Conf. on Cognitive Ergonomics: Designing beyond the Product Understanding Activity and User Experience in Ubiquitous Environments (ECCE ‘09) (pp. 228–235). Helsinki, Finland: ACM. doi:https://doi.org/10.1177/1753193409354015
- Sevilla, J., Herrera, G., Martínez, B., & Alcantud, F. (2007). Web accessibility for individuals with cognitive deficits: A comparative study between an existing commercial web and its cognitively accessible equivalent. ACM Transactions on Computer-Human Interaction, 14(3). Article 12. doi:https://doi.org/10.1145/1279700.1279702.
- Shafti, L. S., Haya, P. A., García-Herranz, M., & Alamán, X. (2012, December). Personal ambient intelligent reminder for people with cognitive disabilities. In J. Bravo, R. Hervás, M. Rodríguez (eds.) Proceedings of the International Workshop on Ambient Assisted Living and Home Care (IWAAL 2012), (pp. 383–390). Berlin, Springer-Verlag. doi:https://doi.org/10.1016/j.ejpb.2012.07.007
- Sohlberg, M. M., Ehlhardt, L. A., Fickas, S., & Sutcliffe, A. G. (2003). A pilot study exploring electronic mail in users with acquired cognitive-linguistic impairments. Brain Injury, 17(7), 609–629. doi:https://doi.org/10.1080/0269905031000070189
- Sonne, T., & Grønbæk, K. (2016). Designing assistive technologies for the ADHD domain. In Serino S., Matic A., Giakoumis D., Lopez G., Cipresso P. (eds) pervasive computing paradigms for mental health. Mindcare 2015. Communications in Computer and Information Science, 604, 259–268. Springer.
- Stephanidis, C. (Ed.). (2009). The universal access handbook. Boca Raton, FL, USA: CRC Press, Inc.
- Stock, S. E., Davies, D. K., Wehmeyer, M. L., & Palmer, S. B. (2008). Evaluation of cognitively accessible software to increase independent access to cellphone technology for people with intellectual disability. Journal of Intellectual Disability Research, 52(12), 1155–1164. doi:https://doi.org/10.1111/jir.2008.52.issue-12
- Sutcliffe, A., Fickas, S., Sohlberg, M., & Ehlhardt, L. (2003). Investigating the usability of assistive user interfaces. Interacting with Computers, 15(4), 577–602. doi:https://doi.org/10.1016/S0953-5438(03)00051-1
- Taber-Doughty, T. (2005). Considering student choice when selecting instructional strategies: A comparison of three prompting systems. Research in Developmental Disabilities, 26, 411–432. doi:https://doi.org/10.1016/j.ridd.2004.07.006
- Tobii Dynavox (n.d.). The Dynamic AAC Goals Grid 2. Retrieved December 20th, 2018 from. http://tdvox.web-downloads.s3.amazonaws.com/MyTobiiDynavox/dagg%202%20-%20writable.pdf
- Usability.gov. (n.d.). User-Centered Design Basics. Retrieved July 2nd, 2018 from. https://www.usability.gov/what-and-why/user-centered-design.html
- VERITAS Project. (n.d.). Retrieved December 12th, 2017 from. https://cordis.europa.eu/project/rcn/93725/factsheet/en.
- VICON Project (n.d.). Retrieved December 12th, 2017 from. http://vicon-project.eu.
- WebAim. (n.d. a). Evaluating Cognitive Web Accessibility. Retrieved December 12th, 2017 from. http://webaim.org/articles/evaluatingcognitive/#principles
- WebAim. (n.d. b). Writing clearly and simply. Retrieved June 14th, 2018 from. https://webaim.org/techniques/writing/
- Weiser, M. (1993). Ubiquitous computing. Computer, 26(10), 71–72. doi:https://doi.org/10.1109/2.237456
- World Health Organization. (n.d.). Assistive devices and technologies. Retrieved June 29th, 2018 from. https://www.who.int/disabilities/technology/en/
- Zhang, Z., McCrickard, D. S., Tanis, S., & Lewis, C. (2012). Supporting employment matching with mobile interfaces. In Procs of the 14th international ACM SIGACCESS conference on Computers and accessibility, 247–248. Colorado, USA: ACM.
- Zheng, H., & Motti, V. G. (2018). Assisting students with intellectual and developmental disabilities in inclusive education with smartwatches. In Procs of the 2018 CHI Conference on Human Factors in Computing Systems, Paper No. 350. Montreal, Canada: ACM