
ABSTRACT
This research explores the value of personas for supporting professional advertisers to design adverts for social media. We test if a personified user group (PUG), when provided to online ad designers, results in better ad performance than when using a non-personified user group (NUG) that had no face picture or name. Our experiment has 30 participants that created Facebook ads using both PUG and NUG. We found that using PUG did increase advertising click performance of ads created by people who are more experienced with ads and personas. Moreover, an analysis of the ad texts showed that the use of PUG increased the empathy of the created ads, supporting the foundational empathy benefit cited in HCI literature. However, the use of PUG did not significantly increase purchase intent. The results imply that using PUG for online ad design evokes more empathy and improves click-through performance. More empathetic ads can have a positive impact on social media users, given that they appear to increase relevance.
1. Introduction
The increase of data analytics tools and platforms has led to the availability of “personified big data” on online users (Stevenson & Mattson, Citation2019), i.e., user statistics and metrics that describe online user behavior. This personified user data enables “transferring complex market research data into (…) archetype customers.” (Haas & Kunz, Citation2009, p. 603). These user archetypes may substantially improve design performance, yet there has been little empirical testing of this possibility.
In the field of Human-Computer Interaction (HCI), the personification of user data – defined as attributing human attributes to the otherwise nameless and faceless data on users or customers (An, Kwak, Salminen et al., Citation2018) – has traditionally been embodied in the concept of persona. A persona refers to a fictitious representation of a known or presumed target group of users or customers (Cooper, Citation1999; Pruitt & Grudin, Citation2003). A persona is a user archetype defined by his or her needs, goals, and interests (Nielsen, Citation2019). Personas have typically been applied in the development and design of computer software, where understanding user behavior is crucial to develop features and functionalities that serve end-users’ needs (Long, Citation2009). While personas have typically been employed by User Experience (UX) designers, there is considerable research interest to expand the use of personas from software development/design into other fields, such as e-commerce (Al-Qirim, Citation2006), health informatics (Huh et al., Citation2016; LeRouge et al., Citation2013), and marketing (Salminen et al., Citation2018). This cross-sectionalism of personas is seen beneficial for the widespread adoption of personas as a design technique in various industry sectors (Duda, Citation2018) and encourages research in a variety of contexts, including ad design.
Despite this interest, there is scant empirical research demonstrating the value of personified user groups (PUG) in real use. While PUGs are applied in industry to some degree (Al-Qirim, Citation2006; Duda, Citation2018; Thoma & Williams, Citation2009), analytics users predominantly use non-personified user groups (NUGs), meaning nameless/faceless data about the customers (numbers, tables, charts …). This format may not be ideal for the decision-makers to empathize with the user group as real people (rather than as numbers). In contrast, personification aims to give “faces to user data” (Salminen et al., Citation2019, p. 135), thereby facilitating immersion in the needs of the users in theory. While this notion of enhancing empathy through a more personified user representation is pervasive in the HCI literature (Câmara et al., Citation2018; Wright & John, Citation2008), studies testing the effect of PUGs are scarce and inconclusive.
Moreover, there is increasing criticism in the HCI community and industry toward using PUGs such as personas. On one hand, new analytics tools and platforms (e.g., Google Analytics, Facebook Insights) are providing alternatives for replacing segmented user archetypes (Salminen et al., Citation2018). The information afforded by these platforms is seen, by some, as more real-time, more personalized, and more useful than aggregated user segments, such as personas (Salminen et al., Citation2018). On the other hand, some scholars view personas as dangerous and overly limiting, as personas can potentially enhance stereotyping and discrimination (Hill et al., Citation2017; Marsden & Haag, Citation2016; Turner & Turner, Citation2011).
Overall, there is a lack of studies supporting the effectiveness of personified user groups in real use cases (Chapman & Milham, Citation2006). Some of the qualitative evidence garnered by HCI scholars show that personified user archetypes might be rarely used in real decision making (Friess, Citation2012), as well as industry members finding them misleading and abstract (Matthews et al., Citation2012), leading to potentially biased decision making.
On the other hand, there is a strong base of HCI literature “defending” the use of personified user groups, mostly arising from the fact that these can foster a sense of empathy among decision-makers. This advantage is consistently cited in the literature, starting in Cooper’s seminal persona book (Cooper, Citation1999) and repeated by influential HCI scholars such as Pruitt and Grudin (Pruitt & Adlin, Citation2006; Pruitt & Grudin, Citation2003), Nielsen (Citation2019), and others. However, this stream of literature requires empirical verification, as the justification of the empathy benefits has thus far been based on theoretical and conceptual premises.
To address this fundamental question of the usefulness of personified user groups, in this research, we carry out an experiment that focuses on evaluating the impact of using a PUG relative to a NUG. The former contains user group information (e.g., age, gender, location, topics of interest) and the name and face of a user group in a personified profile layout. The latter contains the same user group information without the name and face, presented in a spreadsheet format. We show both variants to online marketing professionals and ask them to create online advertisements for the user group. We then deploy these ads in a real Facebook Ads campaign and record the results.
Like personas, PUGs provide summarized user information as a ‘bio’ (i.e., profile layout) of a fictive person. For example, if the average user watches YouTube for one hour a day, then the fictive PUG person’s bio will show that they watch YouTube that amount. PUGs have less information than many personas, though, in that PUGs do not contain quotations or goals that are considered typical information in personas (Nielsen et al., Citation2015). Personas, thus, can be considered a specialized type of PUG.
Our results provide quantitative evidence on the effect of using personified user information for online ad design. More specifically, the results indicate that the use of PUG increases the level of empathy in the created ads, but the effect of PUG on ad performance is mixed. The results suggest that using PUGs can improve online user experiences through more relevant ads. Moreover, the research relates to the increasing automation in online ad design (Chen et al., Citation2009; Yang et al., Citation2017), which raises questions about the comparative advantages of humans vs. algorithms for ad design. Platforms such as Google Ads are increasingly introducing features that use machine learning and various optimization algorithms for ad design and targeting. Naturally, this has raised concerns among human ad designers that, in a certain sense, feel threatened by machines (Head, Citation1960). To address these concerns, it is important to conduct HCI research that tests the effectiveness of human strengths for design tasks, such as ad design.
More precisely, these benefits (i.e., improved user experience, more effective ad, increased empathy) may relate to the ability of human ad designers to understand their fellow beings (Cooper, Citation1999; Nielsen, Citation2019). If so, PUGs can enhance this empathetic ability and provide ways for humans to strengthen their competitiveness against the automatic ad design algorithms.
2. Related literature
Here we present related prior literature concerning the application of personas, most notably in the business domain, and then the benefits of using personified user group information specifically highlight focusing on the user, communication, and empathy.
2.1. Applying personas in the business sector
Thoma & Williams (Citation2009) apply a multi-method process to develop and validate personas for a large e-commerce business. Their use case, however, was interaction design, whereas ours is advertising.
Câmara et al. (Citation2018) introduce Business Affective Personas as a methodology for enhancing customer relationships with trust and empathy. Their use case is tourism management and hospitality design. Caballero et al. (Citation2014) pinpoint the shared goals of HCI and marketing for achieving human centricity. However, their research, focused on software development, provides no empirical results.
Onel et al. (Citation2018) used personas to understand consumer behavior regarding sustainable consumption, finding three different consumer archetypes with distinct sustainable consumption strategies. Al-Qirim (Citation2006) used personas to investigate e-commerce adoption in small businesses in New Zealand. Thus, their use case was innovation adoption. Haas & Kunz (Citation2009) discussed the use of personas for service mass customization. Stern (Citation1993) provided a theoretical discussion of using personas for advertising, but they did not actually do that.
Despite being applied to business contexts, we could locate no previous research in the HCI domain about applying personified user group information for online ad design. Ads, in general, have been studies within HCI as a cause for “banner blindness” (Resnick & Albert, Citation2014) or from the perspective of information saliency and placement (Cao et al., Citation2019). Some studies have also looked at emotional factors of technology-mediated advertising (Park & Salvendy, Citation2012) and using technology to adapt advertising for cognitively different users (Sourina & Liu, Citation2014). The common thread in previous studies is focusing on adverse effects such as interfering with users’ task (Lewandowska & Jankowski, Citation2017). Even when studies deal with improving ad UX, the focus tends to be on placement and size of ads, rather than their content. Given this, there is a need for experimental studies in HCI that focus on improving ad content, not only ad placement.
2.2. Benefits of personified user group information
HCI literature has described several benefits relating to the personification of users, i.e., making nameless/faceless user groups. These include at least the following.
Focus on the human. Personification compresses user data into human representations that include personified details, such as name and face (Holtzblatt et al., Citation2005). This humanization can facilitate focusing on the preferred user groups (Miaskiewicz & Kozar, Citation2011), which is especially beneficial when tailoring product features or communication to users (Cooper, Citation1999; Jaio & Cindy, Citation2007; Salminen et al., Citation2018; Pruitt & Grudin, Citation2003). Thus, personification can help determine if the right user needs are being addressed (Miaskiewicz & Kozar, Citation2011).
Communication and shared mental models. Personification summarizes the end-users’ attributes in intuitive human representations that are more memorable than tables, numbers, or charts (Cooper, Citation1999; Nielsen, Citation2019; Pruitt & Adlin, Citation2006; Pruitt & Grudin, Citation2003). These human representations make it “easy for decision makers and employees to understand and to communicate effectively with each other.” (Haas & Kunz, Citation2009) (p. 603). Often, this involves narratives (Minichiello et al., Citation2018), e.g., “Mary is a 35-year-old woman who likes … ”. Since humans tend to be receptive to narratives (Polkinghorne, Citation1988), storytelling facilitates the communication and absorption of attributes of the user group as shared mental models (Madsen & Nielsen, Citation2010).
Empathy toward the users. Personified user information enhances identification with the users (Miaskiewicz et al., Citation2008; Pruitt & Grudin, Citation2003), enabling decision-makers to obtain an immersive understanding of others. This understanding relies on human beings’ ability to empathize with other humans (Krashen, Citation1984) and is a powerful agent for human-centric design tasks, such as ad design. Consider the difference between writing an ad for a nameless “user group” versus for “a stressed single mom so she can better manage her time.”
Finally, empathy may reduce the self-centering bias of designers, i.e., the tendency to focus on their own experiences instead of those of users (Long, Citation2009; Matthews et al., Citation2012). As argued by Hill et al. (Citation2017, p. 6660): “[a decision maker’s] ability to engage and empathize with personas comes in part from the fact that a persona seems like a person – not like a list of facts, a philosophical stance, or an educational document – but an actual person.”
Thus far, quantitative research validating these benefits is scant. There are industry reports and case studies (Forrester Research, Citation2010; Friess, Citation2012; Rönkkö et al., Citation2004; Steenburgh et al., Citation2009), but there is little empirical work on validating the benefits of PUGs. What is notably missing are experiments or quantitative analyses measuring real performance metrics, such as ad response. In the context of advertisement design, “performance” implies not only the benefit of the advertiser but also the benefit of the audience. If social media platforms expose end-users to “bad” advertising that is irrelevant to them because the ad designers did not truly understand the users, this will hurt the UX of these platforms. In most online platforms, ads are a “necessary evil” as they provide the means to fund the platform and keep its use free for the end-users. In a type of a “social contract” (Salminen, Gach et al., Citation2018), the users are willing to accept ads in exchange for the use of the platform. Given this framework, creating more empathetic ads serves the goals of both advertisers and end-users accessing the platforms.
2.3. Research gap
Only a few previous studies consider the impact of PUGs for the design of advertisements or other promotional messages. Vosbergen et al. (Citation2015) used personas to tailor educational messages to the preferences of coronary heart disease patients. However, this study evaluated the messages using self-reported ratings, which is less reliable than observing behavioral data (i.e., if message recipients respond better to the created messages). Chaisuwan et al. (Citation2019) developed personified user groups to tailor offers and messages to individuals depending upon the user groups’ attributes. However, their study did not evaluate the outcome metrics of the messages.
Therefore, there is a lack of research evaluating the communicative and empathy benefits of using PUGs in the design of online advertising. More particular, we could not locate research in HCI concerning the impact of using PUGs to design more empathetic ads. However, the literature does allude to several benefits, often anecdotally backed, of which our primary interest is in the ability of personified information to increase communication and empathy toward the user group.
2.4. Hypotheses
Based on the literature evoking the benefits of personified user group information in the field of HCI, particularly regarding PUG, we formulate the following hypotheses:
H01: Use of PUG improves ad performance over the use of NUG. Particularly,
H01a: Use of PUG increases clicking rate of target users (Communicative aspect)
H01b: Use of PUG increases purchase intent of target users (Communicative aspect)
H01c: Use of PUG increase purchase rate of target users (Communicative aspect)
H02: Use of PUG increases empathy in the designed ads (Empathy aspect)
The first hypothesis deals with the communicative benefits claimed in the HCI literature. It presumes that the use of personification improves communication effectiveness (in this case, ad performance). The reasoning is that ads designed using PUG feel more personal to the consumers than ads designed for nameless/faceless user groups; thus, resulting in an affirmative acceptance.
The second hypothesis deals with the empathy benefit, in that we expect the ads created with PUG to demonstrate more empathetic elements than those created with NUG. Theories of person perception, social facilitation, and self-presentation (Bond, Citation1982) suggest that adding human characteristics to user interfaces affects individuals’ responses to those interfaces. For example, Sproull et al. (Citation1996) found that people attributed personality traits to a talking-face interface and were more engaged by it than a text-display interface. This heightened immersion, we hypothesize, can also yield different (more empathetic) ad copywriting than using mere spreadsheet information.
3. Methodology
3.1. Performance metrics
To test H01, we choose two metrics that are widely deployed as success metrics for online advertising (see ): clicks and initiated checkouts. Both are important in the industry – click response rates are typically used for assessing advertising appeal (Järvinen & Karjaluoto, Citation2015), and purchase intent is especially critical for e-commerce companies that want to increase their sales (Clarke & Jansen, Citation2017; Salminen et al., Citation2017). We also analyze the actual number of purchases from both PUG and NUG ads.
Table 1. Performance metrics obtained from the Facebook Ads platform
To test H02, we manually infer “user mentions” from the ad texts to determine their degree of empathy. This approach follows the Cognitive Discourse Analysis (CDA) for accessing cognitive representations and processes through language data (Tenbrink, Citation2014), specifically employing LIWC (Tausczik & Pennebaker, Citation2010) to ad texts.
3.2. PUG/NUG creation
Our goal is to translate user analytics into a format that can be easily used for ad design. For this, we apply a standardized algorithmic approach (An, Kwak, Jung et al., Citation2018; An, Kwak, Salminen et al., Citation2018) to generate two PUGs (one male, one female) and then create corresponding NUG spreadsheets using identical user group information from Google Analytics (see ). Both types, PUG profiles and spreadsheets, are deployed in the industry for customer insights, although the current analytics climate emphasizes the use of numbers (Salminen et al., Citation2018). We provide the English description of the female PUG (“Veera”) from for convenience:
Figure 1. Examples of treatments. Both were created from the real Google Analytics visitor data of the focal organization. PUGFEMALE treatment (1/2, see Supplementary Material for full-size images of both treatments). The information is personified by providing a name, picture, and profile layout. NUGEMALE corresponding to the PUGFEMALE treatment on the left-hand side. The information is the same, but it is presented as a spreadsheet instead of a personified user group profile
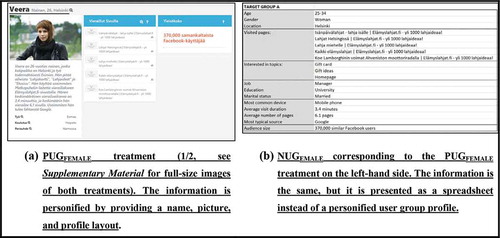
“Veera is a 26-year-old female living in Finland and works in the Management field. She likes to read about ‘Gift cards’, ‘Best Gift Ideas’, ‘All Experience Gifts’ on her Mobile. Her average page visit time is about 3.4 minutes, and on average she visits 6.1 pages. Most often, she comes through Google.”
The PUGs and NUGs were both created using the Google Analytics data of a Finnish e-commerce company. This company sells “experience gifts,” meaning gift cards that contain an experience (e.g., rally driving, dinner in the dark, tandem jump). This industry sector reflects the trend for immaterial consumption by providing alternatives to material gifts (Clarke, Citation2008; Clarke, Citation2006; Salminen et al., Citation2017).
As the PUG creation methodology has been reported in related work (An, Kwak, Jung et al., Citation2018; An, Kwak, Salminen et al., Citation2018; Jung et al., Citation2018), we omit repetition here. In brief, this approach uses online analytics data to automatically generate personified descriptions of the user segments in the underlying dataset (Salminen, Şengün et al., Citation2018). This standardization removes human subjectivity from the process of PUG creation, which is a typical concern when creating PUGs (Chapman & Milham, Citation2006).
Note that we are unable to test “fully rounded” persona profiles (Nielsen, Citation2019) because of the limitations of the PUG system at the time of conducting the research. The prototype level system did not provide user quotes and goals required for rounded personas. In other words, rather than corresponding with the notion of rounded personas (Nielsen, Citation2019), the personification we apply corresponds more with the notion of prototype personas (Estell & Reid, Citation2010) or skeletal personas (Stevenson & Mattson, Citation2019) from the HCI literature. However, even these less detailed PUGs are worth testing, as they provide the critical personification of name and face. According to H02, these attributes provide ad writers with enough personified cues to make the designed ads more empathetic.
3.3. Experimental design
The experimental variable is group, i.e., use of name and face in a profile layout (PUG) relative to the use of spreadsheet information (NUG). We counterbalanced the sequence of showing the PUGs and NUGs to mitigate potential order effects (Salminen, Nielsen et al., Citation2018). Thus, each participant uses both a PUG (either male or female) and a NUG (either female or male) in one of the following sequences:
S1: PUGMALE → NUGFEMALE (7 participants)
S2: PUGFEMALE → NUGMALE (7 participants)
S3: NUGMALE → PUGFEMALE (8 participants)
S4: NUGFEMALE → PUGMALE (8 participants)
The 30 participants were randomly assigned to one of these four sequences given the counterbalancing, such that each sequence has a close-to-even number of participants (as shown in the parentheses above). Genders (male/female) were also balanced among the sequences.
3.4. Participants
We recruited the participants from three sources: (a) the focal e-commerce company (n = 4), (b) a marketing agency known to the researchers for (n = 15), and (c) other marketing professionals known to the researchers (n = 11). Out of the 30 participants (see ), 14 (47%) were female. The average age was 30 (SD = 4.7), minimum 23, and a maximum of 48 years old. The average experience of participants in online advertising was 3.8 years (SD = 2.38) and experience using personas 1.9 years (SD = 0.47). Experience using personas was measured because it is a common conceptualization for PUG. Correlation between ad and persona experience was low (r = 0.098).
Table 2. Descriptive statistics for the study sample
The % for Gender, Ad and persona experience is calculated from the total number of participants.
The participants were grouped in two ways: (a) by their persona experience and (b) by their online ad experience. In both groupings, we labeled participants with more than two years of experience as “more experienced.”
3.5. Task design for Ad design
Each participant (P) was shown a user group with personified information (name, face, and other information) (PUG) and asked to create a Facebook advertisement. Each participant was also shown non-personified information on another user group (i.e., nameless, faceless user group) (NUG), and again asked to create a Facebook ad. Therefore, each participant created two ads.
To facilitate ad design, we provided the participants with a spreadsheet template and instructions that enabled them to write the ads for Facebook. Each Facebook ad consists of text and a picture. Here, the picture was kept constant, and the participants could only design the text part of the ad (see ).
Figure 2. Example adFootnote1 (P17-TG). Each participant created two ads, one using PUG and one using NUG. The image [A], call-to-action button [D], and website URL [E] were constant, while the copytext [B] and ad headline [C] varied by the participant
![Figure 2. Example adFootnote1 (P17-TG). Each participant created two ads, one using PUG and one using NUG. The image [A], call-to-action button [D], and website URL [E] were constant, while the copytext [B] and ad headline [C] varied by the participant](/cms/asset/d81c92ff-0d24-4f19-a019-ff4044a08122/hihc_a_1809246_f0002_oc.jpg)
3.6. Ad campaign creation
After the participants created advertisements, we took the ads and created actual Facebook ad campaigns for the retail company. In Facebook Ads, a campaign contains ad sets, and an ad set contains one or more ads. In total, we had 60 ads, two per P (one for PUG, and one for NUG). We divided these into 12 campaigns, each having five identical ad sets with one ad.
For targeting, we created two Facebook target groups whose attributes match the two base target groups (male/female). For example, the female group had the following attributes: Age: 25–34; Gender: Female; Living in: Helsinki; Language: Finnish; Relationship Status: Married; Education Level: College grad. This information corresponded to that shown in the PUGs and NUGs.
The impact of brand familiarity (Campbell & Keller, Citation2003) was mitigated by excluding Facebook users who may be familiar with the focal company from ad delivery. This exclusion included people that had visited the company’s website in the previous 30 days, and those being on the company’s mailing list. We did this exclusion using the ‘custom audience’ feature of the Facebook Ads platform.
As people in different postal code areas may have different socio-economic characteristics, we used the Finnish postal code system to target people in specific postal codes in the Finnish capital region (Helsinki Metropolitan area). These postal codes were assigned evenly to ensure each ad set had areas from all municipalities in the capital region. Because each ad set had its unique set of postal codes, this also prevented Facebook users from seeing more than one of our ads.
We gave each ad 14 days to run (December 1 to 14, 2018) and a 50 € budget. The campaigns ran in parallel to mitigate temporal effects, such as seasonality (Heien, Citation2001). The ads ran all the time during the two weeks. The chosen placements were according to each user group’s preferred device on their Facebook feed (desktop or mobile). The ads targeted all operating systems. The Facebook Ads parameters are shown in .
Table 3. Facebook Ads parameters (C for Campaign, A for Ad set level). All campaigns and ad sets had identical parameters
After the campaign period, we exported data from Facebook Ads for further analysis. This data included the ads’ performance metrics, i.e., unique clicks (i.e., each time an ad is clicked), initiated checkouts, impressions (number of times each ad was shown), reach (number of people each ad was shown to), and frequency (number of times an ad was shown to a person on average). The three latter were used as control variables (Pedrick & Zufryden, Citation1991) in the modeling.
3.7. Preprocessing of data
Continuous variables (e.g., number of unique clicks and reach) were summarized using median and interquartile range (IQR), as these metrics are more robust when the data is not normal. Categorical data was summarized using counts and percentages. We performed the statistical analysis using the R software. We used principal component analysis (PCA) to reduce redundancy in the data, as the continuous variables were highly correlated, with Pearson’s correlation being above 0.80 across all pairs (see ). PCA extracted as much variance as possible from the number of impressions, reach, and frequency. According to standard practice (Jolliffe, Citation2011), these variables were scaled and centered prior to the analysis. We chose the first principal component (PC1) as a covariate in the analysis since PC1 explained more than 90% of the variance in the three variables. There was a strong positive association between PC1 and the number of unique clicks (see ). The distribution of the DV followed a Poisson distribution.
Figure 3. (I) Correlation between ad properties. (II) (a). Association between PC1 and the number of unique clicks. (b). Distribution of the number of unique clicks (a) shows that PC1 is highly correlated with clicks, and thus we needed to include it in the model. (b) shows that the clicks are skewed, which explains why we did not use conventional modeling techniques and why we used median and IQR
3.8. Number of unique clicks and purchase intention
Generalized Poisson modeling (GPM) was used to model the number of unique clicks and purchase intention. Generalized Poisson regression was used since it can model over-dispersion and under-dispersion in count data to a higher degree compared to the conventional Poisson models (Consul & Famoye, Citation1992). An additional parameter was used to model zero inflation, as the data contained many zeros.
The likelihood ratio test was used to assess whether a random intercept should be used to model the correlation of observations within each participant. PC1 was included as a covariate, as it explains the majority of variance in the three continuous covariates. Gender, group (PUG vs. NUG), ad experience (AE), and persona experience (PE) were included as factors in the model. Adding more variables did not result in a better fitting model and would make the model much more complicated. The main effect for these variables was assessed as the following interactions (I):
I01: The interaction between group and AE
I02: The interaction between group and PE
I03: The interaction between AE and PE
I04: The three-way interaction among group, AE, and PE
We used the likelihood ratio test to assess whether these interactions were statistically significant or not. Only significant interactions were included in the model to reduce model complexity. We assessed the model fit using simulated scaled (quantile) residuals for fitted generalized linear mixed models (GLMM). The Quantile-Quantile (QQ) plot for simulated residuals was examined, as well as the scatter plot for the relationship between the fitted values and standardized residuals.
3.9. Analysis procedure
Regression coefficients were calculated and tested for statistical significance using the Z statistic for GPM (or Wald statistic for binary logistic regression models). Hypothesis testing was performed at the 0.05 level of significance. We exponentiated the model coefficients to obtain the incident rate for the expected count of clicks or checkouts (or odds ratio for completed purchases) since a log link was used when constructing the models.
The final model was used to calculate the estimated marginal counts for GPM at various levels of independent variables, i.e., the expected count of unique clicks at the various levels of factors included in the model. In the presence of statistically significant interactions, the main effects were ignored, and only the interactions were examined to investigate the expected count of unique clicks at various combinations of factors that contribute to these clicks.
4. Results
4.1. Descriptive results
communicates the descriptive results of the campaign. The descriptive results indicate that the ads created with PUG outperform those created with NUG on all performance metrics. The PUG ads had 30.4% more clicks (n = 73 vs. n = 56), 30.0% more initiated checkouts (n = 26 vs. n = 20), and 75.0% more purchases (n = 7 vs. n = 4). However, the relative differences tend to be small: a 5.1% increase in click-through-rate, a 0.3% decrease in initiated checkout rate, and a 35.2% increase in conversion rate. The reader should not interpret the descriptive results should as proof of PUG outperforming NUG. However, we present this information because it contains basic campaign metrics to inform the reader. The following sections show the results of statistical testing for each hypothesis.
H01: Use of PUG improves ad performance over NUG
Table 4. Campaign results
4.1.1. GPM results for number of clicks (H01a)
We first examine the clicks.
4.1.1.1. Likelihood ratio test for comparing models
Likelihood test results showed that including random effects for participants did not significantly improve model fit (X2 = 0, P > .05). Thus, we used a GPM with no random effects. Results also showed that including a polynomial (quadratic) term for PC1 did not improve model fit (X2 (3) = 4, P > .05). The three-way interaction between group, AE, and PE was not statistically significant (X2 (2) = 3.43, P > .05). Also, the two-way interaction between AE and PE was not statistically significant (X2 = 3.4, P > .05). Thus, we included only the two-way interactions between group and PE and between group and AE in the model.
4.1.1.2. Model fit
We conducted two tests to determine if the model was a good fit. First, comparing the distribution of expected zeros in the data against the observed zeros showed that the expected count is not significantly different from the observed count (P > .05). Second, comparing the dispersion of simulated residuals to the observed residuals using non-parametric testing showed that the dispersion of simulated residuals is not significantly different from the dispersion of observed residuals (P > .05). These results show that the proposed model has a good fit for the data.
4.1.1.3. Model results
The group shows (see ) a statistically significant negative association with the number of unique clicks (IR = 0.417, P < .05). This result indicates that the expected count of unique clicks among ads written by participants with low AE and PE when using a PUG is 58.3% lower compared to when using a NUG. Thus, the effect of a PUG is lower compared to the effect of the NUG among ads by participants with low AE and PE.
Also, PE (IR = 0.665, P > .05) and AE (IR = 0.916, P > .05) do not show a statistically significant association with the unique number of clicks (see ). This result indicates that the main effects of AE and PE do not affect the number of clicks among ads by participants when using a NUG. However, PC1 shows a significant association with the number of unique clicks (IR = 1.93, P < .001), indicating that the linear combination of impressions, reach, and frequency is positively associated with the number of unique clicks.
Two interesting aspects of the model are the two-way interaction between the group and PE (IR = 2.08, P < .05) and the two-way interaction between the group and AE (IR = 2.82, P < .05). The two-way interaction between group and AE indicates that the expected count of unique clicks among ads by participants with more AE who are using a PUG is 2.82 times the expected count for ads by participants that have more AE and are using a NUG. These results indicate that participants with more AE are more likely to benefit from using a PUG.
Similarly, the statistically significant two-way interaction between the group and PE indicates that the expected count of unique clicks among ads by participants with more PE who are using a PUG is 2.08 times the expected count of ads by participants with more PE who are using a NUG. This result suggests that participants with more PE are more likely to benefit from being shown a PUG.
The expected count of unique clicks among ads written by participants with low AE and PE who are using a PUG is 58.3% lower compared to those who are using a NUG. This result indicates that the effect of a PUG is lower compared to the effect of the NUG among ads by participants with low AE and PE. So, participants with less AE and PE are more likely to benefit from using a NUG compared to a PUG. In contrast, participants who either have more AE or PE are more likely to benefit from using a PUG. Moreover, the benefit is higher for participants who have both more AE and more PE since the effects are multiplicative (IR = 2.08 × 2.82 = 5.69). The result indicates that the participants more experienced with both personas and ads are more likely to benefit from using a PUG compared to the other participants.
4.1.1.4. Estimated marginal count of unique clicks
The counts of unique clicks were estimated at various combinations of AE, PE, and group (see ). The counts for these various combinations were estimated at various levels of PC1 to consider such covariate since reach, impressions, and frequency affect the final number of clicks regardless of the factors included in the model.
Figure 4. Estimated counts at various combinations of factors. The figure on the top left shows that NUG is more beneficial than PUG (low AE and PE), while the bottom right shows that PUG is more beneficial in those with high AE and PE
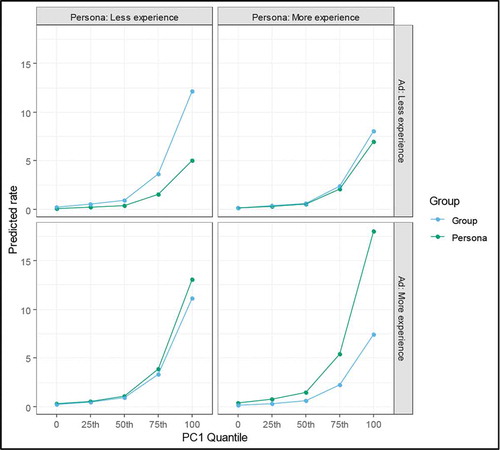
Based on model results, participants with less AE and PE are more likely to benefit from the NUG compared to PUG. The participants more experienced with ads and personas are the ones who are most likely to benefit from a PUG.
Based on these results, H01a is partially supported: At high levels of ad and persona experience, using personified user groups increases the ad clicks.
4.1.2. GPM results for purchase intent (H01b)
We next examine purchase intent.
4.1.2.1. Model fit
As before, we use GPM to model purchase intent (i.e., the number of initiated checkouts). Model residuals indicate that the model was a good fit for the data. The three-way interaction was not statistically significant, so we did not include it in the model. All two-way interactions were statistically significant (X2 = 1.97, P > .05). Including a random intercept also did not improve the model fit (X2 = 0, P > .05).
4.1.2.2. Model results
The intercept (IR = 0.016, P < .05) represents the expected number of initiated checkouts for ads written by a female participant with less AE and PE (see ). The group did not show a significant association with the expected number of checkouts (IR = 5.35, P > .05). The result indicates that the expected count of initiated checkouts by participants with low AE and PE when using a PUG is not significantly different from the count when using a NUG.
Table 5. The GPM for the count of unique clicks. IRR = Incident rate. The intercept (IR = 1.23, P = .29) represents the expected number of unique clicks for the ads written by a female participant with less AE and PE
Higher AE (IR = 13.489, P < .05) and PE (IR = 84.597, P < .05) were significantly associated with the expected count of initiated checkouts. The result indicates that the main effects of ad and persona experience affect the number of checkouts. PC1 showed a statistically significant association with the number of unique clicks (IR = 3.177, P < .001), indicating that the linear combination of impressions, reach, and frequency is positively associated with the number of initiated checkouts (see ).
Figure 5. The expected count of checkouts based on ad and persona experience
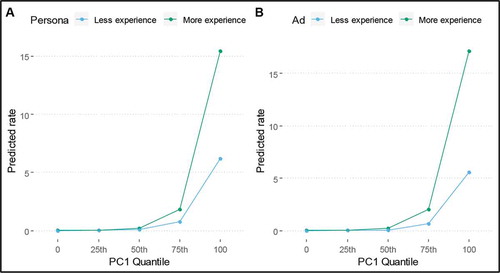
The estimated marginal counts show that the effect of PE is significant among participants with low AE. Among participants with high AE, the expected count was similar among participants irrespective of PE. However, the expected count was significantly different among participants with low AE. The estimated marginal count of initiated checkouts in ads by participants with low PE was 91.3% lower compared to participants with high PE (P < .05). The difference was not statistically significant within participants with high AE (P > .05).
The two-way interaction between PE and group was statistically significant (IR = 0.015, P < .05). The result indicates that the expected count of initiated checkouts in ads by participants with high PE when using a PUG is 98.5% lower compared to the expected count among those with high PE when using a NUG, meaning that NUG is more helpful for participants with high PE.
Thus, there is not enough evidence to support H01b: The use of a personified user group did not improve the purchase intent of the target users.
4.1.3. GPM results for purchase rate (H01c)
Results showed that none of the interactions was statistically significant (P > .05). Thus, we included only the main effects in the model. The analysis also shows that a random intercept is not needed for participants. The model explained 28.7% of the variance in the DV (completing a purchase).
Results in show that only the linear combination of impressions, reach, and frequency was significantly associated with the odds of obtaining a purchase (OR = 10.6, P < .05). The results indicate that the odds of completing a purchase increases with increasing reach, frequency, and impressions. Group, AE, or PE were not significantly associated with the odds of completing a purchase. Thus, there is not enough evidence to support H01c: The use of a personified user group did not improve the purchase rate of the target users.
H02: Use of PUG Increases Empathy in the Designed Ads
Addressing the second hypothesis, we used two main approaches: (1) an Empathy dictionary developed based on manual analysis of the ad texts, and (2) Linguistic Inquiry and Word Count (LIWC) dictionary with predefined vocabularies for psychological processes. We carried out multiple analyses to increase the robustness of the findings. The following sections report the results.
Table 6. GPM for the count of initiated checkouts
Table 7. Binary logistic regression model results for the probability of completing a purchase
4.1.4. Empathy dictionary
For building a dictionary that reflects the observed empathy in the designed ads, we used CDA (Tenbrink, Citation2014), a technique that aims to extract meanings from text. The number of user group mentions determined the level of empathy in ad texts created by the participants.
In this process, we divided all ad texts created by the participants into two text corpora, CORPUSPUG and CORPUSNUG, according to whether they were created using a PUG or a NUG. These text corpora were processed by an algorithm that computed word frequency, i.e., the number of times each unique word was mentioned. Two researchers then manually coded the Top-400 words for each corpus to extract if the word referred to a specific user group (i.e., binary classification of ‘yes’ or ‘no’), such as “her,” “him,” “husband,” “wife,” “your family,” and so on. If a word contained a user group mention, we coded it as ‘1ʹ; if not, we coded it as ‘0ʹ. The reasoning is that the user group mentions are considered to be a sign of empathy. That is, an ad mentioning a person or people demonstrates more empathy toward the user group than an ad not talking about people.
Because the coding process involves some degree of subjectivity, i.e., two people may disagree if a particular word refers to a user group, two researchers independently coded the ad texts. We did not deem the inter-rater agreement score after the first iteration (Cohen’s k = 0.788) satisfactory. This prompted the researchers to work collaboratively toward an understanding of what empathy means in the ad design context (see ). For example, “for husband” is a user group mention displaying empathy because it reflects the user group information given to the participants (Veera’s marital status = married → buys a gift for husband), while “gift recipient” is not because it does not specify a user group. Other non-empathetic words included “experience” (i.e., mentions a product, not people), “Christmas” (mentions a gift-giving occasion, not people), “unforgettable” (mentions a product benefit, not people).
Table 8. Examples of an empathetic and non-empathetic ad
Through this collaborative coding process, we established a shared agreement of which words reflected empathy in the ad texts and which not. Examples of the former, dubbed ‘empathy vocabulary,’ are shown in . We provide the full list in the Supplementary Material in both English and Finnish.
Table 9. Examples from Empathy vocabulary with the number of times mentioned in ad texts created using PUG and NUG. The most common user group mention is ‘he/she’ (n = 6)
After coding the empathy mentions, we tallied the number of total mentions displaying empathy for CORPUSPUG and CORPUSNUG. We did this by multiplying each word that was labeled as empathetic with the frequency of that word in the corpus. The results show that ad texts designed using a PUG yield 56.4% more user group mentions (n = 61) than those designed using a NUG (n = 39).
We also conducted a paired samples t-test to compare the number of empathy words in PUG and NUG conditions. There was a significant difference in the scores for the PUG (M = 1.24, SD = 1.29) and NUG (M = 0.80, SD = 0.86) conditions; t (48) = −1.95, P = .056. These results indicate that when ad designers use PUG to design ads for a user group, the number of user group mentions in the ad text increases.
Moreover, the PUG corpus includes 40% more unique empathy words than the NUG corpus (see ), indicating a wider variety of empathy mentions.
Figure 6. Empathy words appearing in PUG and NUG ad texts. Twenty-one words appear only in PUG, 15 only in NUG, and 13 appear in both
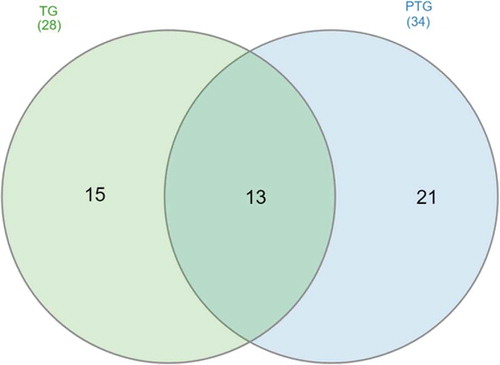
Overall, these results support the second hypothesis: Use of PUG increases the level of empathy in the designed ads.
4.1.5. LIWC analysis
We used the LIWC dictionary (Tausczik & Pennebaker, Citation2010) to analyze the ad texts further. While the previous step of using an empathy dictionary represents an inductive approach where we derived the words from the data, the use of LIWC represents a deductive approach, in which we use an established word-level coding scheme. In other words, the methods provide methodological triangulation.Footnote2
LIWC represents an established word-level coding scheme that has “been linked in hundreds of studies to interesting psychological processes” (Tausczik & Pennebaker, Citation2010, p. 30). LIWC has also been deployed for the lexical analysis of empathy in previous research. Alam et al. (Citation2016) use the full categories for an automatic machine learning analysis. Marina Litvak et al. (Citation2016), in turn, focus on specific categories for hypothesis testing. The latter approach seems more appropriate for our use of LIWC, as we are interested in addressing a specific hypothesis of there being more empathy in PUG ad texts.
The LIWC taxonomy contains 80 categories with a varying number of words reflecting that category (e.g., sentiment). While these categories do not directly contain words labeled for ‘empathy,’ we identified several categories that are relevant for our research purpose and match our operational definition of empathy. These include (1) Personal pronouns (subcategories: i, we, you, she or he, they), (2) Affective processes (positive emotions, negative emotions, anxiety, anger, sadness), and (3) Social processes (family, friends, female, male). Because LIWC dictionaries are not available in Finnish, the ads were first translated to English and then passed to the LIWC 2015 software (the latest version in January 2020).
Descriptive statistics were performed using counts and percentages. The differences in scores between PUG ads and NUG ads were statistically tested. More specifically, we used multivariate logistic regression analysis to assess whether the odds of using the selected categories were significantly different between the PUG and NUG ads. The odds ratio (OR) was calculated for each of the categories and tested for statistical significance, i.e., whether the OR significantly differs from 1. Hypothesis testing was performed at the 5% level of significance.
The results () showed an overall increase of 3.1% in the use of personal pronouns in PUG ad texts (87.5%, n = 28) relative to NUG ad texts (84.4%, n = 27). The difference in their use was not statistically significant (P = .26). However, the analysis of individual categories revealed some interesting findings. The increase in ‘he’ and ‘she’ pronouns (+12.5%) in PUG ad texts (21.9%, n = 7) compared to NUG (9.38%, n = 3) was statistically significant (OR = 6.5, P = .04). Moreover, there was a statistically significant increase (OR = 7.72, P = .04) in the use of “We” in the PUG ads (43.8%, n = 14) compared to the NUG ads (21.9%, n = 7).
Table 10. LIWC categories and results. Relative differences in LIWC use between PUG and NUG (PUG % – NUG %) in square brackets. Significant differences bolded
Furthermore, we observed a 12.5% decrease in the use of negative emotions in ads created using PUGs (21.9%, n = 7) relative to those created using NUGs (34.4%, n = 11). This difference is not statistically significant (P = .71). The use of positive emotions decreased slightly in the PUG group (84.4%, n = 27) compared to the NUG group (87.5%, n = 28). There was also an increase (+6.25%) in the ‘friend’ category when comparing PUG (21.9%, n = 7) and NUG ads (15.6%, n = 5). The difference was not statistically significant (P = .19).
In conclusion, the LIWC analysis shows that some dimensions of personal pronouns are higher in the PUG ad texts. Most notably, the use of ‘We’ and ‘She/He’ was higher in PUGs compared to NUGs. Therefore, H01 is partially supported: Use of personified user groups increases personal pronouns in the created ads (particularly the dimensions of ‘We’ and ‘She/He’).
5. Discussion
This research tested if a (PUG) results in better ad performance relative to a (NUG) in a 30-participants experiment of creating Facebook ads. Findings show that using PUG increased the number of clicks for ads created by people more experienced with both ads and personas. An ad text analysis showed that using PUG increased the empathy expressed in the ads. However, PUG use did not significantly increase purchase intent.
5.1. Main contribution for HCI
Our research makes three main contributions:
First, we report behavioral data from a real-world experiment testing PUGs to complement case studies (Friess, Citation2012; Matthews et al., Citation2012) and self-reported metrics (Vosbergen et al., Citation2015) reported in previous studies. Running the ads in a real advertising channel affords insights into how the members of the user group respond to the ads created with PUG vs. NUG.
Second, we apply PUGs, of which personas are a type, on a quickly growing industry. Competition in online advertising is fierce, and the results can yield performance gain, especially for gaining clicks, for organizations applying PUGs. The raw counts of our experiment show that ads created with PUG as well as those created with NUG on all critical metrics, with PUG ads receiving more clicks, more initiated checkouts, and more purchases. However, only the click results are statistically significant, and only for a subset of participants (those more experienced with both ads and personas).
Third, we empirically investigate empathy that is widely proposed in HCI theory as a foundational benefit of personified user information (Cooper, Citation1999; Hill et al., Citation2017; Jansen et al., Citation2017; Nielsen, Citation2019) but lacking empirical verification – specifically, we show evidence of its existence in the ad design context. Based on our analysis, the empathy benefits of PUG claimed in the HCI literature appear real.
Overall, our results show that PUGs are especially powerful for people with previous experience in online advertising and HCI methodologies. We speculate the reason being that these people are able to leverage both the human-centricity of PUGs as well as the best practices of advertising, thus achieving better advertising results.
5.2. Implications for dialogue between marketing and HCI
Duda (Citation2018) asks (p. 173): who owns personas? Personas are sometimes developed by the UX department in organizations, sometimes by the marketing department. Regardless of who creates PUGs, for both domains, the purpose remains the same – shift decisions toward user-centered thinking. By enhancing empathy, PUGs can become a vehicle for a higher degree of market orientation and thus support both commercial objectives and UX.
Recognizing this shared goal can bridge some of the research findings in these two fields. Calls for increasing interdisciplinarity have previously been made concerning management information systems and HCI (Zhang & Dillon, Citation2003), for example. We suggest that marketing and HCI should exchange theories and concepts, as well. In particular, marketing concepts that could benefit HCI scholars include market orientation (Kohli & Jaworski, Citation1990; Narver & Slater, Citation1990) and customer-dominant logic (Stauss et al., Citation2010), as these concepts are similar to the concept of user-centricity.
For HCI, our findings provide empirical support for the claimed empathy benefits of personification. While in the past personas have primarily been studied in the perspective of UX designers (i.e., “design personas” (Matthews et al., Citation2012; Nielsen et al., Citation2015)), it is important to explore persona applications in other domains, such as marketing, to build bridges within the different disciplines that can employ PUGs as decision-making tools.
5.3. Practical implications for online Ad writers and end users
We are safe to recommend the use of human-centric approaches in online ad design, as doing so actually improved the click performance for the participants who were more experienced with online ads and personas. The fact that persona experience increases ad performance relative to only advertising experience suggests that online advertisers should be trained in the use of PUG and personas, as this leads to performance increases over having higher advertising experience only.
Given that showing a PUG increases empathy in the ads, is the use of a persona necessary? Or, should we just tell advertisers to incorporate language about a specific type of person (e.g., he/she, husband/wife) in their advertisements? While this is an interesting interpretation of the results, the real question may be: how to make ads more empathetic? From the advertising theory of segmentation, targeting, and re-targeting (Jenkinson, Citation1994; Lambrecht & Tucker, Citation2013; Matz et al., Citation2017), it seems apparent that empathetic messages improve performance. This appears to be one of the core tenets in advertising. If the principle of making ads personalized is so well known, why do the ad writers not apply this principle in all of the ads? From our findings, we can see they are not doing this. Instead, the numbers-oriented information about the user group seemingly sets a mental frame of writing less empathetic ads, whereas showing the information in the form of real people seems to frame the participant’s mind-set to focus on the individual, which appears to be a benefit of PUG usage.
While this can be considered as a “trivial” rationalization for HCI theory (long arguing in favor of empathy), the fact is that the effect of PUGs on the empathy in ads has not been empirically shown in previous research, addressing a need in the literature (Kuhn, Citation1970). The fact that our study provides evidence to back the usefulness of PUGs, especially in the design task of creating advertisements, provides fuel for the dialogue of theory and empiry within the HCI discipline.
Regarding the end-users exposed to online advertising on social media platforms, we argue that more empathetic ads can also be considered as more user-friendly. The relevance of the shown advertisements is relevant for UX on social media platforms. Although we do not directly measure the impact of better ads on UX, metrics such as click-through-rate approximate improvement of UX, as users indicate by clicking that the ad is perceived as relevant by them (Jansen, Citation2011; Kathuria et al., Citation2010). Making more empathetic, more relevant ads can, therefore, be well aligned with the core values of the HCI community.
5.4. Limitations and future research
The rarity of initiated checkouts (<30 for both PUG and NUG) can hinder the detection of real effects. Higher ad exposure could yield significant differences. Moreover, we omitted the reporting of completed purchases from this study due to their small number. More widespread and longer campaigns may be needed to test completed purchases because they are relatively rare occurrences (less than 0.05% of people who saw an ad completed a purchase).
Another limitation is that we were not testing real personas but PUGs with limited personified information. Nevertheless, the advantage of this approach is that the system generating the PUGs from Google Analytics data is readily deployable. We also show that including only name and face as personified information can be enough to add the level of empathy in PUG users’ creative outputs. Future studies should explore NUG vs. PUG vs. fully rounded personas.
Future research could also inspect several aspects of ad texts, such as lexical diversity, gender differences in empathy mentions, as well as operationalizing empathy as a dummy variable for the performance analysis.
6. Conclusion
Using PUG increased click performance of ads created by people who are more experienced with ads and personas. Moreover, the use of PUG increased the empathy of the created ad texts. However, the use of PUG did not significantly increase purchase intent or actual purchases. The results imply that using PUG for online ad design evokes more empathy and improves some aspects of advertising performance. Benefits are the highest for users that are experienced with both personas and online advertising.
Acknowledgments
We thank all the participants for taking the time of their busy schedule, the e-commerce company for providing access to their data, and research colleagues that provided helpful comments on previous versions of this document.
Additional information
Notes on contributors
Joni Salminen
Joni Salminen is a Scientist at the Qatar Computing Research Institute, Hamad Bin Khalifa University, and a Postdoctoral Researcher at the Turku School of Economics. His research focuses on data-driven personas, marketing, and HCI.
Ilkka Kaate
Ilkka Kaate holds a Master’s degree in Marketing from Turku School of Economics, as well as a Master’s degree in Geography from the University of Turku. Ilkka is a digital marketing professional and owns his own consultancy business.
Ahmed Mohamed Sayed Kamel
Ahmed Mohamed Sayed Kamel received his Master’s degree in clinical pharmacy. He has several years of experience in statistics and data analysis and in working as an assistant lecturer. His interests include survey data analysis, biostatistics, public health, psychology, and education.
Soon-Gyo Jung
Soon-gyo Jung received his Bachelor’s degree in computer software from the Kwangwoon University, and Master’s degree in electrical and computer engineering from the Sungkyunkwan University, Suwon, Korea. He works at the Qatar Computing Research Institute as a Software Engineer developing a system that generates personas automatically from online user data.
Bernard J. Jansen
Bernard J. Jansen is a Principal Scientist in the Social Computing group of the Qatar Computing Research Institute, and a Professor with the College of Science and Engineering, Hamad Bin Khalifa University, and an Adjunct Professor with the College of Information Sciences and Technology at The Pennsylvania State University.
Notes
1. Translation in English (original in Finnish): Ad text: “Getting a meaningful gift for a male loved one can cause headache, but through [company name] you can find ideas also for the difficult cases!” Ad title: “When scent candle is not enough”.
2. Note that this analysis involves some overlap between the empathy dictionary – we have highlighted the overlapping terms in where applicable.
References
- Alam, F., Danieli, M., & Riccardi, G. (2016). Can we detect speakers’ empathy?: A real-life case study. In 2016 7th IEEE International Conference on Cognitive Infocommunications (CogInfoCom) (pp. 000059–000064). IEEE. https://doi.org/10.1109/CogInfoCom.2016.7804525
- Al-Qirim, N. (2006). Personas of e-commerce adoption in small businesses in New Zealand. Journal of Electronic Commerce in Organizations (JECO), 4(3), 18–45. https://doi.org/10.4018/jeco.2006070102
- An, J., Kwak, H., Jung, S.-G., Salminen, J., & Jansen, B. J. (2018). Customer segmentation using online platforms: Isolating behavioral and demographic segments for persona creation via aggregated user data. Social Network Analysis and Mining, 8(1), 54. https://doi.org/10.1007/s13278-018-0531-0
- An, J., Kwak, H., Jung, S., Salminen, J., Admad, M., & Jansen, B. (2018). Imaginary people representing real numbers: generating personas from online social media data. ACM Transactions on the Web (TWEB), 12(4), 1–26. https://doi.org/10.1145/3265986.
- Bond, C. F. (1982). Social facilitation: A self-presentational view. Journal of Personality and Social Psychology, 42(6), 1042–1050. https://doi.org/10.1037/0022-3514.42.6.1042
- Caballero, L., Moreno, A. M., & Seffah, A. (2014). Persona as a tool to involving human in agile methods: Contributions from HCI and marketing. In S. Sauer, C. Bogdan, P. Forbrig, R. Bernhaupt, & M. Winckler (Eds.), Human-Centered Software Engineering (pp. 283–290). Berlin, Heidelberg: Springer.
- Câmara, M., Signoretti, A., Costa, C., & Soares, S. C. (2018). Business affective persona (BAP): A methodology to create personas to enhance customer relationship with trust and empathy. Revista Turismo & Desenvolvimento, 29, 85–97.
- Campbell, M. C., & Keller, K. L. (2003). Brand familiarity and advertising repetition effects. Journal of Consumer Research, 30 (2), 292–304. https://doi.org/10.1086/376800
- Cao, Y., Qingxing, Q., Duffy, V. G., & Ding, Y. (2019, January). Attention for web directory advertisements: A top-down or bottom-up process? International Journal of Human–Computer Interaction, 35(1), 89–98. https://doi.org/10.1080/10447318.2018.1432162
- Chaisuwan, B.-N., Chantamas, M., & Prasongsukarn, K. (2019). Consumer persona: Segmentation scheme based on Buddhist temperaments for digital marketing. Multifaceted Explorations of Consumer Culture and Its Impact on Individuals and Society. IGI Global. https://doi.org/10.4018/978-1-5225-6120-0.ch010
- Chapman, C. N., & Milham, R. P. (2006). The Personas’ new clothes: Methodological and practical arguments against a popular method. In Proceedings of the Human Factors and Ergonomics Society Annual Meeting (pp. 634–636). https://doi.org/10.1177/154193120605000503
- Chen, Y., Pavlov, D., & Canny, J. F. (2009). Large-scale behavioral targeting (pp. 209–218). https://doi.org/10.1145/1557019.1557048
- Clarke, J. (2008, April). Experiences as gifts: From process to model. European Journal of Marketing, 42(3/4), 365–389. https://doi.org/10.1108/03090560810852986
- Clarke, J. R. (2006, November). Different to ‘dust collectors’? The giving and receiving of experience gifts. Journal of Consumer Behaviour, 5(6), 533–549. https://doi.org/10.1002/cb.201
- Clarke, T. B., & Jansen, B. J. (2017). Conversion potential: A metric for evaluating search engine advertising performance. Journal of Research in Interactive Marketing, 11(2), 142–159. https://doi.org/10.1108/JRIM-07-2016-0073
- Consul, P., & Famoye, F. (1992). Generalized poisson regression model. Communications in Statistics-Theory and Methods, 21(1), 89–109. https://doi.org/10.1080/03610929208830766
- Cooper, A. (1999). The inmates are running the asylum: Why high tech products drive us crazy and how to restore the sanity (1st ed.). Sams - Pearson Education.
- Duda, S. (2018). Personas—Who Owns Them. In V. von Gizycki & C. A. Elias (Eds.), Omnichannel Branding: Digitalisierung als Basis erlebnis- und beziehungsorientierter Markenführung (pp. 173–191). Springer Fachmedien Wiesbaden. https://doi.org/10.1007/978-3-658-21450-0_8
- Estell, J. K., & Reid, K. J. (2010). Work in progress—development of personas: Emphasizing human need in a first-year engineering capstone course. In 2010 IEEE Frontiers in Education Conference (FIE) (pp. T4E–1). Washington, DC: IEEE.
- Forrester Research. (2010). The ROI of personas. Retrieved June 21, 2017, from https://www.forrester.com/report/The+ROI+Of+Personas/-/E-RES55359
- Friess, E. (2012). Personas and decision making in the design process: An ethnographic case study. In Proceedings of the SIGCHI Conference on Human Factors in Computing Systems (CHI ’12) (pp. 1209–1218). ACM. https://doi.org/10.1145/2207676.2208572
- Haas, M., & Kunz, W. H. (2009). How to master the challenges of service mass customization? A persona-based approach. In Handbook of research in mass customization and personalization (pp. 603–621). World Scientific Publishing Company. https://doi.org/10.1142/9789814280280_0031
- Head, G. W. (1960). What does automation mean to the marketing man? Journal of Marketing, 24(4), 35–37. https://doi.org/10.1177/002224296002400406
- Heien, D. (2001). Habit, seasonality, and time aggregation in consumer behaviour. Applied Economics, 33(13), 1649–1653. https://doi.org/10.1080/000368401317035441
- Hill, C. G., Haag, M., Oleson, A., Mendez, C., Marsden, N., Sarma, A., & Burnett, M. (2017). Gender-inclusiveness personas vs. stereotyping: Can we have it both ways? In Proceedings of the 2017 CHI Conference (pp. 6658–6671). Denver, Colorado: ACM Press https://doi.org/10.1145/3025453.3025609
- Holtzblatt, K., Beringer, J., & Baker, L. (2005). Rapid user centered design techniques: Challenges and solutions. In CHI’05 extended abstracts on human factors in computing systems (pp. 2037–2038). ACM. https://doi.org/10.1145/1056808.1057088
- Huh, J., Kwon, B. C., Kim, S.-H., Lee, S., Choo, J., Kim, J., Choi, M.-J., & Yi, J. S. (2016, October). Personas in online health communities. Journal of Biomedical Informatics, 63(October), 212–225. https://doi.org/10.1016/j.jbi.2016.08.019
- Jaio, M., & Cindy, L. (2007, December) Introducing user profiles and personas into information systems development. AMCIS 2007 proceedings. Keystone, Colorado. http://aisel.aisnet.org/amcis2007/237
- Jansen, A., Van Mechelen, M., & Slegers, K. (2017). Personas and behavioral theories: A case study using self-determination theory to construct overweight personas. In Proceedings of the 2017 CHI Conference on Human Factors in Computing Systems (CHI ’17) (pp. 2127–2136). ACM. https://doi.org/10.1145/3025453.3026003
- Jansen, J. (2011). Understanding sponsored search: core elements of keyword advertising. Cambridge University Press.
- Järvinen, J., & Karjaluoto, H. (2015, October). The use of web analytics for digital marketing performance measurement. Industrial Marketing Management, 50 (Suppl. C), 117–127. https://doi.org/10.1016/j.indmarman.2015.04.009
- Jenkinson, A. (1994). Beyond segmentation. Journal of Targeting, Measurement and Analysis for Marketing, 3(1), 60–72.
- Jolliffe, I. (2011). Principal component analysis. Springer.
- Jung, S.-G., Salminen, J., Kwak, H., An, J., & Jansen, B. J. (2018). Automatic persona generation (APG): A rationale and demonstration. In Proceedings of the 2018 Conference on Human Information Interaction & Retrieval (pp. 321–324). New Brunswick, NJ: ACM. https://doi.org/10.1145/3176349.3176893
- Kathuria, A., Jansen, B. J., Hafernik, C., & Spink, A. (2010). Classifying the user intent of web queries using k-means clustering. Internet Research, 20(5), 563–581. https://doi.org/10.1108/10662241011084112
- Kohli, A. K., & Jaworski, B. J. (1990). Market orientation: The construct, research propositions, and managerial implications. The Journal of Marketing, 54(2), 1–18. https://doi.org/10.1177/002224299005400201
- Krashen, S. D. (1984). Immersion: Why it works and what it has taught us. Language and Society, 12(1), 61–64.
- Kuhn, T. S. (1970). The structure of scientific revolutions. Retrieved January 7, 2014, from http://www.google.com/books?hl=fi&id=XQqBP5trqCIC&oi=fnd&pg=PA176&dq=The+Structure+of+Scientific+Revolu-+tions&ots=WKqMdZPbzI&sig=EJjN_fU0xsHLcnWnGyKH5Sb2r4A
- Lambrecht, A., & Tucker, C. (2013). When does retargeting work? Information specificity in online advertising. Journal of Marketing Research, 50(5), 561–576. https://doi.org/10.1509/jmr.11.0503
- LeRouge, C., Jiao, M., Sneha, S., & Tolle, K. (2013). User profiles and personas in the design and development of consumer health technologies. International Journal of Medical Informatics, 82(11), e251–e268. https://doi.org/10.1016/j.ijmedinf.2011.03.006
- Lewandowska, A., & Jankowski, J. (2017, December). The negative impact of visual web advertising content on cognitive process. International Journal of Human-Computer Studies, 108 (C), 41–49. (Tomaszewska). https://doi.org/10.1016/j.ijhcs.2017.07.002
- Litvak, M., Otterbacher, J., Ang, C. S., & Atkins, D. (2016). Social and linguistic behavior and its correlation to trait empathy. In Proceedings of the Workshop on Computational Modeling of People’s Opinions, Personality, and Emotions in Social Media (PEOPLES) (pp. 128–137). The COLING 2016 Organizing Committee. Retrieved January 29, 2020, from https://www.aclweb.org/anthology/W16-4314
- Long, F. (2009). Real or imaginary: The effectiveness of using personas in product design. In Proceedings of the Irish Ergonomics Society Annual Conference, Irish Ergonomics Society Dublin. Dublin, Ireland.
- Madsen, S., & Nielsen, L. (2010). Exploring persona-scenarios - using storytelling to create design ideas. In Human work interaction design: Usability in social, cultural and organizational contexts (pp. 57–66). Springer. https://doi.org/10.1007/978-3-642-11762-6_5
- Marsden, N., & Haag, M. (2016). Stereotypes and politics: Reflections on personas. In Proceedings of the 2016 CHI Conference on Human Factors in Computing Systems (CHI ’16) (pp. 4017–4031). San Jose, USA: ACM. https://doi.org/10.1145/2858036.2858151
- Matthews, T., Judge, T., & Whittaker, S. (2012). How do designers and user experience professionals actually perceive and use personas?. In Proceedings of the SIGCHI Conference on Human Factors in Computing Systems (CHI ’12) (pp. 1219–1228). Austin, Texas: ACM. https://doi.org/10.1145/2207676.2208573
- Matz, S. C., Kosinski, M., Nave, G., & Stillwell, D. J. (2017). Psychological targeting as an effective approach to digital mass persuasion. Proceedings of the National Academy of Sciences, 114(48), 12714–12719. https://doi.org/10.1073/pnas.1710966114
- Miaskiewicz, T., & Kozar, K. A. (2011). Personas and user-centered design: How can personas benefit product design processes? Design Studies, 32(5), 417–430. https://doi.org/10.1016/j.destud.2011.03.003
- Miaskiewicz, T., Sumner, T., & Kozar, K. A. (2008). A latent semantic analysis methodology for the identification and creation of personas. In Proceedings of the SIGCHI Conference on Human Factors in Computing Systems (pp. 1501–1510). Florence, Italy: ACM. http://dl.acm.org/citation.cfm?id=1357290
- Minichiello, A., Hood, J. R., & Harkness, D. S. (2018). Bringing user experience design to bear on STEM education: A narrative literature review. Journal for STEM Education Research, 1(1–2), 7–33. https://doi.org/10.1007/s41979-018-0005-3
- Narver, J. C., & Slater, S. F. (1990). The effect of a market orientation on business profitability. The Journal of Marketing, 54(4), 20–35. https://doi.org/10.1177/002224299005400403
- Nielsen, L. (2019). Personas - user focused design (2nd ed.). Springer.
- Nielsen, L., Hansen, K. S., Stage, J., & Billestrup, J. (2015, January). A template for design personas: Analysis of 47 persona descriptions from danish industries and organizations. International Journal of Sociotechnology and Knowledge Development, 7(1), 45–61. https://doi.org/10.4018/ijskd.2015010104
- Onel, N., Mukherjee, A., Kreidler, N. B., Díaz, E. M., Furchheim, P., Gupta, S., Keech, J., Murdock, M. R., & Wang, Q. (2018). Tell me your story and I will tell you who you are: Persona perspective in sustainable consumption. Psychology & Marketing, 35(10), 752–765. https://doi.org/10.1002/mar.21132
- Park, T., & Salvendy, G. (2012, September). Emotional factors in advertising via mobile phones. International Journal of Human–Computer Interaction, 28(9), 597–612. https://doi.org/10.1080/10447318.2011.641899
- Pedrick, J. H., & Zufryden, F. S. (1991). Evaluating the impact of advertising media plans: A model of consumer purchase dynamics using single-source data. Marketing Science, 10(2), 111–130. https://doi.org/10.1287/mksc.10.2.111
- Polkinghorne, D. E. (1988). Narrative knowing and the human sciences. Suny Press. https://books.google.com/books?hl=en&id=kWpGAAAAQBAJ&oi=fnd&pg=PR7&dq=narratives+human+tendency&ots=Pw95tCkwCY&sig=O-N6vR_BnBJXWTmsYC-paAHJs5s
- Pruitt, J., & Adlin, T. (2006). The persona lifecycle: Keeping people in mind throughout product design (1 ed.). Morgan Kaufmann.
- Pruitt, J., & Grudin, J. (2003). Personas: Practice and theory. In Proceedings of the 2003 Conference on Designing for User Experiences (DUX ’03) (pp. 1–15). San Francisco, California: ACM. https://doi.org/10.1145/997078.997089
- Resnick, M., & Albert, W. (2014, March). The impact of advertising location and user task on the emergence of banner ad blindness: An eye-tracking study. International Journal of Human–Computer Interaction, 30(3), 206–219. https://doi.org/10.1080/10447318.2013.847762
- Rönkkö, K., Hellman, M., Kilander, B., & Dittrich, Y. (2004). Personas is not applicable: local remedies interpreted in a wider context. In Proceedings of the Eighth Conference on Participatory Design: Artful Integration: Interweaving Media, Materials and Practices - Volume 1 (PDC 04) (pp. 112–120). Toronto, Ontario: ACM. https://doi.org/10.1145/1011870.1011884
- Salminen, J., Gach, N., & Kaartemo, V. (2018). Platform as a social contract: An analytical framework for studying social dynamics in online platforms. In A. Smedlund (Ed.), Collaborative value co-creation in the platform economy (pp. 41–64). Springer.
- Salminen, J., Jansen, B. J., Kwak, H., & Jung, S.-G. (2018, November). Are personas done? Evaluating their usefulness in the age of digital analytics. Persona Studies, 4(2), 47–65. https://doi.org/10.21153/psj2018vol4no2art737
- Salminen, J., Jansen, B. J., An, J., Kwak, H., & Jung, S.-G. (2019). Automatic persona generation for online content creators: Conceptual rationale and a research Agenda. In L. Nielsen, Ed. Personas - user focused design. 2nd (pp. 135–160). Springer London. https://doi.org/10.1007/978-1-4471-7427-1_8
- Salminen, J., Nielsen, L., Jung, S.-G., An, J., Kwak, H., & Jansen, B. J. (2018). “Is more better?”: Impact of multiple photos on perception of persona profiles. In Proceedings of ACM CHI Conference on Human Factors in Computing Systems (CHI2018). Montréal, Canada: ACM. https://doi.org/10.1145/3173574.3173891
- Salminen, J., Seitz, S., Jansen, B. J., & Salenius, T. (2017). Gender effect on E-commerce sales of experience gifts: Preliminary empirical findings. In Proceedings of International Conference on Electronic Business (ICEB 2017). Dubai.
- Salminen, J., Şengün, S., Kwak, H., Jansen, B. J., An, J., Jung, S.-G., Vieweg, S., & Harrell, F. (2018, June). From 2,772 segments to five personas: Summarizing a diverse online audience by generating culturally adapted personas. First Monday, 23(6). https://doi.org/10.5210/fm.v23i6.8415
- Sourina, O., & Liu, Y. (2014). EEG-enabled affective human-computer interfaces. In Universal access in human-computer interaction. design and development methods for universal access ( Lecture Notes in Computer Science, pp. 536–547). Springer International Publishing. https://doi.org/10.1007/978-3-319-07437-5_51.
- Sproull, L., Subramani, M., Kiesler, S., Walker, J. H., & Waters, K. (1996, June). When the Interface Is a Face. Human–Computer Interaction, 11(2), 97–124. https://doi.org/10.1207/s15327051hci1102_1
- Stauss, B., Heinonen, K., Strandvik, T., Mickelsson, K.-J., Edvardsson, B., Sundström, E., & Andersson, P. (2010). A customer-dominant logic of service. Journal of Service Management, 21(4), 531–548. https://doi.org/10.1108/09564231011066088
- Steenburgh, T. J., Avery, J., & Dahod, N. A. (2009, May). HubSpot: Inbound marketing and web 2.0. Retrieved June 21, 2017, from http://www.hbs.edu/faculty/Pages/item.aspx?num=37327
- Stern, B. B. (1993). The firm, the author, and the persona: A literary model of the source of advertising. Journal of Current Issues & Research in Advertising, 15(2), 15–24. https://doi.org/10.1080/10641734.1993.10505001
- Stevenson, P. D., & Mattson, C. A. (2019, July). The personification of big data. Proceedings of the Design Society: International Conference on Engineering Design, 1(1), 4019–4028. https://doi.org/10.1017/dsi.2019.409
- Tausczik, Y. R., & Pennebaker, J. W. (2010). The psychological meaning of words: LIWC and computerized text analysis methods. Journal of Language and Social Psychology, 29(1), 24–54. https://doi.org/10.1177/0261927X09351676
- Tenbrink, T. (2014, July). Cognitive discourse analysis: Accessing cognitive representations and processes through language data. Language and Cognition, 7(1), 98–137. https://doi.org/10.1017/langcog.2014.19
- Thoma, V., & Williams, B. (2009). Developing and validating personas in e-commerce: A heuristic approach. In Human-Computer Interaction – INTERACT 2009 ( Lecture Notes in Computer Science, pp. 524–527). Springer Berlin Heidelberg.
- Turner, P., & Turner, S. (2011). Is stereotyping inevitable when designing with personas? Design Studies, 32(1), 30–44. https://doi.org/10.1016/j.destud.2010.06.002
- Vosbergen, S., Mulder-Wiggers, J. M. R., Lacroix, J. P., Kemps, H. M. C., Kraaijenhagen, R. A., Jaspers, M. W. M., & Peek, N. (2015, February). Using personas to tailor educational messages to the preferences of coronary heart disease patients. Journal of Biomedical Informatics, 53(February), 100–112. https://doi.org/10.1016/j.jbi.2014.09.004
- Wright, P., & John, M. (2008). Empathy and experience in HCI. In Proceedings of the SIGCHI Conference on Human Factors in Computing Systems (CHI ’08) (pp. 637–646). Florence, Italy: ACM. https://doi.org/10.1145/1357054.1357156
- Yang, Y., Yang, Y. C., Jansen, B. J., & Lalmas, M. (2017, May). Computational advertising: A paradigm shift for advertising and marketing? IEEE Intelligent Systems, 32(3), 3–6. https://doi.org/10.1109/MIS.2017.58
- Zhang, P., & Dillon, A. (2003). HCI and MIS: Shared concerns. International Journal of Human-Computer Studies, 59(4), 397–402. https://doi.org/10.1016/S1071-5819(03)00109-5