
ABSTRACT
As flight deck touchscreen implementation continues to rise, more research is required to understand how task performance is impacted by turbulence. Previous work found that for basic dragging gestures on a touchscreen, performance and usability declined, and workload increased, with rising levels of turbulence. The current study extended on this work by examining common flight deck tasks using various gestures and input methods. Twenty-six participants completed two tasks (panning and number entry), in different formats, at four levels of turbulent vibration (control, light chop, light turbulence, and moderate turbulence). Performance was assessed objectively (time to completion and additional interactions with the screen), and subjectively (workload, usability, and comfort). Across the tasks, increased turbulence negatively impacted performance, overall workload, and usability. Design recommendations are made for how to best implement pan and number entry tasks on a touchscreen in the flight deck.
1. Introduction
Over the past three decades, there has been a major shift in flight deck design. With multifunctional electronic displays replacing older electro-mechanical systems as the standard flight deck interface for large jets in commercial aviation (Harris, Citation2011). Together with advances in system automation, multifunctional electronic displays, have made it possible to integrate and de-clutter the flight deck displays. Even with these modifications, flight deck “real estate” is still at a premium, and the cost of change to a mechanical interface is high. A popular solution is to incorporate touchscreens, an enhancement that could potentially offer an unlimited array of control interfaces without the addition of further mechanical interfaces (Coutts et al., Citation2019; Pope, Citation2009; Rockwell Collins, Citation2016).
Historically touchscreens were viewed as inferior to traditional mechanical interface designs. While there has been some evidence to suggest this; speed accuracy trade-off (Wobbrock et al., Citation2008), increased error rates (MacKenzie et al., Citation1991), and target size impacts accuracy more on a touchscreen than a mechanical button, with a smaller mechanical button more accurately selected than the same sized target on a touchscreen (Wobbrock et al., Citation2008). It was also highlighted that without tactile response from the touchscreen to indicate a selection has been made, touchscreens would be unsuitable for a flight deck (Matthes, 1988, as cited in Dodd et al., Citation2014). This notion was compounded with perceived barriers in the responsiveness and reliability of the computer processing power and the lower overall usage of touchscreens, which has prevented wide-scale introduction of the technology in the past. From the beginning of the smart phone era, touch technology advanced dramatically, not only due to market demand for such devices, but as touchscreens became ubiquitous in our everyday lives (Colle & Hiszem, Citation2004; Dodd et al., Citation2014; Page, Citation2014). They have now become accepted as the mainstream interface for electronic devices across a range of products from home appliances to car infotainment systems (Harvey et al., Citation2011).
As they have come to the forefront of usage in other aspects of aviation outside of the cockpit, research over the last decade has again turned to how touchscreens can enhance performance; although they are not without limitation and supporting evidence has been largely mixed. It has been demonstrated that fixed touchscreens (as would be integrated into a flight deck) are associated with increased physical demand and body discomfort (Harvey et al., Citation2011; Stanton et al., Citation2013), while still producing higher error rates (Avsar et al., Citation2015; Cockburn et al., Citation2017). Contrary to this, Rogers et al. (Citation2005) suggested that a benefit of touchscreens is they increase functionality and decrease the level of interaction required for users to complete a task. This has the added benefit of decreasing users’ working memory demands, workload, and head down scan time; and by so doing, increasing safety and potentially reducing overall errors (Rogers et al., Citation2005).
Within commercial aviation, the use of a touchscreen would allow information on the flight deck to be presented in clearer, less cluttered menus, over a larger customizable interface. Whilst this could see a significant initial outlay financially, a touchscreen would be more cost-effective over time (Bhalla & Bhalla, Citation2010). Over the aircraft’s lifetime, software on the flight deck could be uploaded, updating the visual display without requiring additional physical changes. Furthermore, a touchscreen could allow for tailoring of the information visible to the pilot throughout the flight. Rather than having all information visible at all times, and the potential implications of such clutter on visual search (e.g., Alexander et al., Citation2012), the use of an open flight deck could see the display present only the required information for that stage of flight (e.g., information for engine warm-up in taxi, fuel usage in flight, managing possible engine failure events; Harris, Citation2011).
As the plans for an integrated flight deck continue to advance, further research is required to optimize performance and minimize risk and errors. Some important research has addressed the optimum physical aspects of the touchscreen design to reduce these errors, such as button size (Bender, Citation1999; Dodd et al., Citation2014; Hoffman & Sheikh, Citation1994), screen selection (Dodd et al., Citation2014; Happich, Citation2015), and auditory (Bender, Citation1999) or haptic feedback (Graham-Rowe, Citation2011); with some potential improvements identified. However, most of this research supporting the use of touchscreens in the aviation domain, has been conducted in static conditions despite the reported impacts of turbulence on performance and usability (Coutts et al., Citation2019). Turbulence is characterized by inadvertent movement in all axis of motion and can therefore impact an individual’s ability to move freely. Orphanides and Nam (Citation2017) identified that touchscreen technology utilization is heavily dependent on the environmental conditions in which it is used. As turbulence on flights is predicted to become increasingly prevalent with future predicted climate change (Williams, Citation2017), it is an important factor to consider in the development of future flight deck technology.
1.1. Touchscreens in turbulent environments
To address this gap in the literature, Coutts et al. (Citation2019) conducted a study to investigate the effect of turbulence on touchscreen usage. In their study, they investigated the effect of target “button” size on multidirectional tapping, as well as drag, slide, and swipe gestures in a pan task. Both were then completed across four levels of turbulence (control, light chop, light turbulence, and moderate turbulence) and three screen positions reminiscent of current flight deck architecture (center, right-side, and overhead). Their study demonstrated the effects of turbulence on task performance, indicating a significant decrease in accuracy, and increases in time and erroneous presses. Along with a decline in objective performance, there was a trend toward increased workload and decreased usability with increasing turbulence, although at a task level these differences were not significant. Results indicated that performance in a drag task (i.e., holding the finger down on the touchscreen and pulling an item along to a new position) was more difficult under turbulent conditions, and it was thought to be due to difficulty maintaining contact with the screen (Coutts et al., Citation2019). Drag tasks also took longer to complete than other tasks, particularly under turbulence, and therefore single tap-style tasks were recommended to be used where possible.
In their study, Coutts et al. (Citation2019) measured all gestures (tap, drag, slide, and swipe) using different tasks with their own “goals” and comparisons could not be made on performance between the tasks. Future research would need to address this limitation by directly comparing the single tap and drag gesture with the same task end goal (e.g., moving an object around the screen). Tapping is thought to have the lowest rate of error (Coutts et al., Citation2019), however there is still a risk that this error would increase when turbulence is encountered. Of specific concern are the inadvertent or mistaken touches, which may impact safety. Therefore, an additional gesture, “tap-and-hold” is proposed.
1.2. Task integration on the flight deck
While some research has looked at the effect of turbulence on basic tasks (e.g., Coutts et al., Citation2019; Dodd et al., Citation2014), there has not been enough investigation of task-specific performance using a touchscreen. A potential integration of a pan task on the flight deck could be in the format of a graphical interface, like a car’s navigational display, where a user may wish to move the map to view surrounding features. Alternatively, like arranging “apps” on a display, pilots may wish to bring to the forefront a specific menu or “task” list; doing so by a pan gesture. This represents a potential enhancement of flight deck tasks through touchscreen integration.
As efforts are being made, in commercial aviation, to integrate all flight deck functions into an open touchscreen-based graphical display; the traditional, mechanical, units of input will need to be integrated into touchscreens. Another, so far neglected, area of research is the testing of number entry in a touchscreen format, under control and turbulent conditions, in commercial aviation. Number entry forms the basis of many in-flight activities, such as selecting the heading, altitude, or airspeed in the Flight Director, and modifications to these may be required if unexpected or continuous turbulence is encountered. Currently this is achieved through a rotational mechanical dial, however integration into a touchscreen display is proposed. Therefore, the current study will assess common touchscreen gestures (e.g., tap, tap-and-hold, swipe, drag) with the goal of inputting a three-digit number. As this task is currently completed by pilots as part of their regular flight operations; the touchscreen gestures will be compared to the traditional configuration of a mechanical dial, to determine if the touchscreen improves performance.
1.3. Aim and hypotheses
Extending on the initial work of Coutts et al. (Citation2019), this study intends to assess the efficacy of different touchscreen gestures while performing the same task (panning or number entry). Successful touchscreen integration into the flight deck should ensure tasks could be completed as quickly and accurately as possible, and without increasing workload or impacting comfort. It is hypothesized that the increase in turbulence will result in longer task completion times and additional touchscreen interactions. It is also predicted that turbulence will negatively impact workload and usability of the tasks. From the study, design recommendations will be made for the future integration of such tasks into the flight deck.
2. Method
2.1. Participants
Participants were 26 members of the general community (12 females, 14 males; M = 30.0 yrs, SD = 11.2) recruited through the University of Southampton and GE Aviation. As with the previous research (Coutts et al., Citation2019), it was deemed unnecessary to use pilots, as the tasks under examination did not require any prior flying experience or familiarization with a flight deck, although one participant was previously a helicopter pilot. Due to the positioning of the displays, participants were required to be right-handed, between 160 and 190 cm, not wear bifocal lenses, and have no long-term chronic pain issues. Participants had an average right arm length of 77.1 cm (SD = 6.8), and height of 171.6 cm (SD = 7.9). Participants received £10 remuneration for their time and the study was approved by the University of Southampton ethics research committee (ERGO reference number 52773).
2.2. Design
While “task” is a within-subjects variable, no comparisons were made between the two tasks, pan and number entry; and they were analyzed independently. The level of vibration of the motion platform was manipulated across four levels: no movement (control); light chop; light turbulence; and moderate turbulence. For panning, three tasks were completed in two separate screen positions (side and center), thus incorporating a 2(screen) x 3(task) x 4(turbulence) within-subjects design. For the number entry, there were eight tasks, however only one screen position making a 4(turbulence) x 8(task) within-subjects design. Performance was measured in the time taken to complete the task and performance variability measured as a number of additional screen interactions above the minimum required to complete the task. Workload was measured by the NASA Task Load Index (NASA-TLX; Hart & Staveland, Citation1988), with usability measured by the System Usability Scale (SUS; Brooke, Citation1996). Finally, comfort measured using a modified Cornell Musculoskeletal and Hand Discomfort Questionnaire (Hedge et al., Citation1999).
2.3. Materials
2.3.1. Simulator
All testing was conducted on the University of Southampton Institute of Sound and Vibration Research’s (ISVR’s) 6-axis motion simulation platform. This is a 3 m × 2 m platform which can move independently along three translation axes (fore-and-aft, lateral, vertical) and three rotational axes (roll, pitch, yaw). It was maneuvered across four levels of simulated turbulence:
control: no movement;
light chop: 2–6 Hz filtered random vertical motion r.m.s. weighted magnitude 0.37 m.s−2;
light turbulence: 1–6 Hz filtered random vertical (magnitude 0.25 m.s−2), roll (magnitude 0.03 m.s−2) and pitch (magnitude 0.02 m.s−2) motion, r.m.s. weighted magnitude 0.26 m.s−2, pitch center 1.5 m behind seat; and
moderate turbulence: 1–6 Hz filtered random vertical (magnitude 0.51 m.s−2), roll (magnitude 0.06 m.s−2) and pitch (magnitude 0.04 m.s−2) motion, r.m.s. weighted magnitude 0.52 m.s−2, pitch center 1.5 m behind seat.
As outlined by British Standard 6841 (British Standards Institution [BSI], Citation1987), all vibration levels were weighted to provide an overall directional measure of vibration exposure. The movements of the motion platform were developed with the assistance of a commercial airline pilot and predetermined turbulence vibration patterns. Two additional turbulence profiles “Severe” and “Extreme” (Federal Aviation Administration [FAA], Citation2020), were not used in this study for two reasons. First, they were identified as posing potential physical risk to participants, and second, it was suggested that at those levels of turbulence, pilots would be focused on monitoring and stabilizing the aircraft rather than making any touchscreen interactions.
2.3.2. Flight deck rig
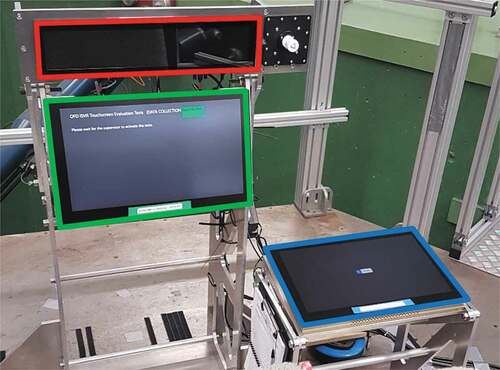
A mock flight deck comprised a Boeing 737 aircraft seat, with 5-point harness, and three screens, was attached to the platform (as shown in ). Two 17.3” 16:9 LCD screens with PCAP touch were used for the panning task. One was directly in front of the participant, (center; position of the Primary Flight Display), with the second positioned to the right, parallel to the platform floor with a 15° rotation off horizontal (position of the Flight Director). The third, a 16.3” 23:4 LCD glareshield screen also with PCAP touch was positioned directly above the center screen and used exclusively for the number entry component. The layout of the screens is shown in , replicating a commercial flight deck. The side screen position represents the option of an additional touchscreen where the throttle and flight management system would normally be located.
Figure 1. Physical layout of mock flight deck on simulator platform.
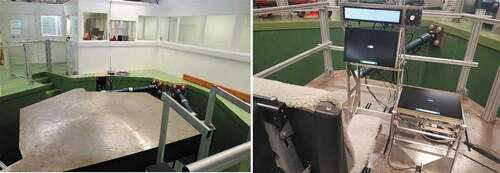
Figure 2. Layout of screens for the various tasks in mock flight deck.
2.3.3. Pan task
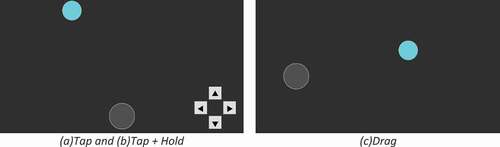
The goal of the pan task was to move a 2.5 cm diameter solid blue circle into a larger 3.5 cm gray circle (“gate”). This was completed seven times for each of the three different task variations, making a total of 21 trials per participant. The three task variations (shown in ) were: a. tap directional arrows; b. tap-and-hold directional arrows; and c. drag the circle itself into the target gate. The main difference between “tap” and “tap-and-hold” was that for tap only, a single press would move the circle 0.9 cm, whereas for tap-and-hold, if the participant were to press and hold the arrow the circle would continue to move at a constant rate (19 cm/second) until the arrow was released. These tasks were selected as they represent different ways a pilot may be required to move icons around a map.
Figure 3. Visual displays for pan tasks with required screen interaction skill.
2.3.4. Number entry task
For the number entry task, participants were required to match a three-digit target number using different inputs for each of the eight task variations (depicted in ). There were three presentations of each variation, making for 24 trials per participant. The tasks were:
mechanical dial, located adjacent to the screen, scrolls sequentially through numbers;
number entry pad, tap individually each digit on a standard ascending 1–9, 0 keypad;
arrows astride, tap three pairs of directional arrows, above and below the numbers, digits changed individually;
arrows below, tap three pairs of directional arrows, below the numbers, digits changed individually;
arrows, tap-and-hold single set of directional arrows, scroll through numbers sequentially;
vertical rectangular bars, swipe up and down in bars located below the numbers, digits changed individually;
vertical sliders, drag circles located on each step of a vertical ladder up and down, digits changed individually; and
clock-face, tap and drag a circle around the clock face design to change each digit individually.
Figure 4. Visual displays for number entry tasks with required screen interaction skill.
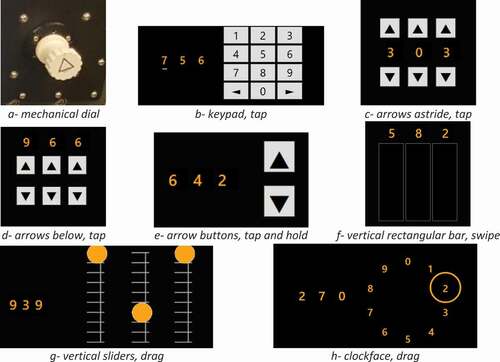
These tasks were selected as they represent different ways of interreacting with a touchscreen and potential ways to modify number entry; a task regularly performed in altering radio frequencies and entering a selected heading or altitude. The mechanical dial was included as a baseline, representing the current method for modifying numbers on the flight deck.
2.3.5. Questionnaires
After completing all trials at each level of turbulence, participants subjectively assessed their trial experience for each individual task (e.g., tap, tap-and-hold, drag, buttons above, mechanical dial etc.). The NASA TLX (Hart & Staveland, Citation1988; National Aeronautics and Space Administration [NASA], Citation1986) is widely used to assess workload on a scale from 0 to 100 across six domains: mental demand, physical demand, temporal demand, performance, frustration, and effort. The SUS (Brooke, Citation1996) is comprised of 10 questions, used to calculate the overall usability of each task interface design.
For the pan task, where screen position varied, participants also completed a modified version of the Cornell University Questionnaire for Ergonomic Comfort (Hedge et al., Citation1999); to assess any specific discomfort or pain associated with the change in position of the screen. While the full questionnaire refers to 15 body areas, for simplicity and similar research identifying regions as having no discomfort (Coutts et al., Citation2019), it was condensed to six (neck, shoulder, upper back, lower back, arm, and wrist/hand). Items assess the frequency of pain or discomfort while using the screen, then the level and extent to which it interfered with participants’ ability to complete the task. Frequency scores for each body region are weighted and multiplied by discomfort and interference scores to produce an overall measure of the impact on comfort.
2.4. Procedure
Upon arrival participants completed a brief demographic questionnaire and were given a verbal introduction to the overall research program (Open Flight Deck) and the specific tasks they would complete. They were instructed to complete the tasks as quickly and accurately as possible with only their right hand. Participants were monitored to ensure that they did not use their left hand at all. That is, no bracing or supporting was allowed by their left hand, as it would have been be difficult in the mock flight deck to replicate the “regular” bracing behaviors pilots adopt when they encounter turbulence. Similarly, while flight decks may look at face value to be similar, flight decks from alternative manufacturers will have different options available for bracing. Furthermore, as the intention was to measure performance at its most difficult, bracing was prevented.
In a single 2-hour session, participants completed 12 conditions (see Supplementary Material for a short video). These were grouped by task type such that the four number entry tasks were completed together, and eight panning tasks were completed together. Order was counterbalanced between participants. After completing a condition (e.g., number entry-control), participants completed the questionnaire pack evaluating each task for comfort (pan only), workload, and usability. After completing all tasks, participants were thanked and received remuneration for their time.
2.5. Data analysis and cleaning
2.5.1. Performance data
Objective performance data were the time (in seconds), from the first interaction with the touchscreen (or turn of the mechanical dial) until completion of the task goal. The pan task was deemed complete when the circle was within the gate and for number task, the correct three-digit number displayed. A 1 second threshold ensured participants were consciously completing the task, rather than scrolling or dragging past it. The second measure of performance was performance variability or the number of additional interactions above the minimum required to complete the task. This allowed for comparisons between the tasks, as the number of interactions for success differed for each trial. By determining what the minimum number was for each trial and calculating additional interactions, we were able to draw conclusions on possible errors. Although it was not clear if these additional interactions were because of an error (e.g., selecting the incorrect number on a keypad) or a touch on screen that was registered as a press although not on target. For the pan task, 2 (screen) x 3 (task) x 4 (turbulence) repeated measures ANOVAs were run; while for the number entry, 8 (task) x 4 (turbulence) repeated measures ANOVAs were run.
2.5.2. Workload, usability, and comfort
For the subjective performance measures, instances of missing or incorrect data were low (workload: 0.2%; usability: 6.3%; comfort: 2.9%). In most cases, participants missed one scale, and remaining responses were still considered. Entire questionnaires were missed on two occasions (one usability and one comfort), and responses were missing for a condition. Two further instances of participants not correctly following SUS instructions were also excluded.
Each questionnaire has a specific scoring protocol, producing mean scores for analysis across participants. As NASA-TLX and SUS scoring produced “approximate continuous” measures (Norman, Citation2010; Sullivan & Artino, Citation2013), the same repeated measures ANOVAs were used. For comfort analyses, where only those that indicated they experienced pain or discomfort were included, sample size varied (not all participants reported pain, and not all reported pain in the same regions). Being non-normally distributed, a multiple regression with gamma logistic distribution adjustment was used.
All statistical analyses were performed using IBM SPSS v26 with significance indicated when p < .05. Where sphericity was violated, Greenhouse-Geisser adjustments were applied.
3. Results
3.1. Pan task performance
3.1.1. Time to completion
As shown in , there is a trend toward an increase in time to completion as turbulence increases. Results revealed a significant main effect of turbulence on time, F(1.7, 43.3) = 44.12, p < .001, ηp2 = .64; with all turbulence levels significantly higher than control (all p < .001). Moderate turbulence was significantly longer than all other conditions (all p < .001); however, the difference between light chop and light turbulence was not significant (p > .999).
Figure 5. Time to completion for pan tasks across turbulence and screen conditions (error bars represent ±1 SEM).
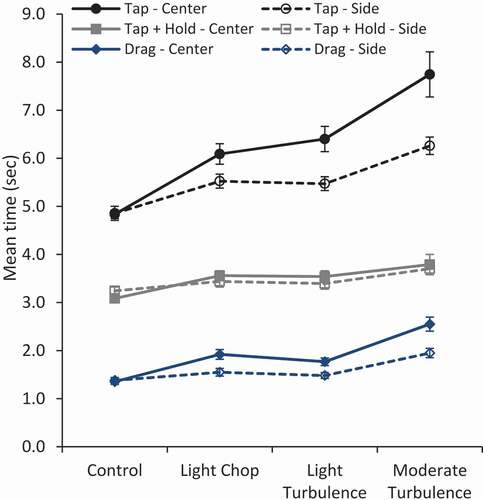
Screen position produced a significant main effect, F(1, 25) = 31.80, p < .001, ηp2 = .56, with tasks taking significantly longer to complete in the center than the side position. There was also a significant main effect of task, F(1.4, 33.9) = 917.74, p < .001, ηp2 = .97. The drag task was completed significantly faster than tap-and-hold and tap only (both p < .001); with the tap-and-hold significantly faster than tap only (p < .001). Finally, all interactions were also significant, indicating that there is a complex relationship between screen position, task, and turbulence. This largely appears to be driven by the non-significant difference between light chop and light turbulence, and the increased time for the tapping task in the center position. Measures such as workload and usability can provide additional insight.
3.1.2. Performance variability
As visible in , there was no significant main effect of turbulence on the number of additional interactions F(3, 75) = 1.76, p = .162. The effects of screen and task however are still persistent, with both producing significant main effects (screen position: F(1, 25) = 5.73, p = .025, ηp2 = .19; task: F(1.5, 37.8) = 128.13, p < .001, ηp2 = .84).
Figure 6. Additional interactions for pan tasks across turbulence and screen conditions (error bars represent ±1 SEM).
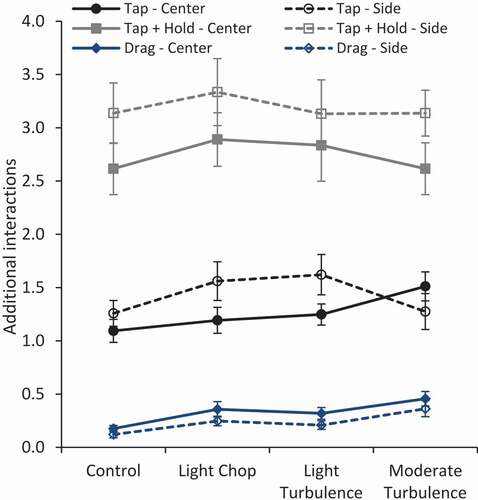
Interestingly, the number of additional interactions required to complete the task was significantly higher for the side screen position than the center. Furthermore, the effect of task differed to that of the time to completion. Tap-and-hold required significantly more additional interactions than both tap and drag (both p < .001). Drag also required significantly less additional interactions than tap (p < .001), with most participants able to complete the drag task in one movement, regardless of turbulence levels. Screen x task was the only significant interaction, F(1.4, 35.4) = 7.10, p = .006, ηp2 = .22. This again appears to be largely driven by performance on the tap task when in the center position at high turbulence. This is confounded by a trend for improved performance in higher levels of turbulence in the tap-side condition and both tap-and-hold tasks (side and center).
3.1.3. Workload
Overall workload was computed from the sub-scores of the NASA-TLX for each pan task, across all levels of turbulence, as seen in (see Supplementary Material for individual subscales). For overall workload, turbulence had a significant main effect, F(2.0, 50.9) = 22.44, p < .001, ηp2 = .47, and the effect of turbulence was not linear. While control was significantly lower in workload than light chop (p < .001), light turbulence (p = .002), and moderate turbulence (p < .001); and a significant difference was found between light and moderate turbulence (p = .004), no other differences were significant. Interestingly, the difference between light chop and moderate turbulence was not significant (p = .059), and a trend toward more workload in light chop than light turbulence, although not significant (p = .211).
Figure 7. Overall workload for pan tasks by turbulence level and screen condition (error bars represent ±1 SEM).
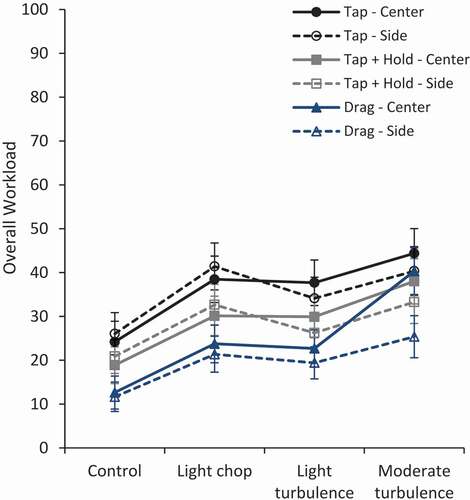
There was also a main effect of task, F(1.6, 39.1) = 25.84, p < .001, ηp2 = .51, with tapping rated as requiring significantly higher workload than tap-and-hold, and drag (all p < .001) The difference in workload between tap-and-hold and drag was also significant (p = .006). Screen position had a significant effect on workload, F(1, 25) = 5.16, p = .032, ηp2 = .17, with center position significantly more demanding than side.
All interactions were also significant, which appear to be driven by two key events. First, users found the side position requiring more workload for tap and tap-and-hold than the center at lower levels of turbulence (control and light chop), with the opposite found in low and moderate turbulence. Second, and perhaps more importantly, there is a significant increase in the workload required in executing the drag gesture in the center at moderate turbulence when compared to the lower levels (all p < .001).
3.1.4. Usability
Overall usability scores were computed for each pan task (). At a global level, there was no significant effect of screen location on usability, F(1, 24) = 2.42, p = .133. There was a significant main effect of turbulence, F(1.7, 40.9) = 12.80, p < .001, ηp2 = .35; moderate turbulence was significantly lower than all other levels of turbulence (control, p = .002; light chop, p = .001; light turbulence, p = .029), and a significant difference was found between control and light turbulence (p = .014), although no other differences were significant.
Figure 8. Overall usability for pan tasks across turbulence and screen conditions (error bars represent ±1 SEM).
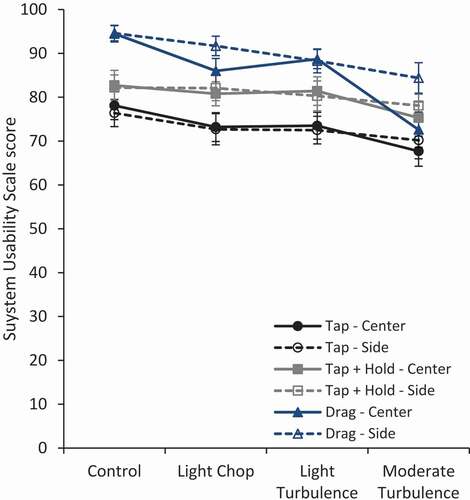
Task had a significant effect on usability, F(2, 48) = 16.55, p < .001, ηp2 = .41, with tap scoring significantly lower than tap-and-hold (p = .002), and drag (p < .001). Although the difference between tap-and-hold and drag was not significant (p = .060). There is a significant interaction of screen and task, F(1.4, 33.7) = 7.02, p = .007, ηp2 = .23, which appears to be driven by the perceived usability of drag in the center screen position; demonstrating a large usability decline across turbulence.
3.1.5. Comfort
Analyses for comfort were conducted on the independent regions of interest (i.e., neck, shoulder, upper back, lower back, arm, and wrist/hand). A weighted score combining region frequency, discomfort, and interference was calculated, with each region scored between 0 and 90 (Hedge et al., Citation1999). This more accurately represents the impact of discomfort on performance and highlights body regions with the most serious problems. Most participants reported no discomfort (see Supplementary Material for the complete breakdown by region, turbulence, and screen position). For those that did (range: 5–15 participants), there was minimal impact on their ability to complete the tasks, with weighted ratings displayed in .
Figure 9. Weighted levels of pain/discomfort across body regions for pan tasks (error bars represent ±1 SEM).
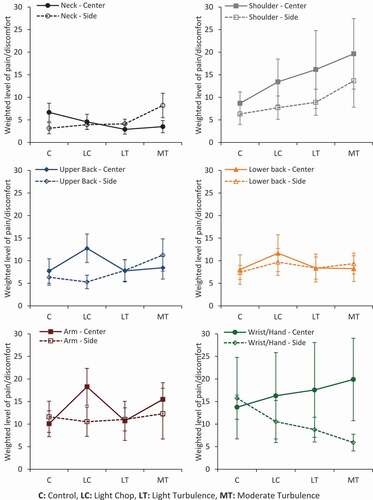
A multiple regression with gamma logistic distribution found a significant main effect of body region, χ2(5) = 50.66, p < .001, with full results visible in . When compared to the wrist/hand there was significantly more pain and/or discomfort experienced in the neck, upper back, and lower back. However, there was no significant difference in the level of pain and/or discomfort experienced between the wrist/hand and shoulder or arm. Following this, each body region was considered independently of one another.
Table 1. Results of multiple regression analyses for comfort
Subsequent models assessed the effect of turbulence and screen position on comfort scores (see ). Across all body regions, the level of turbulence had no significant effect. For the wrist/hand there was a significant main effect of screen position, with significantly more discomfort experienced in the center screen position than the side. For all other body regions, there was no significant effect of screen position.
3.2. Number entry task performance
3.2.1. Time to completion
For the number entry tasks, as depicted in , there is a trend toward an increase in time to completion as turbulence increased. This is supported by the results of the ANOVA, which revealed a significant main effect of turbulence on time, F(1.3, 31.6) = 19.61, p < .001, ηp2 = .44. There was also a significant main effect of task, F(2.0, 49.6) = 32.34, p < .001, ηp2 = .56. However, as suggested by the visual inspection of the data, the interaction between turbulence and task was not significant, F(2.4, 60.1) = 1.78, p = .170.
Figure 10. Time to completion for number entry tasks across turbulence conditions (error bars represent ±1 SEM).
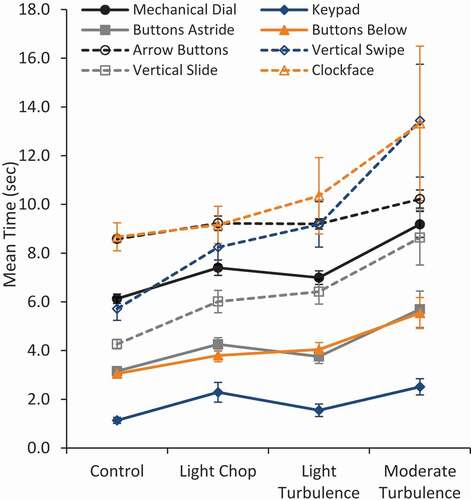
A series of post-hoc comparisons were then performed. For the individual number entry tasks, the mechanical dial was used as a baseline, and the keypad, buttons astride, and buttons below were completed significantly faster (all p < .001). Again, compared to the mechanical dial, the arrow buttons on the touchscreen took significantly longer to complete (p < .001), though, owing to large variability, no significant differences were present for time for vertical swipe (p > .999), vertical slide (p = .567), and clockface (p = .711).
When considering the impact of turbulence on the task completion, when compared to the control, all levels of turbulence had a significant effect on time (light chop: p < .001; light turbulence: p = .003; moderate turbulence: p < .001). Tasks were completed faster under light chop and light turbulence in comparison to moderate turbulence (p = .002, p = .001, respectively), however no significant difference between the mean time for light chop and light turbulence (p > .999).
3.2.2. Performance variability
For the analysis of interactions, the mechanical dial was excluded, as it did not involve interaction with a touchscreen (and thus not possible to determine the number of additional interactions), thus we performed, a 7 (task) x 4 (turbulence) ANOVA. As visible in , there was a significant main effect of task F(2.9, 73.2) = 34.62, p = .001, ηp2 = .24. When compared to the keypad, clockface had no significant difference in the number of interactions (p > .999). Though all other tasks reported significantly more interactions (all p .001).
Figure 11. Additional interactions for number entry tasks across turbulence condition (error bars represent ±1 SEM).
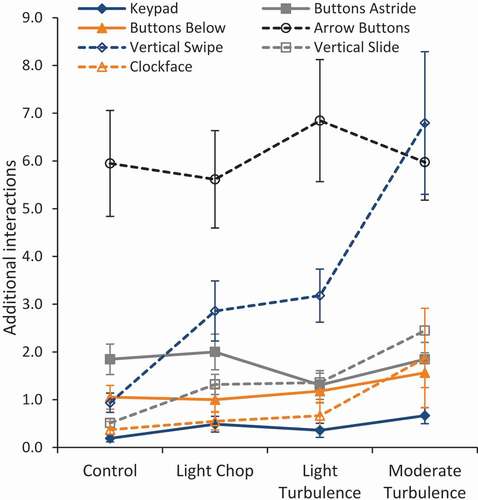
There was a significant main effect of turbulence on the number of additional interactions, F(2.0, 49.7) = 7.88, p < .001, ηp2 = .58, which was largely influenced by moderate turbulence, as all other levels had significantly less additional interactions (control: p = .010; light chop: p = .023; light turbulence: p = .007). Differences between control and light chop, control and light turbulence, and light chop and light turbulence were all not significant (p = .514, p = .549, p > .999, respectively).
3.2.3. Workload
As with the pan tasks, overall workload was calculated from NASA-TLX sub-scores for each task at across the four levels of turbulence, which can be seen in (see Supplementary Material for individual subscales). Overall, turbulence had a significant main effect, F(2.2, 6.0) = 14.17, p < .001, ηp2 = .36, although as with the pan task, this was not a linear effect. Control was significantly lower in workload than light chop (p = .008) and moderate turbulence (p < .001), but not than light turbulence (p = .067). A significant difference was found between light and moderate turbulence (p = .004), however, the difference between light chop and moderate turbulence was not significant (p = .072), and neither was light chop and light turbulence (p = .700).
Figure 12. Overall workload for number entry tasks by turbulence level (error bars represent ±1 SEM).
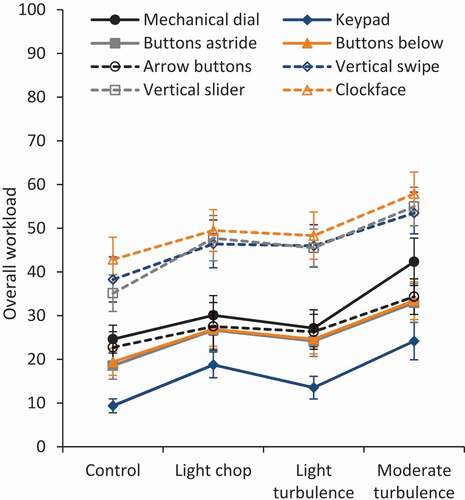
There was also a main effect of task, F(4.2, 104.4) = 38.04, p < .001, ηp2 = .60, with post-hoc comparisons again using the mechanical dial as the baseline. The numerical keypad required significantly less workload (p = .005), while vertical swipe, vertical slide, and clockface all required significantly more (p = .003, p < .001, p < .001, respectively). There was no significant change in workload with buttons astride, buttons below, or arrow buttons tasks (all p > .999). Finally, the interaction between turbulence and task was not significant, F(6.2, 155.5) = .90, p = .498.
3.2.4. Usability
Overall usability scores were computed for each task across each level of turbulence and can be seen in . There was no significant effect of turbulence on usability, F(2.1, 48.5) = 6.08, p = .004, ηp2 = .21. When compared to the control, usability decreased significantly as turbulence increased (light chop: p = .010; light turbulence: p = .016; moderate turbulence: p = .010). Although no significant differences were present between light chop, light turbulence, and moderate turbulence.
Figure 13. Overall usability scores for number entry tasks by turbulence level (error bars represent ±1 SEM).
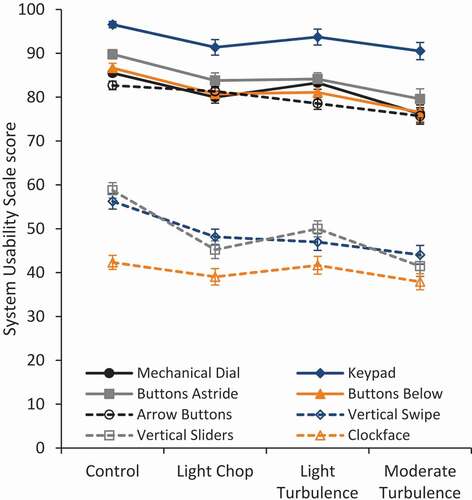
There was also a significant main effect of task, F(3.6, 81.8) = 52.83, p < .001, ηp2 = .70. Compared to the mechanical dial, significantly lower usability ratings were found for the vertical swipe (p < .001), vertical slide (p < .001), and clockface (p < .001). No significant difference in usability was evident in the buttons astride, buttons below, or arrow buttons tasks (all p > .999). The keypad task was rated highest overall and was rated significantly higher in usability compared to the mechanical dial (p = .042). The interaction between task and turbulence was not significant, F(8.4, 192.1) = 1.31, p = .239.
4. Discussion
The aim of the study was to extend on Coutts et al. (Citation2019) and test task performance (pan and number entry) when presented in different formats across levels of turbulence. It was hypothesized that as turbulence increased task performance would decrease. This is largely supported by the results, with increases in completion time and additional interactions with the touchscreen as turbulence was induced. Workload increased and the usability ratings decreased as turbulence increased, indicating that the turbulence had an impact on the subjective measures of performance. Interestingly there was an underlying influence of task intention on performance, in that turbulence appeared to affect the gestures to different degrees between the two tasks. To understand this further and to develop recommendations for integration into the flight deck, the pan and number entry tasks will be discussed in isolation.
4.1. Pan task performance
When considering objective performance of the pan task, the drag gesture was completed significantly faster and with less additional interactions than the two other gestures (tap, tap-and-hold). This is then supported by the ratings for workload and usability, with drag tasks rated as requiring less workload and higher usability. While not an issue for light chop or light turbulence, there was however a considerable negative effect of moderate turbulence on the performance of the drag task when in the center screen position. The results from the analysis of the variations of the pan task also suggest that the side screen position would be the recommended location.
Objectively, tasks were completed faster and with less variability in performance in the side position than the front-center position. It also produced lower discomfort ratings for participants, and this is supported by the ratings of workload and usability. This was especially evident in the performance of drag tasks, where it is thought that the angle of the screen in the center (15° rotation back from perpendicular to the floor), made the drag maneuver more difficult as participants wrists were completely extended. This was compared to a side position (screen was rotated 10° forward from parallel to the floor) which required users to lean over onto the screen so that participants’ wrists and hands were kept in a position more closely resembling a neutral wrist. This makes it easier to perform the tasks and reduces physical workload. Similarly, in the tap-and-hold, users were required to maintain the extended wrist position for a longer period without release and this is evident in the workload and usability scores for those tasks and the associated significant interactions.
4.2. Number-entry task performance
Overall, turbulence had a greater effect on number entry tasks, although when this is examined further, it is suggested that it is the specific gesture that is driving the effect. Single tap gestures, such as what was required for the keypad, buttons below, and buttons astride, were not affected by turbulence. While the more complex gestures of swipe, slide, and drag (seen in the vertical swipe, vertical slide, and clockface, respectively) were deemed to be inferior to the current dial in their time to completion, workload, and usability. For this, they also appeared to have been more heavily influenced by the effects of turbulence, which was not seen in the pan task.
Most significantly impacted was the vertical swipe task, which saw large increases in performance variability, the number of additional interactions required to complete the task, and the time taken to complete the task with increases in turbulence. This supports the findings of Coutts et al. (Citation2019) which found that the swipe action had lower accuracy than other gestures. This may be due to the difference between a swipe and drag gesture, where both are considered to be a single finger gesture, swiping is inherently a lighter, “flick” and dragging implies constant contact with the screen to complete the gesture (Jeong & Liu, Citation2017). The faster the screen is swiped, the larger the change in the associated screen interface. The “lighter” action of the swipe appears to be more susceptible to turbulence than the drag, where the constant contact with the screen may be a preventative factor against turbulence.
Second, Burnett et al. (Citation2013), suggest that the intended direction of the action influences swiping duration and speed of the swipe. While this configuration had swiping occurring only in an up-down direction, in Burnett et al.’s study, down swipes were slower than upward swipes, which is associated with a smaller change in the screen. And, while not the same effect as turbulence, moving from a static to driving condition enhanced this gesture speed finding (Burnett et al., Citation2013). This could account for the differences in the performance across turbulence in the vertical swipe task.
In line with the recommendations of Coutts et al. (Citation2019), the single tap keypad design was the most supported new design and appears to outperform the current mechanical dial interface. The keypad design was the fastest task to be completed, and with limited additional interactions, suggesting fewer errors or inadvertent presses. Interestingly, again in support of the conclusions of Coutts et al., the two remaining tap interfaces (buttons below and buttons astride) were completed at a similar speed (differences were not significant), and not significantly different from that of the keypad. Therefore, it would suggest that any tap-based integration would enhance performance over the current mechanical dial for number entry, regardless of turbulence. The workload and usability ratings are therefore important when considering which of these tasks would be best integrated into the flight deck. The keypad task was reported to have a significantly lower workload and significantly higher usability than the mechanical dial, while buttons astride and below were not significant from the dial. The results of the keypad assessment also suggest there would be less variability in individual users (supported by lower SEM in ). This would reduce the potential for error in the number entry task. Taking this into account, the keypad is the preferred integration format.
4.3. The use of touchscreens in turbulence
The outcomes of this research allow us to make two contributions to the evolving literature surrounding the implementation of touchscreens on the flight deck (Avsar et al., Citation2015; Cockburn et al., Citation2017; Coutts et al., Citation2019; Dodd et al., Citation2014). Where some research to this point had not adopted replications of specific tasks completed by pilots (e.g., Avsar et al., Citation2015; Coutts et al., Citation2019); Cockburn et al. (Citation2017) and Dodd et al. (Citation2014) similarly attempted to replicate common in-fight tasks. As mentioned, number-entry tasks are frequently performed in the current flight deck, such as in selecting the heading, altitude, or airspeed in the Flight Director. The number entry analysis reported here is novel in that it allowed us to demonstrate the potential improvement to performance of a basic task (number entry) through touchscreen integration, by comparing against the current mechanical dial. It also provides further evidence for the impact of turbulence on performance; specifically, that for number entry, with a touchscreen keypad, performance was not significantly impacted. By adopting a common interface design that is already part of the flight deck’s multifunctional computer display unit, it is likely that errors in its usage would be minimal.
The research makes a secondary contribution through the study of the pan task, allowing for a direct comparison between panning gestures on the same tasks, extending the work of Coutts et al. (Citation2019). Although not currently part of the flight deck design, this is a new potential feature which may be used as the flight deck moves toward becoming more interactive. For example, a pan function may be employed in adjusting map displays in navigational way point selection or selecting the relevant “app” or instrumentation required in an integrated flight deck display. Being a new integration that cannot be compared against an existing form of interaction, it contributes to the understanding of the impact of turbulence on touchscreen interactions. Whilst the results were not as predicted, some light can be shed on how this specific task is completed under turbulence. This highlights the need for further turbulence-based testing of new touchscreen tasks, to determine how each could potentially be affected.
4.4. Limitations and future research
There was a limitation in that participants were only right-handed, and the screen was positioned on their dominant side. Thus, their performance in the task in this position is likely improved based on what it would be if the screen were on their left-hand side. While the right-hand side screen position resulted in the least degree of discomfort, and higher ratings of usability, this may be inflated by the hand they were using. Especially considering, if the screen position were to be in the center (middle console), the pilot seated in the right chair of the cockpit, would be using this screen with their left-hand. Therefore, we cannot be sure that these same performance ratings would generalize to this position. Further research is necessary to test this screen position and to test left-handed participants in the original configuration.
Additionally, while interaction analysis would suggest that the performance on the clockface design was not significantly different to that of the keypad, it was suggested that a potential data-recording oversight could account for this. Experimenters observed that, particularly at the higher levels, participants were making high numbers of interaction and gestures toward the screen, which were not reflected in the scores. It was mentioned by some participants in the post-task debrief that it was more difficult to make a positive interaction with clockface design, so it is thought that multiple additional touches were made to the screen without the system recording a positive “interaction”. Therefore, the objective measures must be interpreted with caution, and future research could re-assess that design with an improved code. However, as the workload and usability ratings for the clockface were not supportive of its use (significantly higher workload and significantly lower usability); it is not indicated. Further research could investigate the performance of pilots in specific tasks in a flight simulator that employ the use of the recommended designs. This, in combination with metrics of workload and usability would allow for a more thorough understanding of the impact of the task design on its intended performance.
Future research may also incorporate the use of haptic feedback, to ensure participants are aware of the acceptance of their inputs. As much previous research has suggested (e.g., Bhalla & Bhalla, Citation2010; Dodd et al., Citation2014), a drawback of touchscreen design compared to a physical key is the lack of physical feedback. Some have suggested this as a solution, although has not been investigated under turbulence. This offers a potential area for future investigation, especially assessing if this contributes to workload in the highly cognitively demanding situation of turbulent flight.
4.5. Recommendations and conclusions
As the commercial aviation industry progresses toward more touchscreen implementation, the findings of the current study are critical to understanding how performance may be impacted. Based on the findings of this study, it would be recommended that future touchscreen designs incorporate a drag function for completing a pan task, and simple keypad design for number entry. Differences in comfort and usability support the recommendation that the screen be positioned in the area between the pilot seats, as performance was also improved in this location. As outlined above however, the current design tested only participants for whom this involved the use of their dominant hand, therefore further research is called for to test the performance of both left- and right-handed individuals, with the screen on both sides of their chair. This research further supports the call for a confirmation function when higher levels of turbulence are present (Coutts et al., Citation2019), which could be activated when high turbulence is encountered. This would ensure that any accidental presses (such as the increased additional screen interactions seen at higher turbulence) are not registered as the final selection, particularly for safety-critical processes, without pilot confirmation.
Ultimately, this research highlights that the intention of the task to be completed plays a pivotal role in its design. The outcomes of this study demonstrate that when the task was movement related (the pan task), dragging was the preferred gesture. Dragging was completed more quickly and accurately and scored in usability, while being less susceptible to turbulence and required less workload than tap-based features. However, when the goal of the task was number entry, the drag gesture was heavily impacted by turbulence. Instead, the “tap” gesture on a keypad was shown to be faster and more accurate, supported by less workload and higher usability. This highlights the need to empirically test tasks in moving-base simulators when evaluating and designing human-machine interfaces, as a “one-gesture suits all” approach does not apply.
Supplemental Material
Download Zip (144.9 KB)Acknowledgments
Our thanks go to James Arnold and Ying Ye who developed the vibration profiles with the assistance of First Officer Neale Canning. Thanks also go to Gary Parker and the team at ISVR at the University of Southampton for providing technical and operational support for the simulator. Finally, we would like to thank our participants who have contributed their time in support of this important research.
Supplementary material
Supplemental data for this article can be accessed on the publisher’s website.
Additional information
Funding
Notes on contributors
Rachael A. Wynne
Rachael Wynne is conducting post-doctoral research within Human Factors Engineering research group at the University of Southampton, currently working on the Open Flight Deck project. Her PhD research was in Psychology and Human Factors, investigating the validity of driving research paradigms and the visual attention of learner drivers.
Katie J. Parnell
Katie Parnell is a Human Factors Research Fellow within the Human Factors Engineering research group at the University of Southampton. She is currently working on the Open Flight Deck project. She has an Engineering Doctorate, which focused on the topic of driver distraction from in-vehicle technology within automotive vehicles.
Mark A. Smith
Mark Smith is a Research and Development Systems Engineer working within the Emerging Technology group a GE Aviation Systems on the Open Flight Deck Project. He currently investigates and evaluates potential future flight deck interfaces and flight deck display systems.
Katherine L. Plant
Katherine Plant is a Chartered Ergonomist and a Lecturer in Human Factors Engineering in the Transportation Research Group at the University of Southampton. Her current research interests are in aviation human factors, road safety in developing countries and cycling safety in the UK.
Neville A. Stanton
Neville A. Stanton is a Professor of Human Factors Engineering in the Transportation Research Group at the University of Southampton. He is a Chartered Psychologist, Chartered Ergonomist and Chartered Engineer. His interests include modeling, predicting, analyzing and evaluating human performance in systems as well as designing the interfaces and human-technology interaction.
Related Research Data
References
- Alexander, A. L., Kaber, D. B., Kim, S.-H., Stelzer, E. M., Kaufmann, K., & Prinzel, L. J. (2012). Measurement and modeling of display clutter in advanced flight deck technologies. The International Journal of Aviation Psychology, 22(4), 299–318. https://doi.org/https://doi.org/10.1080/10508414.2012.718233
- Avsar, H., Fischer, J. E., & Rodden, T. (2015). Target size guidelines for interactive displays on the flight deck. Proceedings of 2015 IEEE/AIAA 34th Digital Avionics Systems Conference (DASC), Prague, Czech Republic (pp. 3C4 1–15), Institute of Electrical and Electronics Engineers. https://doi.org/https://doi.org/10.1109/DASC.2015.7311400
- Bender, G. T. (1999). Touch screen performance as a function of the duration of auditory feedback and target size [PhD diss.], Wichita State University.
- Bhalla, A. V., & Bhalla, M. R. (2010). Comparative study of various touchscreen technologies. International Journal of Computer Applications, 6(8), 12–18. https://doi.org/https://doi.org/10.5120/1097-1433.
- Brooke, J. (1996). SUS: A ‘quick and dirty’ usability scale. In P. W. Jordan, B. Thomas, B. A. Weerdmeester, & I. L. McClelland (Eds.), Usability evaluation in industry (pp. 189–194). Taylor and Francis.
- BSI (British Standards Institution). (1987). BS 6841: Measurement and evaluation of human exposure to whole-body mechanical vibration and repeated shock. BSI.
- Burnett, G., Crundall, E., Large, D., Lawson, G., & Skrypchuk, L. (2013). A study of unidirectional swipe gestures on in-vehicle touch screens. Proceedings of the 5th International Conference on Automotive User Interfaces and Interactive Vehicular Applications, AutomotiveUI ’13 (pp. 22–29). https://doi.org/https://doi.org/10.1145/2516540.2516545
- Cockburn, A., Gutwin, C., Palanque, P., Deleris, Y., Trask, C., Coveney, A., Yung, M., & MacLean, K. (2017). Turbulent touch: Touchscreen input for cockpit flight displays. Proceedings of the 2017 CHI, Conference on human factors in computing systems (CHI ’17) (pp. 6742–6753). https://doi.org/https://doi.org/10.1145/3025453.3025584
- Colle, H. A., & Hiszem, K. J. (2004). Standing at a kiosk: Effects of key size and spacing on touch screen numeric keypad performance and user preference. Ergonomics, 47(13), 1406–1423. https://doi.org/https://doi.org/10.1080/00140130410001724228
- Coutts, L. V., Plant, K. L., Smith, M., Bolton, L., Parnell, K. J., Arnold, J., & Stanton, N. A. (2019). Future technology on the flight deck: Assessing the use of touchscreens in vibration environments. Ergonomics, 62(2), 286–304. https://doi.org/https://doi.org/10.1080/00140139.2018.1552013
- Dodd, S., Lancaster, J., Miranda, A., Grothe, S., DeMers, B., & Rogers, B. (2014). Touch screens on the flight deck: The impact of touch target size, spacing, touch technology and turbulence on pilot performance. Proceedings of the Human Factors and Ergonomics Society Annual Meeting, 58(1), 6–10. https://doi.org/https://doi.org/10.1177/1541931214581002
- FAA (Federal Aviation Administration). (2020). Federal aviation regulations aeronautical information manual 2019. Aviation Supplies & Academics.
- Graham-Rowe, D. (2011). Vibrating touchscreens that give you a push back. New Scientist, 211(2821), 20. https://www.newscientist.com/article/mg21128216-000-vibratingtouchscreens-that-give-you-a-push-back/
- Happich, J. (2015). Force sensing touchscreen leverages projected capacitive technology. http://www.eenewseurope.com/news/force-sensing-touchscreen-leverages-projected-capacitive-technology
- Harris, D. (2011). Human performance on the flight deck. Ashgate Publishing, Ltd.
- Hart, S. G., & Staveland, L. E. (1988). Development of NASA-TLX (Task Load Index): Results of empirical and theoretical research. In P. A. Hancock & N. Meshkati (Eds.), Human mental workload (pp. 239–250). North Holland Press.
- Harvey, C., Stanton, N. A., Pickering, C. A., McDonald, M., & Zheng, P. (2011). To twist or poke? A method for identifying usability issues with the rotary controller and touch screen for control of in-vehicle information systems. Ergonomics, 54(7), 609–625. https://doi.org/https://doi.org/10.1080/00140139.2011.586063.
- Hedge, A., Morimoto, S., & McCrobie, D. (1999). Effects of keyboard tray geometry on upper body posture and comfort. Ergonomics, 42(10), 1333–1349. https://doi.org/https://doi.org/10.1080/001401399184983
- Hoffman, E. R., & Sheikh, I. H. (1994). Effect of varying target height in a Fitts’ movement task. Ergonomics, 36(7), 1071–1088. https://doi.org/https://doi.org/10.1080/00140139408963719
- Jeong, H., & Liu, Y. (2017). Effects of touchscreen gesture’s type and direction on finger-touch input performance and subjective ratings. Ergonomics, 60(1), 1528–1539. https://doi.org/https://doi.org/10.1080/00140139.2017.1313457
- MacKenzie, I. S., Sellen, A., & Buxton, W. A. S. (1991). A comparison of input devices in element pointing and dragging tasks. Proceedings of the SIGCHI conference on Human factors in computing systems: Reaching through technology (pp. 161–166).
- NASA (National Aeronautics and Space Administration). (1986). NASA Task Load Index (NASA-TLX), version 1.0: Paper and pencil package. NASA-Ames Research Center, Aerospace Human Factors Research Division.
- Norman, G. (2010). Likert scales, levels of measurement and the “laws” of statistics. Advances in Health Sciences Education, 15(5), 625–632. https://doi.org/https://doi.org/10.1007/s10459-010-9222-y
- Orphanides, A. K., & Nam, C. S. (2017). Touchscreen interfaces in context: A systematic review of research into touchscreens across settings, populations, and implementations. Applied Ergonomics, 61, 116–143. https://doi.org/https://doi.org/10.1016/j.apergo.2017.01.013
- Page, T. (2014). Application-based mobile devices in design education. International Journal of Mobile Learning and Organization, 8(2), 96–111. https://doi.org/https://doi.org/10.1504/IJMLO.2014.062347
- Pope, S. (2009). Garmin G3000 brings touch screen tech to flight deck. Avionics Magazine. https://www.ainonline.com/aviation-news/business-aviation/2009-10-19/garmin-g3000-brings-touchscreen-tech-flight-deck.
- Rockwell Collins. (2016). Boeing 777X to feature touchscreen flight displays from rockwell collins. https://www.rockwellcollins.com/Data/News/2016-Cal-Yr/CS/FY16CSNR51-777x.aspx
- Rogers, W. A., Fisk, A. D., McLaughlin, A. C., & Pak, R. (2005). Touch a screen or turn a knob: Choosing the best device for the job. Human Factors: The Journal of the Human Factors and Ergonomics Society, 47(2), 271–288. https://doi.org/https://doi.org/10.1518/0018720054679452
- Stanton, N. A., Harvey, C., Plant, K. L., & Bolton, L. (2013). To twist, roll, stroke or poke? A study of input devices for menu navigation in the cockpit. Ergonomics, 56(4), 590–611. https://doi.org/https://doi.org/10.1080/00140139.2012.751458
- Sullivan, G., & Artino, A. R., Jr. (2013). Analyzing and interpreting data from Likert-type scales. Journal of Graduate Medical Education, 5(4), 541–542. https://doi.org/https://doi.org/10.4300/JGME-5-4-18
- Williams, P. D. (2017). Increased light, moderate, and severe clear-air turbulence in response to climate change. Advances in Atmospheric Sciences, 34(5), 576–586. https://doi.org/https://doi.org/10.1007/s00376-017-6268-2
- Wobbrock, J. O., Cutrell, E., Harada, S., & MacKenzie, I. S. (2008). An error model for pointing based on Fitts’ law. Proceedings of the SIGCHI Conference on Human Factors in Computing Systems (CHI ‘08) (pp. 1613–1622).