
ABSTRACT
This article explores video-viewing behavior when videos are wrapped in interactive content in the case of iOtok, a 13-episodes web documentary series. The interaction and viewing data were collected over a period of one year, providing a dataset of more than 12,200 total video views by 6000 users. Standard metrics (video views, percentage viewed, number of sessions) show higher active participation for registered users compared to unregistered users. Results also indicate that serialization over multiple weeks is an effective strategy for audience building over a long period of time without negatively affecting video views. In viewing behavior analysis, we focused on three perspectives: (i) regularity (watching on a weekly basis or not), (ii) intensity (number of videos per session), and (iii) order of watching. We performed a perspective based and combined perspectives analysis involving manual coding techniques, rule-based, and k-means clustering algorithms to reveal different user profiles (intermittent, exemplary, detached, enthusiastic users, and nibblers) and highlight further viewing behavior differences (e.g., post-series users binge-watched more than concurrent users during first 13 weeks while the series was weekly released). We discuss how these results can be used to inform the design and promotion of future web documentaries.
1. Introduction
Web documentaries offer an interesting platform in terms of interactivity and storytelling approaches. While they rely on various media such as pictures, audio narrations and documents, their core component is often one or several videos. Understanding video viewing behavior can guide video design (e.g., in terms of length, content) and help researchers and practitioners to better understand how it can affect the viewing experience.
In contrast to other platforms such as social media sites and video-on-demand services, there is little research about and available datasets on the consumption of videos for web documentary series accessible over a long period of time with several unanswered questions such as: How do users consume already available content? Do they binge-watch the series? Do they watch the episodes (videos) in the order they were released? How regularly do users return to the web portal to access new episodes? Compared to common video-on-demand, web documentaries include interactive activities and discovery processes around video content. Demanding active user participation can have a significant effect on video watching behavior which, to the best of our knowledge, has not been explored before.
We report on the evaluation of the web documentary iOtok over a period of one year. This documentary is one of the rare serialized web documentaries and as we had an opportunity to team up with filmmakers this provided a rare opportunity to study the aforementioned questions. Documentary was intended for Slovene and Croatian audiences (6 million potential viewers) interested in the life of 13 remaining inhabitants of an island. The web portal was built for desktop computer consumption. Based on the analysis of logs collected this article provides the following contributions: (i) a detailed analysis of users’ viewing behaviors based on time of visit (concurrent users during the time episodes were released on a weekly basis vs post-series users after no episodes were released) and the type (unregistered vs unregistered); (ii) a set of metrics and rules for audience segmentation based on three viewing behavior perspectives (intensity, regularity, and order), which were defined based on a combination of manual coding, domain knowledge, and k-means clustering algorithm; and (iii) a set of recommendations for the design and promotion of web documentary series based on the results presented in the article.
The article is structured as follows. We first provide an overview of the literature on online video watching. We then briefly describe the web documentary and provide a summary of findings published in the previous article. In Section 4 we report on an in-depth and quantitative analysis of the consumption of iOtok videos. In Section 5 we discuss our findings in the light of existing research of online viewing behaviors and discuss implications for the design of web documentaries.
2. Related work
2.1. Interactive web documentaries
Over the last decade, interactive documentaries have been largely discussed within the field of media studies in respect to production, audience reception, and narrative discourse (Galloway et al., Citation2007; Nash, Citation2014a; Vázquez-Herrero & Gifreu-Castells, Citation2019). They are defined as any project that documents the “real” and uses digital technologies to provide interactivity as a core part of the delivery mechanisms (Aston & Gaudenzi, Citation2012; Galloway et al., Citation2007). Web technologies, supporting various interactive features, have been used for the creation of several interactive documentaries (O’Flynn, Citation2012), alongside newer forms that rely on Augmented or Virtual Reality (Fisher, Citation2016; Nash, Citation2018; Weidle, Citation2018). A more comprehensive review on this topic is available in (Ducasse et al., Citation2020).
2.1.1. Modes of interactivity
Aston and Gaudenzi (Citation2012) identified four modes that characterize how users can access the documentary content: the conversational, participatory, experiential, and hitchhiking/hypertext mode, to which iOtok belongs. In hypertext mode, users are invited to click on interactive elements, jumping from one screen to another and actively discovering or constructing the story (Aston & Gaudenzi, Citation2012), with videos as the main element (Almeida & Alvelos, Citation2010). Selecting between various options available and switching between different parts of the documentary gives viewers a sense of autonomy as well as enables filmmakers to force viewers toward a particular content or to encourage them to explore something in-depth. Illustrative examples of hypertext documentaries include: Bear 71,Footnote1 Out of my Window,Footnote2 Gaza/Sderot: Life in Spite of EverythingFootnote3 and Journey to the End of Coal.Footnote4
2.1.2. Existing studies
Existing literature on interactive documentaries mainly covers theoretical understanding on how interactivity affects the narration, the filmmaker’s discourse or relationships with the audience. For example, it has been discussed whether story branching and fragmented content reduce engagement and the filmmaker’s power to “argue” (Forceville, Citation2017), how the navigation techniques can shape viewers’ experience giving them a sense of freedom (Dubois, Citation2018), and how the design choices support viewers’ sense of control, “sense of place” and “sense of self” based on the semiotic framework (Nogueira, Citation2015).
While such analyses are necessary to form the theoretical foundation of the genre, they also need to be complemented and supported by empirical evidence. However, so far, such empirical studies are sparse. Nash (Citation2014c) discussed the reception of the web documentary Bear 71 by analyzing verbal comments made by 23 participants. Pettengil (Citation2017) addressed the user experience in interactive documentaries through a study of Bear 71 with 15 participants. Alkarimeh compared three versions of one documentary (non-interactive vs low/high interactive) with 360 participants (Alkarimeh, Citation2019). The study mainly relied on interviews and a small set of empirical data (e.g., number of pages viewed). In a previous study, we provided a comprehensive quantitative analysis of iOtok based on over 20,000 sessions, focusing on the navigation paths that users had to follow to reach a core video (Ducasse et al., Citation2020).
The analysis of in-the-wild and quantitative data is essential to better understand how users interact with web documentaries as well as how they consume videos in order to provide filmmakers with evidence-based recommendations.
2.2. Metrics for online videos
The consumption of online videos is continuously increasing and several metrics to measure it was proposed by the industry and scholars. The most popular video website YouTube uses the following metrics to assess how well a particular video performs: (i) video views refer to how many times a video was watched for 30 seconds or more; (ii) watch time refers to the total time spent by users watching the video; (iii) average view duration is the ratio between watch time and video views; (iv) average percentage viewed (sometimes referred to as audience retention rate) is measured as the ratio between average view duration and the length of the video; and (v) absolute audience retention reflects the most-watched moments of the videos and parts with high drop-off rates. Other metrics are related to audience demographics (countries) and to contextual information such as traffic sources and devices used.Footnote5 Another metric often mentioned online is video engagement, which is described as the percentage of viewers who make it to 10%, 20%, … 100% marks (these marks can be different for different services)Footnote6 of a particular. While YouTube combines (ii) and (iii) to describe engagement with all the videos available (or the ones on a particular playlist).
Despite the fact that the data on audience retention for sites such as YouTube are not publicly available (Altman & Jiménez, Citation2019), several companies provide estimates of the average percentage viewed, ranging from 35–40%Footnote7 to 50–60%Footnote8 with above-average values between 60% and 70%.Footnote9 According to Wistia,Footnote10 the average percentage view significantly varies between videos that are 2–3 minutes long (65%) and videos between 6 to 12 minutes (50%). The average percentage viewed continues dropping for longer videos (45% for 20 minutes long videos). Maggi et al. (Citation2018) also report that the average video watch-time is less than 70%, and the longer the video the shorter its watch-time.
There are several factors that could explain why users stop watching videos: lack of interest, interruptions, quality of the video, etc. While the general trend is to make videos shorter (e.g., 15 seconds on TikTok and Instagram’s Reels), in some contexts long videos are not an issue and users exhibit binge-watching behaviors even for 1-hour-long shows (Trouleau et al., Citation2016). In the context of web documentaries, there are no available data regarding the time spent on videos and the “ideal” length depends on the content (Almeida & Alvelos, Citation2010). However, web documentaries have relatively low and varying average view duration: 5 minutes out of 90 for Moneyocracy (Epstein & Knowlton, Citation2015), 5.5 minutes out of 3 hours for Hollow (Aufderheide, Citation2015; Epstein & Knowlton, Citation2015), 10 minutes out of 20 for Journey to the End of Coal (Aufderheide, Citation2015), and 60 minutes for 20% of registered users for Prison Valley.Footnote11
2.3. Viewing behaviors
The above-mentioned metrics intended for individual videos cannot be simply applied to a series of separated and related videos. In such cases, a popular concept of binge-watching can be used. It is defined by the Oxford Dictionary as “the practice of watching several episodes of a TV show on one occasion.”Footnote12 Binge-watching has become widespread with video streaming services such as Netflix and the results from surveys published in 2013 and 2018 by Netflix–Harris PollFootnote13 and Morning ConsultFootnote14 show similar trends of around 60% of respondents binge-watching regularly (watching 2–6 episodes of the same TV show in one sitting).
Within academia, research has mainly focused on defining binge-watching (Flayelle et al., Citation2020; Merikivi et al., Citation2020) and studying the motivations for and its consequences (Pittman & Sheehan, Citation2015; Rubenking et al., Citation2018; Shim et al., Citation2018; Sung et al., Citation2018). In a systematic review on the topic, Merikivi et al. (Citation2020, p. 10) analyzed several definitions and proposed a convergent one stating that binge-watching consists in “viewing more than one episode of the same serialized video content in a single sitting with one’s own pace and time.” As such, binge-watching differs from casual viewing, defined as “self-scheduled single-episode sessions.”
Trouleau et al. (Citation2016) proposed a systematic approach to better predict and characterize binge-watching viewing practices. Their model takes into account several factors, such as the day of the week (e.g., users have shorter viewing sessions on weekdays compared to weekends), the start hour of the session (e.g., more users watch the shows during weekend nights than weekend days), the device used, and the genre of the show. This model revealed different types of sessions (normal, binge-watched or hyper-binge-watched) and could predict the transitions from one to another. There is also a link between session type and the order in which episodes are watched: the most sequential watching happens in normal sessions (97%), followed by binge-watching (84%), and hyper-binge-watching sessions (76%). This work emphasizes the relevance of statistics models to categorize users, an approach that has not been considered for web documentaries.
However, the authors state that the number of episodes watched in a normal or (hyper)-binge session also depends on the length of the episodes. It is not surprising that recent studies took the time of sessions into account. Some researchers considered viewing sessions to be binge-watching if they lasted at least one hour (Rigby et al., Citation2018) with the average duration of such sessions lasting just over two hours (Castro et al., Citation2021). In addition, the type of episodes (independent vs sequential/connected) also affects behavior with sequential as more likely binge-watched or watched out-of-order (Lu et al., Citation2019).
2.4. Contributions
Publicly available quantitative research on web documentaries is scarce and we contribute to the literature in several ways:
Our analysis is based on a large dataset of empirical data (over 12,200 videos), collected in-the-wild over a period of 1 year.
iOtok is a serialized web documentary and differs from other web documentaries mentioned. It is timely to study watching such documentaries since serialization has become a common strategy to keep the audience engaged over several weeks (e.g., IGTV series on Instagram, weekly release of videos on YouTube channels, Netflix original series, etc.).
We compare data from users who accessed the web documentary when it was released (concurrent users) and data from users who accessed it later on (post-series users). This distinction can help researchers and practitioners to better segment and understand their audience.
Our analysis offers a novel set of metrics (e.g., total video views in a catch-up session, etc.) that cover a larger range of users’ behaviors, expanding what was done in previous studies. (v) We introduce an additional level of objectivity into our audience segmentation analysis by combining manual coding techniques with machine learning. This helped us identify different users’ profiles (e.g., followers, binge-watchers, independent, etc.) and highlight further viewing behavior differences between groups (e.g., post-series users binge-watched more than concurrent users).
3. Material and methods
This section provides a brief description of iOtok and highlights previous findings that framed the analysis presented in this article.
3.1. Description of iOtok
iOtok is a web documentary of 13 episodes released on a weekly basis. Each episode tells a story of one or two (out of 13) inhabitants of a Croatian island threatened by mass tourism. Episodes start with an animated 360 explorable panorama of the island and its buildings. Some buildings are presented with a blinking contour to indicate they are clickable. Upon clicking, another panorama of the surroundings or interior of the selected building is shown. A short audio narration (up to 25 seconds) introducing the episode precedes before the scene becomes interactive. As before, interactivity is provided through an element with a blinking contour (e.g., a book, furniture, person) and by clicking on it, users reach a 10 to 15 minutes long video of that building’s inhabitant(s) or building’s story. Some episodes have three panoramas. After watching the video, users are presented with the last panorama before the video was reached. Registered users can collect souvenirs (a recipe, poem, etc.) by clicking on another interactive element with a blinking contour. They are then invited (default for unregistered users after seeing the video) to watch the next episode if available or to return to the home page. See (Ducasse et al., Citation2020) for a more detailed description. For episodes with more than one video, we considered only the “main” one (video describing a story of inhabitants or buildings, the longest video). Therefore, we report results on 13 videos, one for each episode.
3.2. Previous findings
The findings in (Ducasse et al., Citation2020) covered audience reception and interaction with the web portal during the 13 weeks when episodes were released. We showed that each click on the interactive elements before reaching the video led to a considerable dropout for unregistered users (about 33%). The serialization of iOtok was relatively successful with high return rates for registered users and significantly higher average time on site compared to other web documentaries. The weekly newsletter sent to registered users and online promotion of new episodes encouraged registered users to return to the web portal regularly. However, this was also very likely interplayed with other factors (motivation of the audience, quality of the video content, etc.). Therefore, the effect of serialization on consuming video content in web documentaries requires further investigation.
In this article, we use data over a one-year period to investigate the difference in consumption whether the episodes (videos) are being released on a weekly basis (serialized through the first 13 weeks) or all the episodes (videos) are available at once (from week 14 and onwards), removing the aforementioned bias from results related to serialization. We do this through video watching behavior.
3.3. Data collection and analysis
We only collected data of users who agreed to participate in the study. Two events related to videos were saved together with a timestamp and user ID: launching the video (automatically played after clicking on the last interactive element) and finishing the video (if the close button in the top-right corner of the video was clicked or when the video reached the end).
Due to a delay in the implementation of the logging system, it should be noted that:
Logs were collected from 21 January 2017, i.e., 4 days after the release of the first episode.
Tracking of unregistered users’ video events started on 4 February 2017.
Unregistered users were assigned a different ID for every visit on the website until 21 February 2017, making it impossible to count how many videos were watched by unregistered users until that date.
Web server logs also come with two limitations: (i) one user ID can represent several users if they use the same device (e.g., family members) and (ii) if the user closed the web browser while video was playing no event was recorded.
We report effect sizes with 95% Confidence Intervals (CI) instead of a p-value, together with means or medians and 95% bootstrap CIs for all values, including pairwise comparisons (i.e. differences between registered and unregistered users or between concurrent and post-series users). For proportions, we report the 95% CI interval using the Wilson score interval.
4. Results
Throughout the article, we only take into account users who watched at least one video and divided them into four groups based on type:
registered: users who created an account on the web portal and received a weekly newsletter;
unregistered: users who did not create an account;
and time of visit:
concurrent: users who first accessed the web portal during the 13 weeks of the distribution;
post-series: users who first accessed the portal after all episodes were released (17 April 2017–26 February 2018).
We use the term “user category” to refer to one of the following four groups: (i) concurrent registered, (ii) concurrent unregistered, (iii) post-series registered, and (iv) post-series unregistered users.
4.1. Number of users and video views
Our web log did not collect demographic information, but an approximation could be obtained from the followers on Facebook pages (N = 2554). The data show nearly even distribution between genders and with the highest number of users in the age group 35–44 (cca 30%), followed by 25–34 and 45–54 (cca. 24% each), 55–64 (cca. 10%), and the rest (Ducasse et al., Citation2020).
4.1.1. Overview
Footnote15 shows the number of users and a sum of video views for all videos (total video views) within each user category. Concurrent users account for 89% of all users, which reveals that promotion of the documentary during the first 13 weeks was efficient (Facebook, online news portals, newsletter). Once the active promotion stopped, the number of new users dropped significantly (5411 concurrent users in 3 months vs 679 post-series users in 10 months). Google Analytics data show that 51% of concurrent users accessed the web portal through direct source (e.g., typing the URL, opening a bookmark), compared to 90% for post-series users. In addition, 36% of social media traffic was made by concurrent users compared to 4% by post-series users.
Table 1. The number (share) of users (U) and total video views (share) (V) for each user category
A large majority of concurrent (4774/5411 = 88%) as well as post-series users (601/679 = 9%) were unregistered. Interestingly, the ratio between registered and unregistered users is nearly the same for concurrent and post-series users. Total video views for registered users (12%) account for 37% of all total video views, which means that total video views for registered users is a lot higher than for unregistered users.
4.1.2. Per week
From Week 2 to Week 13 (23 January 2017–16 April 2017) the average weekly number of concurrent users was 570 (CI [460, 680]) compared to post-series users 16 (CI [13, 22]). indicates the total video views for each user category by week. The large majority of concurrent users (green) did not watch any video after the release of the last episode.
Figure 1. Total video views for each user category by week
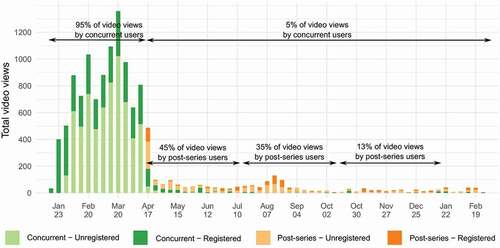
From Week 2 to Week 13 (23 January 2017–16 April 2017) the average weekly video views per concurrent users was 830 (CI [690, 980]; as video logs were not fully implemented for unregistered users until 4 February this is a low estimation) compared to post-series users 37 (CI [28, 61]). Post-series users watched 45% of total video views for this group within the first 3 months after the release of the final episode (up to 16 July), 80% within the first 6 months (up to 15 October) and 93% within the first 9 months (up to 15 January).
4.2. Video views
4.2.1. Per episode
The video from Episode 1 has the highest video views: they represent 18% of the total video views for concurrent registered users, 26% for concurrent unregistered users, 10% for post-series registered users and 40% for post-series unregistered users. Excluding the video from Episode 1, the average video views per video varies more for concurrent users (mean = 680, CI [590, 760], SD = 162.4) than for post-series users (mean = 100, CI = [86, 120], SD = 29.6). This was expected since the number of videos available increased linearly every week for concurrent users, whereas post-series users had all videos available.
4.2.2. Per user
As a reminder, web logs tracking unregistered users were not implemented until 21 February 2017. In this section only, we therefore take into account data for unregistered users who first visited the website from 21 February 2017.
shows that registered users have a higher average video views than unregistered users with the overall difference 3.4 (CI [3.0, 3.7]). A difference between concurrent registered and unregistered users is 3.3 (CI [3.0, 3.7]) and for post-series users 3.8 (CI [2.8, 4.7]). The difference in the average video views between concurrent and post-series registered users is −0.66 (CI [−1.69, 0.30]), while for concurrent and post-series unregistered users −0.21 (CI [−0.40, −0.10]).
Figure 2. Average video views per user for each user category
4.2.3. Percentage of users watching 1, 2, 3 … 13 videos
shows a detailed analysis of the percentage of users who viewed a particular number of videos – from 1 to 13. Note that total video views for a user can be higher than 13 if they watched one video several times. The majority of unregistered users watched only one video (83% of concurrent unregistered users, and 84% of post-series unregistered users) compared to 31% of concurrent and 15% of post-series registered users.
Figure 3. Percentage of participants with a certain total video views per user. For example, from post series registered users 15% had 1 total video views per user, 15% 2, 14% 3, 18% 4, …, 12% 12 and 12% had 13 total video views per users
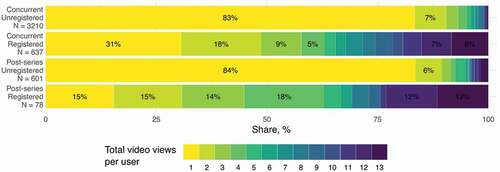
A relatively lower percentage of concurrent registered users watched 12 or 13 videos (15%) compared to post-series registered users (15%), suggesting that the availability of all episodes encouraged more users to consume all or “all-but-one” videos.
4.2.4. Per user and per session
A new viewing session started if users launched no other video for 30 minutes or more. This standard for Google analytics makes sense for our web portal where besides a video, each episode contains interactive panoramas, narrations, souvenirs, chats, etc. (e.g., 15 minutes gap is used for video on demand sessions (Castro et al., Citation2021)). The average video views per session per user was highest for post-series registered users (mean = 3.4, CI [2.9, 4.2]), followed by concurrent registered users (mean = 1.8, CI [1.7, 1.9]), post-series unregistered users (mean = 1.4, CI [1.3, 1.6]) and concurrent unregistered users (mean = 1.2, CI [1.1, 1.2]). The average number of sessions was highest for concurrent registered users (mean = 3.0, CI [2.8, 3.2]), followed by post-series registered users (mean = 1.7, CI [1.5, 2.0]) and unregistered users (mean = 1.1, CI [1.1, 1,1] for concurrent users; mean = 1.1, CI [1.1, 1.2] for post-series users).
4.3. Average percentage viewed and video engagement
View duration is defined as the time elapsed between the “launch video” event and the next event (video closed, finished, a click on a link on the page). If no event was recorded after “launch video” (e.g., a web browser was closed), view duration could not be computed. Therefore, we only considered 85% of total video views for which view duration is known. If we sum up all view durations for a particular video we get the watch time, while average view duration is the ratio between the watch time and video views.
The “Average Percentage Viewed” (APV) is the ratio between the average view duration for a video and its actual length. The APV can exceed 100% if the video takes time to load, users pause it or replay (parts of) it. All APV values superior to 100% have been remapped to 100% to avoid overestimating. The last-term video engagement describes the percentage of viewers that watched more than 0%, 10%, 20%, … 90% of a particular video (aggregated APV values).
4.3.1. Average percentage viewed per user category
shows the APV for each user category. Concurrent-registered users consumed more video content than concurrent unregistered (diff = 1.3%, CI = [−1.5, 4.1]). Post-series registered users also consumed more video content than post-series unregistered users (diff = 10.6%, CI = [2.7, 18.2]). Among registered users, there was no difference between concurrent and post-series users (diff = −0.4%, CI [−7.4, 6.9]). Among unregistered users, concurrent users consumed more video content than post-series users (diff = 8.8%, CI [5.0, 12.5]).
Figure 4. Average percentage viewed (viewing time divided by video length) for each user category
These results suggest that the availability of all videos encouraged post-series unregistered users to skip some parts of the videos, a behavior that was not observed for post-series registered users and for concurrent users.
4.3.2. Video engagement
shows the average video engagement graph for each user category. Results for concurrent users are in line with aforementioned findings: concurrent registered users showed higher video engagement than both categories of unregistered users. Given the low number of data points per interval per video for post-series registered users (dark orange), trends should be carefully interpreted.
Figure 5. Video engagement graph for each user category
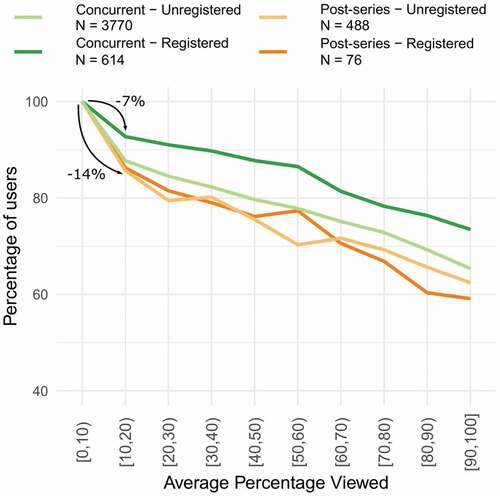
All four user categories present a high drop-off rate at the beginning of the video. The rate was lower for concurrent registered users (−7.3%) than for concurrent unregistered users (−12.3%), post-series registered users (−13.7%), and post-series unregistered users (−14.3%).
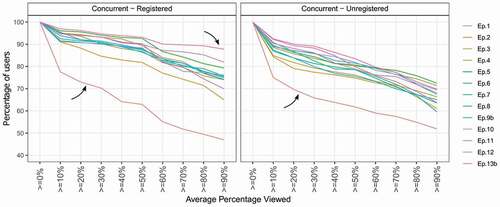
shows the video engagement graph for each video for concurrent users. Both concurrent registered and concurrent unregistered users were not likely to consume the video from Episode 1, which also showed a particularly high initial drop-off. As we discussed in (Ducasse et al., Citation2020), this could be due to users “trying out” the documentary, video launching automatically, or the lack of interest. The video from Episode 13 showed highest video engagement for concurrent registered users.
Figure 6. Video engagement graph for each video for concurrent users
4.4. Viewing behaviors: Regularity, intensity, and order
In this section, we look at users’ viewing behavior over time. In particular, whether consistent viewing practices could be found among users as well as for each user category. We focused on users who watched four different videos or more, as patterns are difficult to interpret for lower numbers.
4.4.1. Method
We first present the analysis of data from three perspectives: regularity, intensity, and order of viewing (perspective-based analysis). We then present the analysis with metrics from all perspectives in order to gain a unified view on viewing behaviors (unified analysis).
4.4.1.1. Perspective based analysis
Drawing on the literature review (Flayelle et al., Citation2020; Merikivi et al., Citation2020; Trouleau et al., Citation2016) as well as our own observations of the entire dataset (), we chose to analyze viewing behaviors from three different perspectives:
Regularity: Looking at whether users follow the series on a weekly basis, catch up on the episodes (and video within) they missed, continue to follow the series after catching up?
Intensity: How many videos users watch per session? Do they binge-watch?
Order: In which order do users watch the series? Do they skip episodes and videos within?
By combining previous research and standard behavior data analysis we created groups of behavior through several iterations of coding by multiple researchers. In order to bring a higher degree of objectivity, the optimal number of groups and thresholds (, and ) used to formulate them were defined through a computational approach, by performing a 3-step analysis for each perspective:
Table 2. Metrics used for the regularity perspective. “nbVideos” refers to total video views
Table 3. Rules for manual classification for regularity. Rules are evaluated one after the other
Table 4. Metrics used for the Intensity perspective. “nbVideos” refers to the total video views
Table 5. Rules for manual classification for intensity. Rules are evaluated one after the other
Table 6. Metrics used for the order perspective
Table 7. Rules for manual classification for order. Rules are evaluated one after the other
Table 8. Description and examples of users within each cluster for the unified perspective
Step 1: We grouped data using a set of naive clustering rules with a fixed threshold of 50% (e.g., a user belongs to the group of Followers if [nbFollow ≥ 50%]).
Step 2: We performed k-means and Gaussian mixture clusteringFootnote16 where the number of clusters was chosen using the elbow method (Jackson, Citation2005). Because k-means clustering results better followed our naive clustering results, we selected it for further analysis.
Step 3: If naive clustering rules did not follow results of Step 2 we searched for a set of alternative simple classification rules. The classification rules consist of a single metric and a threshold (e.g., a user belongs to a cluster Followers if [nbFollow ≥ X%]). The search for optimal threshold X was done iteratively by maximizing accuracy and F1-score.
4.4.1.2. Unified analysis
In unified audience segmentation, we included all eight metrics used for the perspective-based analysis (, and ). We used k-means clustering with Principal Component Analysis (PCA). PCA was used to properly handle a large number of features and was done with two componentsFootnote17 chosen based on the analysis of the variance using the elbow method (Jackson, Citation2005). The optimal number of clusters was chosen with silhouette analysisFootnote18 since the elbow method did not provide a clear suggestion on the number of clusters.
Note that standard methods of behavior analysis (e.g., grouping via iterations of coding) are not applicable because the high dimensionality of data and the number of metrics considered (8) result in highly complex patterns. In addition, it is difficult to visualize high-dimensional data in an easy to understand way. Therefore, a computational approach was the only viable method.
4.4.2. Overview of the dataset (4 videos and more)
present all users’ sessions and viewing activity. Each row (as in ) represents one user and each cell represents one video. The rows should be interpreted as described in .
Figure 7. An example of a row in . Each row represents one user. This one was active for 4 weeks (4 background colors) and 5 sessions (5 blocks separated by white vertical space). (1st active week) 1st session: Video 2 (watched in Week 2 when it was released – white text). (2nd active week) 2nd session: Video 1 (watched in a week after the release week – black text) and 3rd session: Video 5 (watched in a week after the release week – black text). (3rd active week) 4th session: Video 6 (watched in Week 6 when it was released – white text). (4th active week) 5th session: Video 7 (watched in week after the release week – black text) and Video 8 (watched in Week 8 when it was released – white text). The number on the right of each row indicates the cluster to which the user belongs (see 4.4.6)
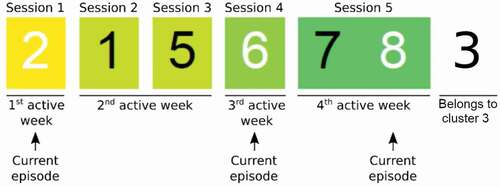
Figure 8. Concurrent registered users’ (N = 269) viewing activity for users watching 4 videos or more (see for explanation)
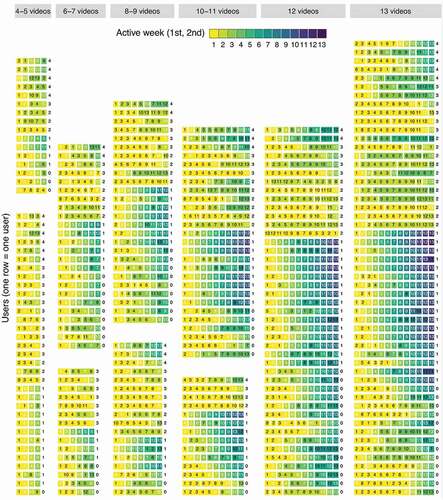
Figure 9. Concurrent unregistered users’ (N = 219) viewing activity for users watching 4 videos or more (see for explanation)
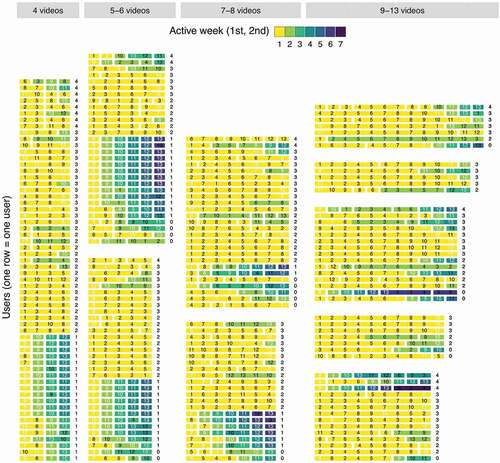
Figure 10. Post-series users’ (N = 94) viewing activity for users watching 4 videos or more (dots at the end of the line indicate registered post-series users)
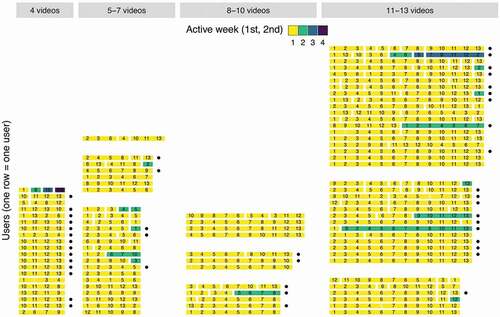
Figure 11. Percentage of users by user category describing users’ behaviors in terms of regularity
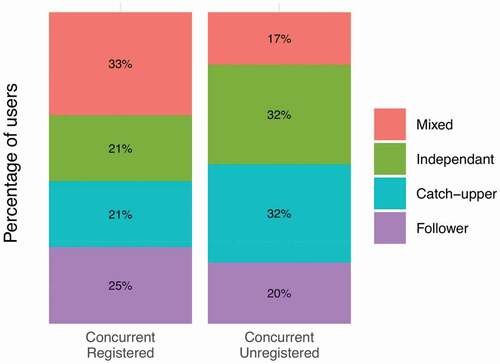
Figure 12. Percentage of users describing users’ behaviors in terms of Intensity
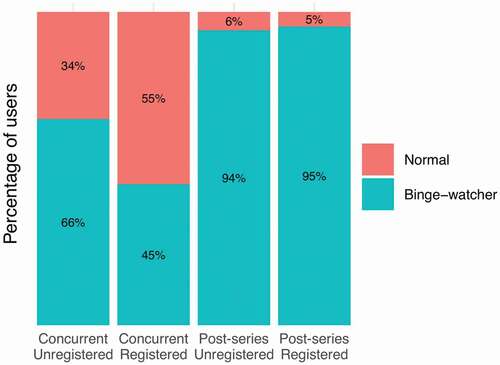
Figure 13. Proportion of binge-watchers for different binge-watching thresholds
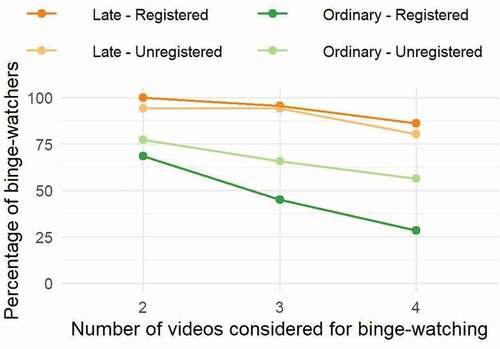
Figure 14. Percentage of users belonging to one of the three categories describing users’ behaviors in terms of order
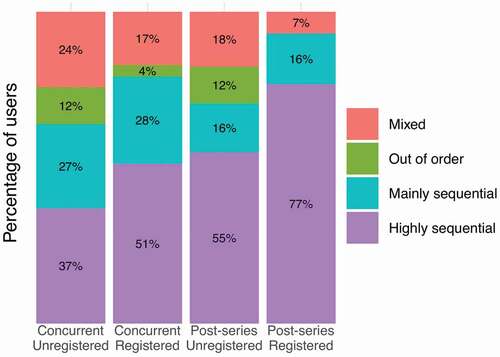
Figure 15. Results of k-means clustering using our 8 metrics. The black line shows the median value for each metric and each cluster
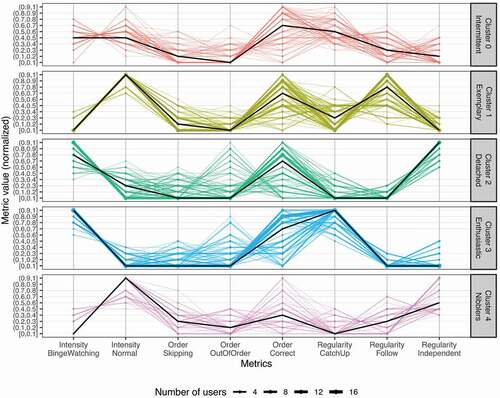
Figure 16. Proportion of registered and unregistered users for each cluster identified by the K-means algorithm with 8 features covering 3 perspectives (Regularity, intensity, order)
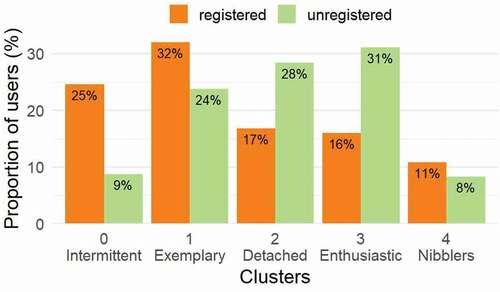
Figure 17. Matching viewing practices discussed in (Merikivi et al., Citation2020) and the ones identified in this article. Figure is adapted from (Merikivi et al., Citation2020): viewing practices from this article and changes made to the original model (number of episodes) are written in blue
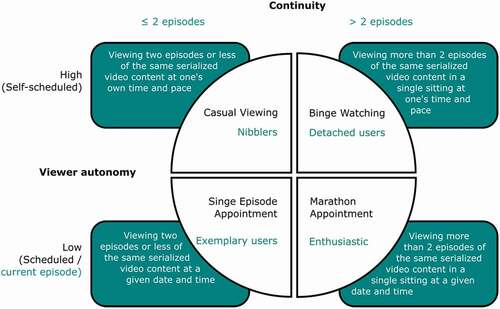
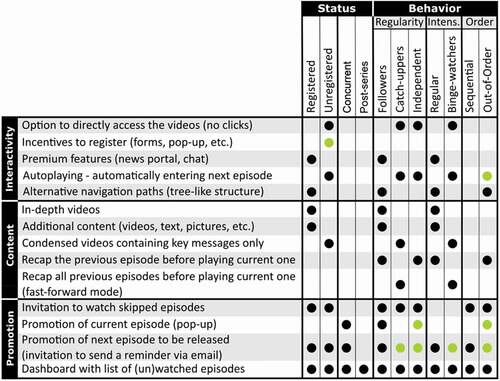
Figure 18. Suggestions of features to increase users’ general and video engagement according to users’ status and behavior (as discussed in 5.5 and 5.6). Dots indicate that the proposed feature (row) would be particularly relevant for the corresponding group of users (column). Black dots indicate features that would reinforce users’ behavior while green dots indicate features that could change users’ behavior (e.g., converting “independent” users into “followers”)
4.4.3. Regularity
4.4.3.1. Metrics
lists custom metrics used for the Regularity perspective. As post-series users could not watch episodes the week they were released, the distinction between following, catch-up, and independent viewing activity is only relevant for concurrent users.
4.4.3.2. Clusters and rules
We performed k-means clustering using ratioFollow, ratioCatchUp and ratioIndependent, which resulted in four suggested clusters. shows the rules used to classify users into these clusters (accuracy = 96.3%; macro-F1 = 0.963).
4.4.3.3. Results
shows the proportion of users belonging to one of the four clusters. The “mixed” users account for the largest group of registered users, suggesting a high heterogeneity in regularity behaviors. The unregistered users were more likely to watch videos independently of the current episode than registered users (diff = 11%, CI [3, 19]), suggesting that they were less dependent on weekly promotions of new episodes. Data also show a higher proportion of unregistered users who catch-up on episodes (32%) rather than follow the series (20%), whereas more registered users followed the series (25%) instead of catching-up (21%).
4.4.4. Intensity
As discussed in Section 2, existing definitions consider binge-watching as viewing two episodes or more during a single session without specifying episodes’ length (Merikivi et al., Citation2020). Trouleau et al. (Citation2016) highlight that the number of episodes in a binge-watching session depends also on episodes’ length and content. Since iOtok videos were on average 11 minutes long (plus cca 5 minutes of pre and post video (inter)activity), watching three episodes of iOtok can take more time than watching two standard sit-com episodes (22 to 24 minutes). We thus consider binge-watching when users watched three episodes (including video) or more. However, since recent studies used a time-based threshold of 1 h (Rigby et al., Citation2018) illustrates how a different threshold affects results.
4.4.4.1. Metrics
lists the custom metrics used for the intensity perspective.
4.4.4.2. Clusters and rules
We performed k-means clustering using ratioNormal and ratioBingeWatch, which resulted in two suggested clusters. shows the rules used to classify users into these clusters (accuracy = 100%; F1-score = 1).
4.4.4.3. Results
4.4.4.3.1. Clusters analysis
shows the percentage of users for each user category who were mainly watching videos in a normal sitting (1 or 2 videos per session) or who were mainly binge-watching (3 videos or more per session). The availability of all episodes encouraged post-series users to binge-watch. For concurrent users, 45% of registered users were mainly binge-watching compared to 66% of unregistered users. The difference 21% (CI [12, 30]) is in line with aforementioned results showing that concurrent unregistered users were catching-up more often or were visiting the web portal independently (maybe also waiting for several episodes to be released).
4.4.4.3.2. Number of episodes for a binge-watching session
shows the percentage of binge-watchers when considering a different number of videos in a binge-watching session. It shows that the same trends can be observed for all thresholds: (i) post-series users binge-watch more than concurrent users; (ii) concurrent unregistered users binge-watch more than concurrent registered users. Differences between concurrent registered users and concurrent unregistered users increase with the number of videos considered.
Trouleau et al.’ proposed a term hyper-binge-watchers (Trouleau et al., Citation2016). Depending on the length and content, these users watched between 4 and 10 episodes at once, with an average number of episodes of 6.8. In the case of iOtok, among users who watched seven videos or more, the proportion of users who hyper-binge-watched at least once was 74% for post-series unregistered users; 58% for post-series registered users; 48% for concurrent unregistered users and 14% for concurrent registered users.
4.4.5. Order
4.4.5.1. Metrics
lists the metrics used for the Order perspective, to understand to what extent users watch videos sequentially. We therefore look at the number of transitions, which refers to the relation between a video and the following video watched (nbTransitions = nbVideos – 1).
4.4.5.2. Clusters and rules
We performed k-means clustering using ratioCorrect, ratioSkipping, and ratioOutOfOrder, which resulted in four suggested clusters. shows the rules used to classify users into these clusters (accuracy = 97.1; macro-F1 = 0.96).
4.4.5.3. Results
shows that the majority of users watched the series in the correct order (highly or mainly sequential): 95% of post-series registered users, 83% of concurrent registered users, 71% of post-series unregistered users, and 64% of concurrent unregistered users. Registered users were more likely to watch the series in a correct order than unregistered users (diff = 16%, CI [9, 23]). In addition, concurrent unregistered users present the highest share of “mixed” order behavior (24%).
4.4.6. Unified perspective of viewing behavior: Combining regularity, intensity, and order
We performed k-means clustering using all derived metrics (, and ). As the Regularity perspective is not relevant for post-series users, only concurrent users were taken into account. The obtained clusters are described in detail in .
The results of this classification are shown in . Users mainly differ in terms of Intensity and Regularity. Patterns for the Order perspective vary less across all clusters, although Clusters 2 and 4 present a higher number of users who watch the videos out of order.
shows a higher proportion of intermittent or exemplary registered users and a higher proportion of detached and enthusiastic unregistered users. This indicates differences in viewing behavior: registered users are active over time (they come back regularly and catch-up), whereas unregistered users are more likely to be active during a short period of time. This is in line with aforementioned results showing a higher proportion of independent users and binge-watchers among unregistered users. Differences between registered and unregistered users are larger for intermittent and enthusiastic users, suggesting that unregistered users were more likely to catch up a high number of episodes than to catch-up a few and come back regularly. Unregistered users were also more likely to watch videos out-of-order.
5. Discussion
This article presents a study of video viewing behavior from a web documentary iOtok of 13 episodes released over 13 weeks. Video in such documentaries is the core element (Almeida & Alvelos, Citation2010) discovered by navigating the interactive content. In order to study video viewing behavior, we divided users in: concurrent users that first visited the portal during the first 13 weeks and post-series users who first visited the portal after all the episodes were released (after 13 weeks). In addition, we segmented these two groups in registered and unregistered users. The main results are summarized in and are discussed in detail in the following text.
Table 9. Main results of the study
5.1. The non negligible number of post-series users and the role of promotion
iOtok was mainly accessed during its promotion by concurrent users (R1), indicating that online news portals, social media, and newsletters sent to registered users played an important promotional role. This result reinforces the one from our previous study (Ducasse et al., Citation2020). However, web documentaries can remain available after the end of the release and promotion period, and our data show that the number of post-series users is not negligible (they account for 11% of users that watched at least one video, and who watched 14% of total video views (R1)).
Google Analytics data showed a drastic decline in visits from social media sites (from 36% during the first 13 weeks to 4% in the post-series period). This reveals an untapped social media potential after the release of the last episode for attracting new users. The peak in the number of post-series users visible in August () correlates with a high number of visits from referral web pages. During that week, the national television website portal rtvslo.si published two postsFootnote19 related to mass tourism in Croatia with links to iOtok posts next to them. Similar peaks have been observed in (Podara et al., Citation2021). This highlights the potential and long-term effectiveness of online news portals for the promotion of web documentaries and emotional value of these posts (Park & Salvendy, Citation2012).
5.2. Relevance of audience segmentation based on differences between and within user categories
Our previous analysis revealed that unregistered users were more prone to quit the web portal before reaching the core video of an episode compared to registered users (Ducasse et al., Citation2020). This study reinforces this result as the average video views per user was substantially higher for registered than for unregistered users (R2). Differences in video watching behavior between registered and unregistered users could be observed for both concurrent and post-series users. Concurrent registered users have a higher total video views (R2), a higher average video views per session (R3), and a higher number of sessions (R4) compared to concurrent unregistered users. The same was observed for post-series users but the differences were not as prominent as for concurrent users. Differences were also observed in terms of viewing behaviors (R6, R7, and R8).
The results show that segmentation of the audience into four user categories is relevant and could serve as a basis for future studies and filmmakers. In fact, audience segmentation is a standard strategy used by digital companies to increase their revenues (a study of around 100 M users revealed that registered users spend 225% more time on site per week, compared to unregistered usersFootnote20). While registered/unregistered segmentation is relevant, recent studies of web portals revealed that further audience segmentation based on users’ motivation is needed in order to better cater to different groups (Villaespesa & Stack, Citation2015) as we discuss in Section 5.6.
5.3. Incentives to register and motivation play an important role in users’ registration
In the case of iOtok, data show a similar ratio of unregistered/registered users for concurrent and post-series users (R2). This suggests that the (i) external incentives from news portal or social media were not the major reason why users registered since the promotion of iOtok after the 13th week was very limited; (ii) restricting access to premium features could have played an important role in motivating users to register; (iii) motivation could also be an important factor as post-series registered users were more engaged (more video views (R2), higher Average Percentage Viewed (R5)) than post-series unregistered users. The latter is based on the fact that premium features were limited (no weekly newsletters, no updates to the portal, the chat was barely used, and even fully functional souvenirs were rarely used). However, and due to the lack of literature on this topic, it is unclear why such incentives to register affect some users more than others. Theories of persuasion (Vargheese et al., Citation2016) could provide a basis for future research. Other studies mention brand awareness, word-of-mouth (WOM) information, and popularity information as motivational factors for registration (Li et al., Citation2013) as well as adding new content (Moniz & Yuan, Citation2014). In contrast to the latter study hinting at that user registration does not increase user participation, our study showed the opposite. Possibly, a combination of factors (brand awareness through promotion, WOM, popularity on social networking sites, and adding new content) played a role in building a user base week by week in the first 13 weeks.
5.4. Serialization’ positive effect on concurrent registered users and no negative effect on unregistered users
One key aspect of iOtok was its serialization over 13 weeks. Concurrent registered and post-series registered users as well as concurrent unregistered and post-series unregistered users have a similar average video views per user, despite the fact that post-series users had access to all videos at once (see 4.2.2). Serialization thus proved an efficient strategy for audience building over time without negatively affecting video views. Moreover, serialization had similar efficiency as giving users access to all episodes. This reinforces the results from our previous work (Ducasse et al., Citation2020) where serialization had an effect on high return rates and higher average time on site compared to other web documentaries.
We expected that concurrent unregistered users would not return regularly to the portal (no weekly newsletter) and would thus watch substantially less videos than post-series unregistered users who had access to all of them. This was not the case and it again indicates that the limited availability of episodes had only a limited negative effect on concurrent unregistered users or that the availability of the episodes was not sufficient to encourage post-series unregistered users to watch substantially more videos. Data also show that post-series unregistered users were more likely to not watch the videos entirely (R5). It can be concluded that post-series unregistered users were typically less engaged of the web documentary compared to other user categories, and that the lack of motivation was more important than the possibility to watch several videos.
In general, registered users have higher average video views per user than unregistered users. Concurrent registered users received a direct incentive (weekly newsletter) which encouraged them to revisit the web portal and can also explain a higher number of sessions (R4). On the contrary, concurrent unregistered users did not receive any direct incentive, which can explain a lower average video views per user (R2), and fewer average video views per session (R3). Both post-series registered and unregistered users had access to the same number of videos and were exposed to the same amount of advertisement. This suggests that registration is a strong marker of engagement. In fact, post-series registered users have a higher average video views per session and have started more sessions than post-series unregistered users (R3, R4).
To sum up, the serialization combined with effective promotion had a positive impact in terms of audience building and reaching a wider audience week after week (cf. (Ducasse et al., Citation2020) where we analyzed how iOtok attracted new registered users during 13 weeks). It also gives filmmakers additional time to adapt the content of the web documentary (features or videos) based on the reception of previous episodes.
5.5. Viewing behaviors in terms of regularity, intensity, and order
Building on the literature, we focused on three aspects of the viewing behavior: regularity, intensity, and order. As viewing behavior is difficult to observe on a few videos only, we focused on users who watched four videos or more.
In Regularity perspective (concurrent users only), we observed three main behaviors (R6): followers (watching regularly on a weekly basis), catch-uppers (less regular, watching the current video as well as a number of previous videos), independent (less regular, watch videos regardless of the current episode), as well as a “mixed” one. Registered users were mainly mixed users or followers, whereas unregistered users were mainly catch-uppers or independent. Registered users received a weekly newsletter encouraging them to follow the series, which can explain the behavior of this group. Unregistered users were not exposed to such incentive, and were thus more likely to catch up when sporadically visiting the portal.
For Intensity, we identified two types of sessions (R7): normal sessions (less than 3 videos per session) and binge-watching sessions (three videos or more). The proportion of binge-watchers was high for concurrent users (45% for registered users and 66% for unregistered users), and much higher for post-series users (95% for registered users and 94% for unregistered users). This was expected as (i) concurrent unregistered users catch-up more than concurrent registered users, and (ii) post-series users had access to all episodes (and videos) at once. In their study of TV shows, Trouleau et al. (Citation2016) report that on average 64% of users binge-watched at least once, which is similar to our results for concurrent users (67% and 70%) but not for post-series users (100% and 94%). This confirms that the availability of episodes strongly encourages binge-watching. Nevertheless, if the threshold for binge-watching moves to four or more episodes (one iOtok episode can be experienced in 15–20 minutes) the results change in line with (Lu et al., Citation2019) stating that if individual episodes are independent as in iOtok (opposed to sequential and connected) users are less likely to binge-watch. This shows that length episodes as well as structure of the series (independent vs sequential) play a crucial role in viewing behavior. Current binge-watching definitions focusing on the number of episodes only should thus be reconsidered.
For Order perspective, we identified four clusters (R8): highly sequential (80% or more of the transitions between videos in a series are correct), mainly sequential (50% or more transitions are correct), out-of-order (60% or more transitions are incorrect) or mixed. The majority of users followed the series in a highly or mainly sequential manner, while 12% of unregistered users watched videos out-of-order. Trouleau et al. (Citation2016) report that users are more likely to watch the episodes in a sequential order during normal sessions than during binge-watching sessions, and that out-of-order behavior happens mostly in independent series as in iOtok in half binge-watching sessions. In our study, registered users whose sessions were mainly normal, were more likely to watch episodes in a sequential order than unregistered users, who were mainly binge-watching (R7). However, we did not record such a high proportion of out-of-order watching despite the episodes’ independence, which is considered as more likely to be binge-watched (Lu et al., Citation2019).
The behavior for post-series users shows that the majority of them were binge-watchers as well as highly sequential, which again contradicts the results from (Lu et al., Citation2019; Trouleau et al., Citation2016). In (Ducasse et al., Citation2020) we discussed several reasons that could have led users to watch the episodes sequentially despite the stories being independent from one another in terms of narration: (i) the episodes were numbered; (ii) users had to click on left/right arrows to navigate between the episodes; and (iii) the series was serialized. A different design could have led to a less sequential viewing order.
5.6. Multidimensional clustering reveals five distinct groups of concurrent users (R10)
We performed multidimensional clustering for concurrent users only, as post-series users could not exert different behaviors in terms of regularity (they could not catch-up nor follow the series). Five groups revealed by k-means clustering algorithm using all eight metrics show that users mainly differ in terms of Regularity and Intensity. The analysis shows two types of engagement: (i) long-term engagement with regular visits to watch the current episode and limited binge-watching to catch-up on episodes (intermittent and exemplary users); (ii) short-term engagement with more independent or catch-up sessions and substantial binge-watching (detached and enthusiastic users). The last and smaller group mainly includes users who nibble: watch a few videos at once and mainly independently of the current episode. While the majority of registered users pertain to the first two groups (long-term engagement), the majority of unregistered users pertain to the other two groups (short-term engagement).
These groups can also be discussed in light of existing TV viewing practices (Merikivi et al., Citation2020) on two dimensions: continuity (one episode or more) and viewer autonomy (self-schedule vs scheduled television). Although the idea of a “scheduled” episode is not fully correct for iOtok due to online distribution, one could consider that users watched the episode on a scheduled basis if they watched it during the week it was released. Considering binge-watching as the viewing of three videos or more per session, there is an overlap between our clusters and Merikivi et al.’s quadrant, as illustrated in .
It is worth noting that: (i) enthusiastic users watch the current episode (i.e. scheduled time) but also past episodes (i.e. unscheduled); (ii) the “intermittent” group exert a mix of behaviors (following and catching up, normal and binge-watching sessions) and therefore overlaps with all four quadrants. Despite these minor differences, this article therefore provides evidence-based support to the theoretical work presented by Merikivi et al. (Citation2020). The results also show that even within one group of users further segmentation (beyond registered and unregistered user) can further cater to different ways of consuming web content (Calvo-Porral et al., Citation2019; Villaespesa & Stack, Citation2015).
5.7. Implication for the design of serialized web documentaries
aggregates a number of considerations and evidence-based recommendations for the promotion, distribution, design of web documentaries, merging our previous findings (Ducasse et al., Citation2020), referred as Study 1, and this article, referred as Study 2. The overarching goal of these features is to cater for different groups of users, improve user experience and, consequently, the amount of content that is consumed.
Table 10. Considerations and recommendations
6. Limitations and future work
The project such as iOtok is influenced by various stakeholders and researchers are just one part of these, which should be taken into account in future projects to mitigate for possible shortcomings. Due to developers’ decisions and a delay in the implementation, some data for iOtok could not be collected (e.g., unregistered users’ interactions with the web portal during the first weeks). Therefore, some results (average video views per user, average video views per session) only take into account a subset of concurrent unregistered users. Nevertheless, the number of users for these groups is still high (N = 3210 unregistered users) and we strived to make it clear when data were missing as well as to provide the number of observations for each measure. Therefore, the total (average) video views (per user) that we report in Sections 4.1.2 and 4.2.2 are low estimations. With all data collected, the serialization would therefore demonstrate higher effectiveness than the one reported in Section 5.4. Another limitation is not being able to match the IDs of unregistered users with their nicknames after they registered. This prevents us from analyzing in detail how newly registered users behave or what motivates them to register, and remains to be researched in the future.
The viewing behavior analysis was conducted for regularity, intensity, and order. We used a combination of manual coding and k-means clustering to define a set of custom metrics and thresholds used. How generalizable these custom metrics and thresholds are in the context of other web documentaries remains to be answered. However, the method proved vital in revealing different user profiles (e.g., followers, binge-watchers, independent, etc.) and helped us highlight further viewing behavior differences between groups (e.g., post-series users binge-watched more than concurrent users, etc.). This greatly contributed to implications for the design of serialized web documentaries, which would not have been possible with standard manual coding approaches.
There are some questions that we did not address. It would be interesting to assess the social impact of the documentary, e.g., by measuring the amount of press coverage or investigating whether the documentary led to new policies or to the creation of communities (Diesner et al., Citation2014; Harmony Institute, Citation2012; Hofman & Hughes, Citation2018; Nash & Corner, Citation2016; Terry, Citation2019). Such a study could be framed within the impact frameworkFootnote21 defining four levels of impact: changing minds, behaviors, building communities, and changing structures. Interestingly, we observed a revival of activity on the Facebook pages as a feature-length version of iOtok was being released in cinemas. This shows the potential of social media to support and build online communities over time and calls for additional research on the topic.
It would also be interesting to investigate the level of user engagement and the role of interactivity not only in terms of time-on-site or video views but also in terms of emotions, personal interest, and understanding (e.g., how does interactivity affect information retention, understanding of social structure and emotional response of users?) in order to complement existing work on non-interactive documentaries (Beattie et al., Citation2011; Bieniek-Tobasco et al., Citation2019; Vasi et al., Citation2015).
7. Conclusion
In this article, we analyzed the consumption of videos of an interactive and serialized web documentary with episodes released on a weekly basis over 13 weeks. We assessed engagement using standard metrics (watch time and average percentage viewed) and provided an in-depth analysis of most engaged users’ viewing behaviors using a combination of manual coding and k-means clustering. One key result is that the serialization of the web documentary, combined with effective promotion, enabled long-term audience building (over 13 weeks) without having a negative effect on video views. Results also confirmed differences in engagement between registered and unregistered users, which we also observed in a previous study, the latter being less engaged. Data also revealed that the web documentary remained active after the release of the last episode, suggesting that long-term audience building is relevant for web documentaries (Appendix A). Finally, we identified several viewing behaviors based on the three aspects of the viewing experience (regularity, intensity, and order). We provide simple rules to categorize users, which we iteratively validated using k-means clustering instead of manual coding only. Besides segmenting concurrent users (the ones that started to watch during the first 13 weeks) and post-series users (the ones that started to watch after 13th week) in registered and unregistered, we identified 5 different types of users: intermittent (come every other week and catch-up), exemplary (follow the series), detached (come a couple of times and binge-watch), enthusiastic (hyper binge-watchers), and nibblers (come irregularly and watch the series in any order). Based on these results, we provide evidence-based recommendations and considerations for the design and promotion of web documentaries.
Acknowledgments
The authors would like to thank Miha Čelar (documentary filmmaker), CORA development team (iOtok website) and developers of Weekend Labs (iOtok mobile app).
Disclosure statement
No potential conflict of interest was reported by the author(s).
Additional information
Funding
Notes on contributors
Julie Ducasse
Julie Ducasse is a post-doctoral researcher at the University of Primorska, in Slovenia, where she works on interactive documentaries and Augmented and Virtual Reality. During her PhD at the University of Toulouse, France, she worked on the accessibility of maps for visually impaired people.
Matjaž Kljun
Matjaž Kljun received the Ph.D. degree in computer science from Lancaster University, U.K. He is an Associate Professor within the Department of Information Sciences and Technologies and co-directs the HICUP Lab, University of Primorska. His research interests span across various fields related to human-computer interaction with a focus on personal information management.
Nuwan T. Attygalle
Nuwan T. Attygalle is a Ph.D, student candidate in the Faculty of mathematics, natural sciences and information technologies. He is interested in machine learning and its potential impact on various aspects within the field of human-computer interaction. His research is currently focused on visualising cultural references in live or recorded shows.
Klen Čopič Pucihar
Klen Čopič Pucihar received the Ph.D. degree in computer science from Lancaster University, U.K. He is an Assistant Professor with the Department of Information Sciences and Technologies, and co-directs the HICUP Lab, University of Primorska. His research interests include augmented, mixed and virtual reality, and ubiquitous computing.
Notes
4. https://www.lemonde.fr/asie-pacifique/visuel/2008/11/17/voyageau-bout-du-charbon_1118477_3216.html.
14. https://morningconsult.com/2018/11/06/most-young-adults-have-an-appetite-for-binge-watching-shows/.
15. If a user launched the same video more than once during the same session, we took into consideration only the video view with the longest viewing time.
16. Note: The data was checked to follow the main assumptions of k-means clustering and gaussian mixture clustering algorithms (e.g., similar size and spherical shape of clusters, and normal distribution of data respectively).
References
- Alkarimeh, B. (2019). User and interactive documentary: An experimental study of user engagement with interactive documentary. Université de Toulon. https://hal.archives-ouvertes.fr/tel-02276820/
- Almeida, A., & Alvelos, H. (2010). An interactive documentary manifesto. Lecture notes in computer science (including subseries lecture notes in artificial intelligence and lecture notes in bioinformatics): Vol. 6432 LNCS (pp. 123–128). ICIDS 2010 - Joint International Conference on Interactive Digital Storytelling (pp. 123–128). Berlin, Heidelberg: Springer. https://doi.org/https://doi.org/10.1007/978-3-642-16638-9_16
- Altman, E., & Jiménez, T. (2019). Measuring audience retention in YouTube. Proceedings of the 12th EAI international conference on performance evaluation methodologies and tools (pp. 79–85). New York, NY: Association for Computing Machinery (ACM). https://doi.org/https://doi.org/10.1145/3306309.3306322
- Aston, J., & Gaudenzi, S. (2012). Interactive documentary: Setting the field. Studies in Documentary Film, 6(2), 125–139. https://doi.org/https://doi.org/10.1386/sdf.6.2.125_1
- Aufderheide, P. (2015). Interactive documentaries: Navigation and design. Journal of Film and Video, 67(3–4), 69–78. https://doi.org/https://doi.org/10.5406/jfilmvideo.67.3–4.0069
- Beattie, G., Sale, L., & Mcguire, L. (2011). An inconvenient truth? Can a film really affect psychological mood and our explicit attitudes towards climate change? Semiotica, (2011(187), 105–125. https://doi.org/https://doi.org/10.1515/semi.2011.066
- Bieniek-Tobasco, A., McCormick, S., Rimal, R. N., Harrington, C. B., Shafer, M., & Shaikh, H. (2019). Communicating climate change through documentary film: Imagery, emotion, and efficacy. Climatic Change, 154(1–2), 1–18. https://doi.org/https://doi.org/10.1007/s10584-019-02408-7
- Calvo-Porral, C., Pesqueira-Sanchez, R., & Faiña Medín, A. (2019). A clustered-based categorization of millennials in their technology behavior. International Journal of Human–Computer Interaction, 35(3), 231–239. https://doi.org/https://doi.org/10.1080/10447318.2018.1451429
- Castro, D., Rigby, J. M., Cabral, D., & Nisi, V. (2021). The binge-watcher’s journey: Investigating motivations, contexts, and affective states surrounding Netflix viewing. Convergence, 27(1), 3–20. https://doi.org/https://doi.org/10.1177/1354856519890856
- Diesner, J., Kim, J., & Pak, S. (2014). Computational impact assessment of social justice documentaries. The Journal of Electronic Publishing, 17(3). https://doi.org/https://doi.org/10.3998/3336451.0017.306
- Dubois, F. (2018). Interactivity as a key feature redefining documentary reality. Images the International Journal of European Film, Performing Arts and Audiovisual Communication, 21(30), 31–44. https://doi.org/https://doi.org/10.14746/i.2017.30.03
- Ducasse, J., Kljun, M., & Čopič Pucihar, K. (2020). Interactive web documentaries: A case study of audience reception and user engagement on iOtok. International Journal of Human–Computer Interaction, 36(16), 1558–1584. https://doi.org/https://doi.org/10.1080/10447318.2020.1757255
- Epstein, M., & Knowlton, M. (2015). The promise and realities of creating immersive media projects - Best practises. Filmmaker Magazine.
- Fisher, J. A. (2016). Utilizing the mixed reality cube taxonomy for interactive documentary research. Proceedings of the 1st international workshop on multimedia alternate realities (pp. 9–14). New York, NY: Association for Computing Machinery (ACM). https://doi.org/https://doi.org/10.1145/2983298.2983299
- Flayelle, M., Maurage, P., Di Lorenzo, K. R., Vögele, C., Gainsbury, S. M., & Billieux, J. (2020). Binge-watching: What do we know so far? A first systematic review of the evidence. Current Addiction Reports, 7(1), 44–60. https://doi.org/https://doi.org/10.1007/s40429-020-00299-8
- Forceville, C. (2017). Interactive documentary and its limited opportunities to persuade. Discourse, Context & Media, 20, 218–226. https://doi.org/https://doi.org/10.1016/j.dcm.2017.06.004
- Galloway, D., McAlpine, K. B., & Harris, P. (2007). From Michael Moore to JFK reloaded: Towards a working model of interactive documentary. Journal of Media Practice, 8(3), 325–339. https://doi.org/https://doi.org/10.1386/jmpr.8.3.325_1
- Harmony Institute. (2012). HI score: Towards a new metric of influence. https://web.archive.org/web/20120731010208/http://harmony-institute.org/therippleeffect/2012/06/27/hi-score-towards-a-new-metric-of-influence/
- Hofman, K., & Hughes, K. (2018). Protecting the great barrier reef: Analysing the impact of a conservation documentary and post-viewing strategies on long-term conservation behaviour. Environmental Education Research, 24(4), 521–536. https://doi.org/https://doi.org/10.1080/13504622.2017.1303820
- Jackson, J. E. (2005). A user’s guide to principal components (Vol. 587). John Wiley & Sons.
- Li, T., Pavlou, P., & dos Santos, G. (2013). What Drives Users’ Website Registration? A Randomized Field Experiment. The 34th International Conference on Information Systems (ICIS). Association for Information Systems (AIS), Atlanta, Georgia, United States.
- Lu, J., Karmarkar, U., & Venkatraman, V. (2019). Planning to Binge: How Consumers Choose to Allocate Time to View Sequential Versus Independent Media Content”. In: Gneezy A., Griskevicius V., and Williams P. (Eds.), ACR'17 Advances in Consumer Research, Volume 45 (pp. 96–100). Duluth, MN: Association for Consumer Research. https://doi.org/http://dx.doi.org/10.2139/ssrn.3493755
- Maggi, L., Gkatzikis, L., Paschos, G., & Leguay, J. (2018). Adapting caching to audience retention rate: Which video chunk to store? Computer Communications, 116, 159–171. https://doi.org/https://doi.org/10.1016/j.comcom.2017.11.015
- Merikivi, J., Bragge, J., Scornavacca, E., & Verhagen, T. (2020). Binge-watching serialized video content: A transdisciplinary review. Television & New Media, 21(7), 697–711. https://doi.org/https://doi.org/10.1177/1527476419848578
- Moniz, K., & Yuan, Y. (2014). Reaching critical mass: The effect of adding new content on website visitors and user registration. International conference on trustworthy computing and services (pp. 359–369). Berlin, Heidelberg: Springer. https://doi.org/https://doi.org/10.1007/978-3-662-47401-3_47
- Nash, K. (2014a). Clicking on the world: Documentary representation and interactivity. In Nash K., Hight C., Summerhayes C. (Eds.), New documentary ecologies (pp. 50–66). London: Palgrave Macmillan. https://doi.org/https://doi.org/10.1057/9781137310491_4
- Nash, K. (2014b). What is interactivity for? The social dimension of web-documentary participation. Continuum, 28(3), 383–395. https://doi.org/https://doi.org/10.1080/10304312.2014.893995
- Nash, K. (2014c). Strategies of interaction, questions of meaning: An audience study of the NFBs Bear 71. Studies in Documentary Film, 8(3), 221–234. https://doi.org/https://doi.org/10.1080/17503280.2014.958904
- Nash, K. (2018). Virtually real: Exploring VR documentary. Studies in Documentary Film, 12(2), 97–100. https://doi.org/https://doi.org/10.1080/17503280.2018.1484992
- Nash, K., & Corner, J. (2016). Strategic impact documentary: Contexts of production and social intervention. European Journal of Communication, 31(3), 227–242. https://doi.org/https://doi.org/10.1177/0267323116635831
- Nogueira, P. (2015). Ways of Feeling: Audience’s meaning making in interactive documentary through an analysis of Fort McMoney. Punctum. International Journal of Semiotics, 1(1), 79–93. https://doi.org/https://doi.org/10.18680/hss.2015.0006
- O’Flynn, S. (2012). Documentary’s metamorphic form: Webdoc, interactive, transmedia, participatory and beyond. Studies in Documentary Film, 6(2), 141–157. https://doi.org/https://doi.org/10.1386/sdf.6.2.141_1
- Park, T., & Salvendy, G. (2012). Emotional factors in advertising via mobile phones. International Journal of Human-Computer Interaction, 28(9), 597–612. https://doi.org/https://doi.org/10.1080/10447318.2011.641899
- Pettengil, J. (2017). Bear 71: How interactivity affects user experience in interactive documentaries. Ball State University. http://cardinalscholar.bsu.edu/handle/123456789/200807%09
- Pittman, M., & Sheehan, K. (2015). Sprinting a media marathon: Uses and gratifications of binge-watching television through Netflix. First Monday, 20(10). https://doi.org/https://doi.org/10.5210/fm.v20i10.6138
- Podara, A., Giomelakis, D., Nicolaou, C., Matsiola, M., & Kotsakis, R. (2021). Digital storytelling in cultural heritage: Audience engagement in the interactive documentary new life. Sustainability, 13(3), 1193. https://doi.org/https://doi.org/10.3390/su13031193
- Rigby, J. M., Brumby, D. P., Cox, A. L., & Gould, S. J. (2018). Old habits die hard: A diary study of on-demand video viewing. CHI EA 18’ Extended abstracts of the 2018 CHI conference on human factors in computing systems (pp. 1–6). New York, NY: Association for Computing Machinery (ACM). https://doi.org/https://doi.org/10.1145/3170427.3188665
- Rubenking, B., Bracken, C. C., Sandoval, J., & Rister, A. (2018). Defining new viewing behaviours: What makes and motivates TV binge-watching? International Journal of Digital Television, 9(1), 69–85. https://doi.org/https://doi.org/10.1386/jdtv.9.1.69_1
- Shim, H., Lim, S., Jung, E. E., & Shin, E. (2018). I hate binge-watching but I can’t help doing it: The moderating effect of immediate gratification and need for cognition on binge-watching attitude-behavior relation. Telematics and Informatics, 35(7), 1971–1979. https://doi.org/https://doi.org/10.1016/j.tele.2018.07.001
- Sung, Y. H., Kang, E. Y., & Lee, W.-N. (2018). Why do we indulge? Exploring motivations for binge watching. Journal of Broadcasting & Electronic Media, 62(3), 408–426. https://doi.org/https://doi.org/10.1080/08838151.2018.1451851
- Terry, B. M. (2019). The evolution of the documentary film as an instrument of social change. Toronto, Canada: York University.
- Trouleau, W., Ashkan, A., Ding, W., & Eriksson, B. (2016). Just one more: Modeling binge watching behavior. Proceedings of the 22nd ACM SIGKDD international conference on knowledge discovery and data mining (pp. 1215–1224). New York, NY: Association for Computing Machinery (ACM). https://doi.org/https://doi.org/10.1145/2939672.2939792
- Vargheese, J. P., Sripada, S., Masthoff, J., & Oren, N. (2016). Persuasive strategies for encouraging social interaction for older adults. International Journal of Human-Computer Interaction, 32(3), 190–214. https://doi.org/https://doi.org/10.1080/10447318.2016.1136176
- Vasi, I. B., Walker, E. T., Johnson, J. S., & Tan, H. F. (2015). “No fracking way!” Documentary film, discursive opportunity, and local opposition against hydraulic fracturing in the United States, 2010 to 2013. American Sociological Review, 80(5), 934–959. https://doi.org/https://doi.org/10.1177/0003122415598534
- Vázquez-Herrero, J., & Gifreu-Castells, A. (2019). Interactive and transmedia documentary: Production, interface, content and representation. Studies in Systems, Decision and Control, 154, 113–127. https://doi.org/https://doi.org/10.1007/978-3-319-91860-0_8
- Villaespesa, E., & Stack, J. (2015). Finding the motivation behind a click: Definition and implementation of a website audience segmentation. Museums and the Web.
- Weidle, F. (2018). How to reconcile that flinch: Towards a critical analysis of documentary situations in 360° and VR environments. Participations: Journal of Audience & Reception Studies, 15(1), 412–426. https://www.participations.org/Volume%2015/Issue%201/contents.htm
Appendix A.
Glossary
Average Percentage Viewed (APV) – the ratio between the average view duration of a video and its actual length
Average video views – total video views for a class (user, group of users, user category, video, session) divided by the number of exemplars in that class
Average view duration – the ratio between watch time and video views
Binge-watching session – a session in which 3 or more videos were watched
Catching-up session – a session in which the video of the current and previous episodes are watched
Concurrent users – users who first accessed the web portal during the 13 weeks of the distribution
Detached users – users who come a few times and watch several videos at once in any order
Enthusiastic users – users who watch the current episode as well as past episodes at once (not always in correct order), without coming back regularly.
Engagement – in our example we considered watch time and average percentage viewed to describe the level of engagement; more generally time spent and interaction with the site and particular parts of it over a period of time (short- or long term) is considered
Exemplary users – users who try to follow the series and come to the website to watch the current episode or the episodes they missed.
Following session – a session in which only the video of the current episode released in that week is watched
Independent session – a session in which the video from the current episode is not watched
Intensity – indicating the number of videos per session: normal session, binge-watching session
Intermittent users – users who do not come every week, but when they do, they tend to catch-up
Nibblers – users who do not follow the series very regularly and they only consume a few videos at once
Normal session – a session in which 1 or 2 videos were watched
Order (of watching) – whether videos are watched in order they were released or not: correct order, skipping episodes (still watching in order), out-of-order watching
Post-series users – users who first accessed the portal after all episodes were released (17 April 2017– 26 February 2018)
Registered users – users who created an account on the web portal and received a weekly newsletter
Regularity – indicating whether videos were watched on a weekly basis (following, catching-up, independent session)
Session – a new session is considered if no other video started for 30 minutes or more
Total video views – a sum of video views for all 13 videos either overall, for a user, for a group of users, for user category, for a period, etc.
Unregistered users – users who did not create an account
User category – one of the four groups of users: concurrent registered, concurrent unregistered, post-series registered, post-series unregistered
Video Engagement – a standard metric describes the percentage of viewers who make it to 0%, 10%, 20%, … 90% (these marks can be different for different companies) of a particular video
Video views – the number of times a video was watched for 30 seconds or more
View(ing) duration – the time elapsed between launching the video and the next event (video closed, finished, a click on a link on the page)
Viewing activity – the actual pattern revealing the order of viewing videos and weeks when they were viewed
Viewing session – see Session
Watch time – total time spent by users watching the video