?Mathematical formulae have been encoded as MathML and are displayed in this HTML version using MathJax in order to improve their display. Uncheck the box to turn MathJax off. This feature requires Javascript. Click on a formula to zoom.
Abstract
The present work compares the two-alternative forced choice (2AFC) task to rating scales for measuring aesthetic perception of neural style transfer-generated images and investigates whether and to what extent the 2AFC task extracts clearer and more differentiated patterns of aesthetic preferences. To this aim, 8250 pairwise comparisons of 75 neural style transfer-generated images, varied in five parameter configurations, were measured by the 2AFC task and compared with rating scales. Statistical and qualitative results demonstrated higher precision of the 2AFC task over rating scales in detecting three different aesthetic preference patterns: (a) convergence (number of iterations), (b) an inverted U-shape (learning rate), and (c) a double peak (content-style ratio). Important for practitioners, finding such aesthetically optimal parameter configurations with the 2AFC task enables the reproducibility of aesthetic outcomes by the neural style transfer algorithm, which saves time and computational cost, and yields new insights about parameter-dependent aesthetic preferences.
1. Introduction
The rising public and academic awareness of computer-generated arts over the past decade (DiPaola & Gabora, Citation2009; McCormack et al., Citation2019) has increased the acceptance of creativity generated by computers (McCormack & D’Inverno, Citation2012). The debate over its legitimacy has been dominated by the question whether its outcome can be deemed aesthetic (Chamberlain et al., Citation2018). The relevance of this question is further evidenced by the emerging new academic field of computational aesthetics (Bo et al., Citation2018) which aims at the generation and the evaluation of visually aesthetic expressions. As artificial intelligence advances in the generative models for visual artefacts, a new point of interest has become the aesthetic value of deep learning generated images.
1.1. Measurement of aesthetics
Measuring the aesthetic value appears particularly interesting in the context of HCI for several reasons. The perceived aesthetics of visual artefacts are known to induce pleasurable experiences (Blijlevens et al., Citation2017; Graf & Landwehr, Citation2017; Hekkert, Citation2006) and thereby increase the usability and likeability of products (Hassenzahl, Citation2001; Jordan, Citation2002; Norman, Citation2004). For commercial applications, it would be particularly interesting to find an “optimal” configuration of the image-generating algorithm to enable the reproducibility of desired outcomes, where “optimal” refers to the most aesthetically perceived result among the compared configurations. This should be possible under the assumption that the perceptual responses to the aesthetic outcome of different parameter configurations are measurable. Measuring such perceptual responses would allow us not only to find the configuration of maximum achievable aesthetics but also to detect patterns that reveal potentially new insights on aesthetic preferences. Therefore, the assessment of aesthetic perception of computer-generated arts is highly relevant for HCI.
1.2. Problematic of rating scales measuring aesthetics of neural style transfer
The computer-generated arts have risen in popularity partly due to a particular generative deep learning algorithm, neural style transfer, that caught wide public attention at the DeepArt exhibition at the 2017 Neurips conference. Gatys et al. (Citation2015) introduced this algorithm to show how the artistic style of painters can be transferred to another image. This algorithm extracts the structural information of the input image (e.g., the facial structure and body contour), learns the color and texture information from the style image, and then renders the semantic structure of the input image in the color and texture of the style image.
Since its introduction in 2015, neural style transfer has been developed further in many variants to improve specific visual challenges (T. Q. Chen & Schmidt, Citation2016; Choi, Citation2018; H. Huang et al., Citation2017; X.-C. Liu et al., Citation2017; Zhu et al., Citation2017). Despite this rapid technical evolution, the majority of studies are methodologically flawed in the measurement of aesthetics. In a comparison of neural style transfer algorithms in 2018, Li (Citation2018) noted that the most common measurement method was the self-evaluation by the authors (e.g., Cui et al., Citation2018; Ghiasi et al., Citation2017; Ulyanov et al., Citation2016, Citation2017; Wang & Tan, Citation2018). This constitutes a severe selection bias because the assessment by the authors is subjective and positively biased towards their own results (“cherry picking”).
Only a few studies on neural style transfer avoided subjective self-evaluations, and assessed their outcomes by user surveys (D. Chen et al., Citation2018; H. Huang et al., Citation2017; Luan et al., Citation2017; Risser et al., Citation2017). In these surveys, the most frequently used measurement instruments are rating scales (e.g., Likert scales) which are known to be prone to the acquiescence bias (Friborg et al., Citation2006; Knowles & Nathan, Citation1997). The acquiescence bias is a response bias that tends to regress to the previously selected answers in a survey, thus producing the same or similar responses on subsequent ratings (Ray, Citation1983). An additional difficulty for rating scales is to differentiate the visual output of neighboring parameter configurations which can be too subtle to distinguish by normal eye sight.
The same problematic applies for ranking scales which are occasionally used as alternative to rating scales. The inherent problem of ranking is that it neglects how close or far two assessments are in reality, losing measurement precision. Furthermore, the ranking scale forces the viewer to create a relative order, which imposes a strong cognitive demand because the subject has to assess all presented stimuli at the same time (Palmer et al., Citation2013). In contrast, the 2AFC task restricts the cognitive load to one comparison at a time (Mantiuk et al., Citation2012).
1.3. The advantages of the two-alternative choice task
Because rating scales lack differentiation of subtle visual differences and are prone to the acquiescence bias, the present work suggests to use the two-alternative forced choice (2AFC) task (Thurstone, Citation1927) instead. The 2AFC task specifies the assessment of two simultaneously presented samples on either of two available choices, e.g., aesthetic vs. non-aesthetic (Macmillan & Creelman, Citation2004). It was originally used in psychophysical research to detect perception thresholds (Fechner et al., Citation1966), and has since been extended to analyze complex stimuli such as decision making (Bogacz et al., Citation2006) or auditory stimuli (Delplanque et al., Citation2019).
In addition to the lack of acquiescence bias, further advantages of the 2AFC task over rating scales are the absence of memory load and response bias (Palmer et al., Citation2013), as well as significantly reduced fatigue and carryover effects (Yang & Ng, Citation2017).
1.4. Research question
Based on the previous considerations, the present work aims to close two gaps in the literature. The first gap is that despite its proven qualities, the 2AFC task has not been applied yet to measure the aesthetic perception of computer-generated arts in general, and of neural style transfer-generated images in particular. The second gap is the lack of direct comparisons in the literature between the 2AFC task and rating scales. The present work aims to close these gaps by applying the 2AFC on neural style generated images, and comparing the aesthetic preference patterns with those extracted by rating scales. Notwithstanding, the goal of this study is not to find generalizable aesthetic patterns but to test the 2AFC task in its psychometric quality. The focus is therefore on investigating whether the 2AFC task responds more sensitively than the commonly used rating scales, and whether this results in more differentiated, clearer or more pronounced patterns. In light of the above considerations, the research question can be formulated as follows.
RQ: Can the 2AFC task detect more differentiated patterns than rating scales when measuring aesthetic preferences of computer-generated images?
With this research question, the present work addresses the methodological problem in previous studies on neural style transfer of qualitative subjective assessment by authors and acquiescence bias of rating scales. These problems are expected to not occur with the 2AFC task because of the way stimuli are presented (pairwise comparisons) and selected (forced choice).
The 2AFC task could be used to analyze differences between any kind of images. However, applying it to images generated by a configurable image-generating algorithm, such as neural style transfer, makes it particularly interesting. As the 2AFC task empirically identifies the optimal configuration among the given stimuli with more precision than the rating scale (as will be shown in this study), the results become reproducible, given similar stimuli and sample. The higher precision of the 2AFC task derives from the fact that it can detect perceptual differences even when people have difficulty to make conscious decisions, e.g., for very similarly looking stimuli like in the present study. This effect seems even more pronounced with judgments for which no objective criteria exist, such as for aesthetic evaluation. Taken together, the application of the 2AFC task on various parameter configurations allows to find the configuration that maximizes aesthetics. This knowledge is practically relevant as it allows to create a degree of reproducibility on the very subjective perception of aesthetics.
The practical relevance of this endeavor is further elevated by the emerging trend in the advertising industry of targeted advertising (S. Chen, Citation2020), i.e., the customization of promotional material to more differentiated target audiences. This trend, together with the shift from print to online media (Sridhar & Sriram, Citation2013), might facilitate that advertising will be increasingly shaped by new technologies like deep learning in the near future (Gharibshah et al., Citation2020). Important content domains where deep learning could be applied are promotional commercials and banners in TV and social media that feature celebrities known from acting, singing, sports or other entertainment industries. In these content domains, a neural style transfer algorithm would allow designers to customize the promotional material easily and quickly to specific color and texture preferences of several differentiated target audiences.
In summary, the present work exemplifies how to respond to the recently emerging HCI challenges of augmenting human cognition and applying AI for personalization to human needs (Stephanidis et al., Citation2019).
2. Related works
2.1. Neural style transfer
Since its introduction in 2015 by Gatys et al. (Citation2015), neural style transfer has gained widespread popularity both academically and industrially (e.g., http://deepart.io). An abundance of neural style transfer algorithms has emerged that widely differ in model architectures and purposes (Jing et al., Citation2020). Originally, neural style transfer was demonstrated with common photo motifs like houses or landscapes (Gatys et al., Citation2016) or doodles (Champandard, Citation2016). Neural style transfer was later applied to more complex topics such as fashion (Jiang & Fu, Citation2017), videos (H. Huang et al., Citation2017; Zhu et al., Citation2017) and artistic improvisation (Choi, Citation2018).
For high structural information motifs, like the portrait images in the present study, computational time is higher and mainly determined by the number of iterations. This is a concern that research already addressed by developing so-called feedforward networks that aimed to reduce computational time (T. Q. Chen & Schmidt, Citation2016). Such feedforward networks are faster than optimization algorithms by applying pretrained models for stylization which only requires a single forward propagation pass. However, they require substantial training time for generating these pretrained models on many variations of a specific style image.
Although the multitude of available neural style transfer algorithms is difficult to categorize without going into very technical details, a characteristic conceptual distinction between all algorithm variants can be made on the loss function, i.e., the function which the deep learning models aims to minimize by gradient descent. The loss function in neural style transfer is commonly composed of two loss terms (for the content and the style loss), and often contains a purpose-specific additional loss term and/or a regularization term. Examples for purpose-specific loss terms are perceptual loss terms to replace per-pixel losses by higher-level features (J. Johnson et al., Citation2016), histogram loss terms (Risser et al., Citation2017) to enable texture synthesis, a depth loss term to increase depth awareness (X.-C. Liu et al., Citation2017), or a temporal consistency loss term for neural style transfer of videos that reduces the arbitrary changes between consecutive video frames (M. Ruder et al., Citation2016). Applications that require a purpose-specific regularization term include photorealism (Luan et al., Citation2017), or an input noise factor k (Ulyanov et al., Citation2016). Another strategy for noise reduction is to use the parameter total variation which had occasionally been used (T. Q. Chen & Schmidt, Citation2016). The present study disregarded any of the above parameters because they were specific to the model architecture and thus impeding the study’s goal of reproducibility.
2.2. Aesthetic evaluation
Visual aesthetics has been taught not only in fine arts, design, and computer vision, but also in psychology from a perceptual lens as aesthetic preferences. According to Palmer et al. (Citation2013), aesthetics is “the study of mental processes that underlie disinterested evaluative experiences,” and such evaluation can be characterized along a continuum of emotional valence. Several studies using neuroimaging (Cela-Conde et al., Citation2011) or fMRI (Vartanian & Goel, Citation2004) have largely confirmed the existence of neural correlates for subjective aesthetic judgments, based primarily on the assumption that no objective standard for evaluating “beauty” exists.
Nethertheless, the literature on aesthetic preferences has identified several relevant predictors in the last decades. For example, aesthetic preferences correlate with pupil size (M. G. Johnson et al., Citation2010), and with different brain regions for men (right hemisphere) and women (bilateral) (Cela-Conde et al., Citation2009). For digital artworks, they can be predicted by visual simplicity, visual symmetry, visual contrast, and visual self-similarity (Mayer & Landwehr, Citation2018). For simple pictures, overall preference (i.e., liking) is predicted by the perception of balance that includes homogeneity (Hübner & Fillinger, Citation2016). The preference of abstract paintings over figurative paintings is predicted by a higher need for cognitive closure, i.e., the behavioral avoidance of uncertainty (Wiersema et al., Citation2012). Similarly, abstract arts is preferred over renaissance art by people with high scores on the personality trait openness for experience (Pelowski et al., Citation2017).
Several studies found distinct aesthetic preferences related to geometry. People prefer a larger (smaller) size of a displayed object relative to the frame for larger (smaller) objects, and a displayed object size that is proportional to the logarithm of its physical size (Linsen et al., Citation2011). Despite high inter-individual variation, a general preference for curvature over non-curvature in object contours could be found, and a high sensitivity to curvature is consistent for real objects and abstract designs (Corradi et al., Citation2019). Whereas individuals’ preferences of rectangle shapes strongly differ, they are not related to any other inter-individual differences commonly investigated in psychology including personality traits and need for cognition (McManus et al., Citation2010).
Aesthetic preferences can be predicted by complexity of the visual stimulus following an inverted U-shape, and this curvilinear relationship has also been confirmed for audial stimuli (Delplanque et al., Citation2019). Contrary to common perception, aesthetic preferences are not stable across the human lifespan but follow an inverted U-shape peaking around early to middle adulthood (Pugach et al., Citation2017).
Aesthetic preferences of colors have been explained by ecological valence theory which postulates that people prefer colors associated with objects they like (blue from sky), and dislike colors associated with objects they dislike (brown from rotten food) (Palmer & Schloss, Citation2010).
Based on the conception of the dynamic interaction between an aesthetic interface and an aesthetically experiencing user (Udsen & Jørgensen, Citation2005), human computer interaction (HCI) research has increasingly investigated aesthetic preferences in the last two decades. For example, a website’s perceived expressive aesthetics, along with usability, predicts the overall website preference (De Angeli et al., Citation2006). The design aesthetics of a mobile phone increases this product’s usability rating whereas the actual phone use does not (Sonderegger & Sauer, Citation2010). Aesthetic preferences of product design are strongly predicted by novelty in an inverted U-shape (Hung & Chen, Citation2012).
The aesthetics literature has further provided insights about aesthetic preferences on traditional paintings. For example, some evidence appeared about the existence of two antagonistic preferences for realistic versus abstract paintings. This preference for abstract over figurative paintings could be predicted by a higher need for cognitive closure, i.e., the need for a predictable and unambiguous world (Wiersema et al., Citation2012), and by the personality trait openness (Furnham & Walker, Citation2001) which also predicted the preference for abstract arts over renaissance art (Pelowski et al., Citation2017).
2.3. The 2AFC task
The 2AFC task is an experimental method of psychology introduced by Thurstone (Citation1927). In cognitive psychology, it is used to detect perception thresholds or evaluate the psychological differentiation of stimulus variation. Applying signal detection theory (McNicol, Citation2005), the underlying model identifies the detection thresholds of perceived stimuli in a 2AFC task by fitting the so-called psychometric function, a maximum-likelihood estimator, to the averaged 2AFC task responses. In such applications, the presented image pairs contain a baseline image (image without any effect) to which the other image is compared.
The 2AFC task specifies the assessment of two samples, thus called a paired comparison test. Both samples must be presented at the same time [p. 148] (Macmillan & Creelman, Citation2004). If only one stimulus is shown, it represents a yes/no task (often used for lexical decisions) which is sometimes confused with the 2AFC task.
The methodological advantage of the 2AFC design is that it significantly reduces fatigue, carryover and memory effects encountered when assessing more samples (Yang & Ng, Citation2017). Moreover, it reduces the required sample size of participants because each individual image is assessed several times due to the pairwise comparisons.
Palmer et al. (Citation2013) compare three methods for the direct measurement of aesthetic preferences: rank ordering, rating, and the 2AFC task. According to the authors, the optimal measurement can be achieved by the 2AFC task. The disadvantage of rank ordering is that it overwhelms the participant with a strong cognitive demand to identify a relative ordering of all images. Rating scales, such as Likert scales, are prone to the acquiescence bias which substantially decreases the validity of results (Friborg et al., Citation2006; Knowles & Nathan, Citation1997).
Psychological research has applied the 2AFC task to investigate aesthetic preferences, e.g., classifying images as art vs. non-art (Pelowski et al., Citation2017), the spatial composition in multi-object pictures (Leyssen et al., Citation2012), or the size of images for real-world objects (Linsen et al., Citation2011). For testing aesthetic preferences, the common 2AFC task procedure is to present the participant with all possible pairs of stimuli instead of all comparisons with a baseline image (Palmer et al., Citation2013). The 2AFC task’s main measure for an image’s relative preference is calculated by the actual frequency of selecting it over all other images, which represents the probability chosen.
Recently, the 2AFC task has been increasingly used for evaluating images in aesthetic dimensions, e.g., for analyzing the color effectiveness in macromolecular structures (Harrison et al., Citation2014), or the hue, saturation, brightness and texture in protein structures (Vuong et al., Citation2018).
Furthermore, the 2AFC task revealed smallest measurement variance, highest accuracy, and most time-efficiency given a moderate number of conditions when compared with the other most widely used methods (single-stimulus, double-stimulus, similarity judgments) for assessing subjective image quality (Mantiuk et al., Citation2012).
3. Parameter selection for the neural style transfer algorithm
The literature shows an abundance of neural style algorithms that vary in purpose, e.g., hand-created doodles (Champandard, Citation2016), houses and landscapes (Gatys et al., Citation2016), fashion (Jiang & Fu, Citation2017; Zhu et al., Citation2017), or artistic improvisation (Choi, Citation2018). Because algorithms differ widely in parametersFootnote1 depending on these different purposes, it is not surprising that the literature of neural style transfer has not provided a systematic analysis of parameter variation yet. Therefore, the present work made a selection among the parameters most frequently cited in publications and related code implementations to facilitate comparability, including (a) the content and style loss (directly configurable or indirectly as content and style weight), (b) the learning rate, (c) the batch size, and (d) the number of epochs or number of iterations. The latter two parameters are interdependent, i.e., fixing one determines the other parameter—e.g., with a small batch size of 2, 80,000 iterations only amount to two epochs of the training set containing 40,000 video frames (H. Huang et al., Citation2017). Similarly, the present study also fixed the batch size to the default value, so selecting the number of iterations as parameter was sufficient.
While the outcome differs among neural style algorithms due to many different influence factors including content and style extraction mechanisms, we can expect a visible impact of the selected parameters in the sense that the content structure will be rendered more clearly both with increasing number of iterations and higher content-style ratio. However, no such prediction can be made for the learning rate because of algorithm-specific reasons: Whereas locations higher on the cost curve require higher learning rates, proximity near the cost optimum favors lower learning rates. However, as the content and style loss values are unknown before the neural style transfer, the visual impact cannot be predicted and thus remains subject to the empirical investigation in the present study.
3.1. Number of iterations
For high structural information motifs, like the portrait images in the present study, computational time is higher and mainly determined by the number of iterations. The implementation in the present study is an optimization algorithm (provided by the script slow_lua_style.lua) (J. Johnson, Citation2016) that requires separate training on each style image. The training duration thus depends on the number of iterations.
For practitioners, it would be beneficial to know a minimum cutoff value because it would save both time and the computational cost which a higher number of iterations would entail. However, the literature rarely provides recommendations about the number of iterations (X. Huang & Belongie, Citation2017; Risser et al., Citation2017; M. Ruder et al., Citation2016). In general, it is expected that a higher number of iterations produces better results because the content and style loss are increasingly reduced. This reduction is gradually decreasing and thus converging to a certain level. This convergence allows us to locate an approximate cutoff value that indicates the minimum number of iterations for acceptable aesthetics.
3.2. Learning rate
For parameters other than the number of iterations, simple rules like “the more/less, the better” are not applicable for neural style transfer. Generally, smaller learning rates are advantageous because they can approach the cost minimum closer than higher learning rates which can fluctuate around the cost minimum and thus hinder convergence. However, as S. Ruder (Citation2016) pointed out, a too small learning rate “painfully” slows down the convergence to the cost minimum. Even more importantly, reaching the minimum of the content cost or style cost merely means that the content or style image is regenerated well by the neural style transfer algorithm. This does not necessarily translate into a more aesthetic outcome.
3.3. Content-style ratio
The present study verifies this fact for neural style transfer by varying the content-style ratio, with higher content weight resulting in realistic paintings and higher style weight resulting in abstract paintings. The same applies to the content-style ratio where increasing the weights for the content image or style image cannot be predicted in its impact on aesthetics. It is therefore not surprising that many researchers had previously remarked that the parameter configuration for neural style transfer was “tedious” and required “careful” manual tuning (Jing et al., Citation2017; Li, Citation2018), and even noted that the parameters’ impact on the visual outcome was “unpredictable” (Wang & Tan, Citation2018).
3.4. Algorithm selection for reproducibility
Recently, the lack of reproducibility for many findings in the AI literature, mainly due to unpublished code but also lack of documentation, has been increasingly criticized (Gundersen & Kjensmo, Citation2018; Hutson, Citation2018). The present work addresses this problem by selecting the algorithm depending on how well it facilitates reproducibility and comparability of results. Therefore, the algorithm was not chosen from the latest advances but rather by the highest ranking in popularity and citations, namely the implementation of Justin Johnson (Citation2016) in the Github repository jcjohnson/neural-style (J. Johnson, Citation2015). It gained the highest popularity among all neural style algorithms on Github (starred over 18.000 times on Github in June 2021). Contributing to its popularity was its excellent documentation and the parameters available for configuration. This explains why it was used in numerous studies for comparison (X. Huang & Belongie, Citation2017; S. Liu et al., Citation2016; Ulyanov et al., Citation2016) and for extension (Luan et al., Citation2017; M. Ruder et al., Citation2016). It is important to note that although the conducted literature review guided the parameter selection, it could not guide the range of parameter values in the study because network architectures and pretrained models for image classification networks widely differ, resulting in different parameter specifications.
4. Method
The present study aimed at identifying the impact of neural style transfer-specific parameters on aesthetic preferences. As stimuli, neural style transfer images were generated from three input images and five style images, varying one parameter in five configurations for each input image. The aesthetic perception of the same input image-style image combinations was analyzed both by the 2AFC task and by rating scales. These assessment scores were analyzed by ANOVA (analysis of variance) and the retrieved aesthetic patterns were compared between the 2AFC task and the rating scales.
4.1. Participants
The present study recruited a sample of 55 participants undergraduate and graduate students of interaction design, as well as professional UX designers. The students were recruited through the mailing list of the university’s design department, and the professional designers via Amazon Mturk filtering for Mturk workers in the “design & arts” occupation category with at least a Bachelor’s degree.
Participants were 38.2% male and 61.8% female, and on average 30.73 years old (SD = 10.84). The academic status was 50.9% Bachelor student, followed by 14.5% Master student, 18.2% professional with Bachelor’s degree, 14.5% professional with Master’s degree, and 1.8% professional with Ph.D. degree. Participants’ nationality was South Korean (49.1%), United States (32.7%), Canada (3.6%), Germany (3.6%), and the remaining 9.1% distributed over Singapore, United Kingdom, Côte d’Ivoire, Ghana, Kazakhstan and Venezuela.
4.2. Stimuli
4.2.1. Stimuli—Input images
Generally, the visual structure is partially obscured by the neural style transfer so viewers feel the need to orient themselves towards a recognizable depiction of structural information. Hence, it was important to select input images which are easily recognized in their semantic content.
Celebrity faces, rendered in different colors and texture, are a frequent theme in advertising (e.g., product commercials) and product marketing (e.g., album covers). Therefore, this study chose the faces of celebrities from both genders and with a global reach as featured content, namely Charlie Puth, Jessica Alba, and Ellie Goulding (see ).
Figure 1. Input images.

4.2.2. Stimuli-Style images
To control for the effect of textural granularity by style images, the present study chose style images with a textural granularity ranging from very fine (thin bush plant), medium (black and white patterns, cloth design) to very coarse (toys and abstract arts) as shown in .
Figure 2. Style images.
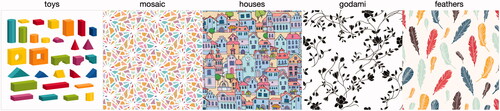
Preliminary experiments tested whether certain background characteristics could interfere with rendering the content image showing the head and facial structure. The result was that the generated image can be confounded with a background containing structure as the algorithm would render the background of the style image as well.
Therefore, only style images with empty and mono-colored backgrounds were chosen. This restriction did not apply to the input images as long as their background did not contain distinct structural information similar to facial structures.
4.3. Neural style transfer algorithm
The present study used the implementation of neural style transfer provided by the Github repository jcjohnson/fast-neural-style (J. Johnson, Citation2016) which is implemented in torch (Collobert et al., Citation2018). The original optimization-based algorithm (Gatys et al., Citation2015) was implemented by Justin Johnson in the Github repository jcjohnson/neural-style (J. Johnson, Citation2015) but did not provide sufficient configurability. The jcjohnson/fast-neural-style repository provides an improved version of the same optimization algorithm in the script slow_neural_style.lua. This version was selected for the present study because it provided the configuration of all relevant parameters, i.e., number of iterations, learning rate and content-style ratio.
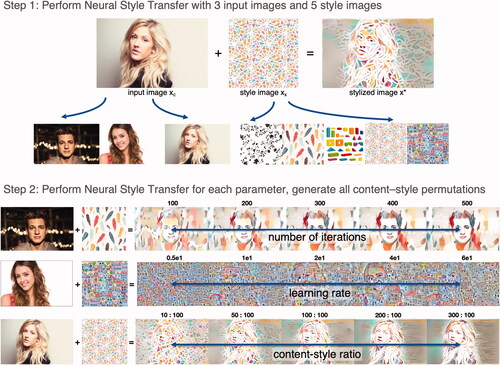
The loss network was set to the default VGG-16 (Simonyan & Zisserman, Citation2015), a pretrained model trained on the Imagenet dataset (Deng et al., Citation2010). As an alternative, the present work initially considered using Resnet networks (He et al., Citation2016) but discarded them because they did not render any stylization effect in preliminary experiments, which the author Justin Johnson confirmed on email request. The present study chose Adam over L-BFGS as optimizerFootnote2 following the recommendation by the author, Justin Johnson, for significantly reduced memory usage and because Adam is more commonly used as optimizer in general (X. Huang & Belongie, Citation2017; Ulyanov et al., Citation2016). All results of this study were generated following the process shown in on an Ubuntu 16.04 LTS virtual machine in the Google Cloud using a Nvidia Tesla P100 GPU with CUDA 9.1 and CUDNN 8.0 libraries.
Figure 3. Image generation process of neural style transfer.
4.4. Parameter configuration
4.4.1. Number of iterations
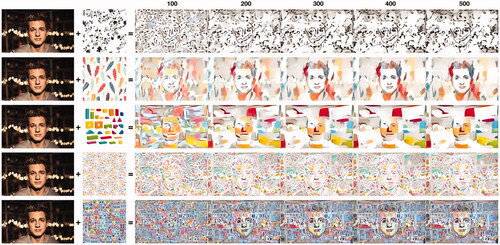
Johnson et al. (Citation2016) found that the optimization is successful within 500 iterations in most cases. The term iterations does not refer to model training (because a pretrained model of image recognition is used) but to the optimization-based style transfer (Gatys et al., Citation2016). The default setting was 500, yet preliminary experiments showed that satisfactory results can be achieved with a lower number of iterations. Therefore, this study compared 100, 200, 300, 400, and 500 iterations ().
Figure 4. Neural style transfer-variations of parameter: number of iterations.
4.4.2. Learning rate
The learning rate is a parameter that specifies the step size with which the pixel values are updated by the gradient of the combined content and style loss (Gatys et al., Citation2016). Although the default learning rate is 1.0, learning rates above this value revealed more structure in output images in preliminary experiments. This is understandable as this study aimed for a lower number of iterations, which require higher learning rates to approach the cost minimum. Therefore, this study explored the learning rates 0.5e1, 1e1, 2e1, 4e1, and 6e1 ().
Figure 5. Neural style transfer-variations of parameter: learning rate.
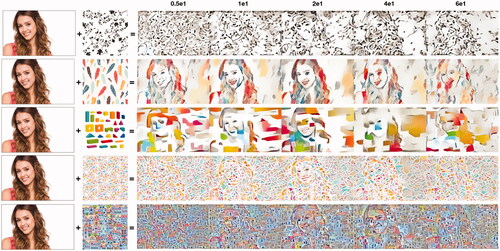
As noted before, the chosen learning rates cannot be compared with other learning rates cited in the literature (Hicsonmez et al., Citation2017; Ulyanov et al., Citation2016) because the underlying algorithms differ and thus the corresponding loss functions differ as well. For example, in feed-forward models, the learning rate refers to model training (X. Huang & Belongie, Citation2017; Ulyanov et al., Citation2016) whereas in our algorithm the learning rate refers to image optimization.
4.4.3. Content-style ratio
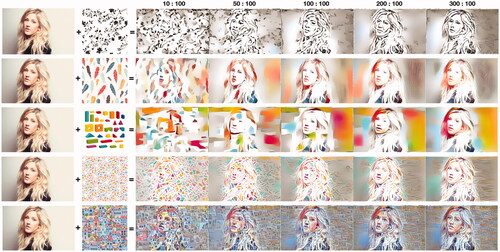
The content-style ratio determines the degree of importance given to the input image vs. style image for rendering the output image. The original default ratio is 1:5, i.e., the style is weighted five times higher than the content. Preliminary experiments showed that this yielded too little image structure in many cases, so a lower range was chosen. Hence, this study compared neural style transfer images generated by the content-style ratios 10:100, 50:100, 100:100, 200:100, and 300:100 ().
Figure 6. Neural style transfer-variations of parameter: content-style-ratio.
4.5. Two-alternative forced choice (2AFC) task
When the 2AFC task is used for detecting perception thresholds, it shows the stimuli in all pairwise comparisons with a baseline image. The comparison is different when the 2AFC task measures general sensitivity, as in the present study for aesthetic preferences. Here, the 2AFC task presents the participant with all pairwise permutations of stimuli. For each pairwise combination, participants are asked which “is more aesthetic” or “looks better” which corresponds to their aesthetic preference (Palmer et al., Citation2013).
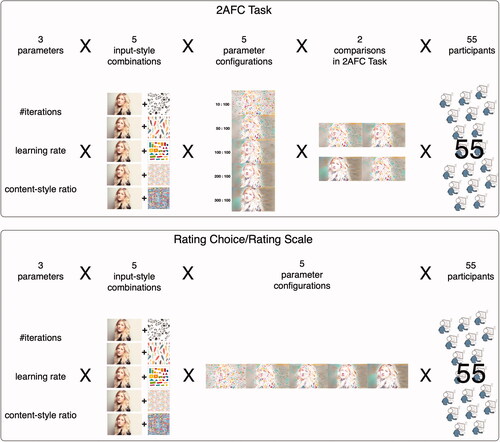
Each parameter was analyzed by the 2AFC task for every unique combination of parameter (three), parameter configuration (five), input image (three) and style image (five). visualizes this process and how it contrasts to the stimulus creation process for the rating choice/rating scale task. As can be seen, this procedure amounts to an effective sample size of nfinal = 2750 for each parameter in the 2AFC task. The 2AFC design hence holds a statistical advantage of effective sample size because each individual image is assessed multiple times in the pairwise comparisons whereas with rating scales, each stimulus is assessed only once.
Figure 7. Selection and Assessment Process with 2AFC Task and Rating Choice/Rating Scale. The 2AFC task was performed for each parameter by 55 participants × 5 unique input image-style image combinations × 5 parameter configurations × 4 comparisons/2 two-alternative-forced-choice, amounting to 2750 assessments for each of the three parameters. The rating scale was performed for each parameter by 55 participants × 5 unique input image-style image combinations × 1 sequence (of all 5 parameter configurations), amounting to 275 assessments for each of the three parameters.
The 2AFC task’s main measure for an image’s relative preference is calculated by the actual count of selecting it over all other images. These absolute counts are aggregated as relative frequencies of choosing a unique combination over another, and are expressed after normalization as probability chosen (ranging between 0 and 1) for easy comparison and interpretation.
4.6. Comparison with analysis by rating scales
The acquiescence bias is induced by the repeated row design in the rating scales. This means that the participants see all images to compare next to each other; in addition, they see the same rating scale in multiple rows to assess the aesthetic perception of these images. As the resulting effect of acquiescence bias is well known and therefore expected, the present study tested an improved measurement design of rating scales which aimed to reduce the acquiescence bias. This design asks participants to pick one of the five configurations as their favorite, and rate the degree of aesthetic preference specified as a percentage (0–100%). The acquiescence bias is reduced by this design by replacing the multiple assessment by the favorite choice. This alternative measurement will be used for comparison with the 2AFC task.
For this comparison, the present study analyzed whether both measurement methods could detect significant differences on aesthetic preference scores with ANOVA tests. ANOVA reports the F-statistic which is defined as the ratio of between-group variance divided by the within-group variance:
With
The ANOVA is performed as a hypothesis test on the null hypothesis of equal means, and yields the F statistic and the significance level p. The closer p is to zero, the higher the probability that the null hypothesis can be rejected, i.e., that the mean scores differ from each other.
The ANOVA was performed on the global level (on configuration, style, and interaction between configuration and style) as two-way within-subjects ANOVA (dependent variable: aesthetic preference, independent variables: configuration, style) for each parameter. On the detail level, the ANOVA was performed as a one-way within-subjects ANOVA (dependent variable: aesthetic preference, independent variable: configuration or style).
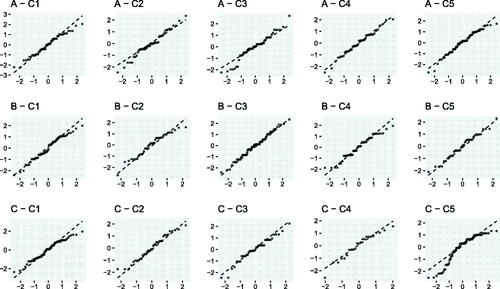
Like any least-squares model, ANOVA is based on the assumptions that the residuals are normal distributed and the variances are homogeneous (homoscedasticity). The normal distribution of residuals was verified by QQ normality plots and histograms for both 2AFC task (Appendix A, and ) and rating scale (Appendix A, and ). Most observations are located near the reference line of normal distribution, yet a few violations at the scale extremities. These were deemed acceptable as ANOVA is known for being robust against violations of the normal error assumption (Hocking, Citation2013) and insensitive to unequal distributions (Blanca et al., Citation2017).
The violations to homoscedasticity were verified by the variance ratio, i.e., the ratio between the maximum and minimum variance, for which the literature recommends cutoff values between 3 (Kirk, Citation2013) and 10 (Tabachnick & Fidell, Citation2019). The variances in the data grouped by style revealed that the variance ratio was below these thresholds both for the 2AFC task (1.247) and the rating scale (2.731), thus testifying homogeneity of variance.
4.7. Procedure
Before starting the survey, participants were asked to not use a smartphone but a laptop, desktop or tablet for larger image display. They were instructed to take a close look at each of the two images for at least 2–3 s, and to make the choice between the two images intuitively rather than by objective criteria. They were told that the differences between some images were very subtle and that they didn’t have to bother to find them.
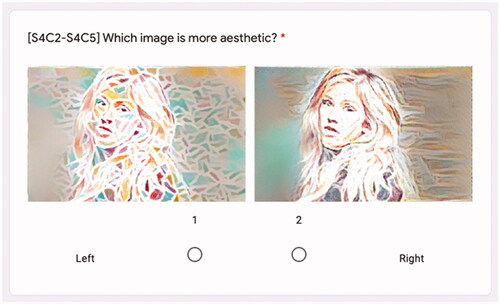
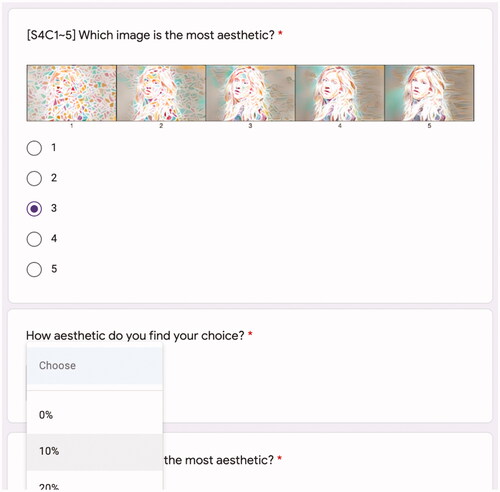
The first part of the survey contained the 2AFC task. It presented each image pair on a separate page with the title question “Which image is more aesthetic?,” and the participants had to select a radio button below the left or right image (see ). Each participant assessed five configurations of three parameters for five styles.
Figure 8. Participant perspective of 2AFC task.
The position of the two images in the 2AFC task (either left or right) was counterbalanced within participants so that each unique image (unique denoting a specific combination of input image, style image, parameter, and configuration) was evaluated in the same frequency in the left and right position. As example, for the input image “Charlie Puth,” image pairs with the following combinations of style image (S1 = godami style), parameter (A = number of iterations), and configuration (1–5 = 100–500 iterations) were evaluated: S1A1–S1A2, S1A2–S1A3, S1A3–S1A4, S1A4–S1A5, S1A3–S1A1, S1A1–S1A4, S1A5–S1A1, S1A4–S1A2, S1A2–S1A5, S1A5–S1A3. This permutation scheme was applied for each of the parameters, input images and style images.
The second part of the survey contained rating scales. Participants had to select their favorite image among the five configurations for each unique combination of parameter, input image, style image, and configuration. In a previous study on computer-generated visual stimuli (in review), we corroborated the acquiescence bias of rating scales found by other research (Palmer et al., Citation2013). We thus aimed in this study to remove the acquiescence bias by a new task design that preempted the rating with a “rating choice” task, i.e., the choice of the most aesthetic image among five parameter configurations (see ). This allowed estimating the differential effect of favorite image choice among five compared to two images (rating choice task vs. 2AFC task). After each choice of favorite image, participants rated the degree of aesthetic preference (“How aesthetic is your favorite?”).
Figure 9. Participant perspective of rating choice/rating scale task.
5. Results
The goal of this study was to explore whether and to what degree aesthetic preferences can be measured and with which measurement method most precisely. To answer this question, this study analyzed the aesthetic preference scores on a global level, i.e., two-way ANOVA on configuration and style, and on the detail level, i.e., in one-way ANOVAs, on configuration differences for each style, and on style differences for each configuration.
visualizes the preference scores measured by the 2AFC task and by the rating scale. The 2AFC task preference scores depict the means (dots) and standard errors (error bars) for 2750 pairwise comparisons for each of the three parameters, amounting to a total of 8250 aesthetic assessments. Analogously, the preference scores measured by rating scales were visualized in their means and standard errors with varying sample sizes dependent on the favorite choice frequency.
Figure 10. Probability chosen, 2AFC task vs. rating choice vs. rating scale aggregation across configurations and styles.
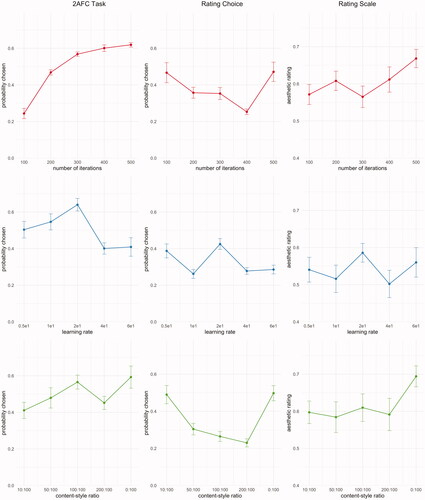
Because the participants used the rating scale subsequently after selecting their favorite choice (amongst the five configurations for each unique content image-style image combination), the frequency of making this choice (probability chosen) was calculated as well. This distribution is shown in in the middle column labeled “rating choice,” denoting the favorite choice made for the subsequent assessment by the rating scale.
5.1. Global level analysis
A two-way ANOVA was conducted with configuration and style as repeated measures for the aesthetic preference scores measured by the 2AFC task and rating scales. This ANOVA represents a global level of analysis as the stimuli were either collapsed across styles (for configuration differences) or across configurations (for style differences).
Testing configuration differences, the 2AFC task showed a significant main effect of configuration for number of iterations (F = 86.786, p = 0.000), learning rate (F = 27.891, p = 0.000) and content-style ratio (F = 16.205, p = 0.000). In contrast, the rating scale yielded consistently higher significance values than the 2AFC task for all parameters, demonstrating an overall lower precision than the 2AFC task to detect aesthetic preferences. The rating scale found a significant main effect of configuration (Fconfig = 2.549, pconfig = 0.040) and of style (Fstyle = 2.817, pstyle = 0.026) for number of iterations, but neither for learning rate (Fconfig = 1.138, pconfig = 0.332; Fstyle = 2.267, pstyle = 0.063) nor for content-style ratio (Fconfig = 2.256, pconfig = 0.064; Fstyle = 1.566, pstyle = 0.184).
Testing style differences, contrary to configurations, expects to find non-significant differences among style images because this allows us to generalize across different style images. Here, the ANOVA results show that among styles, the 2AFC task found no differences for any parameter (F(4, 1350) = 0, p = 1) whereas the rating scale found no significant style either except for number of iterations (F(4, 250), p = 0.026). With the exception of the latter, we thus can generalize the aesthetic preference patterns across style images.
Lastly, the interaction between configuration and style was analyzed. Even though the 2AFC task found two significant differences (p = 0.000 for learning rate and content-style ratio), these results must be discarded because one of the terms (style) had a p-value of 1. This shows the significant results of the interaction terms derive mathematically only from the zero results of the configuration terms. The rating scale yielded consistently high p-values (F(16, 250), p = 0.509–0.873) for all interaction terms, revealing no significant differences. Taken together, neither measurement method supports that an interaction effect between configuration and style exists.
5.2. Distribution comparison 2AFC task vs. rating choice
The distribution of rating choice tremendously differs from the 2AFC task. It is apparent that the rating choice for the number of iterations and content-style ratio shows not only a ceiling effect but also a floor effect, as evidenced by distinct and significant differences to the neighboring configurations. For both these parameters, the scores on both extremities overlap, so there is no identifiable maximum along the scale range. For the learning rate, a peak can be identified at the middle configuration, consistent to the 2AFC task. However, as the standard error of this peak also overlaps with that of the minimum configuration, no significant maximum can be identified here either. The identified floor effect is thus a unique characteristic of the rating choice distribution that differentiates it from the rating scale.
A potential explanation for the observed distribution is that the rating scale scores could merely reflect the rating choice distribution. In other words, a lower (higher) probability chosen in the rating choice could result into a lower (higher) aesthetic preference score in the rating scale. However, the high scores on the left extremities in the rating choice are not reflected in high scores in the rating scale for any of the three parameters. This proves that the left extremity high scores in the rating choice represent indeed floor effects. In contrast, the lower rating choices between the extremities do not consistently reflect the aesthetic perception either—for example, the 4th configuration of parameter number of iterations is lowest score in the rating choice, but scores second highest in the rating scale. The patterns of rating choice and rating scale seem consistent for the learning rate, but the overlapping standard errors disconfirm the presence of a significant rating scale pattern.
Finally, we aggregated the favorite choices across styles to calculate the correlation between the rating choice frequency (number of favorite choices per participant and per parameter configuration) and the rating scale score. This correlation turned out to be weak (r = 0.09), further corroborating quantitatively the preceding qualitative observation.
Taken together, the aesthetic preference patterns found by the 2AFC task were not detected by the rating choice task or rating scale. The reason is that even after removing the acquiescence bias, both rating choice and rating scale tasks showed a distinct response bias towards the scale extremities which scored not significantly different from other peaks.
5.3. Configuration differences analysis
To compare the 2AFC task with the rating scale on detecting configuration differences, a one-way ANOVA on configuration, per style, was conducted as shown in .Footnote3
Table 1. ANOVA aesthetic preference ratings on configuration differences, per style, 2AFC task vs. rating scale.
5.3.1. Configuration differences-Number of iterations
The 2AFC task results show that people prefer neural style transfer generated images with more iterations. This can be evidenced by the small and non-overlapping error bars (which had been averaged over the five style images) in the visual depiction in , and by the ANOVA analysis revealing statistically significant configurations differences for each style (, 2AFC Task, Nr. iterations), whereas the rating scales found none (, Rating Scale, Nr. iterations). Noteworthy is that the shape of the 2AFC task preference curve can be characterized by an “elbow” at 300 iterations, with a strong decline of the gradient thereafter. This suggests a convergence to a climax point near 500 iterations, further indicated by the decreased standard error.
In contrast, the rating scale shows a decline at 300 iterations, with higher probabilities both at 200 and 400 iterations. However, it is crucial to note that all the standard errors between 100 and 400 iterations are clearly overlapping (), indicating the absence of significant differences (Cumming & Finch, Citation2005). Hence, the visible pattern is random and not subject to further interpretation. The only significant difference can be found at 500 iterations, which represents the scale extremity and therefore corroborates the presence of an acquiescence bias.
5.3.2. Configuration differences-Learning rate
The 2AFC task’s aggregated preference curve for the learning rate (blue) in marks an inverted U-shape with the peak in the middle configuration 2e1 (M = 2.560, SE = 0.079). Pairwise Wilcox Tests confirm that the peak at the middle configuration (2e1) is statistically different from the smallest (0.5e1: M = 2.015, SE = 0.0.078) and larger (4e1: M = 1.604, SE = 0.080, 6e1: M = 1.636, SE = 0.077) learning rates, but not for the second smallest learning rate (1e1: M = 2.185, SE = 0.062). Further, the difference among the small learning rates (0.5e1 or 1e1) and among large learning rates (4e1, 6e1) are not significantly different, and thus can be merged together into a small and large group. In conclusion, the middle configuration, in relation to this small and large learning rate group, forms an inverted U-shape pattern.
5.3.3. Configuration differences-Content-style ratio
Similar to the learning rate, the 2AFC task highlights a clearer pattern than the rating scale for the content-style ratio. Whereas the 2AFC task shows a double peak pattern at content-style ratios 100:100 (M = 2.262, SE = 0.055) and 300:100 (M = 2.371, SE = 0.077), the rating scale shows a strong peak at 300:100 (M = 69.412, SE = 2.824) but only slight elevation at the 100:100 (M = 60.976, SE = 3.709) configuration. The ANOVA on the global had revealed the between-group variance as 16.2 times higher than the within-group variance, thus supporting the 2AFC curve as a clear preference pattern for the content-style ratio.
5.3.4. Configuration differences-Visual inspection summary
The rating scale curves and the 2AFC task curves share a pattern of peaks found roughly at the same location (500 iterations, learning rate 2e1, content-style ratio 300:100). However, as indicated by the error bars, the rating scales show consistently larger standard errors than the 2AFC task. Furthermore, the rating scale distributions reveal a ceiling effect (Everitt, Citation2002), a bias incurred when people tend to prefer choices at the right (ceiling) or left side (floor) of a rating scale. This ceiling effect is indicated by the peaks for the number of iterations and content-style ratios.
Importantly, the differences between the remaining configurations are not significant, as indicated by the substantial overlap between neighboring configurations of the standard error intervals. Notably, this overlap is consistently higher than the corresponding overlap in the 2AFC task, further evidenced by the consistently higher p-values of the rating scales compared to the 2AFC task () with the only exception for the houses style. Taken together, the rating scale does not identify an aesthetic preference pattern as clearly as the 2AFC task did.
5.3.5. Configuration differences - Summary
Overall, these findings provide evidence that whereas the 2AFC task can detect aesthetic preference patterns for each parameter that differ distinctly among configurations, the rating scales cannot. Furthermore, we can generalize the found patterns across style images with statistical evidence (, 2AFC task) for all style images (p = 0.000) except the houses style (p = 0.543).
Table 2. ANOVA aesthetic preference ratings on style differences, per configuration, 2AFC task vs. rating scale.
5.4. Style differences analysis
The previous analysis revealed that by collapsing the styles, the 2AFC task measures differences between configurations with more precision compared to the rating scales. In contrast, the style differences analysis collapses the configurations and thereby elaborates which preference patterns can be found between styles. To this end, a one-way ANOVA was performed for aesthetic preference on styles for each configuration ().
5.4.1. Style differences-Number of iterations
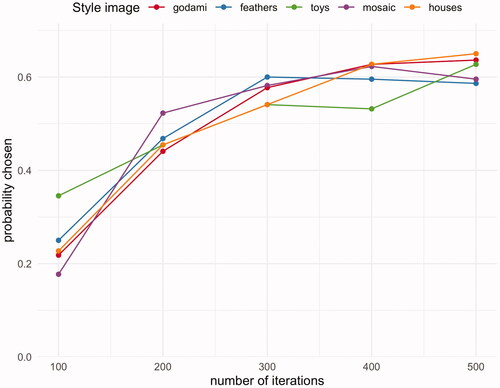
When comparing the aesthetic preferences between styles, the number of iterations delineated a common pattern as shown in . Aesthetic preference increases with rising number of iterations, and this observation is consistent across the five style images with minor deviations for the toys style. The qualitative visual inspection of the outcome images () hints that the underlying reason might be the increasing detail in rendering the structural information of the face. Important from a practical perspective is that the aesthetic preference converges around 500 iterations. This means for practitioners that it is not necessary to run the algorithm for more iterations which saves unnecessary time and importantly, also saves considerable cost if cloud computing is used.
Figure 11. Probability chosen in 2AFC task for number of iterations 100, 200, 300, 400, 500.
5.4.2. Style differences-Learning rate
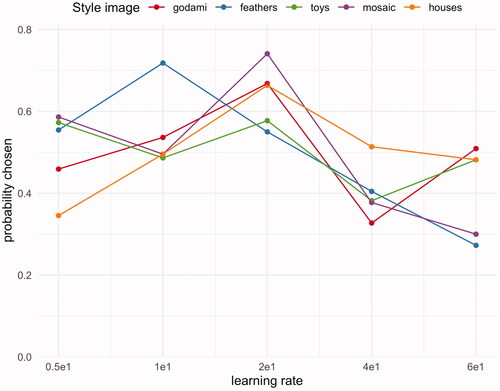
The analysis of the learning rate on style differences showed a differentiated pattern in the 2AFC task as displayed in . Whereas the majority of style images had an aesthetic preference peak for a moderate learning rate (2e1), the feathers (blue) style image showed the peak clearly at a smaller learning rate (1e1). For this exception, the visual inspection () provided a plausible reason: The higher learning rate (2e1) rendered the right eye with a blue stain whereas the lower learning rate (1e1) marked the face with a blue feather on the cheek, leaving the eye unmarked. The different aesthetic assessments might be explained by people being more familiar with eye spots (similar to eye makeup) than cheek spots that could be more perceived as skin impurities.
Figure 12. Probability chosen in 2AFC task for learning rate 0.5e1, 1e1, 2e1, 4e1, 6e1.
5.4.3. Style differences-Content-style ratio
The style differences analysis of the content-style ratio revealed the highest variation across the five style images in the 2AFC task, and did not seem to show a common pattern visually ().
Figure 13. Probability chosen, 2AFC task, content-style ratios 10:100, 50:100, 100:100, 200:100, 300:100.
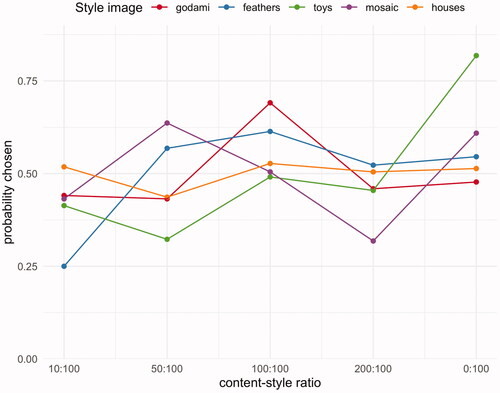
We can speculate on some underlying reasons for the distinct patterns by qualitatively analyzing the peaks of the aesthetic preference curves. For example, the toys style (green) and mosaic (purple) show the peak at the highest configuration (300:100) because it is the only configuration that clearly renders the face with natural eye renderings and without any deformation. Further, the low aesthetic ratings for content-style ratios 50:100, 100:100, and 200:100 can be explained by their facial deformations.
Contrasting this are the styles godami (red) and feathers (blue) that both peak in the middle configuration (100:100) which, despite representing a less realistic rendition than the highest configuration (300:100), nonetheless shows a well recognizable facial structure.
The houses style (yellow) differs from this pattern with a roughly flat curve, further evidenced by the ANOVA revealing no significant difference between configurations on p = 0.543. This result can be explained by the clearly recognizable face and hair structure in all renderings. Somewhat unique is the style mosaic (purple) because it shows a double peak pattern. Whereas the highest configuration (300:100) shows the most realistic rendering, the smaller one (50:100) is more abstract than the configurations in-between (100:100, 200:100) while still recognizable as a face, unlike the lowest configuration (10:100).
5.4.4. Style differences-Summary
In summary, analyzing the style differences with the 2AFC task revealed a double peak pattern for the content-style ratio at the middle (100:100) and high configuration (300:100). The confirmed double peak pattern indicates that two different preference reasons exist for the content-style ratio: The middle configuration allows us to easily identify the person but in a strongly stylized form which could correspond to a preference for abstract arts, whereas the high configuration allows us to recognize the subtleties of a person's face close to a photograph, which could correspond to a preference for realistic renderings.
6. Discussion
The present work provides an initial exploration on the question whether and to which degree computer-generated arts can achieve optimal aesthetic results. In this sense, it is the first empirical application of the 2AFC task on computer generated arts in general, and neural style transfer in particular. It addressed the two identified problems in the literature of measuring the outcome of a neural style algorithm (the subjective assessment by the authors and the acquiescence bias associated with rating scales) by applying a previously not applied measurement instrument, the 2AFC task.
The research question did not aim for a generalization of aesthetic preferences across input images, but instead for the comparison between the 2AFC task and rating scales in their ability to extract aesthetic preference patterns ceteris paribus, i.e., given the same conditions. This explains why each of the three parameters was applied to only one input image each, and consequently why several face-related attributes (e.g., gender, ethnicity, facial dimensions) were not varied. Although the present work acknowledges these face-related attributes as relevant variables in aesthetic measurement, it focused on a different goal, namely to isolate each parameter’s aesthetic impact, and assess whether the results allow generalizing the relationship between perceived aesthetics and the parameter configuration for a particular combination of input image and style image.
In answer to the research question, the main contribution of this work is threefold.
First, the present study corroborated that the 2AFC task is a more effective method for detecting aesthetic preferences than the rating scale, even in absence of the acquiescence bias. It provided evidence that the 2AFC task detects patterns that are more statistically different between groups. Importantly, these patterns were not revealed by the rating scales even though they had been designed to avoid the acquiescence bias by the preceding rating choice task. This provides the empirical proof that the 2AFC is de facto a better measurement instrument for aesthetic preferences than the commonly used rating scales. This finding corroborates previous research declaring the 2AFC task the preferred measurement method for aesthetic preferences (Mantiuk et al., Citation2012; Palmer et al., Citation2013) to neural style transfer-images.
As a theoretical contribution, this finding is important because it demonstrates that seemingly similar aesthetic outcomes go unrecognized by the rating scale but can be measured precisely in their subtle differences by the 2AFC task. This can be understood further by the fact that the 2AFC task was initially applied in cognitive psychology to detect perception thresholds.
Second, the present work demonstrated the higher sensitivity of the 2AFC task by extracting three distinctly different patterns of aesthetic preferences. More specifically, these three distinct patterns showed
a convergence pattern (a continuously positive curve) for the number of iterations
a single peak pattern (an inverted U-shape) for the learning rate
a double peak pattern for the content-style ratio
Moreover, beyond the scope of the present work, these extracted patterns could contribute to theory building or corroboration of existing theories. As an example, the found double peak pattern may allow us to postulate that people favor either the proximity of the expected, i.e., a less artistic impression, or a more stylized and thus abstract image rendition. This theory is aligned with research on arts paintings that also found antagonist preferences for abstract vs. realistic arts and related them to trait differences (Pelowski et al., Citation2017; Wiersema et al., Citation2012).
Third, the implementation of the present study shows commercial applications a pathway to leverage the precise measurement of aesthetic preferences in the business context. For companies, it is crucial to know that the 2AFC task allows them to find parameter configurations that achieve optimal aesthetic perception. Companies can use these optimal configurations to achieve reproducible aesthetic outcomes that are customized for target groups with their specific aesthetic preferences. Moreover, the concrete recommendations for configurations effectively eliminate the time-consuming tuning of hyperparameters.
6.1. Limitations and future research
The findings of this study regarding optimal parameter values are specific to the combination of the algorithm implementation, the parameter configuration of this algorithm, and the selection of input and style images.
The found aesthetic patterns must be further limited to the sample which constitutes a selection bias. For example, the selection of design professionals and design students might have a higher level of visual sensitivity compared to the general population. The selection bias also applies to the used algorithm, so the findings are not generalizable to other neural style transfer algorithms. Furthermore, controlling for variables such as gender, age or education could allow future research to detect individual differences. Likewise, future research could test other explanatory variables for interaction effects such as a general preference for abstract vs. realistic arts, celebrity preference, personality trait preference, or any specific aesthetic preference including color and geometric shape of style images.
In addition, future research could yield new insights by testing whether specific visual aspects are related to neural style transfer parameters, such as perceived balance (Hübner & Fillinger, Citation2016) and learning rate, or visual simplicity (Mayer & Landwehr, Citation2018) and content-style ratio. Furthermore, future research could measure the perception of the style image and systematically vary its textural granularity. This approach will be particularly interesting when analyzing content motifs that differ from the present study to investigate whether similar preference patterns emerge. An underlying factor, subject to empirical investigation, could be the familiarity of the content image to the observer because knowing the structural information well may reward its higher recognizability in the image. Therefore, it can be conjectured that if the observer is well acquainted with the content structure, such as with famous sight seeing scenes or paintings, the aesthetic preference could favor realistic renderings for such motifs.
Lastly, it would be interesting if future research could replicate the findings with other neural style transfer implementations. A good candidate for replication is the preference for a higher number of iterations as it seems to be associated with a preference for a more finely rendered style image’s texture in the output image. Whether the content-style ratio pattern can be replicated depends on whether there is an underlying binary preference for realistic vs. abstract arts. The results for the learning rate might not replicate unless the cost function is shaped by similar parameters as the algorithm used in this study.
7. Conclusion
The findings of this work demonstrate that aesthetic preferences of computer-generated arts, such as neural style transfer, underlie distinct preference patterns. Varying the parameter configuration results in different aesthetic perception which is only distinguishable if measured by the 2AFC task. The practical insight for commercial contexts is that optimal aesthetic outcomes can indeed be parametrized by testing the aesthetic perception with the 2AFC task and extracting the optimal parameter configuration. This configuration allows the neural style algorithm to generate visual artefacts which could be customized for a specific target audience if their preferred style images are used as input. Such customization would effectively implement the guiding HCI principle of user-centered design (Vredenburg et al., Citation2002). In response to Harper's (Citation2019) call for putting AI in the service of HCI, this work demonstrated how to achieve this goal by systematic stimulus variation and capturing corresponding aesthetic patterns.
Acknowledgments
The author wants to express deepest gratitude to Prof. Karen Muckenhirn for proofreading subsequent versions of this manuscript, and to ML engineer Lars Sjoesund for feedback on the deep learning parts.
Additional information
Notes on contributors
Chaehan So
Chaehan So is an Assistant Professor of Information and Interaction Design at Yonsei University. His research focuses on the intersection of psychology, artificial intelligence and design to create psychologically-grounded ways of user experience. Dr. So has a Ph.D. in Social Psychology and Masters' degrees in electrical engineering and business.
Notes
1 For simplicity, this paper refers to the hyperparameters of a deep learning model as parameters, knowing that hyperparameters (which are used to configure the training process) shall not be confused with model parameters (which are learned from the dataset).
2 The role of the optimizer in the used algorithm implementation (J. Johnson, Citation2016) is for optimizing the image, and not for training the full network.
3 Due to the same number of pairwise comparisons (10) for the five configurations tested, the mean for the 2AFC task shows the identical value of 2 for all one-way ANOVAs on configuration.
References
- Blanca, M. J., Alarcón, R., Arnau, J., Bono, R., & Bendayan, R. (2017). Non-normal data: Is ANOVA still a valid option? María. Psicothema, 29(4), 552–557. https://doi.org/10.7334/psicothema2016.383
- Blijlevens, J., Hekkert, P., Leder, H., Thurgood, C., Chen, L. L., & Whitfield, T. W. A. (2017). The aesthetic pleasure in design scale: The development of a scale to measure aesthetic pleasure for designed artifacts. Psychology of Aesthetics, Creativity, and the Arts, 11(1), 86–98. https://doi.org/10.1037/aca0000098
- Bo, Y., Yu, J., & Zhang, K. (2018). Computational aesthetics and applications. Visual Computing for Industry, Biomedicine, and Art, 1(1), 6–19. https://doi.org/10.1186/s42492-018-0006-1
- Bogacz, R., Brown, E., Moehlis, J., Holmes, P., & Cohen, J. D. (2006). The physics of optimal decision making: A formal analysis of models of performance in two-alternative forced-choice tasks. Psychological Review, 113(4), 700–765. https://doi.org/10.1037/0033-295X.113.4.700
- Cela-Conde, C. J., Agnati, L., Huston, J. P., Mora, F., & Nadal, M. (2011). The neural foundations of aesthetic appreciation. Progress in Neurobiology, 94(1), 39–48. https://doi.org/10.1016/j.pneurobio.2011.03.003
- Cela-Conde, C. J., Ayala, F. J., Munar, E., Maestú, F., Nadal, M., Capó, M. A., Del Río, D., López-Ibor, J. J., Ortiz, T., Mirasso, C., & Marty, G. (2009). Sex-related similarities and differences in the neural correlates of beauty. Proceedings of the National Academy of Sciences of the United States of America, 106(10), 3847–3852. https://doi.org/10.1073/pnas.0900304106
- Chamberlain, R., Mullin, C., Scheerlinck, B., & Wagemans, J. (2018). Putting the art in artificial: Aesthetic responses to a brief history of computer art. Psychology of Aesthetics, Creativity, and the Arts, 12(2), 177–192. https://doi.org/10.1037/aca0000136
- Champandard, A. J. (2016). Semantic style transfer and turning two-bit doodles into fine artworks. Arxiv. http://arxiv.org/abs/1603.01768
- Chen, D., Yuan, L., Liao, J., Yu, N., Hua, G. (2018). Stereoscopic neural style transfer. http://arxiv.org/abs/1802.10591
- Chen, S. (2020). The emerging trend of accurate advertising communication in the era of big data—The case of programmatic, targeted advertising. In J.-S. Pan, A. Ito, P.-W. Tsai, & L. C. Jain (Eds.), Advances in intelligent information hiding and multimedia signal processing (pp. 299–308). Springer.
- Chen, T. Q., Schmidt, M. (2016). Fast patch-based style transfer of arbitrary style. Arxiv. http://arxiv.org/abs/1612.04337
- Choi, S. K. (2018). Guess, check and fix: A phenomenology of improvisation in ‘neural’ painting. Digital Creativity, 29(1), 96–114. https://doi.org/10.1080/14626268.2018.1423995
- Collobert, R., Dundar, A., Farabet, C., Grewe, D., Kavukcuoglu, K., Léonard, N., Chintala, S., Zagoruyko, S. (2018). Torch. In GitHub repository. GitHub. https://github.com/torch/torch7
- Corradi, G., Belman, M., Currò, T., Chuquichambi, E. G., Rey, C., & Nadal, M. (2019). Aesthetic sensitivity to curvature in real objects and abstract designs. Acta Psychologica, 197(May), 124–130. https://doi.org/10.1016/j.actpsy.2019.05.012
- Cui, X., Qi, M., Niu, Y., & Li, B. (2018). The intra-class and inter-class relationships in style transfer. Applied Sciences, 8(9), 1681. https://doi.org/10.3390/app8091681
- Cumming, G., & Finch, S. (2005). Inference by eye: Confidence intervals and how to read pictures of data. The American Psychologist, 60(2), 170–180. https://doi.org/10.1037/0003-066X.60.2.170
- De Angeli, A., Sutcliffe, A., & Hartmann, J. (2006). Interaction, usability and aesthetics [Paper presentation]. The 6th ACM Conference, Proceedings of on Designing Interactive Systems - DIS ’06, University Park, PA, USA. https://doi.org/10.1145/1142405.1142446
- Delplanque, J., De Loof, E., Janssens, C., & Verguts, T. (2019). The sound of beauty: How complexity determines aesthetic preference. Acta Psychologica, 192(November 2018), 146–152. https://doi.org/10.1016/j.actpsy.2018.11.011
- Deng, J., Dong, W., Socher, R., Li, L.-J., Li, K., & Fei-Fei, L. (2010). ImageNet: A large-scale hierarchical image database. In 2009 IEEE Conference on Computer Vision and Pattern Recognition (pp. 248–255). IEEE. https://doi.org/10.1109/cvpr.2009.5206848.
- DiPaola, S., & Gabora, L. (2009). Incorporating characteristics of human creativity into an evolutionary art algorithm. Genetic Programming and Evolvable Machines, 10(2), 97–110. https://doi.org/10.1007/s10710-008-9074-x
- Everitt, B. (2002). The Cambridge dictionary of statistics (Vol. 106, 2nd ed.). Cambridge University Press.
- Fechner, G. T., Howes, D. H., & Boring, E. G. (1966). Elements of psychophysics (Vol. 1). Rinehart and Winston New York.
- Friborg, O., Martinussen, M., & Rosenvinge, J. H. (2006). Likert-based vs. semantic differential-based scorings of positive psychological constructs: A psychometric comparison of two versions of a scale measuring resilience. Personality and Individual Differences, 40(5), 873–884. https://doi.org/10.1016/j.paid.2005.08.015
- Furnham, A., & Walker, J. (2001). The influence of personality traits, previous experience of art, and demographic variables on artistic preference. Personality and Individual Differences, 31(6), 997–1017. https://doi.org/10.1016/S0191-8869(00)00202-6
- Gatys, L. A., Ecker, A. S., Bethge, M. (2015). A neural algorithm of artistic style. Arxiv, 3–7. https://doi.org/10.1167/16.12.326
- Gatys, L. A., Ecker, A. S., & Bethge, M. (2016). Image style transfer using convolutional neural networks [Paper presentation]. The IEEE Conference on Computer Vision and Pattern Recognition, Nashville, TN, USA. https://doi.org/10.1109/CVPR.2016.265
- Gharibshah, Z., Zhu, X., Hainline, A., & Conway, M. (2020). Deep learning for user interest and response prediction in online display advertising. Data Science and Engineering, 5(1), 12–26. https://doi.org/10.1007/s41019-019-00115-y
- Ghiasi, G., Lee, H., Kudlur, M., Dumoulin, V., Shlens, J. (2017). Exploring the structure of a real-time, arbitrary neural artistic stylization network. Arxiv, 1705.06830. http://arxiv.org/abs/1705.06830
- Graf, L. K. M., & Landwehr, J. R. (2017). Aesthetic pleasure versus aesthetic interest: The two routes to aesthetic liking. Frontiers in Psychology, 8(JAN), 15. https://doi.org/10.3389/fpsyg.2017.00015
- Gundersen, O. E., & Kjensmo, S. (2018). State of the art: Reproducibility in artificial intelligence [Paper presentation]. 32nd AAAI Conference on Artificial Intelligence, AAAI 2018, Hilton New Orleans Riverside, New Orleans, Louisiana, USA.
- Harper, R. H. R. (2019). The role of HCI in the age of AI. International Journal of Human–Computer Interaction, 35(15), 1331–1344. https://doi.org/10.1080/10447318.2019.1631527
- Harrison, L., Yang, F., Franconeri, S., & Chang, R. (2014). Ranking visualizations of correlation using Weber's Law. IEEE Transactions on Visualization and Computer Graphics, 20(12), 1943–1952. https://doi.org/10.1109/TVCG.2014.2346979
- Hassenzahl, M. (2001). The effect of perceived hedonic quality on product appealingness. International Journal of Human-Computer Interaction, 13(4), 481–499. https://doi.org/10.1207/S15327590IJHC1304_07
- He, K., Zhang, X., Ren, S., Sun, J. (2016). Deep residual learning for image recognition [Paper presentation]. Proceedings of the IEEE Conference on Computer Vision and Pattern Recognition, San Juan, PR, USA.
- Hekkert, P. (2006). Design aesthetics: Principles of pleasure in design. Psychology Science, 48(2), 157–172. http://www.pabst-publishers.de/psychology-science/2-2006/06_Hekkert.pdf
- Hicsonmez, S., Samet, N., Sener, F., & Duygulu, P. (2017). DRAW: Deep networks for recognizing styles of artists who illustrate children’s books [Paper presentation]. Proceedings of ICMR ’17, June 6–9, 2017, Romania. https://doi.org/10.1145/nnnnnnn.nnnnnnn
- Hocking, R. R. (2013). Methods and applications of linear models: Regression and the analysis of variance. John Wiley & Sons.
- Huang, H., Wang, H., Luo, W., Ma, L., Jiang, W., Zhu, X., Li, Z., & Liu, W. (2017). Real-time neural style transfer for videos [Paper presentation]. 2017 IEEE Conference on Computer Vision and Pattern Recognition (CVPR), Honolulu, HI, USA. https://doi.org/10.1109/CVPR.2017.745
- Huang, X., & Belongie, S. (2017). Arbitrary style transfer in real-time with adaptive instance normalization [Paper presentation]. Proceedings of the IEEE International Conference on Computer Vision, 2017-October, Venice, Italy. https://doi.org/10.1109/ICCV.2017.167
- Hübner, R., & Fillinger, M. G. (2016). Comparison of objective measures for predicting perceptual balance and visual aesthetic preference. Frontiers in Psychology, 7(MAR), 335–315. https://doi.org/10.3389/fpsyg.2016.00335
- Hung, W. K., & Chen, L. L. (2012). Effects of novelty and its dimensions on aesthetic preference in product design. International Journal of Design, 6(2), 81–90.
- Hutson, M. (2018). Artificial intelligence faces reproducibility crisis unpublished code and sensitivity to training conditions make many claims hard to verify. Science, 359(6377), 725–726. https://doi.org/10.1126/science.359.6377.725
- Jiang, S., Fu, Y. (2017). Fashion style generator. In C. Sierra (Ed.), Proceedings of the Twenty-Sixth International Joint Conference on Artificial Intelligence (IJCAI-17) (pp. 3721–3727). IJCAI.
- Jing, Y., Yang, Y., Feng, Z., Ye, J., Song, M. (2017). Neural style transfer: A review. Arxiv. http://arxiv.org/abs/1705.04058
- Jing, Y., Yang, Y., Feng, Z., Ye, J., Yu, Y., & Song, M. (2020). Neural style transfer: A review. IEEE Transactions on Visualization and Computer Graphics, 26(11), 3365–3385. https://doi.org/10.1109/TVCG.2019.2921336
- Johnson, J. (2015). neural-style. In GitHub repository. GitHub. https://github.com/jcjohnson/neural-style
- Johnson, J. (2016). fast-neural-style. In GitHub repository. GitHub. https://github.com/jcjohnson/fast-neural-style
- Johnson, J., Alahi, A., & Fei-Fei, L. (2016). Perceptual losses for real-time style transfer and super-resolution. Lecture Notes in Computer Science (Including Subseries Lecture Notes in Artificial Intelligence and Lecture Notes in Bioinformatics), 9906 LNCS, 694–711. https://doi.org/10.1007/978-3-319-46475-6\_43
- Johnson, M. G., Muday, J. A., & Schirillo, J. A. (2010). When viewing variations in paintings by Mondrian, aesthetic preferences correlate with pupil size. Psychology of Aesthetics, Creativity, and the Arts, 4(3), 161–167. https://doi.org/10.1037/a0018155
- Jordan, P. W. (2002). Designing pleasurable products: An introduction to the new human factors. CRC Press.
- Kirk, R. E. (2013). Research strategies and the control of nuisance variables. Experimental Design: Procedures for the Behavioral Sciences, 1–30.
- Knowles, E. S., & Nathan, K. T. (1997). Acquiescent responding in self-reports: Cognitive style or social concern? Journal of Research in Personality, 31(2), 293–301. https://doi.org/10.1006/jrpe.1997.2180
- Leyssen, M. H. R., Linsen, S., Sammartino, J., & Palmer, S. E. (2012). Aesthetic preference for spatial composition in multiobject pictures. i-Perception, 3(1), 25–49. https://doi.org/10.1068/i0458aap
- Li, H. (2018). A literature review of neural style transfer. Arxiv, 1. https://www.cs.princeton.edu/courses/archive/spring18/cos598B/public/projects/LiteratureReview/COS598B_spr2018_NeuralStyleTransfer.pdf
- Linsen, S., Leyssen, M. H. R., Sammartino, J., & Palmer, S. E. (2011). Aesthetic preferences in the size of images of real-world objects. Perception, 40(3), 291–298. https://doi.org/10.1068/p6835
- Liu, S., Ou, X., Qian, R., Wei, W., Cao, X. (2016). Makeup like a superstar: Deep localized makeup transfer network. In IJCAI International Joint Conference on Artificial Intelligence (pp. 2568–2575). ACM.
- Liu, X.-C., Cheng, M.-M., Lai, Y.-K., & Rosin, P. L. (2017). Depth-aware neural style transfer [Paper presentation]. The Symposium, Proceedings of on Non-Photorealistic Animation and Rendering – NPAR ’17, Los Angeles, CA. https://doi.org/10.1145/3092919.3092924
- Luan, F., Paris, S., Shechtman, E., & Bala, K. (2017). Deep photo style transfer [Paper presentation]. Proceedings – 30th IEEE Conference on Computer Vision and Pattern Recognition, CVPR 2017, 2017-January, Honolulu, HI, USA. https://doi.org/10.1109/CVPR.2017.740
- Macmillan, N. A., & Creelman, C. D. (2004). Detection theory: A user’s guide. Psychology Press.
- Mantiuk, R. R. K., Tomaszewska, A., & Mantiuk, R. R. K. (2012). Comparison of four subjective methods for image quality assessment. Computer Graphics Forum, 31(8), 2478–2491. https://doi.org/10.1111/j.1467-8659.2012.03188.x
- Mayer, S., & Landwehr, J. R. (2018). Quantifying visual aesthetics based on processing fluency theory: Four algorithmic measures for antecedents of aesthetic preferences. Psychology of Aesthetics, Creativity, and the Arts, 12(4), 399–431. https://doi.org/10.1037/aca0000187
- McCormack, J., & D’Inverno, M. (2012). Computers and creativity: The road ahead. In J. McCormack & M. D'Inverno (Eds.), Computers and creativity. Springer.
- McCormack, J., Gifford, T., & Hutchings, P. (2019). Autonomy, authenticity, authorship and intention in computer generated art. Lecture Notes in Computer Science (Including Subseries Lecture Notes in Artificial Intelligence and Lecture Notes in Bioinformatics), 11453 LNCS (April), 35–50. https://doi.org/10.1007/978-3-030-16667-0_3
- McManus, I. C., Cook, R., & Hunt, A. (2010). Beyond the golden section and normative aesthetics: Why do individuals differ so much in their aesthetic preferences for rectangles? Psychology of Aesthetics, Creativity, and the Arts, 4(2), 113–126. https://doi.org/10.1037/a0017316
- McNicol, D. (2005). A primer of signal detection theory. Psychology Press.
- Norman, D. A. (2004). Emotional design: Why we love (or hate) everyday things (Vol. 2004). Basic Books. https://doi.org/10.1145/985600.966013
- Palmer, S. E., & Schloss, K. B. (2010). An ecological valence theory of human color preference. Proceedings of the National Academy of Sciences of the United States of America, 107(19), 8877–8882. https://doi.org/10.1073/pnas.0906172107
- Palmer, S. E., Schloss, K. B., & Sammartino, J. (2013). Visual aesthetics and human preference. Annual Review of Psychology, 64(1), 77–107. https://doi.org/10.1146/annurev-psych-120710-100504
- Pelowski, M., Gerger, G., Chetouani, Y., Markey, P. S., & Leder, H. (2017). But is it really art? The classification of images as “art”/“not art” and correlation with appraisal and viewer interpersonal Differences. Frontiers in Psychology, 8(OCT), 1729. https://doi.org/10.3389/fpsyg.2017.01729
- Pugach, C., Leder, H., & Graham, D. J. (2017). How stable are human aesthetic preferences across the lifespan? Frontiers in Human Neuroscience, 11(May), 289–211. https://doi.org/10.3389/fnhum.2017.00289
- Ray, J. J. (1983). Reviving the problem of acquiescent response bias. The Journal of Social Psychology, 121(1), 81–96. https://doi.org/10.1080/00224545.1983.9924470
- Risser, E., Wilmot, P., Barnes, C. (2017). Stable and controllable neural texture synthesis and style transfer using histogram losses. http://arxiv.org/abs/1701.08893
- Ruder, M., Dosovitskiy, A., & Brox, T. (2016). Artistic style transfer for videos. Lecture Notes in Computer Science (Including Subseries Lecture Notes in Artificial Intelligence and Lecture Notes in Bioinformatics), 9796 LNCS, 26–36. https://doi.org/10.1007/978-3-319-45886-1_3
- Ruder, S. (2016). An overview of gradient descent optimization algorithms. Arxiv, 1–14. https://doi.org/10.1111/j.0006-341X.1999.00591.x
- Simonyan, K., Zisserman, A. (2015). Very deep convolutional networks for large-scale image recognition [Paper presenation]. 3rd International Conference on Learning Representations, ICLR 2015 - Conference Track Proceedings, San Diego, CA, USA.
- Sonderegger, A., & Sauer, J. (2010). The influence of design aesthetics in usability testing: Effects on user performance and perceived usability. Applied Ergonomics, 41(3), 403–410. https://doi.org/10.1016/j.apergo.2009.09.002
- Sridhar, S., & Sriram, S. (2013). Is online newspaper advertising cannibalizing print advertising? Quantitative Marketing and Economics, 13, 283–318. https://doi.org/10.2139/ssrn.2268112
- Stephanidis, C., Salvendy, G., Antona, M., Chen, J. Y. C., Dong, J., Duffy, V. G., Fang, X., Fidopiastis, C., Fragomeni, G., Fu, L. P., Guo, Y., Harris, D., Ioannou, A., Jeong, K-A (K.)., Konomi, S., Krömker, H., Kurosu, M., Lewis, J. R., Marcus, A., … Zhou, J. (2019). Seven HCI Grand Challenges. International Journal of Human–Computer Interaction, 35(14), 1229–1269. https://doi.org/10.1080/10447318.2019.1619259
- Tabachnick, B. G., & Fidell, L. S. (2019). Using multivariate statistics (7th ed.). Pearson.
- Thurstone, L. L. (1927). A law of comparative judgement. Psychological Review, 34(4), 273–270. https://doi.org/10.1037/h0070288
- Udsen, L. E., & Jørgensen, A. H. (2005). The aesthetic turn: Unravelling recent aesthetic approaches to human-computer interaction. Digital Creativity, 16(4), 205–216. https://doi.org/10.1080/14626260500476564
- Ulyanov, D., Lebedev, V., Vedaldi, A., Lempitsky, V. (2016). Texture networks: Feed-forward synthesis of textures and stylized images. http://arxiv.org/abs/1603.03417
- Ulyanov, D., Vedaldi, A., Lempitsky, V. (2017). Instance normalization: The missing ingredient for fast stylization. http://arxiv.org/abs/1607.08022
- Vartanian, O., & Goel, V. (2004). The neural correlates of aesthetic preference for painting. Cognitive Neuroscience and Neurophysiology, 15(9), 893–897. https://doi.org/10.1097/01.wnr.00001
- Vredenburg, K., Isensee, S., & Righi, C. (2002). User-centered design: An integrated approach. Prentice Hall PTR.
- Vuong, J., Kaur, S., Heinrich, J., Ho, B. K., Hammang, C. J., Baldi, B. F., & O’Donoghue, S. I. (2018). Versus—A tool for evaluating visualizations and image quality using a 2AFC methodology. Visual Informatics, 2(4), 225–234. https://doi.org/10.1016/j.visinf.2018.12.003
- Wang, E., Tan, N. (2018). Artistic style transfer. Digital Image Processing. https://web.stanford.edu/class/ee368/Project_Autumn_1617/Reports/report_wang_tan.pdf
- Wiersema, D. V., van der Schalk, J., & van Kleef, G. A. (2012). Who’s afraid of red, yellow, and blue? Need for cognitive closure predicts aesthetic preferences. Psychology of Aesthetics, Creativity, and the Arts, 6(2), 168–174. https://doi.org/10.1037/a0025878
- Yang, Q., & Ng, M. L. (2017). Paired comparison/directional difference test/2-alternative forced choice (2-AFC) test, simple difference test/same-different test. In Discrimination testing in sensory science (pp. 109–134). Elsevier.
- Zhu, S., Fidler, S., Urtasun, R., Lin, D., & Change, C. (2017). Be your own Prada: Fashion synthesis with structural coherence. ArXiv, 1680–1688.
Appendix A
Figure A1. QQ plots configuration differences by_style, 2AFC task.
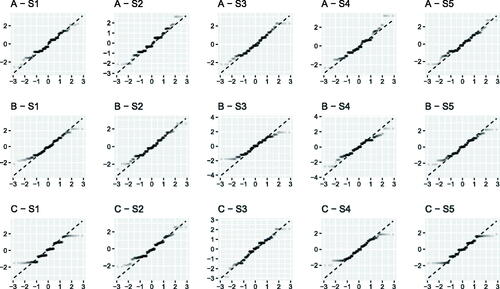
Figure A2. QQ plots style differences by configuration, 2AFC task.
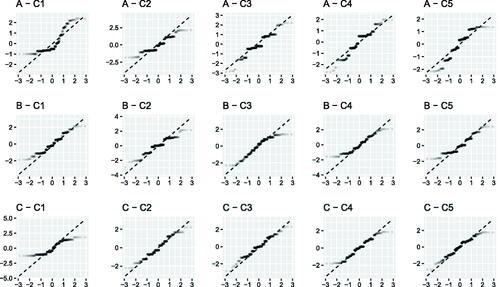
Figure A3. QQ plots configuration differences, rating scale.
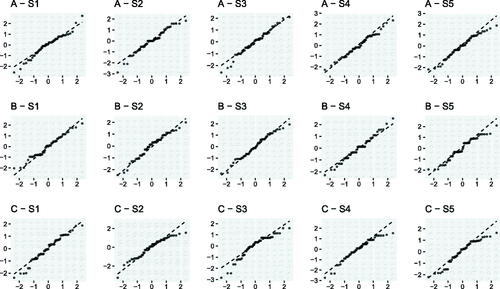
Figure A4. QQ plots differences by configuration, rating scale.