
Abstract
This research is based on the adaptation and validation in French of the Pedestrian Receptivity Questionnaire for Fully Autonomous Vehicles (PRQF). Faced with the emergence of numerous issues related to interactions between pedestrians and fully autonomous vehicles (FAV), this questionnaire is a reliable and scientifically valid means of collecting pedestrian experiences when they cross a road in front of an autonomous vehicle. The translation methodology of the PRQF was based on a committee approach, which consisted of asking several bilingual experts to come to an agreement on a consensual translation. The validation of the French PRQF (F-PRQF) was based on the completion of 584 questionnaires. Different psychometric tests were carried out, including an accuracy analysis, a principal component factor analysis (PCA) and a confirmatory factor analysis (CFA). Our results show that the F-PQRF displays satisfactory psychometric qualities, in particular in terms of internal consistency (α = 0.932 and ω = 0.935). We also find a scale with five components, which confirms the theoretical model structure of the original scale. The F-PRQF showed good psychometric qualities, which should thus facilitate research in fully autonomous vehicles among French-speaking audiences.
1. Introduction
Technological developments to make the fully autonomous vehicles (FAV) continue from year to year. Besides road tests organized by the different vehicle manufacturers (Bagloee et al., Citation2016), the first fully autonomous vehicles could be in circulation and accessible to the general public from 2025, with deployment to more than 90% of the market by 2055 (Nieuwenhuijsen et al., Citation2018). However, these predictions must be qualified by considering the progress of technological developments (Ahmed et al., Citation2022), and the policy for integrating autonomous vehicles into the market (Alvarez León & Aoyama, Citation2022; Wang et al., Citation2022). Indeed, numerous governments support research and development into FAV, not only from an economic point of view, but also by preparing the massive infrastructure adaptations that would be necessary for FAV and non-autonomous vehicles to share the road (Alsalman et al., Citation2021).
1.1. What is a fully autonomous vehicle?
Fully autonomous vehicles (FAV) are vehicles where driving is managed entirely by an automated system, which is equipped with detectors and capable of reacting to all situations the vehicle finds itself in. The U.S. Department of Transportation’s National Highway Traffic Safety Administration (NHTSA) defines autonomous vehicles as follows: “Automated vehicles are those in which at least some aspects of a safety-critical control function (e.g., steering, throttle, or braking) occur without direct driver input.”
FAV constitute the highest level of autonomy for autonomous vehicles defined by the Society of Automotive Engineers (SAE), which distinguishes six levels, detailed in . The first three levels (0, 1 and 2) are considered driver support systems, where the driver remains the main actor in the driving process. The next three levels (3, 4 and 5) delegate part or all of the driving to the automated system. FAV correspond to level 4 or even 5.
Table 1. Autonomy level of the vehicles, according to the SAE classification.
Often, the vehicle must be connected in order for it to be autonomous. A connected vehicle incorporates wireless telecommunication systems allowing it to collect information that it can save, process, use and relay to other vehicles or send to the road infrastructure. In this way, a fully autonomous vehicle continuously exchanges information with other FAV and the systems that manage the infrastructure. For example, a connected vehicle can better manage intersections by communicating with other vehicles to know their position and the state of the traffic (vehicle-to-vehicle: V2V), but also with the infrastructure (vehicle-to-infrastructure: V2I) in order to determine the safest and fastest route, taking into account areas under construction or accidents on the road (Gholamhosseinian & Seitz, Citation2022). In this purpose, the acronym CAV is also used, signifying connected and autonomous vehicles.
In this article, we also favor the term FAV over CAV likewise the original PRQF study by Deb et al. (Citation2017).
1.2. Expectations and interests concerning FAV
The reason for the FAV being the subject of so much attention since the beginning of the 2000s is that they promise numerous social changes and significant improvements in the transport domain. In 2005, a report on intelligent vehicle safety systems (IVSS) (Abele et al., Citation2005) predicted that the development of vehicles with numerous assistance technologies, such as ABS (Antilock Braking System), ACC (Adaptive Cruise Control) or ESP (Electronic Stability Programme), would lead to a significant reduction in the number of road accidents, the seriousness of the accidents and traffic congestion. Since then, Advanced Driver Assistance Systems (ADAS) have been widely developed and are increasingly integrated into modern vehicles. A study of road accident conditions in the UK estimated that the systematic deployment of certain assistance systems would reduce accidents by 23.8% (Masello et al., Citation2022). As FAV would systematically include all available driving assistance technologies, they would be fully in line with the combat for road safety. In a report on the societal impact of autonomous vehicles on tomorrow’s world, Bagloee et al. (Citation2016) highlight a number of advantages and expectations concerning FAV, in particular as they relate to road safety, traffic congestion car-sharing, electricity, optimal use of road capacities, transport costs, freeing up time for users, land use, development of business in third-world countries and the decrease in greenhouse gases. Freight transport would also benefit from the advantages of automation. Sindi and Woodman (Citation2021) have identified several impacts of the use of autonomous goods vehicles (AGVs) in interviews with professionals in the logistics industry. Certain obstacles were highlighted, such as the difficulty of completely replacing the driver, who is not only responsible for driving the vehicle but also, for example, for securing the load on board. On the other hand, AGVs could facilitate manoeuvres at the quay and thus avoid many accidents, but above all reduce operating costs.
We will expand on the main expectations and advantages of FAV in the subsequent sections. Nevertheless, we emphasize that our objective is neither to draw up an exhaustive list of the advantages of FAV compared to traditional vehicles nor to plead in favour of FAV, but rather to illustrate why FAV are the subject of so much research today and why it is important that ergonomic psychology shows interest.
1.2.1. Improvement of road safety
FAV should considerably improve road safety. In addition to the conclusions drawn from the report on IVSS relative to the technologies on board the FAV, it is also recognized that mistakes made by drivers are responsible for three-quarters of road accidents (Imprialou & Quddus, Citation2019). Furthermore, FAV are considered a reliable means of reducing the number of accidents, since on one hand, they would include all the driving technologies necessary to prevent accidents, and on the other, they would eliminate all human intervention in controlling the vehicle.
However, this technocentric approach still needs to be moderated, since certain research works into ergonomics maintain that the best human-system performance is based on a cooperation that is distributed fairly between humans and machines, in an anthropocentric approach (Rabardel & Beguin, Citation2005).
1.2.2. Reducing road traffic congestion
Projections concerning the impact of FAV for reducing road congestion are contradictory.
On one hand, certain projections indicate that FAV will be capable of reducing traffic congestion, in particular, with the adoption of new travel habits and the adoption of car-sharing (Minelli et al., Citation2015). After observing different scenarios and situations taking into account several degrees of traffic density and different FAV penetration ratios, Lu et al. (Citation2020) measured that FAV would be capable of increasing traffic density without impacting its fluidity. In this way, FAV would improve congestion by better exploiting road infrastructures and providing better coordination between vehicles. Furthermore, since FAV would be safer than vehicles driven by humans and would reduce the number of accidents, which are the cause of many traffic jams, this would also relieve traffic congestion (Bagloee et al., Citation2016).
On the other hand, expectations regarding congestion reduction are more modest. In a survey of six countries that could be highly impacted by FAV (China, Japan, India, United States of America, United Kingdom and Australia), opinions on the ability of FAV to better manage traffic and road decongestion vary greatly from one country to another: Indians are optimistic (72.3% of respondents estimate that FAV will have a positive impact on traffic congestion) while on the other hand, the British are much more sceptical (47.3% of respondents have positive expectations), as are the Japanese, Americans and Australians (Schoettle & Sivak, Citation2014). Several authors also estimate that the arrival of FAV would result in high demand for this means of transport, which would be made available for a large population that currently does not have access to individual transport: people that are visually impaired, that have a physical or mental handicap, the elderly or those without a driving licence. This rebound effect would significantly increase the number of vehicles on roads and would contribute to an increase in traffic congestion (Bissell et al., Citation2020; Metz, Citation2018; Minelli et al., Citation2015).
Whatever the predictions, all the research agrees that the introduction of FAV will require a thorough and global overhaul of transport methods. FAV will have to coordinate more with other forms of public transport (train, metro, aeroplane, bus, etc.) in order to offer users a global mobility service (Alessandrini et al., Citation2015; Buehler, Citation2018), commonly known as “Mobility as a Service.”
1.2.3. Environmental benefits
The introduction of FAV is expected to bring many environmental benefits. In a literature review, Shiwakoti et al. (Citation2020) noted that the reduction of greenhouse gases was the subject most addressed by research into autonomous vehicles since 2018. By combining several factors relating to FAV, such as a reduction in vehicle size, the optimization of road journeys and the use of electrical rather than thermal energy, (Sanguesa et al., Citation2021), Greenblatt and Saxena (Citation2015) estimate that greenhouse gases could be reduced by 87–94% compared to current vehicle emissions.
In another study on the benefits of FAV for the environment, Jones and Leibowicz (Citation2019) list the principal factors that would favour the reduction of greenhouse gases. Since individual vehicle are responsible for 60–75% of emissions in the transport sector, there are high expectations that FAV will improve this situation. Indeed, the change in the mobility model, which would go from individual mobility to mobility on demand (Pavone, Citation2015), where no single person (or single household) would have precedence over a vehicle, but they would be shared with on-demand access (Golbabaei et al., Citation2021), would be one of the most important factors for the conservation of the environment. In this case, FAV fleets would manage their parking themselves and take into account traffic flows in order to avoid congestion (Tu et al., Citation2019).
Finally, it is expected that FAV would be programmed to drive in an ecological way, thus limiting brusque and erratic accelerating and braking, which use excessive energy. A simulation of traffic entirely managed by autonomous vehicles saw a 45% reduction in energy consumption to be measured compared to a fleet of conventional vehicles (Chen et al., Citation2019).
1.2.4. Life quality improvement and social benefits
There is a general consensus that FAV will offer the possibility for numerous categories of society to improve their quality of life. The main perceived advantages of FAV are: a reduction of driving-related stress; the opportunity to relax during long journeys and to spend time with other activities, such as reading (Thomopoulos & Givoni, Citation2015); the reduction of accidents and therefore, the preservation of the physical health of users; a reduction in insurance costs; and the possibility to travel whenever users want (Pettigrew, Citation2017; Pettigrew et al., Citation2018; Pettigrew & Cronin, Citation2019).
Young people, the elderly and those with a handicap are those that suffer the most from restrictions on their mobility. A study by The Society of Morot Manufacturers and Traders Limited (Hawes, Citation2017) indicates that these three groups identified FAV as a potential solution for improving their mobility and quality of life. The study shows that more than 50% of those surveyed estimate that their mobility is limited, whereas 48% of them declare that the reduction in driving-related stress would be the main advantage of FAV. In this way, FAV favour social inclusion by offering more freedom of mobility to categories of people excluded from current transport models (Pettigrew, Citation2017). According to Crayton and Meier (Citation2017), these advantages would however not be effective without a new global policy put in place by the authorities.
1.3. Interaction issues between pedestrians and FAV
Although FAV offer numerous opportunities for tomorrow’s companies, they face many challenges in terms of design. Besides technical aspects related to the technologies they would have on board (autonomous driving systems, artificial intelligence, inter-vehicle communications, etc.), FAV must also take the human factor into account. As with any innovative product, their design must be centred on the human in order to offer the best user experience possible (ISO 9241-210:2010,210:2010, Citation2010).
One of the challenges of human-centred design concerns interaction between pedestrians and FAV. Indeed, certain situations require the vehicles to transmit information to pedestrians, in particular when pedestrians begin to cross the road. In this part, we describe pedestrian behaviour observed when they cross the road, then, we present several pedestrian-FAV interaction solutions proposed in the literature.
1.3.1. Behaviour of pedestrians when they cross the road
Much research has focused on the observation of pedestrian behaviours when they cross the road, and the explicit and implicit interactions that are involved between pedestrians and motorized vehicles. From experience, all pedestrians know to what extent the signals transmitted by vehicle drivers are important when deciding whether or not to cross the road: the perceived attention of the driver, hand or head gestures, the flashing of headlights or eye contact, are all indications that allow pedestrians to know whether or not they can cross safely. Furthermore, the approach speed of the vehicle is also an important parameter in decision-making (Bella & Silvestri, Citation2015; Liu & Tung, Citation2014; Várhelyi, Citation1998).
The study of Sucha et al., (Citation2017) enabled the quantification of pedestrian behaviours when they crossed a road at a zebra crossing without traffic lights. For example, 46% of pedestrians observed wait until the vehicles stop before crossing; 18% wait until the vehicles slow down, 2% do not wait for a reaction from the vehicles and cross spontaneously; and in 34% of observations, the vehicles do not give way at the zebra crossing, forcing the pedestrians to cross after them. Most pedestrians also declared that they tried to signal their intention to cross to the approaching vehicles using different behaviours: 84% of pedestrians try to make eye contact with the drivers, 9% indicated their intention to cross by stepping into the road, 4% made a hand gesture. Another study, this time concentrating on drivers, indicate that they try to make eye contact with pedestrians in order to assure them that they have seen them (Ren et al., Citation2016). Therefore, in the absence of eye contact, drivers approach the pedestrian crossing faster and with a less progressive deceleration than when eye contact is made. Eye contact is thus perceived by the drivers as the pedestrians expressing their intention to cross, which then incites them to better anticipate stopping.
Pedestrians adopt other strategies when they cross outside of zebra crossings. For example, Dey and Terken (Citation2017) observed that if there is a lot of traffic on the road where the pedestrians want to cross, they generally stay on the kerb and wait for the cars to go by and the road to be completely clear before they begin to cross. Where the traffic is less dense, 61.3% of pedestrians estimate the trajectory of a vehicle in order to adjust their own movements and largely bypass the vehicle or leave a lot of space between themselves and the traffic. A smaller proportion of pedestrians (37.7%) wait until all the vehicles have gone by.
Finally, it is interesting to note that pedestrians do not expect explicit communication from drivers. Lee et al. (Citation2021) highlight that less than 1% of the vehicles indicate to pedestrians that they are letting them cross, for example by flashing their headlights or sounding their horn. Approximately 4% of drivers make a hand gesture when they let pedestrians cross.
These studies thus indicate that a pedestrian-vehicle interaction, whether explicit or implicit, is initiated when the pedestrian tries to cross the road, with or without a zebra crossing. Certain drivers behaviours, including eye contact and the visual attention they pay to their environment, enable them to indicate to the pedestrians whether they can cross safely. For FAV without drivers, new forms of interaction must be implemented. Certain manufacturers and researchers propose alternative solutions in the absence of a driver, and we will introduce some of them in the next section.
1.3.2. Selected FAV pedestrian interaction solutions
The issue of the potential absence of a driver in the FAV, which would mean that pedestrian-driver interactions are no longer possible when crossing the road, has been taken into account since the middle of the 2010s. Remedial solutions are proposed in the form of human-machine interfaces integrated into the external elements of the vehicle, and these have the acronym eHMI (external Human-Machine Interface) (Bazilinskyy et al., Citation2019).
Several types of eHMI have been developed. Dey, Habibovic, et al. (Citation2020) identify four main categories of visual eHMI:
Anthropomorphic, that use human or anthropomorphic communication elements, such as facial expressions (eyes, smile) or gestures;
Textual, that display an explicit text, such as “Stop,” “Drive,” “Please cross” or any other variant that uses text to communicate the state of the vehicle or instructions for pedestrians;
Symbolic, that use recognizable traffic signals, such as stop signs, pedestrian crossing lines, the walking pedestrian symbol, arrows or other forms of iconic symbols;
Abstract, which take on abstract visual forms, subject to the pedestrian’s interpretation, or any other form of light-based or non-light-based communication devices, that are neither anthropomorphic, textual or symbolic.
28 eHMIs, developed by automotive manufacturers and parts suppliers or by research centres, were referenced by Bazilinskyy et al. (Citation2019). However, there are many others, such as those proposed by Liu et al. (Citation2021), Dey et al. (Citation2020), Chang et al. (Citation2017) or even de Clercq et al. (Citation2019). As an illustration, in we present an example of visual eHMI for each of the four categories of Dey et al. (Citation2020).
Table 2. Examples of visual eHMI.
1.4. Presentation of the Pedestrian Receptivity Questionnaire for Fully autonomous vehicles (PRQF)
Research into autonomous vehicles and pedestrian behaviours shows to what extent pedestrian-FAV interactions are a fundamental issue that must be investigated. In a more targeted way on autonomous vehicles than the trust in automation scale (Jian et al., Citation1998), the Pedestrian Receptivity Questionnaire for Fully autonomous vehicles (PRQF), designed and validated by Deb et al. (Citation2017), allows pedestrian perception of autonomous vehicles to be measured. The PRQF was defined by focusing in particular on the main technology acceptance models, such as the Technology Acceptance Model (TAM) (Davis, Citation1989) and the Unified Theory of Acceptance and Use of Technology (UTAUT) (Venkatesh et al., Citation2003), as well as the first acceptation models of autonomous vehicles as drivers, such as the Car Technology Acceptance Model (CTAM) (Osswald et al., Citation2012).
The theoretical model of the PRQF is centred around five subscales, resumed in the questionnaire, which allow a prediction of the behavioural intention of the respondent to cross the road in front of an FAV (). These subscales are:
Figure 1. Conceptual model of the PRQF (according to Deb et al., Citation2017).
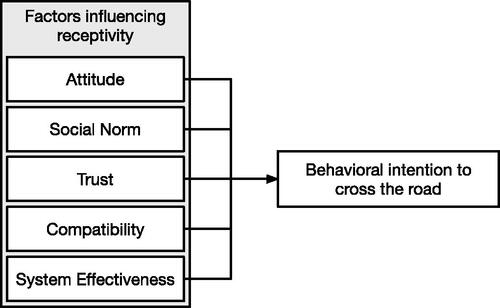
The attitude of the pedestrian towards FAV (the acronym used is AT). It describes the positive or negative feelings towards FAV in general, as well as the specific technologies on board the vehicles;
Social norms (S). They concern the feelings of the respondents concerning what people that are important and influential for their think;
Trust (T). This registers to what extent FAV are perceived as capable of successfully detecting pedestrians and other obstacles on the road, stopping for them and letting them cross safely;
Compatibility (C). This describes the degree to which an FAV is perceived as being compatible with the existing transportation system;
System effectiveness (EF). This describes the individual conviction that an FAV will accomplish its tasks highly effectively.
In its definitive version, the PRQF comprises 16 items in the form of affirmative phrases. The respondents are asked to respond to each of them on a 7-point Likert scale going from 1 (strongly disagree) to 7 (strongly agree). Item 7 is reversed. Each subscale of the conceptual model is used by several items: attitude (AT) comprises 5 items; social norms (S) 3 items, of which one is reversed; trust (T) 3 items, compatibility (C) 3 items, of which it has one in common with effectiveness; and effectiveness (EF) comprises 3 items, including one in common with trust.
A high score on the PRQF represents a higher receptivity to FAV and a higher behavioural intention to cross in front of an FAV.
2. Objectives
The present study aims at testing the validity of a French version of the Pedestrian Receptivity Questionnaire for Fully Autonomous Vehicles. The first objective is to adapt in French the PRQF according to the proposed methodology by Vallerand (Citation1989) and Gana et al. (Citation2021). The second objective is to verify the psychometric properties of the French version of the PRQF, through the measure of internal consistency with Cronbach’s alphas and McDonald’s omega (Hayes & Coutts, Citation2020), principal factor analysis (PCA), confirmatory factor analysis (FCA) and the measure of convergent validity.
3. Method
3.1. Procedures and participants
It is recognized that the minimum size of the sample necessary for psychometric tests is at least five participants per item, which corresponds to 80 participants for the 16 items of the PRQF (Nunnally, Citation1978).
For the psychometric evaluation of the French adaptation of the PRQF, we disseminated an online survey. The participants were not compensated and were recruited through the investigator’s social networks using online advertisements or email. We worked with a convenience sample, obtained without any particular method. Age was the only inclusion criterion; participants had to be at least 18 years old. All information that could have been used to identify individuals was deleted as soon as the second data collection was initiated, such as the email addresses. Thereafter, all of the data was treated with complete anonymity and confidentiality.
Of the 627 participants that completed the survey, 584 questionnaires were able to be used, in light of the incomplete and incoherent responses. Our sample was made up of 366 women and 208 men, with an average age of 32.07 years old (SD = 15.566), 30.26 for women (SD = 14.72) and 35.31 for men (SD = 16.13). 10 people preferred not to comment on their gender (M = 30.80; SD = 23.41). Additional questions dealt with sociodemographic characteristics such as driving licence holder or having been involved in a road accident.
All the demographic characteristics collected are resumed in .
Table 3. Demographic characteristics of the sample questioned.
3.2. Measures
3.2.1. The French version of the Pedestrian Receptivity Questionnaire for Fully Autonomous Vehicles
In order to provide a French adaptation of the PRQF, we followed the methodological framework proposed by Vallerand (Citation1989) and Gana et al. (Citation2021) for the transcultural translation and validation of psychological questionnaires in English into French. N.B. To make this article easier to read, the French version of the PRQF will be referred to as F-PRQF.
The first step consisted of preparing a preliminary version of the original questionnaire in French. Several methods are possible, including traditional translation where the researchers do the translation on their own, the committee method and the back translation method. For our study, and in order to minimize the bias of traditional translation cited by Vallerand (Citation1989), we opted for a committee translation.
Translation by a committee requires several experts in the domain of the questionnaire to agree upon a preliminary version, which is subsequently validated. For our study, two French native speakers, bilingual experts in human elements, were asked to propose a translation of the 16 items of the PRQF.
First, each translator did their own individual translation. The translators were able to write one or more translation propositions per item. Then, in a second phase, the researchers presented their translations and began discussing the content of their translations. The experts were then asked to reach a consensus on the formulation of the translations for each item. This individual translation work and subsequent debate was done virtually but in a synchronous way with the help of the Miro© tool.
resumes the individual translations of each expert, then the consensual translation that resulted from their discussions. It was therefore indeed the consensual translation that was selected for the following validation steps.
Table 4. Translations of the PRQF items by experts, with the consensual translation selected for the psychometric validation phases.
It is interesting to note that, for many items, the consensual version is a complete reformulation of the individual translations. For example, for item 15 (FAV is compatible with all aspects of transportation system in my area), the consensual translation selected by the experts “Les VEA vont pouvoir fonctionner avec tous les types de transport et leur infrastructure de ma région” is different to the two individual translations (“Le véhicule autonome est compatible avec tous les types de transport de ma région” et “Les CAV sont compatibles avec tous les aspects du système de transport dans ma région/mon quartier”), although it uses some elements from them.
As for the PRQF, we kept the 7-point Likert scale going from 1 (strongly disagree—“Pas du tout d’accord”) to 7 (strongly agree—“Tout à fait d’accord”).
3.2.2. The Pedestrian Behavior Questionnaire
In order to proceed with a concurrent validation of the F-PRQF, we proceeded with the same comparison as Deb et al. (Citation2017) of the PRQF with the Pedestrian Behavior Questionnaire (PBQ) (Deb et al., Citation2017). The PBQ enables the frequency of pedestrian high-risk behaviour to be measured. The long version contains 50 items and the shorter version 20 items. The PBQ is a self-administered questionnaire made up of affirmative phrases describing different pedestrian behaviours when crossing the road. For each phrase, the participant is asked to respond on a 6-point Likert scale depending on the frequency of the behaviour adopted (1 = very infrequently or never; 6 = very often or always).
The PBQ has five subscales:
Violations (V), that correspond to behaviours that infringe traffic rules;
Errors (E), that describe deviant or inappropriate behaviour, but that do not infringe the law;
Lapses (L), that correspond to behaviours adopted due to forgetfulness or a lack of vigilance by the pedestrian;
Aggressive behaviours (A) that are directed both at vehicle drivers and other pedestrians or any other road user;
Positive behaviours (P) towards vehicle drivers or any other road users. It should be noted that all items in this subscale are reverse-scaled items.
The global score of the PBQ reports on the general behaviour of the pedestrian when he/she crosses the road. The higher the score, the more high-risk the behaviour.
For the purpose of our study, the PQB has been adapted into French (Appendix A). The French PBQ (F-PBQ) has a good general internal consistency with a Cronbach’s alpha of 0.800. The Violations subscale has an alpha of 0.801 (compared to 0.84 in the original English version of the PBQ), 0.525 for the Errors subscale (compared to 0.73 for the PBQ), 0.818 for the Lapses subscale (compared to 0.87), 0.629 for the Aggressive behaviours subscale (compared to 0.83) and 0.606 for the Positive behaviours subscale (compared to 0.58).
3.3. Statistical analyses
We followed the psychometric analysis approach proposed by Gronier (Citation2022) for the transcultural adaptation of scales. All statistical analyses were conducted using SPSS 26 and JASP 0.16.3.
Exploratory analyses were conducted using principal factor analysis (PCA) with an orthogonal Varimax rotation.
The internal consistency was measured with Cronbach’s alphas and McDonald’s omega (Hayes & Coutts, Citation2020). According to Nunnally (Citation1978), the minimum acceptable coefficient should not be less than .70. For descriptive statistics and in order to evaluate a possible age and gender effects, Student’s t-test and repeated measures ANOVAs were performed.
We also tested the dimensional model of the PRQF using confirmatory factor analyses (CFA). For these analyses, goodness of fit was tested with Chi2 test. Moreover, according to Schweizer (Citation2010), we choose four other adjustment indices for the analysis: Standardised Root Mean square Residual (SRMR), Root Mean Square Error of Approximation (RMSEA), Tucker-Lewis index (TLI) and Comparative Fit Index (CFI). It is assumed that the model could be considered satisfactory when the Chi2/df was lower than 3, SRMR and RMSEA respectively lower than .06 and .08, TLI higher than .95 and CFI higher than .90 (Hu & Bentler, Citation1999; Steiger, Citation2007).
Convergent validity was measured by comparing the F-PRQF with the French adaptation of the Pedestrian Behavior Questionnaire (F-PBQ) (Deb et al., Citation2017).
4. Results
4.1. Exploratory study
4.1.1. Principal factor analysis
In line with the analyses carried out by Deb et al. (Citation2017) to test the construct validity of the PRQF, we replicate a principal component factor analysis (PCA) on the F-PRQF.
First, we obtain a Kaiser-Meykin-Olkin (KMO) measure of .924; Bartlett’s test of sphericity was highly significant (p < 0.000). As a first step, this allows us to ensure that the items in the F-PRQF are highly correlated with each other.
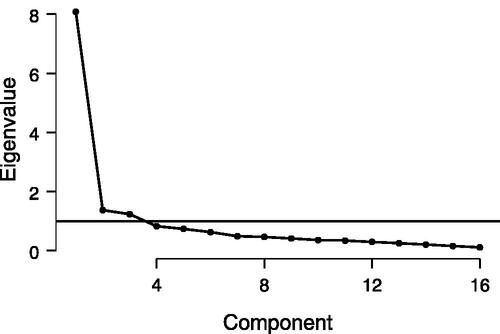
Cattell’s scree test (Citation1966) (Eigenvalues) suggest a 3-component structure for the F-PRQF, each with an eigenvalue above 1. The first component accounts for 50.520% of the variance, the second 8.584% and the third 7.729% ().
Figure 2. Scree plots for the F-PRQF, which suggests a three-component structure.
presents the scores following a three-component Varimax rotation for the 16 items of the F-PRQF, comprising items ATT1, AT2, AT3, AT4, AT5, EF1, EF2, T1, T2 and T3 for the first component, items S1, S2 and S3 for the second, and items C1, C2 and EF3-C3 for the third.
Table 5. 3-Component Varimax rotation for the 16 items of the F-PRQF.
Thus, the principal component analysis of the F-PRQF does not make it possible to find a factorial structure identical to that of the original scale, since the five dimensions do not differ completely. Only social norm (items S1, S2 and S3) and compatibility (C1, C2 and EF3-C3) appear in separate components. Attitude, efficacy and confidence items are grouped in the same component. It can be noted, however, that these items are the ones that directly ask participants about their interactions with VEAs, whereas the social norms items are concerned with what the respondent’s social environment thinks of VEAs, and the compatibility items are concerned with the external elements of VEAs (infrastructure, ability of VEAs to interact).
4.1.2. Internal consistency
To measure the reliability of the F-PRQF, we calculated Cronbach’s alpha and McDonald’s omega, which forms the most widely used reliability measurement tests in human and social sciences. The Cronbach coefficient alpha of the F-PRQF confirms adequate reliability, with a score of 0.932, considerably superior to the threshold of .70 recommended by Landauer (Citation1997) or Kline (Citation2005). The McDonald’s omega coefficient is 0.935.
There is no significant advantage to deleting an item. Only item 7 (S2) would enable an alpha of 0.933 and an omega of 0.936 to be obtained, but to us, this gain seems too small to justify the deletion of this item. It must be noted that item 7 is the only reversed item in the questionnaire. The deletion of all the other items reduces the Cronbach’s alpha and McDonald’s omega scores.
Therefore, our translation shows good internal consistency overall.
We also calculated the reliability scores for the five factors of the PRQF. The results are presented in .
Table 6. Cronbach’s alphas and McDonald’s omegas for each factor of the PRQF.
4.1.3. Associations between the F-PRQF scores and demographic variables
Several sensitivity analyses were undertaken and comparisons were drawn with the results obtained for the PRQF. In this way, like Deb et al. (Citation2017), we first obtain a significant difference to the general receptivity score depending on gender (F(2, 581) = 7.227, p < 0.001). On the other hand, there are no significant difference in terms of age (Pearson coefficient correlation r = 0.076, p = 0.068).
Our other comparisons allowed us to analyse the influence of variables other than those studied by Deb et al. (Citation2017). The possession of a driving licence has a significant influence on receptivity (F(2, 581) = 5.437, p = 0.005). Conversely, having been the victim of a road accident does not seem to have an impact on the receptivity score (F(2, 581) = 0.137, p = 0.872).
4.2. Confirmatory study
4.2.1. Confirmatory factor analysis
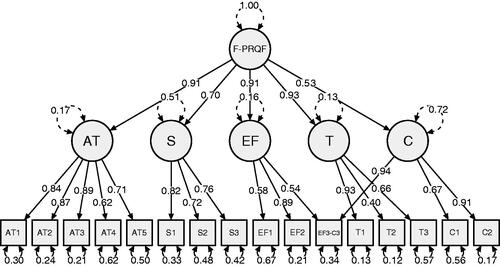
We did a confirmatory factor analysis (CFA) using the original organization by factor of the items of the PRQF. The objective here is to verify that the structure of the F-PRQF is sufficiently close to the structure of the original questionnaire, even if the results of the PCA were a little different concerning the items grouped together in each component. We used the weighted least squares (WLS) criterion for optimal estimation ().
Figure 3. Standardized solution of the confirmatory factor analysis of the F-PRQF, using the original structure of the PRQF. Correlation among factors and standard regression weights were all statistically significant, with p < 0.001 (AT: Attitudes; S: Social norms; EF: Effectiveness; T: Trust; C: Compatibility).
We also tested the three-factor structural model of the F-PRQF, found above by the PCA that we applied, and the three-factor structural model of the PRQF found by Deb et al. (Citation2017). The fit index values are presented in the .
Table 7. Fit index values for the three different tested models.
4.2.2. Convergent validity
Like Deb et al. (Citation2017), we compared the results to the scores of each subscale of the French version of the Pedestrian Behavior Questionnaire (F-PBQ) and each subscale of the F-PRQF. The Pearson correlation coefficients and p-values are indicated in .
Table 8. Results of the correlations between the subscales of the F-PBQ and those of the F-PRQF.
The results reveal that there is no significant correlation between the F-PBQ and the F-PRQF, whether for the global scores for each of the two scales or for each subscale. This partly corresponds to the results obtained by Deb et al. (Citation2017), even if we did not find significant links between the Errors and Interaction, or Aggressive behaviours and Interaction subscales, contrary to the results found with the original scale.
5. Discussions
The French version of the PRQF displays numerous psychometric qualities that tend to show that this questionnaire can be used by the French-speaking public. However, several points deserve to be discussed that could improve the current version of the F-PRQF.
5.1. Validation of the original structure of the PRQF
When designing and validating the PRQF, Deb et al. (Citation2017) created a 5-factor scale based on theoretical elements from a literature review. They proposed a conceptual model integrating attitudes, social norms, system effectiveness, trust and compatibility (). However, the PCA and CFA did not find and confirm the theoretical model. The authors then proposed a three-factor scale named Safety (including items AT1, AT2, S3 and EF2), Interaction (items T1, T2, T3, AT3, AT4, AT5, S1 and S2) and Compatibility (items EF3-C3, C1 and C2). The EF1 effectiveness item was removed from the CFA because it was too weakly associated with any of the three factors.
Our study on the psychometric validation of the French adaptation of the PRQF shows different results. Although the PCA also identified three factors, these did not include the same items as the PRQF. More importantly, the CFA that we conducted on the different models of the F-PRQF () validate the original theoretical model of the PRQF. Indeed, most of the fit index values are above the validity thresholds (CFI > .90; TLI > .95; SRMR < .06 and RMSEA < .08). Only the Chi2/df is greater than 3 (4.867).
We therefore recommend using and analysing the F-PRQF on the basis of its theoretical 5-factor model, keeping the theoretical distribution of items within these factors.
5.2. Reformulation of the reversed item
The calculation of the Cronbach’s alpha coefficient for the F-PRQF showed that a higher score, going from 0.927 to 0.932, could only be obtained by deleting item 7 (S2). However, we considered that this gain was not significant and that the F-PRQF already displayed a sufficiently high consistency (α = 0.927).
We also highlighted that item 7 was the only reversed item in the questionnaire, which brought us to consider the usefulness of this reversed item. Sauro and Lewis (Citation2011) carried out a survey on the reformulation of reversed items of the System Usability Scale (SUS) questionnaire, of which 1 item is reversed. The authors particularly highlight that the reversed items, formulated negatively, are less well understood by respondents than the other items, and are the cause of more errors in their completion. Even if the results are not all significant, Sauro and Lewis consider that the advantages of including reversed items (for example, to avoid certain completion biases) do not compensate for the disadvantages. Later, the same authors (Lewis & Sauro, Citation2017) re-evaluated the factor structure of the SUS according to several models. The structure that proved to be the most robust statistically is the one that distinguishes the reversed items (negative formulation) from the non-reversed items (positive formulation). Once again, these results prove that for the SUS, which aspires to be a single-factor scale, the use of reversed items disrupts the full understanding of these items.
Concerning the F-PRQF, it seem to us that item 7 (“Les gens qui comptent pour moi vont plutôt penser qu’il ne faut pas traverser la route devant des VEA”) would benefit from being reformulated in a way that avoids it being differentiated from the others simply because of its negative formulation. In this way, this item could be reformulated for example in the following way: “Les gens qui comptent pour moi vont plutôt penser que l’on peut traverser la route devant des VEA.”
5.3. Concurrent validation
The concurrent validation that we applied consisted, in keeping with Deb et al. (Citation2017), of measuring the links between the Pedestrian Behavior Questionnaire (PBQ) and the PRQF. To do this, we had to create a French version of the PBQ. The results did not show significant links between the two scales. It is thus possible that high-risk pedestrian behaviours are not directly related to receptivity towards FAV. Indeed the behaviours adopted when a pedestrian crosses the road do not systematically make reference to the manner in which he/she would be ready to accept autonomous vehicles. These two issues do not seem to us to be strongly correlated and could explain why we do not find significant links between the two questionnaires in their French versions.
In order to apply a concurrent validation that makes more sense, we could for example cross the F-PRQF with other questionnaires that also relate to the acceptance of technologies. Questionnaires like the Unified Theory of Acceptance and Use of Technology (UTAUT) (Venkatesh et al., Citation2003) seem to us to be more suitable for a cross analysis. In particular, the UTAUT has some subscales that are comparable to those of the PRQF, including attitude towards technology, social influence and perceived effectiveness. Although the UTAUT was designed more to evaluate acceptance of a technology in the area of work, it has been applied several times in other contexts, in particular, technologies intended for the general public (Hsu, Citation2012; Williams et al., Citation2015). Consequently, it could also be proposed to evaluate the acceptance of FAV, in order to be compared to the F-PRQF.
5.4. Limitations
Although this study proposed a first psychometric validation of a French version of the PRQF that meets a number of criteria, several limitations should be overcome. First of all, the validation of the F-PRQF focused on the dissemination of a survey without a specific study context. Indeed, participants were simply asked to express their perception of autonomous and connected vehicles as a pedestrian, without any situational proposition. The situations that could be proposed could be varied: position the participants in the street (or on a simulator) in front of a pedestrian crossing; display the image of a person (an adult, a child, an elderly person) crossing a street; or for example, ask the participants to express their receptivity according to the eHMIs integrated into the vehicles.
It would also be interesting to study the impact of other socio-demographic factors on the perception of fully autonomous vehicles. For example, the context of the participant’s habitat, urban or rural, may be an important factor in the global acceptance of autonomous vehicles. Personality is also an important element in the adoption of risky pedestrian behaviour (Herrero-Fernández et al., Citation2016). Furthermore, numerous studies have already shown that technological acceptance varied depending on the culture and country of residence (Al-Gahtani et al., Citation2007; Burton-Jones & Hubona, Citation2005). It would therefore be interesting to concentrate our efforts on recruiting respondents where we take into account where they live, and for example, compare several populations according to the French-speaking country. For example, we could expect to find cultural differences between the Quebecois population with its north American culture and the French population with its European culture. Differences could also be observed between certain European French-speaking countries, like between France, Belgium, Luxembourg and Switzerland.
Finally, the sample of respondents could be expanded to strengthen the psychometric analyses for the validation of the F-PRQF.
6. Conclusion and research perspectives
The aim of this study was to translate and validate a French version of the PRQF, developed by Deb et al. (Citation2017). This questionnaire with 16 items elicits the perception of pedestrians regarding autonomous vehicles, in particular in situations where the pedestrian has to cross a road where there is an FAV.
This translation appears important for the international French-speaking community, where French is the native language or one of the official languages. There are 29 states in the world where French is the everyday language, including France, Belgium, Luxembourg, Switzerland and Canada. These five countries are particularly active in research into autonomous vehicles. For example, France has several research institutes dedicated to transport and automation. The Institute of Energy Transition (ITE) VEDECOM develops numerous solutions as part of the New Industrial France (NFI) Autonomous Vehicle Plan, an Invest for the Future (PIA) programme supported by the Government. Other institutes such as IFSTTAR (French Institute of Science and Technology for Transport, Development and Networks), INRIA (National Institute for Research in Digital Science and Technology), Cerama (Centre for Studies on Risks, the Environment, Mobility and Urban Planning) or the LS2N (Nantes Laboratory of Digital Sciences) also focus part of their research on autonomous and connected vehicles and the related human issues. The F-PRQF could therefore also be a methodological tool that would be useful to them.
We also find several publications in French that used the PRQF translated freely (Dommes et al., Citation2020). A validated version would reinforce the robustness of these studies.
In agreement with Deb et al. (Citation2017) and Deb et al. (Citation2017), it seems interesting to us, although limited (see Section 5.3), to associate a measurement of high-risk pedestrian behaviours when they are crossing the road (as measured in the PBQ) with a measurement of receptivity of the pedestrians concerning FAV (as measured in the PRQF). For the concurrent validation of the F-PRQF, we therefore did a French translation of the PBQ. From this point on, we would need to continue with the psychometric validation of the F-PBQ, on one hand by disseminating it to a larger sample of respondents, while paying attention to the intercultural dimensions as stated above, and on the other, by intensifying the statistical analyses by a principal component and confirmatory factor analysis.
In this way, with a validated version of the F-PBQ available, we would be able not only to cross it with the F-PRQF in a more relevant way, but we would also further contribute to the methodological enrichment of the French-speaking community working on pedestrian safety.
Acknowledgements
Financial support by the European Union Horizon 2020 research and innovation programme is gratefully acknowledged (Project PAsCAL, grant N°815098).
We would also like to thank Marie Glandus for her close and valuable collaboration in the French adaptation of the PRQF.
Disclosure statement
No potential conflict of interest was reported by the author(s).
Correction Statement
This article has been republished with minor changes. These changes do not impact the academic content of the article.
Additional information
Notes on contributors
Guillaume Gronier
Guillaume Gronier is senior researcher at Luxembourg Institute of Science and Technology (LIST). His research interests include cognitive ergonomics, human-centered design, user experience, and adaptation of usability assessment methods. He is the coauthor (with Carine Lallemand) of the French reference book Méthodes de Design UX.
Lou Schwartz
Lou Schwartz is a researcher at the Luxembourg Institute of Science and Technology (LIST). His research focuses on human-centred design, user experience and participatory design.
Thibaud Latour
Thibaud Latour is Head of European Affairs at the Luxembourg Institute of Science and Technology (LIST) and Director of the Luxembourg Media & Digital Design Centre. When heading the LIST’s Human Dynamics and Cognitive Environment unit, his research focused on Knowledge Representation and multimodal human-physical environment interaction applied to EdTech.
References
- Abele, J., Kerlen, C., Kruger, S., Baum, H., Giessler, T., Grawenhoff, S., & Schulz, W. H. (2005). Exploratory Study on the potential socio-economic impact of the introduction of Intelligent Safety Systems in Road Vehicles. SEISS Final report. http://ec.europa.eu/information_society/activities/esafety/doc/call_4/final_seiss.pdf
- Ahmed, H. U., Huang, Y., Lu, P., & Bridgelall, R. (2022). Technology developments and impacts of connected and autonomous vehicles: An overview. Smart Cities, 5(1), 382–404. https://doi.org/10.3390/smartcities5010022
- Alessandrini, A., Campagna, A., Site, P. D., Filippi, F., & Persia, L. (2015). Automated vehicles and the rethinking of mobility and cities. Transportation Research Procedia, 5(1), 145–160. https://doi.org/10.1016/j.trpro.2015.01.002
- Al-Gahtani, S. S., Hubona, G. S., & Wang, J. (2007). Information technology (IT) in Saudi Arabia: Culture and the acceptance and use of IT. Information & Management, 44(8), 681–691. https://doi.org/10.1016/j.im.2007.09.002
- Alsalman, A., Assi, L. N., Ghotbi, S., Ghahari, S., & Shubbar, A. (2021). Users, planners, and governments perspectives: A public survey on autonomous vehicles future advancements. Transportation Engineering, 3(October 2020), 100044. https://doi.org/10.1016/j.treng.2020.100044
- Alvarez León, L. F., & Aoyama, Y. (2022). Industry emergence and market capture: The rise of autonomous vehicles. Technological Forecasting and Social Change, 180(August 2021), 121661. https://doi.org/10.1016/j.techfore.2022.121661
- Bagloee, S. A., Tavana, M., Asadi, M., & Oliver, T. (2016). Autonomous vehicles: Challenges, opportunities, and future implications for transportation policies. Journal of Modern Transportation, 24(4), 284–303. https://doi.org/10.1007/s40534-016-0117-3
- Bazilinskyy, P., Dodou, D., & de Winter, J. (2019). Survey on eHMI concepts: The effect of text, color, and perspective. Transportation Research Part F: Traffic Psychology and Behaviour, 67(1), 175–194. https://doi.org/10.1016/j.trf.2019.10.013
- Bella, F., & Silvestri, M. (2015). Effects of safety measures on driver’s speed behavior at pedestrian crossings. Accident; Analysis and Prevention, 83(1), 111–124. https://doi.org/10.1016/j.aap.2015.07.016
- Benz, M. (2015). The F 015 Luxury in motion. Retrieved August 15, 2021, from https://www.mercedes-benz.com/en/innovation/autonomous/research-vehicle-f-015-luxury-in-motion/
- Bissell, D., Birtchnell, T., Elliott, A., & Hsu, E. L. (2020). Autonomous automobilities: The social impacts of driverless vehicles. Current Sociology, 68(1), 116–134. https://doi.org/10.1177/0011392118816743
- Buehler, R. (2018). Can public transportation compete with automated and connected cars? Journal of Public Transportation, 21(1), 7–18. https://doi.org/10.5038/2375-0901.21.1.2
- Burton-Jones, A., & Hubona, G. S. (2005). Individual differences and usage behavior : Revisiting a technology acceptance model assumption. ACM SIGMIS Database: The DATABASE for Advances in Information Systems, 36(2), 58–77. https://doi.org/10.1145/1066149.1066155
- Cattell, R. B. (1966). The scree test for the number of factors. Multivariate Behavioral Research, 1(2), 245–276. https://doi.org/10.1207/s15327906mbr0102_10
- Chang, C.-M., Toda, K., Sakamoto, D., & Igarashi, T. (2017). Eyes on a car: An interface design for communication between an autonomous car and a pedestrian [Paper presentation]. In Proceedings of the 9th International Conference on Automotive User Interfaces and Interactive Vehicular Applications - AutomotiveUI ’17. ACM. https://doi.org/10.1145/3122986.3122989
- Chen, Y., Gonder, J., Young, S., & Wood, E. (2019). Quantifying autonomous vehicles national fuel consumption impacts: A data-rich approach. Transportation Research Part A: Policy and Practice, 122(November 2017), 134–145. https://doi.org/10.1016/j.tra.2017.10.012
- Crayton, T. J., & Meier, B. M. (2017). Autonomous vehicles: Developing a public health research agenda to frame the future of transportation policy. Journal of Transport & Health, 6(February), 245–252. https://doi.org/10.1016/j.jth.2017.04.004
- Davis, F. D. (1989). Perceived usefulness, perceived ease of use, and user acceptance of information technology. MIS Quarterly, 13(3), 319. https://doi.org/10.2307/249008
- de Clercq, K., Dietrich, A., Núñez Velasco, J. P., de Winter, J., & Happee, R. (2019). External human-machine interfaces on automated vehicles: Effects on pedestrian crossing decisions. Human Factors, 61(8), 1353–1370. https://doi.org/10.1177/0018720819836343
- Deb, S., Strawderman, L., Carruth, D. W., DuBien, J., Smith, B., & Garrison, T. M. (2017). Development and validation of a questionnaire to assess pedestrian receptivity toward fully autonomous vehicles. Transportation Research Part C: Emerging Technologies, 84(1), 178–195. https://doi.org/10.1016/j.trc.2017.08.029
- Deb, S., Strawderman, L., DuBien, J., Smith, B., Carruth, D. W., & Garrison, T. M. (2017). Evaluating pedestrian behavior at crosswalks: Validation of a pedestrian behavior questionnaire for the U.S. population. Accident Analysis & Prevention, 106(January), 191–201. https://doi.org/10.1016/j.aap.2017.05.020
- Dey, D., Habibovic, A., Löcken, A., Wintersberger, P., Pfleging, B., Riener, A., Martens, M., & Terken, J. (2020). Taming the eHMI jungle: A classification taxonomy to guide, compare, and assess the design principles of automated vehicles’ external human-machine interfaces. Transportation Research Interdisciplinary Perspectives, 7, 100174. https://doi.org/10.1016/j.trip.2020.100174
- Dey, D., & Terken, J. (2017). Pedestrian interaction with vehicles: Roles of explicit and implicit communication [Paper presentation]. In AutomotiveUI 2017 - 9th International ACM Conference on Automotive User Interfaces and Interactive Vehicular Applications, Proceedings (pp. 109–113). ACM. https://doi.org/10.1145/3122986.3123009
- Dey, D., Holländer, K., Berger, M., Eggen, B., Martens, M., Pfleging, B., & Terken, J. (2020). Distance-dependent eHMIs for the interaction between automated vehicles and pedestrians. In Proceedings - 12th International ACM Conference on Automotive User Interfaces and Interactive Vehicular Applications, AutomotiveUI 2020 (pp. 192–204). ACM. https://doi.org/10.1145/3409120.3410642
- Dey, D., Martens, M., Wang, C., Ros, F., & Terken, J. (2018). Interface concepts for intent communication from autonomous vehicles to vulnerable road users [Paper presentation].Adjunct Proceedings - 10th International ACM Conference on Automotive User Interfaces and Interactive Vehicular Applications, In, AutomotiveUI 2018 (pp. 82–86). https://doi.org/10.1145/3239092.3265946
- Dommes, A., Olivier, A.-H., Merlhiot, G., & Lobjois, R. (2020). Projet AUTOMA-PIED: Quelles interactions véhicules AUTOMAtisés - PIEtons pour Demain ?. Délégation à la Sécurité Routiére.
- Gana, K., Boudouda, N. E., Ben Youssef, S., Calcagni, N., & Broc, G. (2021). Adaptation transculturelle de tests et échelles de mesure psychologiques: guide pratique basé sur les Recommandations de la Commission Internationale des Tests et les Standards de pratique du testing de l’APA. Pratiques Psychologiques, 27(3), 223–240. https://doi.org/10.1016/j.prps.2021.02.001
- Gholamhosseinian, A., & Seitz, J. (2022). A comprehensive survey on cooperative intersection management for heterogeneous connected vehicles. IEEE Access, 10, 7937–7972. https://doi.org/10.1109/ACCESS.2022.3142450
- Golbabaei, F., Yigitcanlar, T., & Bunker, J. (2021). The role of shared autonomous vehicle systems in delivering smart urban mobility: A systematic review of the literature. International Journal of Sustainable Transportation, 15(10), 731–748. https://doi.org/10.1080/15568318.2020.1798571
- Greenblatt, J. B., & Saxena, S. (2015). Autonomous taxis could greatly reduce greenhouse-gas emissions of US light-duty vehicles. Nature Climate Change, 5(9), 860–863. https://doi.org/10.1038/nclimate2685
- Gronier, G. (2022). Psychometric analyses in the transcultural adaptation of psychological scales. In S. Misciagna (Ed.), Psychometrics - new insights (pp. 1–13). IntechOpen.
- Hawes, M. (2017). Connected and Autonomous Vehicles: Revolutionising Mobility in Society. International Automotive Summit. Retrieved from https://www.smmt.co.uk/wp-content/uploads/sites/2/Connected-and-Autonomous-Vehicles-Revolutionising-Mobility-in-Society.pdf.
- Hayes, A. F., & Coutts, J. J. (2020). Use omega rather than Cronbach’s alpha for estimating reliability. But…. Communication Methods and Measures, 14(1), 1–24. https://doi.org/10.1080/19312458.2020.1718629
- Herrero-Fernández, D., MacÍa-Guerrero, P., Silvano-Chaparro, L., Merino, L., & Jenchura, E. C. (2016). Risky behavior in young adult pedestrians: Personality determinants, correlates with risk perception, and gender differences. Transportation Research Part F: Traffic Psychology and Behaviour, 36(1), 14–24. https://doi.org/10.1016/j.trf.2015.11.007
- Hsu, H. (2012). The acceptance of moodle: An empirical study based on UTAUT. Creative Education, 03(08), 44–46. https://doi.org/10.4236/ce.2012.38B010
- Hu, L. T., & Bentler, P. M. (1999). Cutoff criteria for fit indexes in covariance structure analysis: Conventional criteria versus new alternatives. Structural Equation Modeling: A Multidisciplinary Journal, 6(1), 1–55. https://doi.org/10.1080/10705519909540118
- Imprialou, M., & Quddus, M. (2019). Crash data quality for road safety research: Current state and future directions. Accident; Analysis and Prevention, 130(1), 84–90. https://doi.org/10.1016/j.aap.2017.02.022
- ISO 9241-210:2010 (2010). Ergonomics of human-system interaction - Part 210: Human-centred design for interactive systems. International Organization for Standardization.
- Jian, J.-Y., Bisantz, A. M., Drury, C. G., & Llinas, J. (1998). United States Air Force research laboratory foundations for an empirically determined scale of trust in automated systems. Air Force Research Laboratory. https://apps.dtic.mil/sti/pdfs/ADA395339.pdf
- Jones, E. C., & Leibowicz, B. D. (2019). Contributions of shared autonomous vehicles to climate change mitigation. Transportation Research Part D: Transport and Environment, 72(May), 279–298. https://doi.org/10.1016/j.trd.2019.05.005
- Kline, R. B. (2005). Principles and practice of structural equation modeling (2nd ed.). New York: The Guilfo.
- Landauer, T. K. (1997). Chapter 9 - behavioral research methods in human-computer interaction. In Handbook of human-computer interaction (2nd ed., pp. 203–227). Elsevier Science.
- Lee, Y. M., Madigan, R., Giles, O., Garach-Morcillo, L., Markkula, G., Fox, C., Camara, F., Rothmueller, M., Vendelbo-Larsen, S. A., Rasmussen, P. H., Dietrich, A., Nathanael, D., Portouli, V., Schieben, A., & Merat, N. (2021). Road users rarely use explicit communication when interacting in today’s traffic: Implications for automated vehicles. Cognition, Technology & Work, 23(2), 367–380. https://doi.org/10.1007/s10111-020-00635-y
- Lewis, J. R., & Sauro, J. (2017). Revisiting the factor structure of the system usability scale. Journal of Usability Studies, 12(4), 183–192. https://uxpajournal.org/revisit-factor-structure-system-usability-scale/
- Liu, Y. C., & Tung, Y. C. (2014). Risk analysis of pedestrians’ road-crossing decisions: Effects of age, time gap, time of day, and vehicle speed. Safety Science, 63(1), 77–82. https://doi.org/10.1016/j.ssci.2013.11.002
- Liu, H., Hirayama, T., & Watanabe, M. (2021). Importance of Instruction for Pedestrian-Automated Driving Vehicle Interaction with an External Human Machine Interface: Effects on Pedestrians’ Situation Awareness, Trust, Perceived Risks and Decision Making. In 2021 IEEE Intelligent Vehicles Symposium (IV). (pp. 748–754). Nagoya, Japan: IEEE.
- Lu, Q., Tettamanti, T., Hörcher, D., & Varga, I. (2020). The impact of autonomous vehicles on urban traffic network capacity: An experimental analysis by microscopic traffic simulation. Transportation Letters, 12(8), 540–549. https://doi.org/10.1080/19427867.2019.1662561
- Masello, L., Castignani, G., Sheehan, B., Murphy, F., & McDonnell, K. (2022). On the road safety benefits of advanced driver assistance systems in different driving contexts. Transportation Research Interdisciplinary Perspectives, 15(July), 100670. https://doi.org/10.1016/j.trip.2022.100670
- Metz, D. (2018). Developing policy for urban autonomous vehicles: Impact on congestion. Urban Science, 2(2), 33. https://doi.org/10.3390/urbansci2020033
- Minelli, S., Izadpanah, P., & Razavi, S. (2015). Evaluation of connected vehicle impact on mobility and mode choice. Journal of Traffic and Transportation Engineering (English Edition), 2(5), 301–312. https://doi.org/10.1016/j.jtte.2015.08.002
- Nieuwenhuijsen, J., Correia, G. H. D. A., Milakis, D., van Arem, B., & van Daalen, E. (2018). Towards a quantitative method to analyze the long-term innovation diffusion of automated vehicles technology using system dynamics. Transportation Research Part C: Emerging Technologies, 86(May 2017), 300–327. https://doi.org/10.1016/j.trc.2017.11.016
- Nunnally, J. C. (1978). Psychometric theory (2d ed.). McGraw-Hill New York.
- Osswald, S., Wurhofer, D., Trösterer, S., Beck, E., & Tscheligi, M. (2012). Predicting information technology usage in the car: Towards a car technology acceptance model. In AutomotiveUI 2012 - 4th International Conference on Automotive User Interfaces and Interactive Vehicular Applications, in-Cooperation with ACM SIGCHI - Proceedings, (October 2012) (pp. 51–58). ACM. https://doi.org/10.1145/2390256.2390264
- Palmer, K. (2018). Jaguar Land Rover’s virtual eyes look at trust in self-driving cars. https://www.jaguarlandrover.com/news/2018/08/jaguar-land-rovers-virtual-eyes-look-trust-self-driving-cars
- Pavone, M. (2015). Autonomous mobility-on-demand systems for future urban mobility. In M. Maurer, J. Gerdes, B. Lenz, & H. Winner (Ed.), Autonomes Fahren: technische, rechtliche und gesellschaftliche Aspekte. Springer. https://doi.org/10.1007/978-3-662-45854-9
- Pettigrew, S. (2017). Why public health should embrace the autonomous car. Australian and New Zealand Journal of Public Health, 41(1), 5–7. https://doi.org/10.1111/1753-6405.12588
- Pettigrew, S., & Cronin, S. L. (2019). Stakeholder views on the social issues relating to the introduction of autonomous vehicles. Transport Policy, 81(June), 64–67. https://doi.org/10.1016/j.tranpol.2019.06.004
- Pettigrew, S., Talati, Z., & Norman, R. (2018). The health benefits of autonomous vehicles: Public awareness and receptivity in Australia. Australian and New Zealand Journal of Public Health, 42(5), 480–483. https://doi.org/10.1111/1753-6405.12805
- Rabardel, P., & Beguin, P. (2005). Instrument mediated activity: From subject development to anthropocentric design. Theoretical Issues in Ergonomics Science, 6(5), 429–461. https://doi.org/10.1080/14639220500078179
- Ren, Z., Jiang, X., & Wang, W. (2016). Analysis of the influence of pedestrians’ eye contact on drivers’ comfort boundary during the crossing conflict. Procedia Engineering, 137(1), 399–406. https://doi.org/10.1016/j.proeng.2016.01.274
- Sanguesa, J. A., Torres-Sanz, V., Garrido, P., Martinez, F. J., & Marquez-Barja, J. M. (2021). A review on electric vehicles: Technologies and challenges. Smart Cities, 4(1), 372–404. https://doi.org/10.3390/smartcities4010022
- Sauro, J., & Lewis, J. R. (2011). When designing usability questionnaires, does it hurt to be positive? In Conference on Human Factors in Computing Systems - Proceedings (pp. 2215–2223). ACM. https://doi.org/10.1145/1978942.1979266
- Schoettle, B., & Sivak, M. (2014). Public opinion about self-driving vehicles in China, India, Japan, the U.S., the U.K., and Australia. The University of Michigan.
- Schweizer, K. (2010). Some guidelines concerning the modeling of traits and abilities in test construction. European Journal of Psychological Assessment, 26(1), 1–2. https://doi.org/10.1027/1015-5759/a000001
- Shiwakoti, N., Stasinopoulos, P., & Fedele, F. (2020). Investigating the state of connected and autonomous vehicles: A literature review. Transportation Research Procedia, 48(2018), 870–882. https://doi.org/10.1016/j.trpro.2020.08.101
- Sindi, S., & Woodman, R. (2021). Implementing commercial autonomous road haulage in freight operations: An industry perspective. Transportation Research Part A: Policy and Practice, 152(August), 235–253. https://doi.org/10.1016/j.tra.2021.08.003
- Steiger, J. H. (2007). Understanding the limitations of global fit assessment in structural equation modeling. Personality and Individual Differences, 42(5), 893–898. https://doi.org/10.1016/j.paid.2006.09.017
- Sucha, M., Dostal, D., & Risser, R. (2017). Pedestrian-driver communication and decision strategies at marked crossings. Accident; Analysis and Prevention, 102(1), 41–50. https://doi.org/10.1016/j.aap.2017.02.018
- Thomopoulos, N., & Givoni, M. (2015). The autonomous car—a blessing or a curse for the future of low carbon mobility? An exploration of likely vs. desirable outcomes. European Journal of Futures Research, 3(14), 1–14. https://doi.org/10.1007/s40309-015-0071-z
- Tu, R., Alfaseeh, L., Djavadian, S., Farooq, B., & Hatzopoulou, M. (2019). Quantifying the impacts of dynamic control in connected and automated vehicles on greenhouse gas emissions and urban NO2 concentrations. Transportation Research Part D: Transport and Environment, 73(July), 142–151. https://doi.org/10.1016/j.trd.2019.06.008
- Vallerand, R. J. (1989). Vers une méthodologie de validation trans-culturelle de questionnaires psychologiques : Implications pour la recherche en langue française. Canadian Psychology / Psychologie canadienne, 30(4), 662–680. https://doi.org/10.1037/h0079856
- Várhelyi, A. (1998). Drivers’ speed behaviour at a zebra crossing: A case study. Accident Analysis & Prevention, 30(6), 731–743. https://doi.org/10.1016/S0001-4575(98)00026-8
- Venkatesh, V., Morris, M. G., Davis, G. B., & Davis, F. D. (2003). User acceptance of information technology: Toward a unified view. MIS Quarterly, 27(3), 425–478. https://doi.org/10.2307/30036540
- Vorsteher, D. (2017). Autonomous concept car smart vision EQ fortwo: Welcome to the future of car sharing. Retrieved August 15, 2021, from https://media.daimler.com/marsMediaSite/en/instance/ko/Autonomous-concept-car-smart-vision-EQ-fortwo-Welcome-to-the-future-of-car-sharing.xhtml?oid=29042725
- Wang, S., Li, Z., & Levin, M. W. (2022). Optimal policy for integration of autonomous vehicles into the auto market. Transportation Research Part C: Emerging Technologies, 143(July), 103821–103836. https://doi.org/10.1016/j.trc.2022.103821
- Williams, M. D., Rana, N. P., & Dwivedi, Y. K. (2015). The unified theory of acceptance and use of technology (UTAUT): A literature review. Journal of Enterprise Information Management, 28(3), 443–488. https://doi.org/10.1108/JEIM-09-2014-0088