
Abstract
Gesture data collection in a controlled lab environment often restricts participants to performing gestures in a uniform or biased manner, resulting in gesture data which may not sufficiently reflect gesture variability to build robust gesture recognition models. Crowdsourcing has been widely accepted as an efficient high-sample-size method for collecting more representative and variable data. In this study, we evaluated the effectiveness of crowdsourcing for gesture data collection, specifically for gesture variability. When compared to a controlled lab environment, crowdsourcing resulted in improved recognition performance of 8.98% and increased variability for various gesture features, eg, a 142% variation increase for Quantity of Movement. Integrating a supplemental gesture data collection methodology known as Styling Words increased recognition performance by an additional 2.94%. The study also investigated the efficacy of gesture collection methodologies and gesture memorization paradigms.
1. Introduction
Among the various modalities, body gestures are one of the most intuitive and widely used tools to facilitate interaction between humans and computers. Gesture recognition technology should be incorporated to introduce this modality to an interactive system, as a technology that accurately recognizes gestures corresponding to the user’s intentions is indispensable. However, gesture recognition performance often deteriorates in practical use due to a variety of factors, eg, who, when, and where performing gestures or the conditions of gesture-sensing platforms (Taranta et al., Citation2015). It is essential to collect training data of large quantity and good quality to build a robust model representing these factors but collecting substantial gestures with high variability is challenging when collecting gesture data (Alallah et al., Citation2018; Cheema & LaViola, Citation2011; Taranta et al., Citation2020) to generalize a model which will work in real-life applications. Meanwhile, when users utilize a gesture recognition system, each individual performs each gesture is performed differently between individuals, and there are even variations within an individual (Caramiaux et al., Citation2013), depending on their emotional state (Noroozi et al., Citation2021; Savargiv & Bastanfard, Citation2013), fatigue, and gesture comprehension. A wide variety and quantity of gesture data should be collected in a natural environment to properly reflect on sufficient gesture variability.
However, most research has collected gesture data within a static pre-defined environment created by researchers. Data collection from a pre-configured lab environment is efficient, but such a controlled collection environment sometimes leads to data bias or uniformity. To remedy the lack of optimal data collection with respect to gesture variability, researchers have attempted to improve gesture variability through various methodologies such as diversifying backgrounds (Zhang et al., Citation2018), increasing the number of participants (Albanie et al., Citation2021; Duarte et al., Citation2021) collecting gestures in the context of interacting with an application (Taranta et al., Citation2020), introducing data augmentation (Masi et al., Citation2016; Suzuki et al., Citation2020), and directly presenting additional instructions which induce participants to manifest gesture variability (Kang et al., Citation2021; Vatavu et al., Citation2013; Wobbrock et al., Citation2007).
Crowdsourcing, a method for collecting data quickly and efficiently from many unspecified persons, is increasingly being used to collect various data. This approach involves an unspecified number of workers who are free to engage in tasks within their own comfortable space without any supervision besides a set of instructions. Due to the diversity of participant populations and unrestricted environmental characteristics, crowdsourcing is inherently diverse in inter-participant and environmental variations. Crowdsourcing is one good method for the collection of gesture data reflecting a sufficient level of variability.
The contributions of this study are as follows. (1) we verify through quantitative analysis of gesture features that crowdsourcing is more effective for gesture data collection than lab-based collection. We also (2) investigate the effect of integrating Styling Words, a methodology to introduce gesture variability, into the two data collection approaches. Finally, we (3) discuss the attributes of an optimal test environment which would generate more realistic test datasets for more effective evaluation of recognition models.
We explored the following research questions:
RQ1: Is crowdsourcing-based gesture data collection better than conventional lab-based data collection?
RQ2: Does the crowdsourcing environment create synergy with another technique which increases gesture variability?
RQ3: What methods and environments lead to the collection of more meaningful gesture data?
2. Background
2.1. Gesture data collection
In order to design gesture-based interactive systems, researchers use pre-defined gesture sets and collect such sets themselves. Caramiaux et al. collected gesture data directly using a variety of gestures for interacting with touch screen research (Caramiaux et al., Citation2013). Watanabe and Terada collected gesture data to propose an ultrasound-based in-air gesture recognition system (Watanabe & Terada, Citation2018). Kajiwara collected data manually by using acceleration data weighted by sEMG as input for a gesture recognition system to reduce the influence of unstable motion (Kajiwara & Murao, Citation2019).
As such, researchers often build and collect gesture datasets themselves in various studies. When collecting gesture data in a controlled environment (ie, in a laboratory), recorded gestures share similar environmental factors such as consistent camera settings and backgrounds. Participants perform gestures in the same environment as instructed and supervised by researchers, a practice accepted due to its efficiency and convenience. Meanwhile, in the context of interaction with an application, gestures are performed differently by various individuals in more natural (and therefore diverse) environments, and an individual performs gestures with subtle differences in various contexts, eg, affective states (Kleinsmith & Bianchi-Berthouze, Citation2013; Noroozi et al., Citation2021) and gesture usage (Cheema & LaViola, Citation2011; LaViola, Citation2015; Taranta et al., Citation2015, Citation2020).
In order address the diversity of gestures in the field, a recognition model must be fed training data of quantity and quality to provide sufficient gesture variability. Researchers have attempted to improve gesture variability through various methodologies. Zhang et al. constructed an egocentric hand gesture dataset (EgoGesture) using six different backgrounds (4 indoor and 2 outdoor), and strong or weak illumination conditions generated with shadows (Zhang et al., Citation2018). There are also studies that increase the numbers of participants or more diverse gesture data. In the case of a sign language existing in each country, this diversity is achieved by constructing a large amount of data using educational sign language videos existing in a wild environment such as the Internet, YouTube (Duarte et al., Citation2021; Joze & Koller, Citation2018; Li et al., Citation2019; Shi et al., Citation2018). Albanie et al. built a sign language dataset using more than 1000 participants (Albanie et al., Citation2021). Duarte et al. built a large-scale American Sign Language dataset with a vast 16,000-word vocabulary and over 80 hr duration of video footage (Duarte et al., Citation2021). Similar to the crowdsourcing method, these datasets have the advantage of being able to collect more diverse and large numbers of gestures. These studies have the advantage of building a large number of datasets using publicly released video without directly recording gestures, but there is a disadvantage of requiring post-processing depending on the different video contents formats or qualities by setting consistent standards. In addition, it should be premised that there should be many publicly available video sources such as sign language, so there is a disadvantage that it is difficult to use if researchers need to directly define and collect new gestures that meet the purpose.
To include more realistic gesture variability, there are also studies that collect gestures in the context of interacting with applications or provide additional instructions. Taranta et al. quickly copied a pre-defined stroke gesture trajectory and collected gestures (Taranta et al., Citation2020). Wobbrock et al. and Vatavu et al. presented a word-based gesture construction theme, eg, small or fast to collect stroke gestures (Vatavu et al., Citation2013; Wobbrock et al., Citation2007), and Kang et al. presented a set of various word-based instructions with which to collect body gestures (Kang et al., Citation2021). These studies are not focused on analyzing the quality of gestures or discuss the quality of gestures using only the performance evaluation of the recognition model.
2.2. Crowdsourcing data collection
The crowdsourcing method, in which many workers simultaneously perform tasks, has the advantage of collecting large amounts of data quickly and efficiently (Brown et al., Citation2014). The workers participate perform the tasks according to their own circumstances, leading to large environmental variations. Crowdsourcing has been commonly used in many computer vision studies to generate labels and annotations for images (Bastanfard et al., Citation2022; Su et al., Citation2012) and videos (Vondrick et al., Citation2013), but unlike these tasks, which often require only accuracy, some tasks such as gesture data collection also concern variability. Sigurdsson et al. used crowdsourcing to ensure the diversity of data in building video datasets in action recognition and automatic description generation tasks (Sigurdsson et al., Citation2016). Cooper et al. collected a speech corpus for use in voice technology (Cooper et al., Citation2019). In the field of affective computing, some researchers collected facial data through crowdsourcing (Kim & Vangala, Citation2016; McDuff et al., Citation2012; Tan et al., Citation2013). Koblin exhibited web-based artwork using Amazon’s Mechanical Turk by collecting paintings of sheep paintings with simple sketches of participants (Koblin, Citation2009). Pukey and Wouters created a music video by combining tens of thousands of videos in which crowd-workers imitated a set of movements (Puckey & Wouters, Citation2010). In general, crowdsourcing-based data collection is often the best match for a given purpose, inherently including environmental and individual variations (Vaughan, Citation2017).
In particular, similar to our work, there are studies using crowdsourcing to collect gesture data that include various variability. Spiro collected body gestures through crowdsourcing-based webcam games (Motion-Chain, Spiro, Citation2012) to build the Video of the Human Motion corpus. Game players watch a short video of one person and interact with others while attempting to copy it and happily participate in collecting gesture data. Shahriyar and Yang present CrowdLearner, a framework based on crowdsourcing to automatically generate recognizers using mobile sensor input. Through six gesture recognition tasks, they identified the potential for developers to create specific recognizers from crowd-walkers quickly and cheaply (Amini & Li, Citation2013). Mukushev et al. utilized crowdsourcing to build a large-scale Kazakh–Russian sign language dataset (FluentSigners-50). They were able to achieve the advantages of continuous signings, signer variability, and native signers through crowdsourcing (Mukushev et al., Citation2022). These studies have been able to increase gesture diversity by using crowdsourcing to recruit collection participants, but their purpose is somewhat different from those that confirm the usefulness of a crowdsourcing platform for data collection.
Several researchers have conducted investigating the similarities and differences between data collected through crowdsourcing and more traditional, laboratory-style data collection. Alallah et al. investigate the potential suitability of conducting crowdsourced social acceptability studies of HWD input modalities (Alallah et al., Citation2018). Yuhui and Tian investigate the differences in perceived usability evaluation between crowdsourcing platforms and laboratory tests (Yuhui et al., Citation2020). Because the unsupervised environment of crowdsourcing can cause problems such as unintended participant behavior or not paying attention, these studies mainly focus on whether data collected in-lab can be replaced by crowdsourcing while ensuring data quality.
We present a study that compares the value of collecting gesture data in-lab vs. through crowdsourcing from the perspective of gesture variability. Specifically, the work focuses on understanding the benefits of crowdsourcing for providing gesture data sets with greater variability.
3. Method
To compare gesture data collection in crowdsourcing-based (CR) and lab-based (LAB) environments in terms of gesture variability and synergy with the Styling Words (SW) method, two variables were considered: instruction (SW or common (CO) instructions) and environment (CR or LAB). The data pairings were as follows: CR with CO instructions (CR-CO), CR with the SW (CR-SW), LAB with CO instructions (LAB-CO), and LAB with the SW (LAB-SW). The test datasets were collected separately, and details related to the datasets are specified in Section 3.3. The recognition performance of the four trained models, ie, CR-CO, CR-SW, LAB-CO, and LAB-SW, was evaluated by collected test data.
3.1. Gesture and gesture features
For gesture analysis, we selected 12 upper-body gestures known as Sondam in Korea (Lee et al., Citation2019). These gestures are used as an alternative method of communication for people with severe disabilities, such as Makaton in the UK (Grove & Walker, Citation1990) and the Guk System in Germany (Giel, Citation2012). As shown in , half of the selected gestures are one-handed movements and the others are two-handed.
Table 1. The 12 upper-body gestures
Skeleton-based gesture features were used in order to quantitatively analyze the gesture data. We observed six gesture features in the study listed in : Gesture Area, Quantity of Movement, Performance Time, Average gesture Speed, Body Posture Variation, and Body Posture Density. We referenced twelve 2D gesture features redefined (Kang et al., Citation2021) from the 3D gesture features proposed by Vatavu (Vatavu, Citation2017).
Table 2. 2D gesture features redefined from 2D features (Kang et al., Citation2021)
3.2. Skeleton key point detection and gesture recognition
In the collected gesture videos, the beginning and end frames of each gesture were manually trimmed. We directly checked the collected video during the data pre-processing and conducted a full inspection if there were any gestures that were performed excessively incorrectly, and if there were any problems with video data. Skeleton data were extracted in the BODY_25 formatFootnote2 by using the OpenPose model (Cao et al., Citation2021) from the trimmed gesture samples. By utilizing the characteristic of the Sondam gesture which consists only of upper-body gestures, only upper-body-related joints (No. 0–8) were used among the 25 extracted 2D joints. To minimize the variance in skeleton values due to figure position and body size, post-processed skeleton data was extracted from OpenPose. The pelvic joint (No. 8) was affixed to the origin (0, 0) and the distance of all points to the origin were scaled based on each figures’ upper body height. For gesture recognition, we adopted Double-feature Double-motion Network (DD-Net) (Yang et al., Citation2019), a skeleton-based action recognition model. This model is a lightweight network implemented Keras backend in Tensorflow. The basic architecture of DD-net based on the multilayer ConvNet was used in the same way. For details on experiments and hyperparameters, settings were described in 4.1. Recognition performance part.
3.3. Data collection
As mentioned above, we configured six separate datasets: four training datasets, ie, two CR training datasets (TR-CR-CO and TR-CR-SW) and two LAB training datasets (TR-LAB-CR and TR-LAB-SW), as summarized in , and two test datasets, ie, a CR test dataset (TE-CR) and a LAB test dataset (TE-LAB).
Table 3. Details of the datasets collected in the study
All participants in each of the LAB and CR environments watched the same tutorial video once and repeated the gesture 5 times in one collection session. In the case of the SW session, gestures were performed sequentially according to 5 SWs. (eg, “Please follow this gesture Huge”. fast, slow…). For the NW session, the gesture just watched was repeated 5 times without further instructions. (eg, “Please follow this gesture” 5). However, in the case of CR, participants can watch the tutorial video repeatedly at any time, so they may have watched the tutorial video more often than in the LAB environment. The training datasets were collected by the imitation method. We presented the same gesture tutorial video to participants and asked them to immediately repeat the gestures depicted on the tutorial. Unlike the training datasets, the test datasets were collected by the memorization method. 1–2 days before data collection, participants learned and remembered the gestures from the tutorial videos. On the day of the data collection, we asked participants to perform the target gestures based entirely from memory without watching the video for reference so that the gestures in the test datasets were natural. It is intended to use the gestures their memory, just as they perform gestures in daily life. With respect to the collection environments, we expected the LAB datasets (TR-LAB-CO, TR-LAB-SW, and TE-LAB) to be more uniform and have less variance than the CR datasets (TR-CR-CO, TR-CR-SW, and TE-CR). We also expected more variance in the test datasets because participants would be performing gestures from memory rather than simply imitating gestures from videos.
3.3.1. Types of collection environments
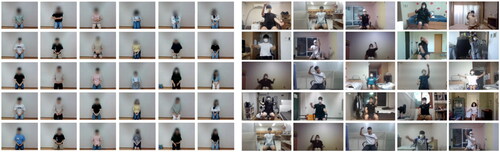
Lab-based. Environmental conditions such as camera distance and angles, lighting, and background were consistently controlled by the researchers. As indicated by the gestures on the left side of , the camera was placed in front of the participants.
Crowdsourcing-based. Every participant configured their own recording environments for themselves to record gesture videos, as indicated by the gestures on the right side of . Except that a participant’s upper body, hands, and full face must be visible in the recordings, no further instructions were given besides a web page with basic instructions on how to collect gestures (See ). Within a week, each participant independently completed a set of gesture recordings.
Figure 1. Examples of the crowdsourcing collection web page. (a) illustrates the process of collecting gesture videos through online. (b) shows the part of the guidelines page for collecting quality gesture videos. (c) shows a list of gestures with illustrations for participants to select gestures.
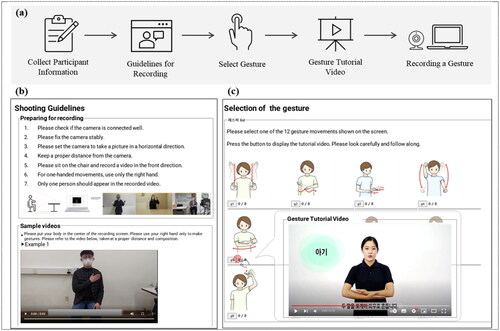
Figure 2. Examples of collected data in the LAB (left) and CR (right) datasets
3.3.2. Additional instructions
Styling Words. According to (Kang et al., Citation2021) this approach has been demonstrated to increase gesture variability in the LAB environment and ultimately contribute to improving recognition performance. Participants were given a target gesture with an additional descriptive phrase, eg, “please perform this gesture sadly.” A total of two types of styling word sets were used for data collection. It is divided into an intuitive set (type1) and an abstract set (type2), and each type includes one None-Word (NW) that does not provide any additional instructions (type1: fast, slowly, huge, small and NW/type2: excitedly, sadly, roughly, and elegantly and NW).
Common instructions. Participants were told a plain phrase, eg, “please perform this gesture,” without any additional instructions.
3.3.3. Training vs. test datasets
Creating training gesture data by imitating the reference videos. Forty individuals participated in the training data collection, 20 for the CR environment and 20 for the LAB environment. Participants watched a tutorial video before performing a gesture, and immediately imitated the gesture. 9600 samples were collected for the TR-CR-SW dataset [20 participants × 12 gestures × 10 SWs × 2 repetitions = 4800 samples] and the TR-CR-CO dataset [20 participants × 12 gestures × 20 repetitions = 4800 samples]. The same number of samples were completed for the TR-LAB-SW and TR-LAB-CO datasets.
Creating training gesture data by recalling a memory. Twenty individuals participated in test data collection, 10 for the CR environment and 10 for the LAB environment. Participants learned and memorized all 12 gestures at least one day before participating in the data collection. During the data collection, they recreated the gestures from memory. 2400 samples were collected: 1200 for the TE-CR dataset [10 participants × 12 gestures × 10 repetitions = 1200] and 1200 for the TE-LAB dataset [10 participants × 12 gestures × 10 repetitions = 1200]. The details of the datasets are described in .
3.4. Participants
Participants in the collection of all dataset types, including TR and TE, were recruited through on-campus and off-campus recruitment communities. Participants freely accessed the instructional web page and participated in the CR collection environment (See ). Participants visited a laboratory which had been configured for the LAB collection environment in advance and participated in the collection. 12 males and 8 females worked for two to five days to collect the CR environment training datasets TR-CR-CO and TR-CR-SW, and another 6 males and 4 females worked from one to two days to collect the test dataset TE-CR. For LAB data collection, other 10 males and 10 females worked for four days to collect the LAB environment training datasets TR-LAB-CR and TR-LAB-SW, and another 5 males and 5 females worked for a day to collect the LAB environment test dataset (TE-LAB). The age of the participants ranged approximately from the 20s to 50s. After data collection was performed, participants involved in the collection of training and test datasets were paid $50 and $26, respectively, as compensation for their efforts. We received consent from all participants to share videos containing their faces for research purposes.
4. Experiments
4.1. Recognition performance
A total of four models (CR-CO, CR-SW, LAB-CO, and LAB-SW) were trained using their corresponding training datasets (TR-CR-CO, TR-CR-SW, TR-LAB-CO, and TR-LAB-SW, respectively). All models, (# of 1p, 4p, 10p, and 20p) were evaluated by 20-fold cross-validation, and the #19p models (n = 19) were evaluated through leave-one participant-out cross-validation. Therefore, there were a total of 20 models for each number of participants, and the evaluation result corresponding to the number of participants was the average accuracy. The performance of the four models was measured on the CR test dataset (TE-CR). presents the results by changing the number of participants in the training. The boxplot on graph #20p particularly indicates the distribution of the performance for the 20 models in #20p. One RTX-2080ti GPU was used for training, and the number of filters and epochs were set to 32 and 150. In the original paper (Yang et al., Citation2019), the learning rate was sequentially reduced from 1e-3 to 1e-5, but we fixed it to 1e-4 for this study.
Figure 3. Test accuracy of the four models according to the number of participants. The test results were evaluated with TE-CR data.
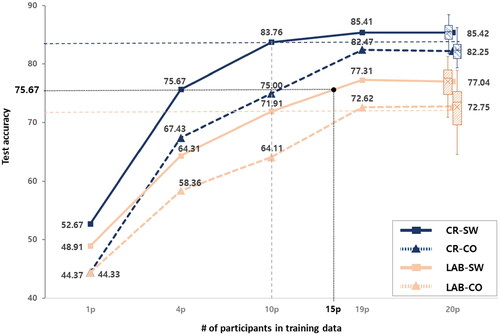
(RQ1) In the #20p result shown in , the accuracies of the CR-based models (CR-SW and CR-CO) are 8.38% and 9.5% higher than the LAB models (LAB-SW and LAB-CO), respectively. The CR models (CR-SW and CR-CO) also show a narrower boxplot range (25%∼75%), indicating that the CR models show more stable generalization performance than the LAB models. In building a more robust recognition model, the CR model collected better-quality gesture data than the LAB.
(RQ2) The Styling Words (SW) approach was applied to further improve performance. This method contributed to the improvement of both the LAB and CR collection environments. In addition to the improvement (an increase of 4.69% (LAB-SW–LAB-CO)) in the LAB environment results indicated by the previous study, we could identify a synergy with the CR environment by an additional increase in accuracy of 2.94% (CR-SW–CR-CO). Incidentally, CR-CO achieved 5.2% greater accuracy than LAB-SW, implying the substantial effect of CR is greater than that of SW.
As shown in , performance varied by the number of participants used in training. When the SW approach was applied, #10p SW models achieved performance comparable to those of the #20p CO models (CR-SW #10p/CR-CO #20p: 83.8%/82.3%, LAB-SW #10p/LAB-CO #20p: 71.9%/72.8%). Remarkably, the CR-SW #4p model outperformed the LAB-CO #20p model by 2.9% in accuracy and showed similar performance to the LAB-SW #15p model. This means that using the CR with SW could reduce the number of people required to collect training data by up to 80% compared to conventional LAB gesture data collection. The CR is considerably more effective than the LAB in feeding high-quality data to machine learning models, and the SW also demonstrates this capability. Interestingly, the CR resulted in a relatively lower increase using SW than the LAB (2.9% vs. 4.7%, respectively), for reasons which we will discuss later in Section 5.2.
4.2. Analysis of gesture feature
Based on the gesture sample from a single participant, 240 gesture samples [12 gestures × 20 repetitions = 240] were collected as training data, and 120 gesture samples [12 gestures × 10 repetitions = 120] were collected as test data. For each participant, we calculated the average (the “a” graphs) and standard deviation (SD, the “b” graphs) of 240 training and 120 test values for the six gesture features (See ). The size of the box in the “a” graphs shows the difference in a gesture feature over the population (populational variability), and the mean value of the SD in the “b” graphs shows the difference in feature values between gestures performed by an individual participant (individual variability).
Figure 4. Boxplots of (a) average and (b) standard deviation for the six gesture features (QoM, PT, AS, BPV, GA, and BPD). Boxplots from left to right for each graph: TE-CR, TE-LAB, TR-CR-CO, TR-CR-SW, TR-LAB-CO, TR-LAB-SW (*p < 0.05, **p < 0.01, ***p < 0.001)
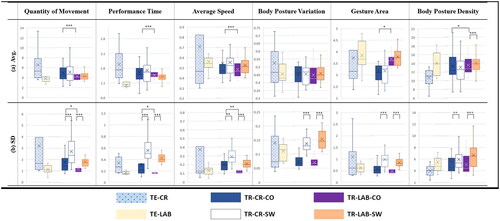
We confirm gesture differences between and within participants according to the collection environments (CR and LAB) and instruction methods (SW and CO). To simplify graph interpretation, we mainly focus on the distribution of the “a” graphs (indicating populational variability) and the mean values of the “b” graphs (indicating individual variability).
The Wilcoxon signed ranked test (TR-LAB-SW vs. TR-LAB-CO and TR-CR-SW vs. TR-CR-CO) and Wilcoxon rank-sum test (TR-LAB-CO vs. TR-CR-CO) were conducted to verify the difference between the mean values of SD in . An F-test was conducted to statistically verify the difference in distribution between the graphs in .
4.2.1. Crowdsourcing-based vs. lab-based data collection
As shown in the “b” graphs in , the average (denoted by an X) of the standard deviation for gesture features except BPD and BPV was higher for the CR environment than the LAB environment (TR-CR-CO > TR-LAB-CO; TR-CR-SW > TR-LAB-SW), signifying that the CR induced an increase of gesture variability within individual participants. CR data is more widely distributed than LAB data in general in the “a” graphs, signifying increased gesture variability between participants.
More specifically, as shown in (QoM-a), the box size for TR-CR-CO is significantly wider (***p < 0.001) than that for TR-LAB-CO, implying that the QoM values of participants are more diverse in the CR environment. Similar results were also observed in the “a” graphs of PT, BPD, and GA. As shown in (QoM-b), the mean values of SD increased when changing environments (SD for CR-CO: 1.78 > LAB-CO: 1.25, CR-SW: 2.71 > LAB-SW: 1.8, ***p < 0.001, respectively). Most features except BPV and BPD show the same tendency. The CR not only induces higher gesture variability within individual participants (a higher mean of SD in the “b” graphs indicating individual variability) but also induces higher variability between participants (the wider range of boxes in the “a” graphs indicating population variability).
Considered together with the evaluation results in Section 4.1, it can be confirmed that the increase in gesture variability in the CR environment ultimately contributes to an improvement in recognition performance.
4.2.2. Styling Words vs. Common instruction
(RQ2) For all gesture features in the “b” graphs of , the SW had a higher mean of SD (individual variability) than the CO instructions, confirming that the SW induces more variance in gestures performed by an individual participant than CO. More specifically, the mean value of TR-CR-CO of GA-b of 0.55 rose to 0.97 in TR-CR-SW (a 176% increase, ***p < 0.001), and rose from 0.46 (TR-LAB-CO) to 0.82 (TR-LAB-SW) (an 178% increase, ***p < 0.001). In almost all other features, it is evident that SW shows a statistically significantly higher SD value compared to CO. Through this, it was confirmed that the SW variously changes certain features such as gesture Quantity of Movement, Performance Time, Average Speed, and Gesture Area in both CR and LAB.
The SW varies the distribution of the “a” graph in features such as QoM, PT, AS and GA. Compared to the CO, the SW makes the gestures performed by each participant more diverse in terms of gesture movement, time, speed, and range, increasing population variability. Overall, the average value of features also increases, through which the SW contributes to increases in the length of the gesture trajectory and the performance speed and an expansion of the gesture range. The SW resulted in participants making gestures larger, longer, and faster.
Just as CR makes one participant to perform gestures in a more diverse fashion than the LAB (See 4.2. – Crowdsourcing-based vs. Lab-based), the SW also results in more diverse gestures than the CO. Furthermore, based on the results of the statistical significance tests on the “b” graphs, it was confirmed that the SW contributes significantly to individual gesture variability compared to CO. However, from the “a” graph, the effect of CR on populational variability is noticeable compared to SW.
Notably, the LAB datasets contained less gesture variability, possibly reflecting participants’ response to the stressful or contrived nature of the laboratory collection environment. Compared to the more natural and comfortable CR environment, the LAB environment is supervised and unfamiliar to participants, which led to less natural and variable gestures.
5. Discussion
5.1. What’s wrong with a lab-based test dataset
(RQ3) Test data of any recognition problems should be more natural and realistic to accurately validate the generalization performance of the recognition model. To obtain these data, we used a CR method that can be easily collected in their own comfort space without a supervisor, as well as the LAB method in the researcher’s pre-set collection environment, which is generally used for gesture collection. In addition, rather than watching a tutorial video and following the movements, participants were asked to recall and perform the gestures they had memorized at least a day before.
In graphs, the CR dataset have a wider distribution (graph “a”) and a larger SD mean value (graph b) than the LAB dataset, both in test and training. In particular, the distribution and SD values of TE-CR are much wider and larger than TE-LAB. In terms of the quality of the dataset, it does not mean that all variability is helpful, but appropriate variation in the gesture can improve model generalizability. As confirmed in 4.1. Recognition Performance part, the gesture variability induced through CR and SW ultimately contributes to the performance improvement of the recognition model.
On the other hand, TE-LAB did not have relatively sufficient variability. The combination of CR and recall scheme, TE-CR, includes diverse population variability and independent variability, whereas TE-LAB is rather very similar to TR-LAB data. This implies that the TE-LAB data may not portray natural gestures. As a result of testing the four models on the TE-LAB data, the LAB-SW model showed the highest recognition performance of 81.86%, while the remaining three models showed almost 10% lower recognition performance (CR-SW/CR-CO/LAB-CO: 72.55%/69.92%/72.91%). This result is likely in parallel with our observations. We often found participants to be more accurately perform gestures so as to be overly uniform and rigid in the participation for the test data collection. Evaluation on TE-LAB may not accurately portray the actual performance of gesture recognition.
5.2. Excessive gesture variability
We confirmed through the feature analysis performed in Section 4.2 that both the CR and SW methods increased gesture variability, but their combination resulted in less performance improvement than the combination of the LAB environment and the SW method. In the “a” graphs in , the SW method had a consistent effect on the CR environment; standard deviation (indicating population variability) and average values increased for most features. However, the SW method had an inconsistent effect on data collected in the LAB environment: the mean and SD values increased only in GA and BPD. In contrast, the mean of PT decreased and the ranges of boxes for QoM, PT, and BPV were similar or somewhat narrowed. In the “b” graphs in , the mean values (indicating individual variability) and standard deviation showed consistent tendencies in both environments. LAB data also increased in average value and had a wider range, but a much more pronounced change was observed in CR-based data, indicating a significant difference between the two environments in interpreting Styling Words and reflecting them in each participant’s gestures. This is probably due to the environmental nature of CR creating a more natural and unsupervised space in which it can be assumed that participants sometimes change their gestures excessively in the process of interpreting Styling Words.
6. Conclusion
The collection of training data with higher gesture variability can increase the performance of an ML-based gesture recognizer. In this study, we confirmed how CR-based data collection, which has recently been actively introduced for the development of ML-based systems, improves gesture variability and recognition performance. CR-based data for a variety of gesture features include much higher populational and individual variability than LAB data. We also confirmed that the environmental variations of the CR contribute to better gesture data collection. However, when applying CR and SW at the same time, we observed instances of excessive variability in gesture features which resulted in less performance improvement. Further investigation is required to adaptively apply additional methods to increase gesture variability under the CR environment to avoid such excessive gesture feature variability.
Disclosure statement
No potential conflict of interest was reported by the author(s).
Additional information
Funding
Notes on contributors
In-Taek Jung
In-Taek Jung received the BS degree in computer science from Jeonbuk National University, and the MS degree in Cultural Technology from the School of Integrated Technology, GIST, and he is currently a PhD student in the AI Graduate School, GIST. His research interests are data collection, education, AI applications for human being.
Sooyeon Ahn
Sooyeon Ahn received the BArch. degree from Dankook University, and the MSc degree in Architecture and Civil Engineering from University of Bath. She received the MS degree in Cultural Technology from the School of Integrated Technology, GIST and is currently a PhD student. Her research interests are multimodal interaction design.
JuChan Seo
Juchan Seo received the BS degrees in mechanical engineering from Handong University, Phang, Korea, He is currently integrated course with the Artificial Intelligence Graduate School, GIST Gwangju, Korea. His research interests include Explainable AI, AI applications for human beings.
Jin-Hyuk Hong
Jin-Hyuk Hong received BS, MS, and PhD degrees in computer science from Yonsei University, Korea. He is currently an assistant professor with the School of Integrated Technology and the AI Graduate School, GIST. His research interests include context awareness, pattern recognition, interaction design, focusing on the understanding of human behaviors.
Notes
1 Official tutorial video (come), https://youtu.be/suFs0nftprc
2 OpenPose output format (BODY_25), https://cmu-perceptual-computing-lab.github.io/openpose/web/html/doc/md_doc_02_output.html
References
- Alallah, F., Neshati, A., Sheibani, N., Sakamoto, Y., Bunt, A., Irani, P., Hasan, K. (2018). Crowdsourcing vs laboratory-style social acceptability studies? Examining the social acceptability of spatial user interactions for head-worn displays. Proceedings of the 2018 CHI Conference on Human Factors in Computing Systems.
- Albanie, S., Varol, G., Momeni, L., Afouras, T., Brown, A., Zhang, C., Coto, E., Camgöz, N. C., Saunders, B., Dutta, A. (2021). SeeHear: Signer diarisation and a new dataset. ICASSP 2021-2021 IEEE International Conference on Acoustics, Speech and Signal Processing (ICASSP).
- Amini, S., & Li, Y. (2013). CrowdLearner: Rapidly creating mobile recognizers using crowdsourcing [Paper presentation]. Proceedings of the 26th annual ACM symposium on User interface software and technology, St. Andrews, Scotland, UK. https://doi.org/10.1145/2501988.2502029
- Bastanfard, A., Shahabipour, M., & Amirkhani, D. (2022). Crowdsourcing of labeling image objects: An online gamification application for data collection. Available at SSRN 4072474.
- Brown, H. R., Zeidman, P., Smittenaar, P., Adams, R. A., McNab, F., Rutledge, R. B., & Dolan, R. J. (2014). Crowdsourcing for cognitive science – the utility of smartphones. PLOS One, 9(7), e100662. https://doi.org/10.1371/journal.pone.0100662
- Cao, Z., Hidalgo, G., Simon, T., Wei, S. E., & Sheikh, Y. (2021). OpenPose: Realtime multi-person 2D pose estimation using part affinity fields. IEEE Transactions on Pattern Analysis and Machine Intelligence, 43(1), 172–186. https://doi.org/10.1109/TPAMI.2019.2929257
- Caramiaux, B., Bevilacqua, F., & Tanaka, A. (2013). Beyond recognition: Using gesture variation for continuous interaction [Paper presentation]. CHI'13 Extended Abstracts on Human Factors in Computing Systems, Paris, France. https://doi.org/10.1145/2468356.2468730
- Cheema, S., & LaViola, J. J. (2011). Wizard of Wii: Toward understanding player experience in first person games with 3D gestures [Paper presentation]. Proceedings of the 6th International Conference on Foundations of Digital Games, Bordeaux, France. https://doi.org/10.1145/2159365.2159407
- Cooper, S., Jones, D. B., & Prys, D. (2019). Crowdsourcing the Paldaruo Speech Corpus of Welsh for speech technology. Information, 10(8), 247. https://www.mdpi.com/2078-2489/10/8/247 https://doi.org/10.3390/info10080247
- Duarte, A., Palaskar, S., Ventura, L., Ghadiyaram, D., DeHaan, K., Metze, F., Torres, J., & Giro-I-Nieto, X. (2021). How2sign: A large-scale multimodal dataset for continuous American sign language [Paper presentation]. Proceedings of the IEEE/CVF conference on computer vision and pattern recognition.
- Giel, B. (2012). Sprach-und Kommunikationsförderung bei Kindern mit Down-Syndrom. Schulz-Kirchner Verlag GmbH.
- Grove, N., & Walker, M. (1990). The Makaton Vocabulary: Using manual signs and graphic symbols to develop interpersonal communication. Augmentative and Alternative Communication, 6(1), 15–28. https://doi.org/10.1080/07434619012331275284
- Lee, H. J., Park, E., Kim, J., Joo, H., Whang, J., Ku, J.-A., & Lee, S.-H. (2019). Development of simplified manual sign system for students with severe and multiple disabilities. Special Education Research, 18(1), 197–224. https://doi.org/10.18541/ser.2019.02.18.1.197
- Joze, H. R. V., & Koller, O. (2018). Ms-asl: A large-scale data set and benchmark for understanding American sign language. arXiv preprint arXiv:1812.01053
- Kajiwara, D., & Murao, K. (2019). Gesture recognition method with acceleration data weighted by sEMG [Paper presentation]. Adjunct Proceedings of the 2019 ACM International Joint Conference on Pervasive and Ubiquitous Computing and Proceedings of the 2019 ACM International Symposium on Wearable Computers, London, UK. https://doi.org/10.1145/3341162.3345589
- Kang, W., Jung, I.-T., Lee, D., & Hong, J.-H. (2021). Styling words: A simple and natural way to increase variability in training data collection for gesture recognition [Paper presentation]. Proceedings of the 2021 CHI Conference on Human Factors in Computing Systems, Yokohama, Japan. https://doi.org/10.1145/3411764.3445457
- Kim, E., & Vangala, S. (2016). Vinereactor: Crowdsourced Spontaneous Facial Expression Data [Paper presentation]. Proceedings of the 2016 ACM on International Conference on Multimedia Retrieval, New York, NY, USA. https://doi.org/10.1145/2911996.2912038
- Kleinsmith, A., & Bianchi-Berthouze, N. (2013). Affective body expression perception and recognition: A survey. IEEE Transactions on Affective Computing, 4(1), 15–33. https://doi.org/10.1109/T-AFFC.2012.16
- Koblin, A. M. (2009). The sheep market [Paper presentation]. Proceedings of the seventh ACM conference on Creativity and cognition. https://doi.org/10.1145/1640233.1640348
- LaViola, J. J. (2015). Context aware 3D gesture recognition for games and virtual reality [Paper presentation]. ACM SIGGRAPH 2015 Courses, Los Angeles, California. https://doi.org/10.1145/2776880.2792711
- Li, D., Rodríguez, C., Yu, X., & Li, H. (2019). Word-level deep sign language recognition from video: A new large-scale dataset and methods comparison.
- Masi, I., Tran, A. T., Leksut, J. T., Hassner, T., Medioni, G. G. (2016). Do We Really Need to Collect Millions of Faces for Effective Face Recognition? CoRR, abs/1603.07057. http://arxiv.org/abs/1603.07057
- McDuff, D., Kaliouby, R. E., & Picard, R. (2012). Crowdsourcing facial responses to online videos. IEEE Transactions on Affective Computing, 3(4), 456–468. https://doi.org/10.1109/T-AFFC.2012.19
- Mukushev, M., Ubingazhibov, A., Kydyrbekova, A., Imashev, A., Kimmelman, V., & Sandygulova, A. (2022). FluentSigners-50: A signer independent benchmark dataset for sign language processing. PLOS One, 17(9), e0273649. https://doi.org/10.1371/journal.pone.0273649
- Noroozi, F., Corneanu, C. A., Kaminska, D., Sapinski, T., Escalera, S., & Anbarjafari, G. (2021). Survey on emotional body gesture recognition. IEEE Transactions on Affective Computing, 12(2), 505–523. https://doi.org/10.1109/TAFFC.2018.2874986
- Puckey, J., Wouters, R. (2010). One frame off a me: A Music Video by 40575 of our friends. http://oneframeoffame.com/
- Savargiv, M., & Bastanfard, A. (2013). Text material design for fuzzy emotional speech corpus based on Persian semantic and structure [Paper presentation]. 2013 International Conference on Fuzzy Theory and Its Applications (iFUZZY). https://doi.org/10.1109/iFuzzy.2013.6825469
- Shi, B., Del Rio, A. M., Keane, J., Michaux, J., Brentari, D., Shakhnarovich, G., & Livescu, K. (2018). American sign language fingerspelling recognition in the wild [Paper presentation]. 2018 IEEE Spoken Language Technology Workshop (SLT). https://doi.org/10.1109/SLT.2018.8639639
- Sigurdsson, G. A., Varol, G., Wang, X., Farhadi, A., Laptev, I., & Gupta, A. (2016). Hollywood in homes: Crowdsourcing data collection for activity understanding. In B. Leibe, J. Matas, N. Sebe, & M. Welling (Eds.), Computer Vision – ECCV 2016. Springer.
- Spiro, I. (2012). Motion chain: A webcam game for crowdsourcing gesture collection[Paper presentation]. Proceeding of the CHI'12 Extended Abstracts on Human Factors in Computing Systems (pp. 1345–1350). Association for Computing Machinery. https://doi.org/10.1145/2212776.2212452
- Su, H., Deng, J., & Fei-Fei, L. (2012). Crowdsourcing annotations for visual object detection. In Human Computation - Papers from the 2012 AAAI Workshop, Technical Report (pp. 40–46). (AAAI Workshop - Technical Report; Vol. WS-12-08).
- Suzuki, N., Watanabe, Y., & Nakazawa, A. (2020). GAN-based style transformation to improve gesture-recognition accuracy. Proceedings of the ACM on Interactive, Mobile, Wearable and Ubiquitous Technologies, 4(4), 1–20. https://doi.org/10.1145/3432199
- Tan, C. T., Rosser, D., & Harrold, N. (2013). Crowdsourcing facial expressions using popular gameplay [Paper presentation]. SIGGRAPH Asia 2013 Technical Briefs, Hong Kong, China. https://doi.org/10.1145/2542355.2542388
- Taranta, E. M., II, Simons, T. K., Sukthankar, R., & Laviola, J. J., Jr. (2015). Exploring the benefits of context in 3D gesture recognition for game-based virtual environments. ACM Transactions on Interactive Intelligent Systems, 5(1), 1–34. https://doi.org/10.1145/2656345
- Taranta, E. M., Pittman, C. R., Oakley, J. P., Maslych, M., Maghoumi, M., & LaViola, J. J. (2020). Moving toward an ecologically valid data collection protocol for 2D gestures in video games. Proceedings of the 2020 CHI Conference on Human Factors in Computing Systems (pp. 1–11). Association for Computing Machinery. https://doi.org/10.1145/3313831.3376417
- Vatavu, R.-D. (2017). Beyond features for recognition: Human-readable measures to understand users’ whole-body gesture performance. International Journal of Human–Computer Interaction, 33(9), 713–730. https://doi.org/10.1080/10447318.2017.1278897
- Vatavu, R.-D., Casiez, G., & Grisoni, L. (2013). Small, medium, or large? estimating the user-perceived scale of stroke gestures. Proceedings of the SIGCHI Conference on Human Factors in Computing Systems (pp. 277–280). Association for Computing Machinery. https://doi.org/10.1145/2470654.2470692
- Vaughan, J. W. (2017). Making better use of the crowd: How crowdsourcing can advance machine learning research. Journal of Machine Learning Research, 18(1), 7026–7071. http://jmlr.org/papers/v18/17-234.html
- Vondrick, C., Patterson, D., & Ramanan, D. (2013). Efficiently scaling up crowdsourced video annotation. International Journal of Computer Vision, 101(1), 184–204. https://doi.org/10.1007/s11263-012-0564-1
- Watanabe, H., & Terada, T. (2018). Improving ultrasound-based gesture recognition using a partially shielded single microphone [Paper presentation]. Proceedings of the 2018 ACM International Symposium on Wearable Computers, Singapore, Singapore. https://doi.org/10.1145/3267242.3267274
- Wobbrock, J. O., Wilson, A. D., & Li, Y. (2007). Gestures without libraries, toolkits or training: A $1 recognizer for user interface prototypes [Paper presentation]. Proceedings of the 20th annual ACM symposium on User interface software and technology, Newport, Rhode Island, USA. https://doi.org/10.1145/1294211.1294238
- Yang, F., Wu, Y., Sakti, S., & Nakamura, S. (2019). Make Skeleton-based Action Recognition Model Smaller, Faster and Better [Paper presentation]. ACM Multimedia Asia, Beijing, China. https://doi.org/10.1145/3338533.3366569
- Yuhui, W., Tian, L., & Xinxiong, L. (2020). Reliability of perceived usability assessment via crowdsourcing platform: Retrospective analysis and novel feedback quality inspection method. International Journal of Human–Computer Interaction, 36(11), 1070–1084. https://doi.org/10.1080/10447318.2019.1709339
- Zhang, Y., Cao, C., Cheng, J., & Lu, H. (2018). EgoGesture: A new dataset and benchmark for egocentric hand gesture recognition. IEEE Transactions on Multimedia, 20(5), 1038–1050. https://doi.org/10.1109/TMM.2018.2808769