
Abstract
Monitoring through the use of eye-tracking technology helps in understanding the cognitive load learners experience when doing tasks. This data gives the teacher and the student important information for improving learning outcomes. This study examined whether students’ participation in a learning virtual laboratory, with a self-regulated video monitored with eye-tracking, would influence their learning outcomes. It also examined whether students’ prior knowledge affected their learning outcomes. Lastly, the study identified clusters related to cognitive load in relevant Areas of Interest vs. non-relevant Areas of Interest. The sample comprised 42 university students of health sciences. The results indicate that participation in the virtual laboratory was related to better learning outcomes. In addition, prior knowledge did not affect cognitive load. A number of different clusters were found related to indicators of cognitive load in relevant and non-relevant AOIs. More applied studies are needed about the effects of monitoring on learning outcomes and on what it means for individualization of learning.
1. Introduction
Nowadays, Learning Management Systems (LMS) are increasingly used as learning spaces in both e-Learning and b-Learning modalities. Using these environments lets teachers monitor each student’s learning process (Sáiz-Manzanares et al., Citation2021a). In addition, LMSs can include technological resources that facilitate and enhance self-regulated learning (Cerezo et al., Citation2016; Wang et al., Citation2020). Possible resources include videos and their inclusion in virtual laboratories. These usually include the figure of an avatar that regulates learners’ thought processes. This enhances the development of cognitive and metacognitive processes involved in learning (Wiedbusch et al., Citation2021). These processes are related to attention, selection of relevant information, contrasting this information with previous knowledge (Sáiz-Manzanares et al., Citation2021b), conceptual interrelation and construction of new knowledge (Ho et al., Citation2014; Krieger et al, Citation2022; Molenaar et al., Citation2023; Tong & Nie, Citation2022). The developmental effectiveness of this process is directly related to the learner’s motivation towards learning (Zhang et al., Citation2022), and that motivation is related to the way the task is presented in LMSs (visual, auditory or both) (Azevedo & Gašević, Citation2019).
Research in the field of multimedia learning starts from the premise of whether these multimedia resources can enable more effective learning (Mayer, Citation2014). However, it seems that information delivered through a dual channel (visual and auditory) means double the information processing and therefore a higher cognitive load (Alemdag & Cagiltay, Citation2018). Cognitive load refers to the number of resources the learner has to process in working memory (Souchet et al., Citation2022), and the information that can be stored in working memory is limited (Souchet et al., Citation2022). Similarly, it seems that variations in the perception of cognitive load depend on the type of task and the cognitive effort that each learner needs to complete it (Orru & Longo, Citation2019). More specifically, according to Sweller (Citation2016) in Cognitive Load Theory (CLT), cognitive load refers to the cognitive capacity for processing information during task resolution or problem solving. The theory suggests that cognitive load depends on the difficulty and understanding of the task, and how long the student feels it takes to resolve (Tong & Nie, Citation2022). In this scenario, the level of prior knowledge plays a fundamental role. Identifying which part of the task the learner experiences the greatest cognitive load in gives the teacher information about the types of knowledge that need reinforcing, which will, once that knowledge is worked on, foreseeably encourage better learning outcomes. CLT starts from the basis that working memory has limited resources for task processing, and that when the capacity of working memory is occupied with multiple tasks, performance is likely to suffer (Tong & Nie, Citation2022). More specifically, cognitive load during the learning process can be divided into intrinsic load (corresponding to the complexity of the knowledge itself regardless of how the information is presented and acquired), extrinsic load (referring to how the information is presented and acquired) and germane load (referring to the integration of knowledge in long-term memory). When it comes to the design of the videos, it seems that how the information is inserted is key (Ponce et al., Citation2018). All resources that are aimed at attracting the learner’s attention, such as information highlights, help the learner to direct their attention to important information and help them store this highlighted information in working memory for further processing (Weinstein & Acee, Citation2018). Similarly, tasks that incorporate graphics and text appear to improve information processing (Ponce et al., Citation2018). However, there is no conclusive data on their effect on subsequent comprehension of information (Mayer, Citation2014), which may be indicative of superficial learning (Badali et al., Citation2022). Likewise, including graphs and diagrams seems to predispose the learner to mapping, which in turn facilitates the representation of the information to be learned (Fiorella & Mayer, Citation2015). Using graphs and diagrams seems to enhance the use of learning strategies for organising and processing information. These strategies are directly related to categorising information. This process involves the storage of information in long-term memory and improved comprehension (Ponce et al., Citation2018). Similarly, recent research (Ponce et al., Citation2022) indicates that underlining is effective when combined with other learning strategies. These studies provide insights into multimedia design and its relationship to cognitive learning theory (Liu, Citation2021; Mayer, Citation2014).
Therefore, research in the field of task analysis is important in understanding the effectiveness of learning for different types of learners and tasks (Greene & Azevedo, Citation2009; Krieger et al., Citation2022). Moreover, that kind of analysis will help in the development of personalised learning materials, which may be expected to enhance more effective learning (Martín-Antón et al., Citation2013; Sáiz-Manzanares et al., Citation2021b). For example, in the study by Pi and Hong (Citation2016), different types of PowerPoint™ slides were used and implemented in different types of videos (with teacher image insertion vs. without insertion). The results indicated that incorporating a figure that regulated learning into the PowerPoint™ presentation—the teacher—helped acquisition of declarative knowledge, but not of procedural knowledge. Those authors found that videos that included procedural knowledge produced a significantly higher cognitive load for students (Pi & Hong, Citation2016).
This is due to the difficulty of measuring cognitive processes during learning (Mutlu-Bayraktar et al., Citation2019). There are two types of methods for measuring cognitive load (direct and indirect). Direct methods include measurement through direct objective measures of cerebral activity—e.g., electroencephalography (EEG). Indirect, self-evaluation techniques are also available (e.g., questionnaires). These are subjective measures, as they involve some component of the user’s self-perception. In indirect methods of measurement, a differentiation can be made between self-reports about the mental effort make in resolving a task, which also has a subjective component, and the objective indirect techniques, which include task performance measurement (error rate or proportion), physiological measurement (e.g., eye movement and electrodermal activity), and behavioral measurement (e.g., face expression, gesture input, mouse pointing and clicking, etc.) (Mutlu-Bayraktar et al., Citation2019; Souchet et al., Citation2022). In addition, individual differences related to prior knowledge (Desjarlais, Citation2017; Mutlu-Bayraktar et al., Citation2019; Sáiz-Manzanares et al., Citation2021c), different ways of processing information, different learning patterns (Sáiz-Manzanares et al., Citation2021a; Tsai et al., Citation2016), and different performance at different points in students’ learning processes (initial, intermediate or final) (Sharafi et al., Citation2015) must be considered (Sharafi et al., Citation2015). Prior knowledge would foreseeably help reduce the frequency of indicators of cognitive load (Asadi et al., Citation2022).
In addressing these challenges, research applying eye tracking technology has shown promise over recent years, as it allows visual attention to different elements of the learning object in multimedia environments to be recorded (Asish et al., Citation2022; Kulomäki et al., Citation2022; van Marlen et al., Citation2022). Analyzing those records allows inference of the level of cognitive load each student experiences when doing different types of tasks. In the following section, the state of the art in this field of study is addressed.
2. Related work
2.1. Eye tracking as a method of measuring learning in multimedia environments
Eye tracking technology is a non-invasive technique that facilitates the recording and measurement of certain cognitive processes, as well as the inference of metacognitive processes that occur during the learning process (Asish et al., Citation2022; Tong & Nie, Citation2022; van Marlen et al., Citation2022). The technology enables the inclusion of multi-channel learning materials (Alemdag and Cagiltay, Citation2018; Coskun & Cagiltay, Citation2022; Kulomäki et al., Citation2022) and records information about static and dynamic parameters (Sáiz Manzanares et al., Citation2020). The most commonly used metrics are described below, along with how they relate to the measurement of certain cognitive processes (Tong & Nie, Citation2022). Static metrics include the following:
Fixations can be defined as the position of the gaze on a point of the learning resource during a time interval. Eye fixations are related to the attentional process on the reception of the stimulus. Fixation Count (FC) and Fixation Duration (FD) are proxy measures of cognitive processing. It seems that fixation time increases and the number of fixations decreases when cognitive load is high (Andrzejewska & Stolińska, Citation2016; Zu et al., Citation2018).
Saccades refer to the rapid eye movement between fixations. Saccade Count (SC), Saccade Duration (SD) and Saccade Amplitude (SA) can reflect the effectiveness and/or difficulty of the learning object (Gumussoy et al., Citation2022). These metrics are used to measure cognitive load and visual fatigue (Liu et al., Citation2016; Souchet et al., Citation2022; Tong & Nie, Citation2022). They also provide data on the meaningfulness of learning (De la Fuente et al., Citation2022).
Pupil diameter is a common cognitive load metric. Pupil size increases with task difficulty. This is understood as a near real-time metric of cognitive load (Asadi et al., Citation2022; Lohani et al., Citation2019; Rodziewicz-Cybulska et al., Citation2022; Wals & Wichary, Citation2022). However, it can be affected by environmental factors (Peinkhofer et al., Citation2019).
Blink refers to the movement of the eyelid. There is no clear conclusion about the relationship between blinks and the cognitive load of the stimulus (Tong & Nie, Citation2022). Certain environmental factors may influence blinking (e.g., temperature, relative humidity, lighting where the test is performed, etc.) (Martins & Carvalho, Citation2015).
Number of visits refers to the number of visits to a stimulus and its Areas of Interest (AOIs) and can be related to the cognitive load of a stimulus or to the motivation towards it.
Fixation and saccade metrics include multiple specification metrics such as duration, frequency, speed, etc., the use of which will depend on the research objectives (Sáiz-Manzanares et al., Citation2021b).
Dynamic metrics assess the execution patterns within a stimulus, they refer to fixation positions and are grouped together into an execution pattern that is different for each person—the scan path or gaze point. The difficulty with this metric is that eye tracking equipment does not offer a direct interpretation of it, nor comparison between participants. Therefore, comparison algorithms have to be applied, such as the string-edit method using the Levenshtein (Citation1966) distance. In addition, this method of analysis has a weakness in that it does not take into account the duration of the position. Therefore, some authors recommend using supervised (e.g., k-nearest neighbour (k-nn)) or unsupervised (e.g., cluster analysis) machine learning techniques when analysing these metrics (Duchowski et al., Citation2020; Raschke et al., Citation2014). These methods are complex and computational knowledge is needed to apply and interpret them, making it difficult for a “normal” eye tracking technology user to use this type of analysis (Sáiz Manzanares et al., Citation2020). presents a list of the most frequent metrics in eye tracking and their relationship with measurement of learning strategies.
Table 1. List of metrics in eye tracking, their meaning and relationship with analysis of learning strategies.
However, despite the relevance of eye-tracking technology to education, its use is recent and is not yet widespread in everyday teaching practice. Therefore, it is important to carry out more studies in this area to illuminate the advantages and disadvantages as well as the needs for the implementation of new functionality (Alemdag & Cagiltay, Citation2018).
Based on the above, the objectives of the present study were (1) To determine whether participation in a virtual laboratory using a self-regulated video, monitored with eye-tracking technology, would improve learning outcomes; (2) to determine whether students’ levels of prior knowledge would influence the results of cognitive load measured with eye-tracking technology; (3) to determine whether there were significant differences between students in the acquisition of knowledge in the virtual laboratory and in the parameters of cognitive load; and (4) to determine whether there were clusters in the students in relation to the parameters of cognitive load in relevant vs. non-relevant Areas of Interest (AOI).
These objectives were realized in the following research questions (RQ):
RQ1. Will participation in the eye tracking learning activity improve learning outcomes for students?
RQ2. Will students’ levels of prior knowledge influence fixations (count and duration), saccades (count), visits, and pupil diameter in the different areas of interest (relevant vs. non-relevant)?
RQ3. Will there be significant differences in fixations (count and duration), saccades (count), visits, and pupil diameter in relevant vs. non-relevant AOIs, according to the results in the knowledge test taken after the virtual laboratory in which eye tracking monitoring was applied?
RQ4. Will clustering be found in students with respect to fixations (count and duration), saccades (count), visits, and pupil diameter in relevant vs. non-relevant AOIs across stimuli?
3. Method
3.1. Participants
The sample consisted of 42 third-year undergraduate health science students ().
Table 2. Descriptive statistics of the participants with respect to the variables age and gender.
There were many more women than men, which is typical in health sciences courses, as indicated by the figures in the latest report on universities from the Spanish University Rectors’ Conference (CRUE). The mean ratio of women to men in these subjects is 73.8% (Hernandez-Armenteros & Pérez-García, Citation2018).
3.2. Instruments
3.2.1. Prior knowledge test
This test contained 15 multiple-choice questions (four possible answers) with only one correct answer. Scores were measured on a scale of 0–10. The results were categorised into 3 categories (1 Satisfactory = 5–6.9; 2 Intermediate = 7–8.9; 3 Outstanding = 9–10). The test can be found in Appendix A.
3.2.2. Tobii pro lab version 1.194.41215 and 15.6 inch monitor with a resolution of 1920 X 1080
In this study 64 Hz were applied, static metrics (fixations and saccades) were used and AOI statistics were determined. The records were analysed with the statistical software package SPSS v. 28 (IBM Corporation, Citation2022).
3.2.3. Stimuli applied in eye tracking
Four types of stimuli were applied:
Stimulus 1. Instructions for the execution of the eye tracking task consisted of a sentence stating "Please look at the image and watch the video. Press the space bar to continue".
Stimulus 2. Image of eye contact between a mother and her baby. Here the line of eye contact was established.
Stimulus 3. A virtual laboratory developed ad hoc in self-regulated video format explaining how to initiate a therapeutic intervention on a premature infant.
Stimulus 4. Acknowledgement of participation in the tasks applied in eye tracking stating "Thank you very much for participating!”,
shows the stimuli and shows the relationship of the stimuli used with the type of cognitive load.
Figure 1. Stimuli used in eye tracking in the study.
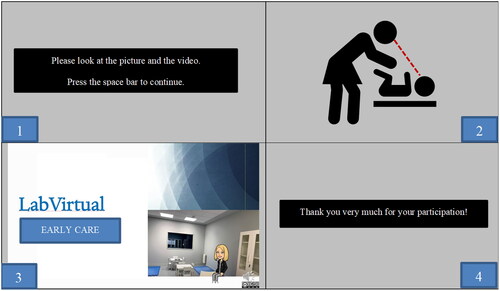
Table 3. Stimuli applied in the study and their relationship with cognitive load.
Table 4. Skewness and kurtosis analysis of the independent variable.
3.2.4. Design of the subject
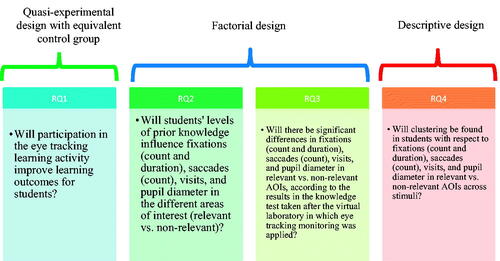
An Online Project Based Learning (OPBL) teaching technology was applied. Continuous assessment was carried out through 4 procedures: (1) multiple-choice tests with only one correct answer per question. Two tests were set, each worth 15% of the total score: Test 1 was given in the fourth week of the semester, Test 2 was given in the seventh week of the semester; (2) a project based on the resolution of a practical case of therapeutic intervention in a patient with a developmental pathology. Students solved the case throughout the semester in groups (3–5 members). This was worth 25% of the total score; (3) project presentation, worth 25% of the total score. Students presented the project before the teacher and classmates during the last week of the semester; (4) participation in co-assessment activities (these consisted of assessment surveys, using gamification resources and Flipped Learning experiences). This was worth 20% of the total score and activities that occurred throughout the semester.
3.3. Procedure
Before the study began, approval was obtained from the Bioethics Committee of the University of Burgos No. IO 03/2022. Written informed consent was also obtained from all participants. Subsequently, three weeks into the semester, the students took a knowledge test on the subject of "Early Intervention." The students were then offered the possibility of a laboratory to examine a practical early intervention case. They were told that the laboratory would be individual and that eye tracking technology would be used. They were also given an explanation of how the technology works and the aim of the study, which was to test learning performance. The students who voluntarily agreed to participate in this part of the study signed another informed consent form. None of the participants had any relevant visual or neurological problems (epilepsy or other cognitive impairments).
The laboratory was conducted individually using eye tracking technology, it lasted 5–7 min per participant. Before accessing the stimuli, calibration was carried out and fits of less than 71% were not allowed. The participants performed the test in the same room with similar lighting and temperature conditions. The position of each student relative to the screen ranged from 45 to 50 cm depending on participants’ build (height and weight).
The visualisation comprised an initial stimulus in which the participant had to read the instructions for the laboratory, the duration of which was variable, as each participant took the time they needed to read the text. The second stimulus presented an image of interaction between a mother and a baby, the time for this stimulus was also variable and depended on each participant. The third stimulus consisted of a laboratory in a virtual laboratory format that applied a self-regulated video. This video reported the resolution steps for a therapeutic intervention with a premature infant. The video was 3 min 17 s long and the most important elements were highlighted in orange. These were considered Relevant Areas of Interest (AOI R) and the elements not highlighted were considered non-relevant AOI (AOI NR). Finally, a fourth stimulus thanked the student for their participation, the duration of this stimulus was variable as each participant used the time they needed to read the text. The type of cognitive load for each stimulus, according to Sweller’s (Citation2016) classification, is presented in . Finally, each student completed a crossword puzzle to test the knowledge from stimulus 3 (see Appendix B). shows an outline of the study phases.
Figure 2. Steps in the study procedure.
3.4. Design
Following the classification by (Campbell & Stanley, Citation2005), a quasi-experimental design with equivalent control group was applied to test RQ1. To test RQ2 and RQ3, a 3 × 3 factorial design was applied (degree of prior knowledge (satisfactory, intermediate, high) and cognitive load (low, intermediate, high)). A descriptive design was applied to test RQ4. presents the relationship between the study’s hypotheses and the research designs applied.
Figure 3. Relationship between RQs and research design.
3.5. Data analysis
Before the start of the study, the distribution of the sample was assessed to determine normality by analysing skewness and kurtosis, following Bandalos and Finney (Citation2001), whereby values greater than |2.00| indicate extreme skewness, while lower values indicate that the sample followed a normal distribution. For kurtosis, values between |8.00| and |20.00| suggest extreme kurtosis and lower values suggest normality in the distribution (see ).
Then, to test RQ1, RQ2, and RQ3, a one-factor ANOVA with fixed effects and eta squared effect value (η2) was performed. The interpretation values, based on (Cohen, Citation1992), were η2 from 0.2 to 0.3 small effect size; η2 from 0.5 to 0.8 η2 moderate effect size; η2 greater than 0.8 large effect size. The unsupervised Machine Learning k-means technique was used to test RQ4. Calculations were performed with the statistical software package SPSS v. 28 (IBM Corporation, Citation2022) and cluster visualisation used the Data Mining software Orange v. 3.32 (Demsar et al., Citation2013).
4. Results
4.1. Preliminary analyses
The distribution of the sample was checked with respect to the data from the prior knowledge test. The skewness and kurtosis values are shown in . The skewness value was 0.48| and the kurtosis value was |0.59|. Therefore, the sample met the assumptions of normality, meaning that parametric statistics were used to test the RQs.
Calibration values were also recorded before the application of eye tracking technology. The fit values for validation accuracy were in the range of 0.11–0.89 and for validation precision in the range of 0.1–1.58. The fit range was 71% to 97%.
4.2. Testing the research questions
4.2.1. Testing research question 1 (RQ1)
Significant differences were found between students in the learning outcomes related to the project presentation, co-evaluation activities and in the total scores, with higher scores for the students who participated in the virtual laboratory with eye tracking. However, the effect sizes were small (see ). The questions of the applied tests can be found in Appendix A.
Table 5. One-factor fixed-effects ANOVA (participation in the early intervention case study virtual laboratory vs. non-participation).
4.2.2. Testing research question 2 (RQ2)
No significant differences were found in the eye tracking parameters for the different stimuli with respect to the students’ level of prior knowledge (see ).
Table 6. One-factor fixed-effects ANOVA (level of prior knowledge).
4.2.3. Testing research question 3 (RQ3)
No significant differences were found in the eye tracking parameters in the different stimuli with respect to the students’ levels of knowledge acquisition in the virtual laboratory. However, an effect was detected in some parameters FC in AOI_NR (η2 = 0.10) and AOI_R (η2 = 0.14), FD in AOI_NR (η2 = 0.18), SC in AOI_R (η2 = 0.12), Visits in AOI_R (η2 = 0.11) and pupil diameter in AOI_R (η2 = 0.14) and AOI_NR (η2 = 0.15). These effect sizes were small, but may be indicative for future lines of research (see ).
Table 7. One-factor fixed effects ANOVA (degree of knowledge acquired) on eye tracking parameters (FC, FD, SC, No. and PD) for stimulus 3 in AOI_NR and R.
4.2.4. Testing research question 4 (RQ4)
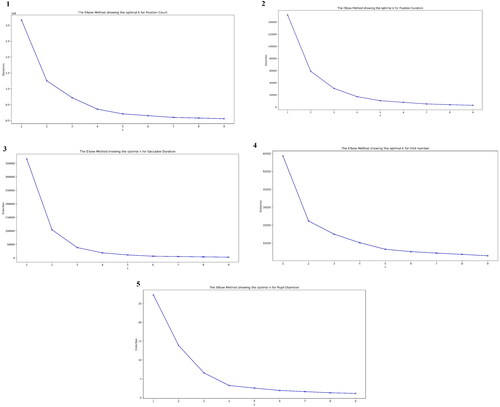
The k-means algorithm was applied to check whether there were different groups of behaviour in the different stimuli with respect to AOI R vs. AOI NR in the applied eye tracking metrics (FC, FD, SC, Visits and Pupil Diameter). Before applying k, the elbow method was performed for the values in all parameters, the results are shown in .
Figure 4. Elbow method in the k-means algorithm on FC, FD, SC, visits and pupil diameter data. Note. 1. Elbow method in FC, 2. Elbow method in FD, 3. Elbow method in SC, 4. Elbow method in Visits, 5. Elbow method in pupil diameter.
In FC, k = 2 was applied. Significant differences were found in stimulus 4 in the AOI_R. Students in cluster 1 had higher FCs than students in cluster 2 (see ). This indicates a higher cognitive load for students in cluster 2. (Andrzejewska & Stolińska, Citation2016; Zu et al., Citation2018).
Table 8. Final cluster centres and ANOVA for FC.
For FD, k = 2 was applied. Significant differences were found in stimulus 4 in AOI_R and AOI_NR. Students in cluster 1 had longer fixation durations than those in cluster 2 in stimulus 3 in both relevant and non-relevant AOIs (see ).
Table 9. Final cluster centres and ANOVA for FD.
Significant differences were found in stimulus 2 and in stimulus 3 in AOI_R. Students in cluster 1 had higher SCs than those in cluster 2 (see ). This may refer to comprehension difficulties and the stimulus having a higher cognitive load for these students (Gumussoy et al., Citation2022; X. Liu et al., Citation2016; Tong & Nie, Citation2022).
Table 10. Final cluster centres and ANOVA for SC.
For the visits parameter, k = 2 was applied. Significant differences were found in stimulus 1 in AOI_R_I and in stimulus 3 in AOI_NR and AOI_R. Students in cluster 1 made more visits to both relevant and non-relevant AOIs (see ).
Table 11. Final cluster centres and ANOVA for No. of Visits.
For pupil diameter, the results of the elbow method suggested applying k = 3. Significant differences were found in all stimuli in AOI_R and AOI_NR. Students in cluster 2 had a larger pupil diameter in all stimuli and AOI (see ).
Table 12. Final cluster centres and ANOVA on pupil diameter.
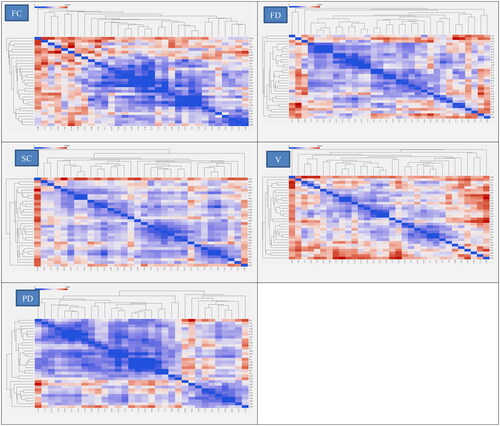
shows the representation of the behavioural patterns in each eye tracking parameter with respect to the clusters (see Appendix C) presents the relationship between the results of this study and those of the research on which it was based.
Figure 5. Visualisation of the clusters in the parameters FC, FD, SC, visits and pupil diameter in each participant. Note: FC: Fixation count; FD: Fixation duration; SC: Saccade count; V: Number of visits; PD: Pupil diameter.
5. Discussion
With regard to RQ1, in this study, monitoring students in a self-regulated video laboratory seems to have contributed to improving some of the learning outcomes (presentation of project, co-evaluation, and overall learning results). This may be because the work in stimulus 3—the self-regulated virtual laboratory monitored with eye-tracking—probably encouraged each student to reflect on their own practice (Souchet et al., Citation2022; Tong & Nie, Citation2022; Wang et al., Citation2020; Wiedbusch et al., Citation2021). The use of eye-tracking to monitor learning tasks is not very widespread yet but it has a promising future in real learning contexts (Alemdag & Cagiltay, Citation2018; Souchet et al., Citation2022; Tong & Nie, Citation2022).
With regard to RQ2, students’ prior knowledge was not found to have an effect on the indicators of cognitive load (fixations, saccades, visits, and pupil diameter) in the AOIs in any of the stimuli examined. This may be because the students began with moderately high levels of prior knowledge (there were no scores lower than 5 out of 10), or because of the characteristics of the task (self-regulated video with the most important information underlined). Using tasks which apply self-regulated learning has been shown to be an important resource in multi-channel learning spaces (Alemdag & Cagiltay, Citation2018; Ho et al., Citation2014; Molenaar et al., Citation2023; Tong & Nie, Citation2022).
With regard to RQ3, there were no significant differences in the parameters of cognitive load between students. There was an effect in stimulus 3 (self-regulated video) in FC (in relevant and non-relevant AOIs), FD (in non-relevant AOIs), SC (in relevant AOIs), Number of visits (in relevant AOIs), and pupil diameter (in relevant and non-relevant AOIs) between the students grouped by their scores in the knowledge test taken immediately following the monitored laboratory. As noted above, learning using self-regulated, multi-channel materials with the important concepts underlined may have facilitated students’ understanding and mitigated the cognitive load (Alemdag & Cagiltay, Citation2018; H. C. Liu, Citation2021; Pi & Hong, Citation2016; Ponce et al., Citation2018; Orru & Longo, Citation2019; 2022; Tong & Nie, Citation2022). Nonetheless, there are underlying differences in information processing. This is an aspect that subsequent studies should examine more deeply in order to determine what they are. That understanding may help researchers improve instructional processes and adapt them to the needs of each type of student.
In line with the above, the response to RQ4 indicates clusters of students that are not based on the parameters of cognitive load, and those clusters are not explained by the influence of the prior knowledge variable or the results of the knowledge test. There were 2 clusters in FC, FD, SC, and number of visits, and 3 clusters in PD. This indicates that there are different patterns of behavior between the students in terms of the cognitive load in the AOIs. More specifically, there were differences in FC in relevant AOIs in stimulus 3 (virtual laboratory). The students in group 1 experienced a higher cognitive load. They also exhibited longer fixations in stimulus 3 (virtual laboratory) in relevant and non-relevant AOIs. This result indicates more effort in cognitive processing for the students in this cluster. In terms of saccade counts, the students in group 1 had more saccades in the relevant AOI in stimulus 2 (image processing) and in the relevant AOIs in stimulus 3 (processing the virtual laboratory). This suggests that the students in this cluster were using more search strategies. In addition, the students in cluster 1 had more hits in the relevant AOI for stimulus 1 (instructions) and the relevant AOIs in stimulus 3 (virtual laboratory). This may be related to a greater cognitive load in students in group 1 in information processing. Lastly, pupil diameter was greater in all of the relevant and non-relevant AOIs in students in cluster 2, which may be an indicator of these students having greater interest or greater difficulty in processing information. Nonetheless, it is important to remember that the students grouped in each parameter cluster were not the same. These results indicate that there are variables other than the independent variables considered in this study (prior knowledge, acquired knowledge) that influence the cognitive load students experienced in the different tasks. In addition, the indicators of cognitive load were not homogeneous in the processing of different stimuli (text, image, or video). These differences are probably due to the channel through which the information was received (visual, auditory, or both) and the type of stimulus (text, image, or video). In fact, most of the differences were found in the relevant AOIs for stimulus 3 (video), which is consistent with the findings from Alemdag & Cagiltay (Citation2018). Along these lines, there may be differences in the students’ information processing with respect to working memory (Souchet et al., Citation2022), and these may depend on the type of task (Alemdag & Cagiltay, Citation2018; Andrzejewska & Stolińska, Citation2016). It is also worth noting that the stimulus 3 task (virtual laboratory) included procedural content (it dealt with practical content). According to Pi and Hong (Citation2016), this type of content requires a higher cognitive load. This load refers specifically to the germane load of integrating content into long-term memory, which is consistent with the results from Sweller (Citation2016). Nonetheless, these difficulties of processing seem to be compensated by the self-regulation applied in stimulus 3 and the underlining of the most important information. All of that may have helped students to store and understand the information. The students’ results in the knowledge test were no lower than 7 out of 10. This would support the findings from Fiorella and Mayer (Citation2015), Ponce et al. (Citation2018), and Ponce et al. (Citation2022).
in Appendix C provides a more comprehensive summary of the relationship between the studies that formed the basis of this study and their achievements and limitations. Nonetheless, it is worth highlighting the fact that RQ4 (a cluster analysis to determine possible clusters (groupings of students)) about the parameters of cognitive load is the main novel contribution of this study. Cluster analysis is part of the framework of unsupervised machine learning, and according to Molenaar et al. (Citation2023), these techniques need to be included in educational contexts for analyzing and following-up SRL practices through the use of technological monitoring resources.
6. Conclusions
There appear to have been differences between students when it came to processing stimuli that required greater cognitive load. More specifically, processing of multichannel stimuli incorporating voice and images seemed to have a greater cognitive load in some students. Nonetheless, the indicators of cognitive load—detected via eye-tracking technology—were not always at the same level in each student. This suggests that there may have been variables other than prior knowledge that influenced the manifestation of cognitive load in the students (e.g., intellectual ability, learning strategies, learning style, etc.). On the other hand, self-regulated video seems to have been effective in achieving learning outcomes. In addition, eye-tracking technology was shown to be very effective for measuring the parameters of cognitive load. Despite that, these instruments need improvements in the analysis of records and processing the information that they return to the user, as they need complex computational analysis to produce information that can be interpreted. This may hinder the use of this technology in teachers’ daily practice.
6.1. Contributions of the study to educational practice
Understanding students’ behavior in various tasks gives the teacher information about the characteristics of information processing. This may help in the creation of individualized learning materials. In short, using eye-tracking technology has benefits for monitoring students’ learning processes as it allows each student’s behavior in the interaction with the learning materials to be recorded, as well as the processes used to resolve each task. It gives information about the attentional processes in each of these processes in addition to the information about the cognitive load experienced. Using learning resources such as self-regulated videos, and on a more sophisticated level, virtual reality, along with eye-tracking technology seems to increase students’ engagement with the learning task, avoiding distraction (Asish et al., Citation2022).
6.2. Contributions of the study to other research
The contribution of this study to the research that informed it centers on performing monitoring in natural contexts via eye-tracking of a self-regulated learning activity in university students of health sciences. In other words, the monitoring process was incorporated into a teaching-learning process in a natural setting. In addition, the study confirmed its effectiveness on learning outcomes. One specific characteristic to highlight is the application of machine learning techniques in the educational context, specifically unsupervised clustering techniques. These techniques were used to find the student groupings without applying a previously defined variable. This is fundamental for finding new hypotheses and continuing research within such a complex environment as information processing in typical learning environments.
6.3. Limitations of the study
The study has drawbacks related to sample size and selection, since convenience sampling was used and the sample was a specific group of students who were studying health sciences. In addition, the monitored task was of a limited duration. Future studies will expand the type and length of the learning activities. In addition, it is important to remember that eye-tracking technology uses infra-red to follow the gaze, meaning that the activities should not be too long. These elements mean it is not possible to generalize the results (Greene & Azevedo, Citation2009; Krieger et al., Citation2022), they only indicate possible results in natural contexts. Another aspect to note is that the sample used in the study had far fewer men than women. This, as noted previously, is typical in health science courses (Hernandez-Armenteros & Pérez-García, Citation2018), and future studies should look at samples from courses that have the opposite gender ratio or a balanced ratio. It is also important to note that these types of studies apply micro-analytical research, which makes larger sample sizes difficult. And although eye-tracking technology has improved in terms of application conditions, it still needs supervised individual interaction. This also makes it difficult to have long-duration monitored tasks.
6.4. Future research
There are still many points to explore about the characteristics of learning in multichannel environments in virtual spaces (H. C. Liu, Citation2021). The difficulty of measuring cognitive processes is a notable challenge (Mutlu-Bayraktar et al., Citation2019), however, the use of eye-tracking technology helps the investigative process (Coskun & Cagiltay, Citation2022; Kulomäki et al., Citation2022; van Marlen et al., Citation2022). Future studies will aim to examine whether the use of eye-tracking technology in itself can be a resource for feedback about students’ learning processes. In addition, future studies will examine the parameters of cognitive load in students with low levels of prior knowledge, along with the parameters that have been related to cognitive load in eye-tracking at different points in the learning process (initial, intermediate, final). Studies will also examine the results of the dynamic eye-tracking measures, as the present study only used static measures. They will also incorporate psycho-galvanic skin response records and electroencephalograms, which will help to better define each student’s learning profile, as there will be more indicators of information processing available; the present study only used eye-tracking indicators. Finally, it is worth highlighting the need for more studies on the analysis of self-regulated tasks in the framework of teaching in technological spaces. This opens up a wide range of possibilities for design of various types of tasks and their evaluation. Analyzing the results of tasks via techniques using machine learning principles and then artificial intelligence (the difference between the two is in the autonomy of data processing) will no doubt help improve self-regulated learning and individualization of learning.
Acknowledgements
The cooperation of all participants is appreciated.
Disclosure statement
The authors report there are no competing interests to declare.
Additional information
Funding
Notes on contributors
María Consuelo Sáiz-Manzanares
María Consuelo Sáiz Manzanares holds a PhD in Psychology and Industrial Technology. She is currently a full professor in the Faculty of Health Sciences at the University of Burgos (Spain). Also, she is the director of the research group DATAHES and of the UIC-348. Her research focuses on Metacognitive skills and Artificial Intelligence.
Raúl Marticorena-Sánchez
Raúl Marticorena Sánchez holds a PhD in Computer Engineering and is a senior lecturer at the Polytechnic School of the University of Burgos (Spain). He is a member of the ADMIRABLE research group. His research work focuses on software maintenance and the application of computer engineering and data mining techniques.
Luis J. Martín Antón
Luis J. Martín Antón is a university lecturer in the Faculty of Education and Social Work at the University of Valladolid (UVA) (Spain). He is also a member of the UVA No. 179. His research work focuses on the study of effective learning and academic procrastination behaviour in secondary school and university students.
Irene González-Díez
Irene González Díez a psychologist from the University of Salamanca (USAL), Master in Health Sciences from the University of Burgos (UBU), is currently a pre-doctoral fellow at the GIR DATAHES at UBU doing her doctoral thesis on the application of Advanced Learning Technologies in the study of metacognitive strategies.
Miguel Ángel Carbonero Martín
Miguel Ángel Carbonero Martín holds a PhD in Psychology and Professor in the Faculty of Education and Social Work at the University of Valladolid (UVA) (Spain). He is also the director of the Research Group of the UVA No. 179. His research work focuses on the study of motivational teaching skills of effective teachers.
References
- Alemdag, E., & Cagiltay, K. (2018). A systematic review of eye tracking research on multimedia learning. Computers & Education, 125, 413–428. https://doi.org/10.1016/j.compedu.2018.06.023
- Andrzejewska, M., & Stolińska, A. (2016). Comparing the difficulty of tasks using eye tracking combined with subjective and behavioural criteria. Journal of Eye Movement Research, 9(3), 1–16. https://doi.org/10.16910/jemr.9.3.3
- Asadi, A., Saeedpour-Parizi, M. R., Aiken, C. A., Jahanbani, Z., Houminiyan Sharif Abadi, D., Simpson, T., & Marchant, D. (2022). Effects of attentional focus and cognitive load on novice dart throwing: Evidence from quiet eye duration and pupillary responses. Human Movement Science, 86, 103015. https://doi.org/10.1016/j.humov.2022.103015
- Asish, S. M., Kulshreshth, A., & Borst, C. W. (2022). Detecting distracted students in educational VR environments using machine learning on eye gaze data. Computers & Graphics, 109, 75–87. https://doi.org/10.1016/j.cag.2022.10.007
- Azevedo, R., & Gašević, D. (2019). Analyzing multimodal multichannel data about self-regulated learning with advanced learning technologies: Issues and challenges. Computers in Human Behavior, 96, 207–210. https://doi.org/10.1016/j.chb.2019.03.025
- Badali, S., Rawson, K. A., & Dunlosky, J. (2022). Do students effectively regulate their use of self-testing as a function of item difficulty? Educational Psychology Review, 34(3), 1651–1677. https://doi.org/10.1007/s10648-022-09665-6
- Bandalos, D. L., & Finney, S. J. (2001). Item parceling issues in structural equation modeling. In G. A. Marcoulides, R. E. Schumacker (Eds.), New developments and techniques in structural equation modeling (pp. 269–296). Lawrence Erlbaum Associates Publishers.
- Brazelton, T. B., & Cramer, B. G. (1990). The earliest relationship: Parents, infants and the drama of early attachment (1st ed.). Routledge. https://doi.org/10.4324/9780429481512
- Campbell, D. F., & Stanley, J. (2005). Diseños experimentales y cuasiexperimentales en la investigación social (9th ed.). Amorrortu. (Original work published Experimental and Quasi-Experimental Design for Research in 1966)
- Cerezo, R., Sánchez-Santillán, M., Paule-Ruiz, M. P., & Núñez, J. C. (2016). Students’ LMS interaction patterns and their relationship with achievement: A case study in higher education. Computers & Education, 96, 42–54. https://doi.org/10.1016/j.compedu.2016.02.006
- Cohen, J. (1992). Statistical power analysis. Current Directions in Psychological Science, 1(3), 98–101. https://doi.org/10.1111/1467-8721.ep10768783
- Coskun, A., & Cagiltay, K. (2022). A systematic review of eye-tracking-based research on animated multimedia learning. Journal of Computer Assisted Learning, 38(2), 581–598. https://doi.org/10.1111/jcal.12629
- de la Fuente, J., Martínez-Vicente, J. M., Santos, F. H., Sander, P., Fadda, S., Karagiannopoulou, A., Boruchovitch, E., Kauffman, & D., F. (2022). Advances on self-regulation models: A new research agenda through the SR vs ER behavior theory in different psychology contexts. Frontiers in Psychology, 13, 861493. https://doi.org/10.3389/fpsyg.2022.861493
- Demsar, J., Curk, T., Erjavec, A., Gorup, C., Hocevar, T., Milutinovic, M., Mozina, M., Polajnar, M., Toplak, M., Staric, A., Stajdohar, M., Umek, L., Zagar, L., Zbontar, J., Zitnik, M., & Zupan, B. (2013). Orange: Data mining toolbox in python. Journal of Machine Learning Research, 14, 2349–2353.
- Desjarlais, M., & Joseph, J. J. (2017). Socially interactive and passive technologies enhance friendship quality: an investigation of the mediating roles of online and offline self-disclosure. Cyberpsychology, Behavior and Social Networking, 20(5), 286–291. https://doi.org/10.1089/cyber.2016.0363
- Duchowski, A. T., Peysakhovich, V., & Krejtz, K. (2020). Using pose estimation to map gaze to detected fiducial markers. Procedia Computer Science, 176, 3771–3779. https://doi.org/10.1016/j.procs.2020.09.010
- Fiorella, L., & Mayer, R. E. (2015). Learning as a generative activity. Cambridge university press.
- Greene, J. A., & Azevedo, R. (2009). A macro-level analysis of SRL processes and their relations to the acquisition of a sophisticated mental model of a complex system. Contemporary Educational Psychology, 34(1), 18–29. https://doi.org/10.1016/j.cedpsych.2008.05.006
- Gumussoy, C. A., Pekpazar, A., Esengun, M., Bayraktaroglu, A. E., & Ince, G. (2022). Usability evaluation of TV interfaces: Subjective evaluation vs. objective evaluation. International Journal of Human–Computer Interaction, 38(7), 661–679. https://doi.org/10.1080/10447318.2021.1960093
- Hernandez-Armenteros, J., Pérez-García, J. A. (2018). La universidad española en cifras 2017-2018 [The Spanish university in numbers 2017-2018]. CRUE. https://bit.ly/3hIMLTw
- Ho, H. N. J., Tsai, M. J., Wang, C. Y., & Tsai, C. C. (2014). Prior knowledge and online inquiry-based science reading: Evidence from eye tracking. International Journal of Science and Mathematics Education, 12(3), 525–554. https://doi.org/10.1007/s10763-013-9489-6
- IBM Corporation. (2022). Statistical Package for the Social Sciences (SPSS) (Version 28) [Software]. IBM. https://www.ibm.com/es-es/products/spss-statistics
- Krieger, F., Azevedo, R., Graesser, A. C., & Greiff, S. (2022). Introduction to the special issue: The role of metacognition in complex skills – spotlights on problem solving, collaboration, and self-regulated learning. Metacognition and Learning, 17(3), 683–690. https://doi.org/10.1007/s11409-022-09327-6
- Kulomäki, J., Oksama, L., Rantanen, E., & Hyönä, J. (2022). Attention control in a demanding dynamic time-sharing environment: An eye-tracking study. Attention, Perception & Psychophysics, 84(2), 352–371. https://doi.org/10.3758/s13414-021-02377-z
- Levenshtein, V. I. (1966). Binary codes capable of correcting deletions, insertions and reversals. Soviet Physics Doklady, 10(8), 707–7010.
- Liu, H. C. (2021). Using eye-tracking technology to explore the impact of instructional multimedia on CFL learners’ Chinese character recognition. The Asia-Pacific Education Researcher, 30(1), 33–46. https://doi.org/10.1007/s40299-020-00512-2
- Liu, X., Chen, T., Xie, G., & Liu, G. (2016). Contact-free cognitive load recognition based on eye movement. Journal of Electrical and Computer Engineering, 2016, 1601879. https://doi.org/10.1155/2016/1601879
- Lohani, M., Payne, B. R., & Strayer, D. L. (2019). A review of psychophysiological measures to assess cognitive states in real-world driving. Frontiers in Human Neuroscience, 13(57), 57. https://doi.org/10.3389/fnhum.2019.00057
- Martín-Antón, L. J., Marugán de Miguelsanz, M., Catalina Sancho, J. J., & Carbonero Martín, M. Á. (2013). Elaboration learning strategies: Training and programs. Autla Abierta, 41(1), 49–62.
- Martins, R., & Carvalho, J. (2015). Eye blinking as an indicator of fatigue and mental load-a systematic review. In R. Martins and J. M. Carvalho (Eds.), Occupational safety and hygiene III. CRC Press. https://doi.org/10.1201/b18042
- Mayer, R. E. (2014). Cognitive theory of multimedia learning. In R. E. E. Mayer (Ed.), The Cambridge handbook of multimedia learning (2nd ed., pp. 43–71). Cambridge University Press. https://doi.org/10.1017/CBO9781139547369.005
- Molenaar, I., Mooij, S. D., Azevedo, R., Bannert, M., Järvelä, S., & Gašević, D. (2023). Measuring self-regulated learning and the role of AI: Five years of research using multimodal multichannel data. Computers in Human Behavior, 139, 107540. https://doi.org/10.1016/j.chb.2022.107540
- Mutlu-Bayraktar, D., Cosgun, V., & Altan, T. (2019). Cognitive load in multimedia learning environments: A systematic review. Computers & Education, 141, 103618. https://doi.org/10.1016/j.compedu.2019.103618
- Orru, G., & Longo, L. (2019). The evolution of cognitive load theory and the measurement of its intrinsic, extraneous and germane loads: A review. In L. Longo and M. C. Leva (Eds.), Human mental workload: Models and applications (pp. 23–48). Springer International Publishing.
- Peinkhofer, C., Knudsen, G. M., Moretti, R., & Kondziella, D. (2019). Cortical modulation of pupillary function: Systematic review. PeerJ. 7, e6882. https://doi.org/10.7717/peerj.6882
- Pi, Z., & Hong, J. (2016). Learning process and learning outcomes of video podcasts including the instructor and PPT slides: A Chinese case. Innovations in Education and Teaching International, 53(2), 135–144. https://doi.org/10.1080/14703297.2015.1060133
- Ponce, H. R., Mayer, R. E., Loyola, M. S., López, M. J., & Méndez, E. E. (2018). When two computer-supported learning strategies are better than one: An eye-tracking study. Computers & Education, 125, 376–388. https://doi.org/10.1016/j.compedu.2018.06.024
- Ponce, H. R., Mayer, R. E., & Méndez, E. E. (2022). Effects of learner-generated highlighting and instructor-provided highlighting on learning from Text: A meta-analysis. Educational Psychology Review, 34(2), 989–1024. https://doi.org/10.1007/s10648-021-09654-1
- Raschke, M., Herr, D., Blascheck, T., Ertl, T., Burch, M., Willmann, S., & Schrauf, M. (2014). A visual approach for scan path comparison [Paper presentation]. ETRA '14: Proceedings of the Symposium on Eye Tracking Research and Applications (pp. 135–142). Association for Computing Machinery. https://doi.org/10.1145/2578153.2578173
- Rodziewicz-Cybulska, A., Krejtz, K., Duchowski, A. T., & Krejtz, I. (2022). Measuring cognitive effort with pupillary activity and fixational eye movements when reading: Longitudinal comparison of children with and without primary music education [Paper presentation]. 2022 Symposium on Eye Tracking Research and Applications. https://doi.org/10.1145/3517031.3529636
- Román Sánchez, J. M., & Gallego Rico, S. (2008). ACRA Escalas de estrategias de aprendizaje. TEA. http://www.web.teaediciones.com/Ejemplos/ACRA_extracto_web.pdf
- Sáiz-Manzanares, M. C., Rodríguez Diez, J. J., Marticorena Sánchez, R., Zaparaín Yáñez, M. J., & Cerezo Menéndez, R. (2020). Lifelong learning from sustainable education: An analysis with eye tracking and data mining techniques. Sustainability, 12(5), 1970. https://doi.org/10.3390/su12051970
- Sáiz-Manzanares, M. C., Marticorena-Sánchez, R., Rodríguez-Díez, J. J., Rodríguez-Arribas, S., Díez-Pastor, J. F., & Ji, Y. P. (2021a). Improve teaching with modalities and collaborative groups in an LMS: An analysis of monitoring using visualisation techniques. Journal of Computing in Higher Education, 33(3), 747–778. https://doi.org/10.1007/s12528-021-09289-9
- Sáiz-Manzanares, M. C., Pérez, I. R., Rodríguez, A. A., Arribas, S. R., Almeida, L., & Martin, C. F. (2021b). Analysis of the learning process through eye tracking technology and feature selection techniques. Applied Sciences, 11(13), 6157. https://doi.org/10.3390/app11136157
- Sáiz-Manzanares, M. C., Payo Hernanz, R. J., Zaparaín Yáñez, M. J., Andrés López, G., Marticorena Sánchez, R., Calvo Rodríguez, A., Martín, C., & Rodríguez Arribas, S. (2021c). Eye-tracking technology and data-mining techniques used for a behavioral analysis of adults engaged in learning processes. Journal of Visualized Experiments, 172(172), 1–16. https://doi.org/10.3791/62103
- Sharafi, Z., Soh, Z., & Guéhéneuc, Y. G. (2015). A systematic literature review on the usage of eye-tracking in software engineering. Information and Software Technology, 67, 79–107. https://doi.org/10.1016/j.infsof.2015.06.008
- Souchet, A. D., Philippe, S., Lourdeaux, D., & Leroy, L. (2022). Measuring visual fatigue and cognitive load via eye tracking while learning with virtual reality head-mounted displays: A review. International Journal of Human–Computer Interaction, 38(9), 801–824. https://doi.org/10.1080/10447318.2021.1976509
- Sweller, J. (2016). Cognitive load theory and computer science education [Paper presentation]. SIGCSE '16: Proceedings of the 47th ACM Technical Symposium on Computing Science Education (p. 1). Association for Computing Machinery. https://doi.org/10.1145/2839509.2844549
- Tong, S., & Nie, Y. (2022). Measuring designers’ cognitive load for timely knowledge push via eye tracking. International Journal of Human–Computer Interaction, 98, 1–14. https://doi.org/10.1080/10447318.2022.2057898
- Tsai, M. J., Huang, L. J., Hou, H. T., Hsu, C. Y., & Chiou, G. L. (2016). Visual behavior, flow and achievement in game-based learning. Computers & Education, 98, 115–129. https://doi.org/10.1016/j.compedu.2016.03.011
- van Marlen, T., van Wermeskerken, M., Jarodzka, H., Raijmakers, M., & van Gog, T. (2022). Looking through Sherlock’s eyes: Effects of eye movement modelling examples with and without verbal explanations on deductive reasoning. Journal of Computer Assisted Learning, 38(5), 1497–1506. https://doi.org/10.1111/jcal.12712
- Veenman, M. V. J. (2017). Assessing metacognitive deficiencies and effectively instructing metacognitive skills. Teachers College Record: The Voice of Scholarship in Education, 119(13), 1–20. https://doi.org/10.1177/016146811711901303
- Wals, S. F., & Wichary, S. (2022). Under pressure: Cognitive effort during website-based task performance is associated with pupil size, visual exploration, and users’ intention to recommend. International Journal of Human-Computer Interaction, 1–12. https://doi.org/10.1080/10447318.2022.2098576
- Wang, J., Antonenko, P., & Dawson, K. (2020). Does visual attention to the instructor in online video affect learning and learner perceptions? An eye-tracking analysis. Computers & Education, 146, 103779. https://doi.org/10.1016/j.compedu.2019.103779
- Weinstein, C. E., & Acee, T. W. (2018). Study and learning strategies. In R. F. Flippo, T. W. Bean (Eds.), Handbook of college reading and study strategy research (3rd ed., pp. 227–240). Routledge. https://doi.org/10.4324/9781315629810
- Wiedbusch, M. D., Kite, V., Yang, X., Park, S., Chi, M., Taub, M., & Azevedo, R. (2021). A theoretical and evidence-based conceptual design of MetaDash: An intelligent teacher dashboard to support teachers’ decision making and students’ self-regulated learning. Frontiers in Education, 6, 570229. https://doi.org/10.3389/feduc.2021.570229
- Zhang, Y., Paquette, L., Bosch, N., Ocumpaugh, J., Biswas, G., Hutt, S., & Baker, R. S. (2022). The evolution of metacognitive strategy use in an open-ended learning environment: Do prior domain knowledge and motivation play a role? Contemporary Educational Psychology, 69, 102064. https://doi.org/10.1016/j.cedpsych.2022.102064
- Zu, T., Hutson, J. P., Loschky, L. C., & Rebello, N. S. (2018). Use of eye-tracking technology to investigate cognitive load theory. arXiv, 1803.02499. https://doi.org/10.48550/arXiv.1803.02499
Appendix A
1. Psychosocial risk situations may require.
a. Projects involving mobility.
b. Projects involving communication.
c. Interdisciplinary intervention.
d. All of the above.
2. The concept of attention to diversity in the school environment.
a. Refers to the provision for pupils with special educational needs.
b. Refers to private establishments.
c. Refers to socio-community centres.
d. None of the above.
3. The Occupational Therapist primarily has to perform.
a. A physical assessment.
b. An assessment of socio-educational aspects.
c. A cognitive assessment.
d. A functional assessment.
4. The AOTA indicates that the role of the Occupational Therapist is in multiple contexts and that from the concept of education it has to do with:
a. A system of learning patterns of behaviour that emerge in the process of socialisation.
b. Gamification processes.
c. Inhibits interaction with the environment.
d. The processes of biological analysis of behaviour.
5. The methodology proposed by Brazelton & Cramer (Citation1990)
a. Decreases incidence of intraventricular haemorrhage.
b. Reduces days of mechanical ventilation.
c. Enables weight gain.
d. All of the above.
6. Early Intervention Units belong to.
a. Health Services.
b. Social Services.
c. Educational Services.
d. All of the above.
7. The characteristics of early childhood programmes…
a. Focus on the child with needs.
b. Focus on the environment of the child in need.
c. Focus on improving cognitive, psychomotor, language and socialisation skills.
d. All of the above.
8. Before initiating the development of an OT programme, the Occupational Therapist has to
a. Evaluate the intervention programme.
b. Establish the baseline of intervention.
c. Analyse the medical, psychological and other professional reports involving the user.
d. Both b and c.
9. Intervention in early intervention has to include.
a. Neurocognitive intervention.
b. Ecological-transactional intervention.
c. Both a and b.
d. An ergonomic analysis.
10. The concept in early childhood care was coined from
a. Studies in special education.
d. Neurological studies at an early age.
c. Studies on developmental progress.
d. All of the above.
11. The concept of at-risk population within early childhood programmes includes
a. Early or late pregnancies.
b. Nutritional problems in the newborn.
c. All situations that may include developmental problems during or after the birth of a new being.
d. All of the above.
12. In large premature infants
a. Gestational age is between 28 and 37 weeks.
b. Its weight is 1500 gr.
c. They will have major respiratory, neurological, perceptual-behavioural and maturational problems.
d. Have early visual development.
13. In early care, Activities for Daily Living (ADLs) are related to:
a. The area of language development.
b. The area of behavioural development.
c. Personal autonomy and socialisation.
d. Visual analysis.
14. Hypertonia is
a. An increase in muscle tension or tone.
b. A decrease in muscle tension or tone, or in the tone of an organ.
c. A degenerative disorder.
d. An increase in blood pressure.
15. The analysis indicators that the occupational therapist has to consider when creating and implementing early stimulation programmes are:
a. Analysis of routines in the daily life of a social group.
b. Analysis of emotion recognition and expression behaviour.
c. It is one of the variables to be considered but not the only one.
d. The morphosyntactic development of language in the user.
Appendix B
Across
1. In the clinical case studied the second most affected area of development is
2. In the clinical case studied at the level of socialisation development, the child has a developmental age of 18 months and the difficulties are centred on sitting, walking, sphincter control, drooling control and
3. In the clinical case studied at the level of Cognitive development, the user has a developmental age in months of
4. In the clinical case studied the fourth most affected area of development is
Down
1. In the clinical case studied the most affected area of development is
2. In the clinical case studied at the level of Gross Motor Skills, the greatest difficulty is
3. In the clinical case studied, the birth was premature at which week of labour?
Appendix C
Table C1. Relationship between the RQs proposed in this study, the experimental studies basis for this study and the findings of this study.