
 ?Mathematical formulae have been encoded as MathML and are displayed in this HTML version using MathJax in order to improve their display. Uncheck the box to turn MathJax off. This feature requires Javascript. Click on a formula to zoom.
Abstract
With touchscreens being installed in aircraft flight decks, reach-and-turbulence-related challenges arise. Using the ISO 9241-411 multidirectional selection task (a 2D Fitts’ task), we quantified the impact of vibration on touchscreen target selection throughput (a performance score combining both speed and accuracy) and error rate in a cockpit layout. 24 participants completed the task under 2 vibration levels (helicopter level flight versus static), 2 hand support methods (using the thumb, while holding onto the screen’s edge, versus using the index finger freehand), 4 touchscreen types (two avionic and two consumer touchscreens), 2 touchscreen positions (main instrument panel versus pedestal), and 4 target sizes (0.8, 1, 1.5 and 2 cm). We found average throughput values of 6.5 bits per second (bps) in static conditions, versus 5.7 bps under vibration, and average error rates of 10.3% in static conditions, versus 16.6% under vibration. Similar to prior work, we found an exponential increase in error rate with decreasing target size. Larger target sizes helped mitigate the impact of vibration. We did not find evidence of a benefit to anchoring the hand on the touchscreen’s bezel edge, compared to the freehand baseline, under vibration or static conditions. Under vibration, the pedestal outperformed the main instrument panel position, with higher throughput and lower error rate. In static conditions, the two positions performed similarly. This work contributes to vibration mitigation methods when interacting with touchscreens in the aviation context.
1. Introduction
In modern aircraft cockpits, screens take the primary real-estate that was traditionally occupied by gauges and physical buttons and switches. These screens are becoming larger, more numerous, and have increasing functionality, as exemplified by the cockpits of the Gulfstream G500 and G600 (Watkins et al., Citation2018), or the Bombardier Global 8000 (Bombardier Inc., Citationn.d.). Space in the cockpit is limited. As a result, it is advantageous that, while occupying the same physical real-estate, flexible screen interfaces can adapt, presenting different controls and information to better support a given situation or task. In addition, as a greater number of complex computerized systems are introduced into aircraft for purposes such as control, communication, monitoring, warning, and navigation, versatile computer interface devices are required for effective interaction.
Various interaction devices are used in aviation, including cursor control devices (CCD) such as trackballs (Doyon-Poulin & Routhier, Citation2011; Letsu-Dake et al., Citation2018) or trackpads (Stibbe, Citation2012); bezel keys along the edges of the screen (Intellisense Systems Inc., Citationn.d.; ScioTeq, Citationn.d.-b); knobs, whether affixed to the screen (Intellisense Systems Inc., Citationn.d.; ScioTeq, Citationn.d.-b) or on a separate unit (Mercury Systems, Citationn.d.); joysticks or thumbsticks (Mercury Systems, Citationn.d.; Thomas, Citation2018); hands-on-throttle-and-sticks (HOTAS) (Thomas, Citation2018); and touchscreens (SAE International, Citation2019). Multiple interface devices can also be used in conjunction, such as touchscreens that include bezel keys and mounted knobs (Intellisense Systems Inc., Citationn.d.; ScioTeq, Citationn.d.-b), to take advantage of the benefits offered by the different devices and for redundancy in case of malfunction.
Of these, avionic touchscreens are becoming a popular choice, being installed in different types of aircraft cockpits, including business jets (Watkins et al., Citation2018), commercial airliners (The Boeing Company, Citation2016), military aircraft (Mizokami, Citation2021), and helicopters (Garmin, Citationn.d.; Thales Group, Citationn.d.-b). Touchscreens are also being retrofitted into older aircraft (Thales Group, Citationn.d.-a), where the physical layouts of the cockpits were not designed to facilitate their use.
From a usability perspective, touchscreen advantages over other common input devices include faster selection times (Lin et al., Citation2010; MacKenzie, Citation2015; Thomas, Citation2018) and use of direct manipulation and gestures on a large, adaptable screen. This can be especially beneficial for tasks like map navigation and window management, as well as typing on soft keyboards, which offer space-saving advantages over physical keyboards.
However, touchscreens also come with important disadvantages compared to other common input devices in the context of aviation, with touchscreens having: higher error rates at small target sizes (Lin et al., Citation2010), their performance more impacted by vibration (Lin et al., Citation2010) and minimal tactile feedback, hence requiring greater visual attention during interaction (SAE International, Citation2019).
The fact that touchscreens have a combined control and display surface offers both advantages and disadvantages. Some advantages are that they are compact and have reduced complexity of installation and integration. However, some disadvantages are that the hand and finger can cover parts of the screen during interaction (SAE International, Citation2019), grease smudges can develop on the screen (SAE International, Citation2019), and the control surface cannot be decoupled and placed in a more ergonomic position if cockpit layout constraints force the display surface to be placed far from the pilot or in an otherwise ergonomically suboptimal position.
1.1. Context of avionic touchscreen use under vibration
All aircraft can experience turbulence, and helicopter cockpits, in particular, can experience high levels of vibration, of up to the “extremely uncomfortable” rating defined in the ISO 2631-1 standard (International Organization for Standardization, Citation1997), during normal flight operations (Chen et al., Citation2017; Wickramasinghe, Citation2012). Chen et al. (Citation2017) measured “extremely uncomfortable” levels of vibration on the pilot’s seat during 150 knot and “normal approach to hover” phases of flight on a CH-147F helicopter. Wickramasinghe (Citation2012) reported levels of vibration varying between “a little uncomfortable” to “extremely uncomfortable” on the pilot and co-pilot’s seats in a Bell-412 helicopter, during different phases of flight.
For this study, we decided to use helicopter vibration, rather than fixed-wing turbulence. During high levels of vibration, such as during turbulence, we assumed that the pilot may need to concentrate on other aspects of flying, rather than manipulating the touchscreen. In addition, if interaction with the screen is required under turbulent conditions, it was assumed that backup input devices that may be less impacted by vibration would be used, such as the bezel keys or knobs that are often installed on avionic touchscreens (Intellisense Systems Inc., Citationn.d.; ScioTeq, Citationn.d.-b). However, we expect that pilots will need to use the touchscreen during periods of moderate helicopter vibration, since helicopter pilots may be exposed to this level of vibration during a large portion of regular flights (Chen et al., Citation2017; Wickramasinghe, Citation2012).
Several methods have been proposed to mitigate the negative impact of aircraft vibration on touchscreen usability, including a variety of physical support techniques (Cockburn et al., Citation2017; Cockburn et al., Citation2019; Lancaster et al., Citation2011; SAE International, Citation2019). Due to its simplicity, one physical support technique in particular is already being applied in the aviation industry (Rockwell Collins, Citation2015; The Boeing Company, Citation2016), and is recommended by the SAE ARP60494 standard (SAE International, Citation2019), which provides recommendations for avionic touchscreens and touchscreen applications. This physical support technique is to use the bezel edge of the screen as a hand support, presumably while using the thumb to interact with the touchscreen.
A primary goal of our study is to objectively measure the impact of aircraft vibration on touchscreen target selection, as well as the utility of using the bezel edge as a hand support for target selection under vibration, versus a freehand baseline. To this end, we used the multidirectional selection task described in ISO 9241-411 (International Organization for Standardization, Citation2012).
1.2. ISO 9241-411 multidirectional selection task and throughput
Participants in this study performed a multidirectional selection task, as described by the ISO 9241-411 standard (International Organization for Standardization, Citation2012). This task was chosen because:
it is the recommended method in the literature for measuring the limits of human performance when using a pointing device, and comparing across different pointing devices (International Organization for Standardization, Citation2012; Soukoreff & MacKenzie, Citation2004);
it is simple, quick to perform, and well-established, making it easier to run a factorial experimental design, control the independent variables and interpret the results;
the results of this task can be more easily compared to others in the literature that use the same widely-used methodology (Soukoreff & MacKenzie, Citation2004);
it is simple, easy to learn, and does not rely on or benefit from prior piloting experience, allowing for a wider range of participants;
it is representative of common actions done on touchscreens, such as typing on a soft keyboard (Soukoreff & MacKenzie, Citation2004; Soukoreff & Mackenzie, Citation1995).
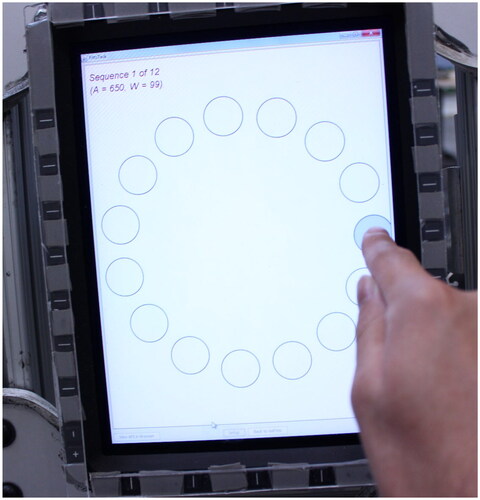
The multidirectional selection task has the following properties, with the broad description defined in the ISO 9241-411 standard (International Organization for Standardization, Citation2012), and with additional details further clarified in the literature (MacKenzie, Citation2018; MacKenzie & Castellucci, Citation2020; Soukoreff & MacKenzie, Citation2004). The participant rapidly selects a sequence of targets that are arranged around a circle. shows an example of the layout of targets within a multidirectional selection task, with the targets numbered according to their order of selection within the sequence, and with the current target highlighted in purple. The pattern of selections is predictable: always starting at the same target location, with the next selection being the target that is approximately opposite (with a slight clockwise offset) across the circle. Before the trial can start, the first target in the sequence must be successfully selected. After this, once an onscreen tap is made, whether it is successful or not, the next target in the sequence is highlighted, with the rest either de-enunciated or hidden entirely. An error is considered to be a tap that is located outside of the bounds of the currently highlighted target. Feedback is given to indicate either a successful or unsuccessful target selection.
Figure 1. The layout of targets in one trial of a multidirectional selection task, with the targets numbered according to their order of selection within the sequence (MacKenzie, 2017–Citation2020).
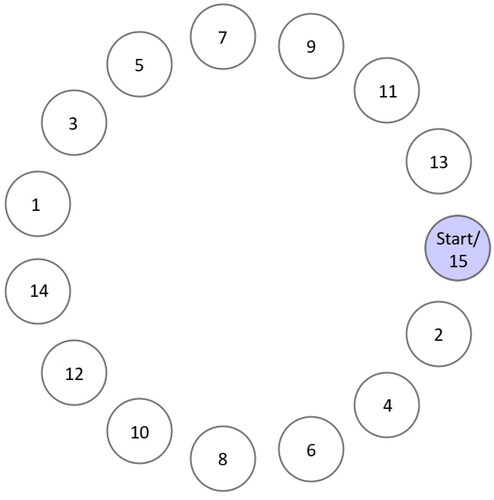
For a given trial, the target size (W) and amplitude (A, which is the distance between targets) are held constant. Once all targets of a trial are selected, the next trial is presented to the participant with a different combination of target size and amplitude values. The participant must complete trials with all factorial combinations of target size and amplitude before a given experimental condition is completed.
From the data obtained through the multidirectional selection task, it is possible to calculate throughput values. Throughput is a combined measure of both selection speed and accuracy, when performing a rapid sequence of target selections, and allows for easier comparison across conditions or studies than individual measures of just selection speed or accuracy (Soukoreff & MacKenzie, Citation2004). Throughput is calculated per trial and per participant. A “mean-of-means” throughput is then calculated across trials and participants, for a given experimental condition (Soukoreff & MacKenzie, Citation2004). This mean-of-means throughput is then used to compare between conditions. Throughput is reported in units of bits/second (bps), in an analogy to information theory (Fitts, Citation1954; Shannon, Citation1948).
Throughput for a given trial is calculated using the following formulas (MacKenzie, Citation2018; Soukoreff & MacKenzie, Citation2004):
(1)
(1)
(2)
(2)
(3)
(3)
Where
is throughput;
is the effective index of difficulty;
is the average time between each two sequential taps in the trial; Ae (calculated as per (MacKenzie, Citation2018) for serial tasks) is an approximation of the average distance between each two sequential tap points in the trial;
is the effective target width; and
is the standard deviation of tap points, as measured along a 1D line between each target.
is considered to be representative of the difficulty of the task, related to the accuracy required by the task (Zhai et al., Citation2004). As a result, the throughput ratio of
over movement time (
) is considered to be a combined measure of speed and accuracy (Soukoreff & MacKenzie, Citation2004).
The mean-of-means throughput is calculated by taking the average throughput across trials and participants for a given experimental condition (Soukoreff & MacKenzie, Citation2004):
(4)
(4)
Where
is the number of participants,
represents each individual participant,
is the number of trials per condition, and
represents each trial.
1.3. Touchscreens compared to other common selection devices
In static conditions, touchscreen throughput values in the literature are generally in the range of 5–8 bps (Bachynskyi et al., Citation2015; Browning & Teather, Citation2014; Lin et al., Citation2010; MacKenzie, Citation2015). This is higher than throughput value ranges reported for other common input devices (see (Soukoreff & MacKenzie, Citation2004) for a review): 3.7–4.9 bps for computer mice, 3 bps for trackballs, 1–2.9 bps for touchpads, and 1.8–2.6 bps for joysticks.
In the context of aviation, Thomas (Citation2018) found that a touchscreen had higher throughput than other common cockpit selection devices in static conditions: 3.7 bps for the touchscreen, 2.1 bps for the trackball, 2 bps for the trackpad, 1.2 bps for the thumbstick, and 0.7 bps for the fingerstick. However, it should be noted that the throughput value for the touchscreen reported by Thomas is low compared to the usual range of static touchscreen throughput values in the literature (Bachynskyi et al., Citation2015; Browning & Teather, Citation2014; Lin et al., Citation2010; MacKenzie, Citation2015).
In the context of an aircraft cockpit layout in static conditions, Doyon-Poulin and Routhier (Citation2011) reported a throughput value of 1.9 bps for a CCD trackball.
Avsar (Citation2017) and Avsar et al. (Citation2015) had participants perform a target selection task, while sitting inside a helicopter cabin during four flight phases, when using a touchscreen tablet either hand-held or affixed to the cabin window. The authors reported average throughput results of 5.36 bps in static conditions, versus 4.55 bps when averaged across all in-flight conditions. They also found an average error rate of 1% at a target size of 2 cm, rising exponentially to 47% at a target size of 0.5 cm. However, their task differed from a standard ISO 9241-411 multi-directional selection task in that participants were allowed to use both hands simultaneously and the targets appeared in random locations at random sizes, which may have especially influenced their reported throughput results.
In comparison, Letsu-Dake et al. (Citation2018) found error rates between 2 and 6% when using a CCD trackball under high levels of turbulence, even when wearing gloves and using the non-dominant hand. Throughput in these conditions was relatively low, in a range from 0.7 to 1.4 bps.
Coutts et al. (Citation2019) had participants perform a target selection task on a vibration platform under four turbulent conditions, in the context of aviation, with touchscreens positioned in main instrument panel (MIP), pedestal or overhead panel positions. The authors also found exponentially increasing number of errors with decreasing target size. In this study, targets were arranged as per the ISO 9241-411 multidirectional selection task layout (International Organization for Standardization, Citation2012). However, the participants were forced to make a successful selection before they were permitted to continue to the next target in the sequence. The authors reported number of errors instead of error rate and did not report throughput values.
In a dual-task experimental design, Xie et al. (Citation2023) had participants maintain a steady attitude during a simulated flight, while being exposed to static, fixed-wing turbulence or while being startled by a loud noise. At the same time, the participants also had to perform each of the following tasks: select randomized targets on a touchscreen; select a value while using a control panel with a rotary knob; or type in values using a physical multifunction control and display unit (MCDU) keyboard. The authors used touchscreen target sizes of 0.5, 1.5, 2.5 and 3.5 cm. They found average touchscreen throughput values of 3.4 bps under static conditions, and 1.7 bps under turbulent conditions, while conducting the dual task. These touchscreen throughput values were better than the throughput values when using a control panel with a rotary knob, which had throughput values of 1.6 bps in static conditions and 1.1 bps under turbulent conditions. Throughput for the knob was calculated based on a rotational throughput formula. However, the touchscreen throughput values were lower than the throughput values associated with using the physical keyboard on the MCDU, which had throughput values of 4.8 bps in static conditions, and 3.3 bps under turbulent conditions, during the dual-task. Throughput for the physical MCDU keyboard was calculated based on keyboard key size and the distance between keys. However, this study’s touchscreen target selection task differed from a standard ISO 9241-411 multi-directional selection task in that the targets were randomly displayed onscreen. In addition, when calculating the touchscreen throughput values, they used the uncorrected amplitude and target size rather than the effective amplitude and target size, which may have impacted their results.
Hourlier and Servantie (Citation2017) had participants perform various tasks on a touchscreen while exposed to fixed-wing turbulent conditions. They reported error rate results when the participants anchored their hand on the touchscreen’s bezel edge versus when using the touchscreen freehand, under a mean 1.53 ms−2 turbulent condition. They found that anchoring the hand on the screen’s bezel edge provided an advantage. For the specific task component and turbulent condition that they used to compare between the two hand-support conditions, they reported that the supported condition offered around a 50% lower error rate compared to the freehand condition. However, they only reported these results for one portion of one of their study’s tasks. In addition, parts of their methodology were left unspecified, including screen placement, hand used, and they did not specify whether or not their results were statistically significant. Their reported freehand error rates are high compared to others in the literature for equivalent or similar target sizes (Avsar, Citation2017; Avsar et al., Citation2015; Lin et al., Citation2010), being at or above 100% error rate for target sizes at or above 1.5 cm, and they used a higher level of vibration, rated as “very uncomfortable” if using the ISO 2631-1 standard (International Organization for Standardization, Citation1997).
Outside the context of aviation, Lin et al. (Citation2010) found that low frequency ship vibration had a greater impact on touchscreen throughput, compared to a mouse and especially versus a trackball. In static conditions, they found a touchscreen throughput value of 8.2 bps, versus 6.3 bps for the mouse, and 2.6 bps for the trackball. With “not uncomfortable” (averaging 0.22 ms−2) and “a little uncomfortable” (averaging 0.34 ms−2) levels of vibration, as defined by the ISO 2631-1 standard (International Organization for Standardization, Citation1997), Lin et al. found that the touchscreen’s throughput decreased to become equivalent to that of the mouse (5 bps with “not uncomfortable” levels of vibration, and 4 bps with “a little uncomfortable” levels of vibration, for both devices). The trackball’s throughput remained relatively constant, across static and both vibration conditions, remaining around 2.6 bps.
Lin et al. found that low-frequency ship vibration also had a greater impact on touchscreen error rate, versus mouse and trackball error rate. They found that the error rate on the touchscreen rose sharply from 2% in the static condition to 14% in the 0.34 ms−2 vibration condition. Conversely, with the mouse and trackball, the error rate remained below 2.1% across all vibration conditions. The authors found that the touchscreen error rate increased exponentially with decreasing target size, whereas it remained relatively constant for the mouse and trackball. For the touchscreen, the error rate was 2% at a target size of 2.5 cm, increasing exponentially to 16% at a target size of 1 cm, whereas with the mouse and trackball, the error rate remained below 2% across all target sizes tested.
In summary, the prior work indicates that, in static conditions, touchscreens have higher throughput than other common selection devices. However, touchscreen throughput is more sensitive to, and negatively impacted by vibration. In addition, the touchscreen error rate is more sensitive to, and negatively impacted by both vibration and target size.
1.4. Synthesis and study goal
The literature review shows that there is a lack of studies reporting touchscreen throughput under vibration in the aviation context using a standardized evaluation method. Although previous work did report throughput values for touchscreen target selection during in-flight vibrations, (Avsar, Citation2017; Xie et al., Citation2023), the task design did not follow the procedure laid out in ISO 9241-411, since targets appeared at random locations. Other work used a non-standard method to account for errors (Coutts et al., Citation2019), or did not report throughput and error rate in a standard manner (Cockburn et al., Citation2017; Coutts et al., Citation2019).
There is also a lack of knowledge on the utility of using the bezel edge of the touchscreen as a hand support, against a freehand baseline. Hourlier and Servantie (Citation2017) did compare these two conditions under vibration, but did not use a standard target selection task and reported their results only for a high level of turbulence.
Therefore, the goal of this study is to measure the impact of vibration, selection method, target size, screen location, and touchscreen type on touchscreen target selection performance and error rate in an aircraft cockpit context. To this end, we used the standardized multidirectional selection task (International Organization for Standardization, Citation2012) and reported throughput and error rate.
2. Methodology
2.1. Participants
24 participants took part in this study (20 right-handed, 2 left-handed, and 2 ambidextrous). All but one participant were non-pilots. This study measured human performance for target selection and no prior knowledge of aircraft systems was required for this task, nor would such knowledge have offered a performance advantage.
The participants’ mean age was 38 years old (ranging from 23 to 64 years old). Their mean height was 173.6 cm (157.5 cm–183 cm), with a mean sitting eye height of 120.1 cm (110.5 cm–128.3 cm). Note that to respect aviation requirements for pilot stature, participant height had to be within 5′2″ and 6′3″ (14 CFR 25.777 (Office of the Federal Register–National Archives and Records Administration, Citation2002)). The mean index finger width was 1.6 cm (1.3 cm–2.0 cm) and the mean hand size was 18.9 cm (17.0 cm–20.5 cm).
This study was approved by Polytechnique Montréal’s Research Ethics Board (CER-1920-48-D) and all participants signed the informed consent form before taking part in the study.
2.2. Apparatus
2.2.1. Vibration platform
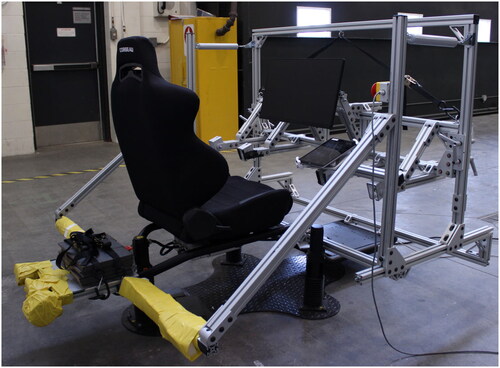
The vibration platform (see ) was built on top of a D-Box GP Pro 500 chair, programmed in C++ using D-Box’s DevSim libraries. The platform was designed so that the screens could be quickly and solidly connected and disconnected in the two positions and could be adjusted in height, to accommodate participants of different statures.
Figure 2. The vibration platform used in this study.
2.2.2. Touchscreen positions
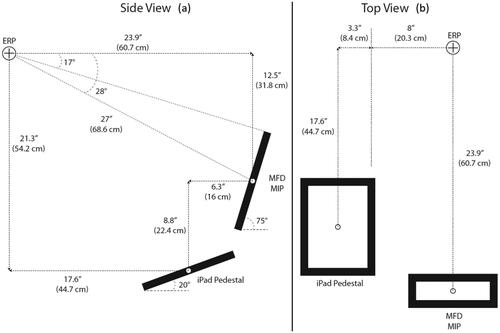
Touchscreens were placed in two positions: the Main Instrument Panel (MIP), which was near-vertical and directly in front of the participant, and the pedestal, which was near-horizontal and beside the knee of the participant. For the pedestal position, the screen was placed to the right for right-handed and ambidextrous participants, and to the left for left-handed participants. For the MIP position, the screen was centered in front of the participants. The screen heights were adjusted based on each participant’s seated eye height, in order to maintain a consistent screen position relative to the participants’ eyes. shows the distances based on the participant Eye Reference Point (ERP). This setup was chosen in consultation with aviation human factors experts to reflect the physical ergonomics of a cockpit, as well as in reference to the Federal Aviation Administration (FAA)’s Advisory Circular (AC) 29-2 C (Federal Aviation Administration, Citation2016) and FAA AC 25.773-1 (Federal Aviation Administration, Citation1993). Only the iPad was placed in both the MIP and pedestal positions. All other screens were solely placed in the MIP position.
Figure 3. (a) Side view and (b) top view showing the relative distances between a participant’s eye and the two screen positions used in this study.
2.2.3. Touchscreens used
Four touchscreens were used in this study, as shown in , with two being consumer touchscreens, and two being avionic touchscreens.
Figure 4. The four touchscreens used in this study, within the frames used to attach them to the vibration platform. From top left to bottom right: iPad, Planar touch monitor, avionic MFD, and avionic MCDU.
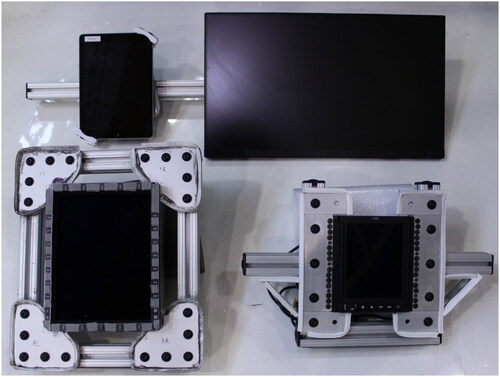
The four touchscreens had the following specifications:
ScioTeq MDU-268 (ScioTeq, Citationn.d.-a) is an avionic multifunction display unit (MFD), using projected capacitive touch sensing technology and having a display area of 21 cm × 16 cm (1024 pixels × 768 pixels; 123.6 pixels per inch, ppi).
TSCU-5045 (Scioteq, Citationn.d.-c) is an avionic multifunction control and display unit (MCDU) using resistive touch sensing technology and a display area of 13 cm × 10 cm (1024 pixels × 768 pixels; 200.4 ppi).
Planar Helium PCT2435, a consumer, projected-capacitive touchscreen computer monitor (Planar Systems, Inc., Citation2021), with a display area of 30 cm × 53 cm (1080 pixels × 1920 pixels; 92.53 ppi).
Apple iPad 6th Generation, a consumer tablet touchscreen (Apple, Citation2021) with capacitive touch sensing technology and a display area of 20 cm × 15 cm (2048 pixels × 1538 pixels; 264 ppi). Note the iPad is similar in display area to the MDU-268 (ScioTeq, Citationn.d.-a) avionic MFD.
2.2.4. Software applications
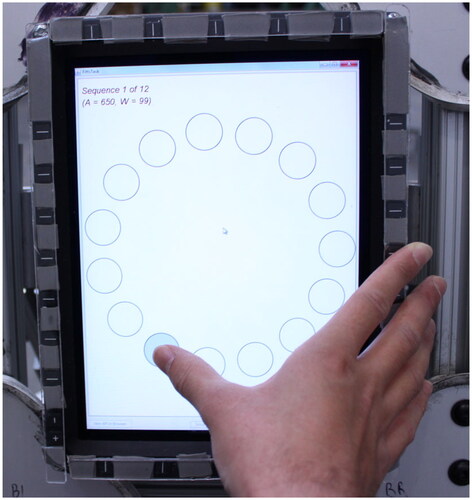
The Planar, MFD, and MCDU screens were connected as touch monitors to a laptop running Microsoft Windows 7. This laptop was used to run GoFitts (MacKenzie, 2017–Citation2020), a free software which replicates the ISO 9241-411 multidirectional selection task (International Organization for Standardization, Citation2012) (see ).
Figure 5. The MFD touchscreen, while running the GoFitts application (MacKenzie, Citation2017–2020) used in this study.
In addition to the target size and amplitude parameters, which will be described later, the following settings were applied to GoFitts:
Selection was on the release of the finger from the touchscreen
15 targets per trial
Automatically had the participant redo a given trial if that trial’s error rate was above 50%
Audio feedback
The iPad ran iOS 14.4.2. On the iPad, the multidirectional selection task ran on a website developed by one of the authors, through the Google Chrome web browser (see ). This version of the multidirectional selection task was made to mimic GoFitts, with the following main differences:
Figure 6. Multidirectional selection task on the iPad, running on a website through the Google Chrome web browser.
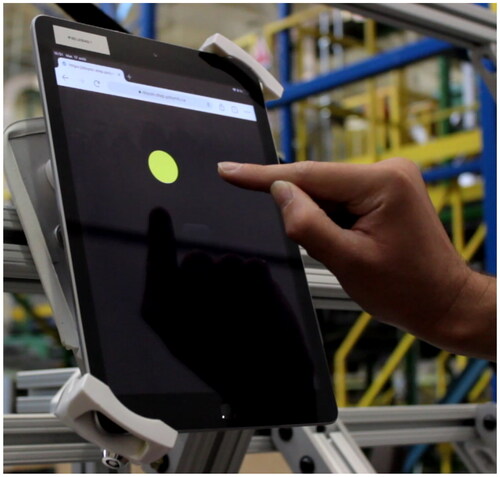
Selections were registered on-press, whereas they were registered on-release with GoFitts
Only the currently active target was shown, in yellow, with all other targets hidden
Error rate was not limited, so participants were not automatically asked to redo a trial if their trial error rate was above a certain threshold
2.3. Hand-support methods
The participants used two hand-support methods:
Freehand: the participants used their index finger to select the targets, without using a support to stabilize their hand (see ).
Supported: the participants used their thumb to select the targets while supporting their fingers on the bezel edge of the touchscreen, as seen in .
Figure 7. Supported condition on the MFD screen.
The Planar PCT2435 was too large to be able to reach all targets while holding onto the bezel edge. As a result, only the freehand condition could be performed on this screen.
For the MFD screen and iPad, participants held onto the side of the screen during the supported condition (see ). For the MCDU screen, participants held onto the top of the screen to support their hands (see ).
Figure 8. The MCDU screen was held from the top, in the supported condition, due to the shape of the frame.
2.4. Vibration levels
We used two vibration levels:
Static: no vibration.
Vibration: the vertical axis component of a vibration profile measured on the pilot’s seat of a Bell-412 helicopter during 120-knot flight (Wickramasinghe, Citation2012; Wright Beatty et al., Citation2016; Yong et al., Citation2008), and having a weighted root-mean-squared (wRMS) (International Organization for Standardization, Citation1997) value of 0.715 m/s2.
2.4.1. Vibration profile
The vibration profile used in this study was based on an accelerometer measurement taken on the pilot’s seat of a Bell-412 helicopter during a 120-knot level flight (Wickramasinghe, Citation2012; Wright Beatty et al., Citation2016; Yong et al., Citation2008), provided by the National Research Council of Canada (NRC). The impact of this measured vibration profile on the human body was calculated, using the ISO 2631-1 standard’s (International Organization for Standardization, Citation1997) weighted root-mean-squared (wRMS) acceleration method (Mansfield, Citation2005), to analyzed the contribution of each axis’ vibration to the total impact. shows that the vertical (Z-axis) acceleration wRMS accounts for 91% of the total acceleration wRMS, in line with Wright Beatty et al. (Wright Beatty et al., Citation2016) who previously determined that vibration solely in the vertical axis was representative of the overall pilot’s seat vibration, for the same Bell-412 helicopter in 120-knot flight. Hence, in this study, we only used the vertical component of the vibration.
Table 1. ISO 2631-1 (International Organization for Standardization, Citation1997) wRMS analysis of the vibration profile per axis
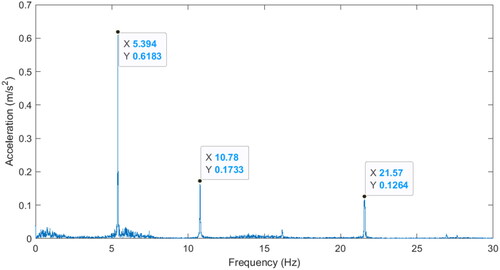
shows the frequency domain representation of the Z-axis vibration profile measured by the NRC on the pilot’s seat of a Bell-412 helicopter during 120-knot flight, in the range from 0 to 30 Hz. This range contained the majority of the Z-axis acceleration wRMS (over 99.9%).
Figure 9. Frequency domain representation of the Z-axis vibration profile measured on the pilot’s seat of a Bell-412 helicopter during 120 knot flight.
It was experimentally determined that the D-Box control system used in this study had a practical frequency limit of around 11 Hz, with higher frequencies causing unwanted effects. As a result, a low-pass filter was used to smoothly filter frequencies above 11 Hz, while a high-pass filter was used to smoothly filter out frequencies below 0.85 Hz, since lower frequencies would have caused too much motion amplitude, exceeding the chair’s displacement limits.
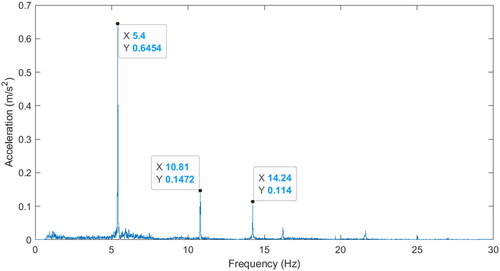
The frequency domain representation of the final vibration profile used in this study, as measured on the seat of the D-Box chair, is shown in . Comparing to , the peaks at 5.4 Hz and 10.8 Hz are well replicated, the peak at 21.6 Hz has been lost, and an undesired peak at 14.2 Hz has been added by the control system.
Figure 10. Frequency domain representation of the Z-axis vibration profile used in this study, as measured on the seat of the D-Box chair.
Despite some discrepancies in the frequency domain graphs, when comparing between the recorded and replicated vibration profiles, the total acceleration wRMS values matched up closely (see ). The same goes when evaluated per 1/3rd octave frequency band (see ). As a result, it was determined that the vibration profile used in this study was representative of the whole-body vibration that could be experienced when sitting on the pilot’s seat of a Bell-412 during 120-knot flight.
Figure 11. Acceleration wRMS in the vertical Z-axis per 1/3rd frequency band, calculated as per ISO 2631-1 (International Organization for Standardization, Citation1997), with the bands as defined in S1.11-2004 (American National Standards Institute, Citation2004).
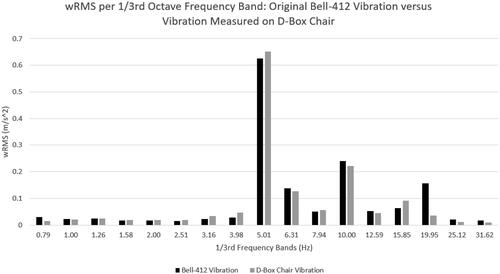
Table 2. Total acceleration wRMS values in the Z-axis
2.5. Independent variables
This study had seven independent variables. We considered the first four to be the main independent variables, while the last three were considered secondary independent variables since they are inherent to the ISO 9241-411 multidirectional selection task (International Organization for Standardization, Citation2012; Soukoreff & MacKenzie, Citation2004).
The four main independent variables in this study were:
Screen type: with four screen levels (two avionic touchscreens and two consumer touchscreens)
Screen position: with two position levels (main instrument panel and pedestal positions)
Hand-support method: with two hand-support levels (using the thumb while supporting the hand on the screen’s bezel edge, versus using the index finger freehand)
Vibration: with two vibration levels (with vibration and without vibration)
When combined, these main independent variables and their associated levels formed the 18 experimental conditions of this study. All participants performed the same task under these same 18 experimental conditions. The experimental design was not full-factorial for the following reasons:
Only the iPad was tested in both screen positions, with all other screens only being tested in the MIP position.
The Planar PCT2435 was only used freehand since it was too large to be able to select all the targets during the supported condition.
The three secondary independent variables, which are inherent to the ISO 9241-411 multidirectional selection task, were (International Organization for Standardization, Citation2012; Soukoreff & MacKenzie, Citation2004):
Target size, commonly denoted by the letter W for “width”: with four levels (0.8 cm, 1 cm, 1.5 cm, and 2 cm).
Distance between targets, commonly referred to as “amplitude” and denoted by the letter A: with three levels (small, medium, and large, with the exact size depending on the screen under investigation).
Selection angle: with 15 levels (arranged in increments of 24° around a circle).
2.6. Dependent variables
This study had two main dependent variables:
Throughput (bps)
Error rate (%)
2.7. Target size, amplitude and selection angle
The independent variables of target size, amplitude, and selection angle are inherent to the ISO 9241-411 multidirectional selection task (International Organization for Standardization, Citation2012; Soukoreff & MacKenzie, Citation2004).
We used four target sizes: 0.8 cm, 1 cm, 1.5 cm, and 2 cm. The smallest target size (0.8 cm) corresponded to among the minimum target sizes used for avionic cursor control devices, based on discussions with aviation human factors experts. These target sizes were consistent across all four screens.
There were three amplitudes used in this study (see ), which were not fully consistent across screens. An effort was made to keep these amplitudes similar across the Planar, MFD screen, and iPad, with the largest amplitude being slightly smaller on the iPad due to its slightly smaller display area. Due to the much smaller size of the MCDU screen compared to the other screens, its three amplitude conditions differed from the other touchscreens.
Table 3. Amplitude conditions used in this study, per screen.
These four target sizes and three amplitude conditions led to 12 ID (index of difficulty) values, per screen, as shown in .
Table 4. The 12 ID values, per screen, used in this study.
This study used 15 targets per trial, resulting in 15 target angles. For the Planar, MFD and MCDU screens, the first target was centred on the positive horizontal (x) axis, with the 15 targets distributed with even angular spacing around the circle. For the iPad, the first target was centred on the positive vertical (y) axis, with the 15 targets distributed with even angular spacing around the circle. There was thus a 6° difference between the targets on the iPad versus the targets on the other screens. This difference was considered negligible, for the sake of the target angle impact analysis.
2.8. Throughput
The corrected amplitude, Ae was calculated based on the calculation method used in (MacKenzie, Citation2018) for serial tasks. We, IDe and throughput calculations were performed according to the formulas recommended by Soukoreff and MacKenzie (Citation2004).
2.9. Error rate
Errors were considered to be taps that fell outside the circumference of the currently highlighted target (MacKenzie & Castellucci, Citation2020). The next target in the sequence was highlighted after any tap, whether or not the selection was successful. The error rate per trial was calculated based on the following formula, with the total number of targets per trial being 15:
(5)
(5)
The error rate per condition was then calculated as the average error rate of all trials and participants, under that condition.
2.10. Experimental procedure
Data collection occurred from April 30 to August 19, 2021.
On arrival, the participant was greeted, given an overview of the study, instructed on the activities they would perform as part of the study and asked if they had any questions. The participant then signed the informed consent form.
The participant’s anthropometric characteristics were noted. The height of the screens was adjusted based on the sitting eye height of the participant. The participant was then asked to sit on the D-Box GP Pro 500 chair.
The investigator explained to the participant about Fitts’ law and the selection task, and instructed the participant to select the targets as quickly and as accurately as possible.
The participant then conducted a practice multidirectional selection task while being exposed to vibration, being instructed to practice both hand-support techniques, until they reported being ready to start the test.
The participant then did the multidirectional selection task in each of the 18 conditions. The order of presentation was varied between participants. After each condition, the participant took a rest to prevent fatigue and discomfort.
2.11. Data analysis
2.11.1. Outlier removal
Soukoreff and MacKenzie (Citation2004) mentioned the concept of “misfires”, which are accidental, outlier selections that violate the rapid-aimed-movement assumption of Fitts’ law, on which the throughput calculation is based.
The following types of misfires were observed during the study:
Accidental double-taps. These were most frequent in the vibration condition.
Accidentally hitting the active edge of the screen with the hand. These were most frequent when using the iPad supported since the iPad had a thin bezel and the active area of the screen came close to it.
Confused taps. These were most frequent on the MFD screen and were generally caused by a lack of responsiveness of the device. The participant would tap on a target and then move their hand to the position of the next target, only to realize their previous touch had not been registered. Confused, they then accidentally performed a tap on the screen, while their hand had moved partway to the next target.
After a misfire, it was observed that the participants often hesitated before being able to locate the highlighted target, since the highlight had rapidly jumped two spots in the sequence. As a result, both the misfire and the subsequent target selection both violated the rapid-aimed-movement assumption associated with the throughput calculation. Misfires and selections immediately following a misfire were thus removed from the data, for the purposes of the throughput calculation. However, these data points were retained for the error rate calculations, since misfires are a type of error and the rapid-aimed-movement assumption does not apply to error rate calculations.
Overall, a small proportion of the data points were removed. Misfires accounted for 4% of errors and 0.5% of all taps. The discarded data points, made up of both misfires and taps immediately following misfires, accounted for 1% of all taps.
2.11.2. Statistical analysis
Since all participants performed the same task under the same 18 conditions, within-subjects analysis methods were used in this study.
Since the mean-of-means throughput is the recommended method of comparing between conditions (Soukoreff & MacKenzie, Citation2004), an ANOVA analysis was first done on the average throughput and error rate per condition. However, it was also of interest to analyse the impact of target size and its associated interaction effects and, separately, amplitude and its associated interaction effects. As a result, separate ANOVA analyses were done on the average throughput and error rate per Condition × Target Size, and Condition × Amplitude.
Since this study did not use a full factorial design, it was necessary to make the following concessions for the purposes of the ANOVA analysis:
The position independent variable was combined with the screen-type independent variable. In essence, the iPad in the MIP position, and the iPad in the pedestal position were considered as though they were two separate screens, for the purposes of the ANOVA analysis. The screen-type independent variable thus had five levels: Planar monitor, MFD screen, MCDU screen, iPad MIP, and iPad pedestal.
The Planar monitor was only tested freehand and was not tested when using the hand support, unlike in all other screen-type levels where both conditions were tested. Thus, separate ANOVA analyses were conducted: one excluding the Planar monitor, but including the supported condition, while the other included the Planar monitor, but excluded the supported condition.
Overall, the statistical analyses done in this study followed the recommendations of Klemmer and Wobbrock (Citationn.d.). For each combination of independent variables analysed in the ANOVA, the assumptions of normality, homoscedasticity and sphericity were tested. Based on the results of those tests, the results of either a non-parametric ANOVA (Wobbrock et al., Citation2011), a parametric ANOVA, or a parametric ANOVA with a Greenhouse-Geisser correction was used. For each pairwise comparison, the normality assumption was tested. Based on the results of that test, either a parametric t-test was used, or else a non-parametric Wilcoxon signed-rank test. In either case, Holm-Bonferroni correction was applied per group of pairwise comparisons.
2.11.3. Order balancing
The order in which the conditions were presented to the participants was varied, in order to balance any order effects. During the data analysis, an ANOVA analysis was conducted to confirm that the order did not have a significant impact on the results. The order did not have a significant impact, indicating that the conditions in this study were well-balanced across the participants.
3. Results
3.1. Throughput
3.1.1. Throughput per main independent variable (mean-of-means throughput)
The following factors and cross factors had a significant impact on throughput: Vibration (F1,23 = 216.6, p < 0.0001), Hand-Support (F1,23 = 68.5, p < 0.0001), Screen (F2.09,48 = 9.15, p < 0.0005), Vibration × Hand-Support (F1,23 = 28.47, p < 0.0001), Hand-Support × Screen (F3,345 = 3.64, p < 0.05), and Vibration × Hand-Support × Screen (F3,69 = 7.46, p < 0.0005). The full ANOVA and pairwise comparison tables for the mean-of-means throughput can be found in Appendix A.
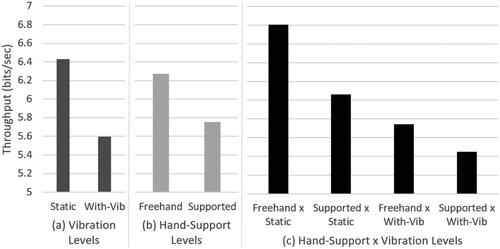
shows that the freehand condition had higher throughput, when compared against the hand-support condition, across all screens and across all vibration levels. Vibration caused a 13% average decrease in throughput compared to the static condition. As seen in , the supported condition resulted in an 8% average decrease in throughput compared to the freehand condition. As seen in , the freehand condition resulted in higher throughput than the supported condition in both the static and with-vibration conditions. Pairwise comparisons showed a significant difference between the two hand-support methods in static conditions (p < 0.0001), as well as under vibration (p < 0.005). This difference between hand-support methods was larger in static conditions, compared to under vibration, as there was a significant interaction effect of Hand-Support × Vibration (F1,23 = 28.5, p < 0.0001).
Figure 12. (a) Average throughput in the static versus with-vibration conditions. This average is across all screens, excluding the Planar touch monitor. “With-Vib” denotes “With-Vibration”. (b) Average throughput in the freehand versus supported conditions. (c) Average throughput in the Hand-Support × Vibration conditions.
As shown in , the Screen factor had a significant impact on throughput (without the Planar monitor: F2.1,48.0 = 9.2, p < 0.0005; with the Planar monitor but excluding the supported conditions: F2.7,62.2 = 9.2, p < 0.0001). From pairwise comparisons, the Planar monitor, MCDU screen, and the iPad in the pedestal position had the best average throughput, with no significant differences between them, while the MFD screen and the iPad in the MIP position had the lowest average throughput, with no significant difference between them. The Planar monitor and iPad in pedestal position both had significantly different throughput when compared against the MFD screen and iPad in MIP position (Planar versus MFD, p < 0.001; Planar versus iPad MIP, p < 0.01; iPad Pedestal versus MFD, p < 0.01; iPad Pedestal versus iPad MIP, p < 0.05). The MCDU screen had significantly different throughput values when compared against the MFD screen (p < 0.005), but not against the iPad in MIP position (p > 0.05). In particular, note that the difference in throughput between the two iPad positions was significant (p < 0.05), with the pedestal position having a higher throughput than the MIP position.
Figure 13. (a) Average throughput per screen, with the supported conditions excluded from the average (in order to be able to include the Planar touch monitor). “iPad_Ped” denotes “iPad Pedestal”. (b) Average throughput per screen. The Planar touch monitor has been excluded from this graph. (c) Average throughput for each iPad × Position × Vibration condition.
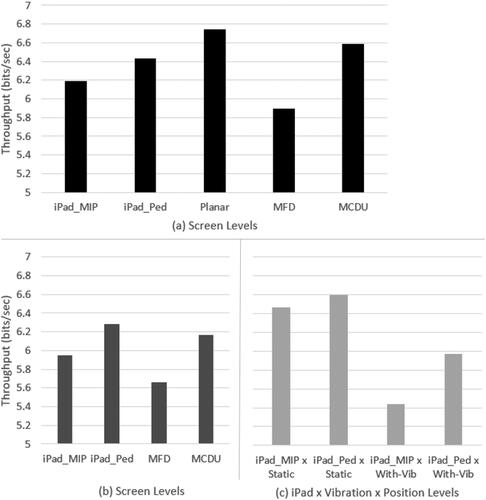
As shown in , there was no significant difference in throughput between iPad screen positions in static conditions (p > 0.05). However, with vibration, the throughput difference between iPad screen positions became significant (p < 0.001), with the iPad in the pedestal position having higher throughput than the iPad in MIP position.
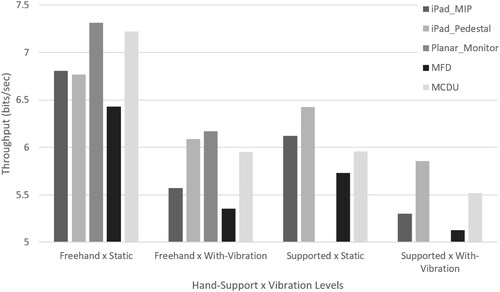
shows the throughput values for each condition. Excluding the Planar touch monitor, Vibration × Hand-Support × Screen had a significant interaction effect on throughput (F3,69 = 7.46, p < 0.0005).
Figure 14. Mean-of-means throughput result for every condition tested: Vibration × Hand-Support × Screen.
3.1.2. Throughput per main independent variable and target size
The following factors and cross factors had a significant impact on throughput: Target Size (F1.63,37.45 = 145.04, p < 0.0001), Vibration × Target Size (F3,1449 = 11.95, p < 0.0001), Screen × Target Size with the Planar monitor excluded (F9,1449 = 3.01, p < 0.005), and Vibration × Hand-Support × Target Size (F3,69 = 3.20, p < .05). The full ANOVA and pairwise comparison tables for throughput per target size cross-factors can be found in Appendix B.
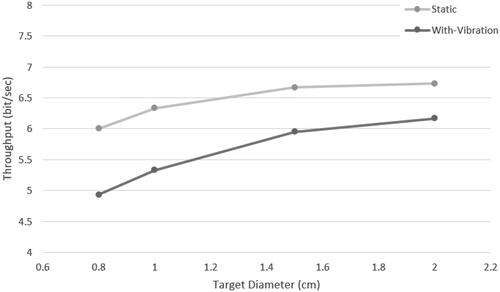
shows that the difference between the vibration and static condition decreased with increasing target size. There was a significant interaction between Vibration × Target Size on throughput (F3,1449 = 11.95, p < 0.0001).
Figure 15. Throughput versus target size in static and with-vibration conditions. The Planar touch monitor has been excluded from the average.
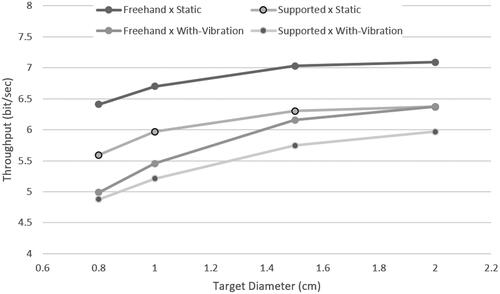
shows that the freehand condition had consistently higher throughput than the hand-support condition, across static and with-vibration conditions and across target sizes. There was no significant interaction between Hand-Support × Target Size on throughput (F2.2, 50.4 = 1.01, p > .05). However, there was a significant interaction between Vibration × Hand-Support × Target Size on throughput (F3,69 = 3.2, p < .05). Under vibration, the difference in throughput between freehand and hand-support conditions became larger with increasing target size.
Figure 16. Throughput versus target size for each Vibration × Hand-Support condition. The Planar touch monitor has been excluded from the average.
Target size had a significant impact on throughput (F1.6,37.5 = 145.0, p < 0.0001), with the slopes of the graphs in and appearing to flatten with increasing target size. However, pairwise comparison tests revealed that all combinations of target sizes had significantly different throughput averages (p < 0.0001 for all combinations, except for 2 cm versus 1.5 cm with p < 0.01). In addition, under vibration, all target size pairwise combinations had significantly different throughput averages (p < 0.0001). In static conditions, almost all pairwise comparisons had significantly different throughput averages (p < 0.0001), with the exception of the 2 cm versus 1.5 cm combination, which did not (p > 0.05).
Pairwise comparisons also showed that the two iPad positions had significantly different average throughput values from each other when using target sizes of either 2 cm or 1.5 cm (p < 0.05), with the pedestal position having higher throughput than the MIP position. However, when using 1 cm and 0.8 cm target sizes, there was no significant difference in average throughput between the two screen positions (p > 0.05).
3.2. Error rate
3.2.1. Error rate per main independent variable
The following factors and cross factors had a significant impact on error rate: Vibration (F1,23 = 178.0, p < 0.0001), Hand-Support (F1,23 = 8.8, p < 0.01), Screen (F4,207 = 32.6, p < 0.0001), Vibration × Hand-Support (F1,345 = 13.6, p < 0.0005), Vibration × Screen (F3,345 = 10.85, p < 0.0001), and Hand-Support × Screen (F3,345 = 5.51, p < 0.005). The full ANOVA and pairwise comparison tables for the throughput per main independent variable and their cross-factors can be found in Appendix C.
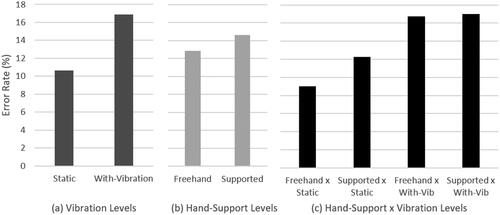
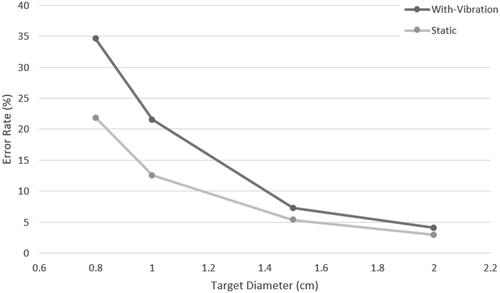
shows that the average error rate was 10.3% in static conditions and 16.7% under vibration, which is an increase of 62%. shows that the freehand condition had significantly lower error rate than the supported condition (F1,23 = 8.8, p < 0.01). However, shows that there was a significant interaction effect between Vibration × Hand-Support on error rate (F1,345 = 13.6, p < 0.0005). Pairwise comparison tests revealed that the freehand technique had significantly lower error rate than the supported technique in static conditions (p < 0.0005), but that there was no significant difference between the two hand-support levels under with-vibration conditions (p > 0.05).
Figure 17. (a) Average error rate in the static versus with-vibration conditions. The results exclude the Planar touch monitor. (b) Average error rate in the freehand versus supported conditions. (c) Average error rate in the Hand-Support × Vibration conditions.
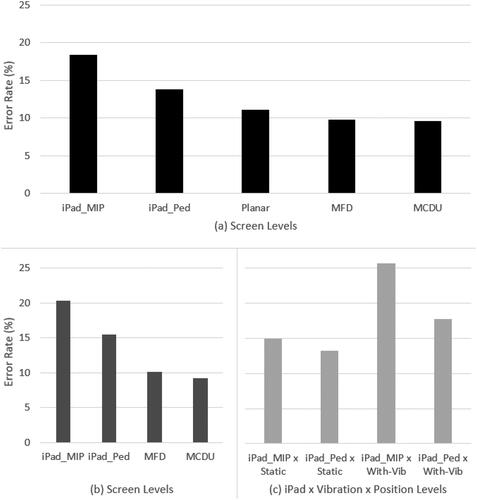
The screen had a significant effect on the error rate (F4,207 = 32.6, p < 0.0001). and pairwise comparison tests show that the iPad in the MIP position had a significantly higher error rate than all other screen levels, having higher error rates than the iPad in the pedestal position (p < 0.0001), Planar (p < 0.0005), MFD (p < 0.0001), and MCDU (p < 0.0005). The iPad in the pedestal position also had significantly higher error rate than the Planar (p < 0.05), MFD (p < 0.0005), and MCDU (p < 0.001). There was no significant difference in error rate between the Planar, MFD and MCDU. As shown in , the difference in error rate between the two iPad positions was not significant in static conditions (p > 0.05), but became significant under vibration (p < 0.0001).
Figure 18. (a) Average error rate per screen, with the supported conditions excluded from the average in order to be able to include the Planar touch monitor. (b) Average error rate per screen. The Planar touch monitor has been excluded from this average. (c) Average error rate for each iPad × Position × Vibration condition.
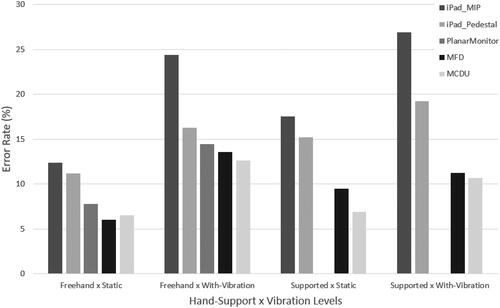
shows the error rate results for every condition tested. The interaction effect between Hand-Support × Screen was significant (F3,345 = 5.51, p < 0.005). Note that the freehand static condition had less or equivalent error rates, compared to the supported static condition, across all screens. However, under vibration, the iPad, in both positions, had lower error rate during freehand compared to supported conditions, while the MFD and MCDU screens had higher error rate during freehand compared to supported conditions. The 3-way interaction effect between Vibration × Hand-Support × Screen was not significant (F3,345 = 1.08, p > 0.05), implying that this discrepancy between the iPad and these other two screens was not significant.
Figure 19. Error rate results for every condition tested: Vibration × Hand-Support × Screen.
3.2.2. Error rate per main independent variable and target size
The following factors and cross factors had a significant impact on error rate: Target Size (F3,1449 = 1146.7, p < 0.0001), Vibration × Target Size (F3,1449 = 94.42, p < 0.0001), Hand-Support × Target Size (F3,1449 = 3.01, p < 0.05), Screen × Target Size (F3,1449 = 29.44, p < 0.0001), and Vibration × Hand-Support × Target Size (F3,1449 = 8.98, p < 0.0001). The full ANOVA and pairwise comparison tables for error rate per target size cross-factors can be found in Appendix D.
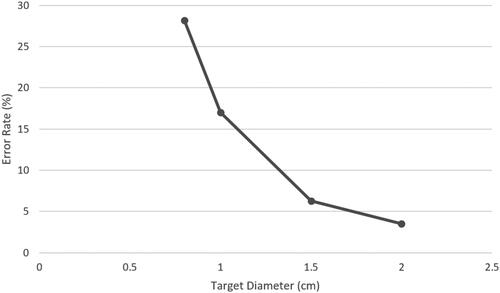
As seen in , target size had a significant impact on the error rate (F3,1449 = 1146.7, p < 0.0001), with the average error rate increasing exponentially with decreasing target size. Pairwise comparison tests reveal that the difference in error rate between all paired combinations of target sizes used in this study were significant (p < 0.0001).
Figure 20. Error rate per target size, averaged across all conditions and screens, excluding the Planar screen.
As shown in , the difference in error rate between static and with-vibration conditions lessened with increasing target sizes. There was a significant interaction between Vibration × Target Size on error rate (F3,1449 = 94.4, p < 0.0001). All pairwise comparisons of Vibration × Target Size levels were significantly different from each other (p < 0.0001, with the following exceptions: static 2 cm versus with-vibration 2 cm, p < 0.05; static 1.5 cm versus with-vibration 1.5 cm, p < 0.05; static 2 cm versus static 1.5 cm, p < 0.005).
Figure 21. Error rate per target size under static versus with-vibration conditions. The Planar screen was excluded from these averages.
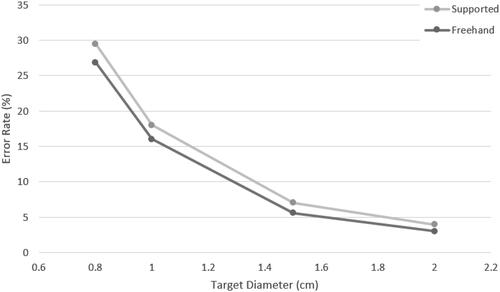
shows that the freehand condition had a lower error rate than the supported condition across all target sizes. There was a significant interaction effect of Hand-Support × Target Size on error rate (F3,1449 = 3.01, p < 0.05), with the error rates appearing to be closer at larger target sizes, between the two hand-support conditions.
Figure 22. Error rate per target size for the supported condition average, versus the freehand average. The Planar touch monitor has been excluded from these averages.
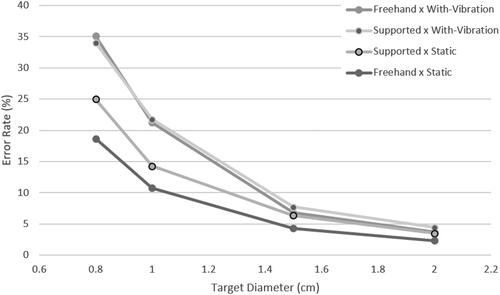
shows that the error rate difference between hand-support levels was smaller under vibration, with the freehand and supported conditions appearing nearly overlapping, whereas in static conditions the freehand condition had a lower error rate than the supported condition. There was a significant interaction effect of Hand-Support × Vibration × Target Size on error rate (F3,1449 = 8.98, p < 0.0001).
Figure 23. Error rate per target size for each Hand-Support × Vibration condition.
3.3. Additional hand-support results
Due to the nature of the task, we wondered whether the supported condition might be more impacted by larger amplitudes and further targets (ie, more impacted by having to stretch the hand to reach far targets), compared to the freehand condition. As a result, we present some per-amplitude and per target-angle comparisons here.
Note that the target angle was not balanced in this study; the order of targets was always the same per screen, with the starting position being different on the iPad versus the other screens. The target angles on the iPad were 6° off from the target angles on the other screens. For the purposes of the graphs in this section, this was deemed negligible, with each iPad target angle fitted to the nearest target angle on the other screens. The first two recorded targets in the sequence on the iPad were at 192° and 288° (after performing this angle-fitting). The first two recorded targets in the sequence on the medium MFD screen (and other screens) were at 24° and 120°. Therefore, particular caution is advised when interpreting the results at these angles.
In this section, both the Planar touch monitor and small MCDU screen have been omitted from the averages, since the amplitudes of the small MCDU were smaller than on the other screens. For the per-target-angle results, participants that used their left hand were excluded.
For the purpose of the graphs in this section, the largest amplitude has been assigned a value of 12.5 cm. This is the average largest amplitude value between the iPad, in both positions and the medium MFD screen, since these screens had slightly different largest amplitudes.
The following factors and cross cross-factors had a significant effect on throughput: Amplitude (F1.5,33.3 = 26.4, p < 0.0001), Vibration × Amplitude (F2,46 = 3.9, p < 0.05), Hand-Support × Amplitude (F2,46 = 8.1, p < 0.001) and Screen × Amplitude (F6,138 = 2.5, p < 0.05).
Only amplitude itself had a significant effect on the error rate (F2,46 = 29.3, p < 0.0001); all amplitude cross-factors did not have a significant effect on error rate.
and show that the freehand condition had higher average throughput and lower or equivalent average error rate than the supported condition across all amplitudes and Vibration × Amplitude conditions.
Figure 24. Average results for each Vibration × Hand-Support condition plotted on a graph of throughput versus amplitude.
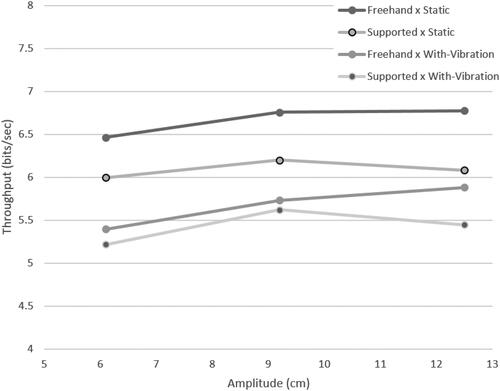
Figure 25. Average results for each Vibration × Hand-Support condition plotted on a graph of error rate versus amplitude.
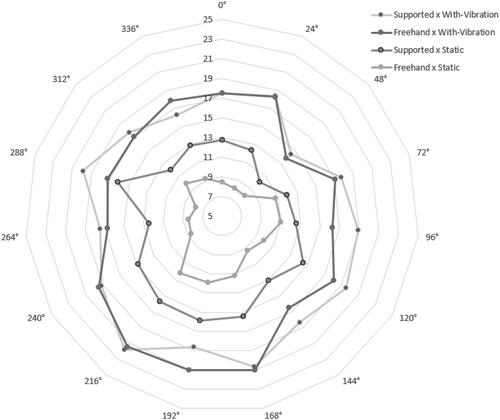
and show that the freehand condition had faster or equivalent average selection speeds and lower or equivalent average error rates across almost all of the selection angles and Vibration × Hand-Support conditions.
Figure 26. Movement time (in milliseconds) versus selection angle, for each Vibration × Hand-Support condition.
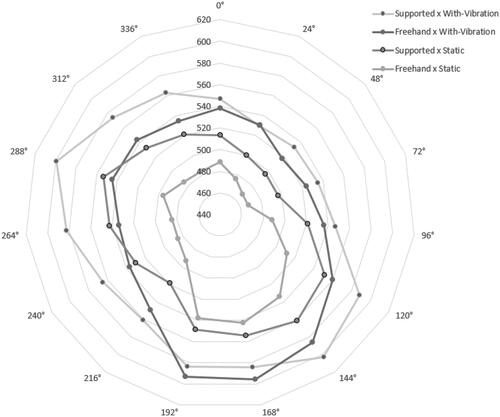
Figure 27. Error rate versus selection angle, for each Vibration × Hand-Support condition.
4. Discussion
The objective of this study was to use the ISO 9241-411 (International Organization for Standardization, Citation2012) standardized multidirectional selection task to measure the impact of vibration, selection method, target size, screen location, and touchscreen type on throughput and error rate in an aircraft cockpit context. In this section, we put our results into perspective, highlight implications for design and present the main limitations of our work.
4.1. Throughput
When averaged across all screens and hand-support conditions, throughput was 6.5 bps in static conditions, versus 5.7 bps under vibration. This represents an average 13% decrease in throughput when the participants were exposed to the vibration condition.
Under static conditions, the touchscreen throughput of 6.5 bps that we found is much higher than the value of 3.7 bps reported by Thomas (Thomas, Citation2018). Our throughput results are more aligned with other touchscreen throughput values reported in the literature under static conditions (Bachynskyi et al., Citation2015; Browning & Teather, Citation2014; Lin et al., Citation2010; MacKenzie, Citation2015), which tend to fall within a range of 5–8 bps.
Under vibration conditions, the average throughput of 5.7 bps that we found for touchscreens is higher than commonly reported throughput values in the literature for other common avionic pointing devices, even in static conditions. Doyon-Poulin and Routhier (Doyon-Poulin & Routhier, Citation2011) found a throughput value of 1.9 bps for a cursor control device in static conditions, positioned in a representative cockpit layout. Letsu-Dake et al. (Citation2018) reported throughput values of 1.3 bps for a cursor control device under turbulent conditions, although their vibration level appears to have been higher than the one used in our study.
Xie et al. (Citation2023), had participants perform a dual-task: maintaining their attitude on a simulated flight, while at the same time selecting targets on a touchscreen. The authors reported touchscreen throughput values of 3.3 bps in static conditions, and 1.7 bps in turbulent conditions. Comparing these results to the 6.5 bps in static and 5.7 bps with-vibration found in our study, it implies that performing a dual task could potentially reduce touchscreen throughput by a half or more.
4.2. Error rate
When averaged across all screens and hand-support conditions, the error rate was 10.3% in static conditions versus 16.6% under vibration. Hence the error rate went up by a factor of 1.6, under the with-vibration condition used here.
Comparing error rate values across studies is difficult since, compared to throughput, it is less robust to small differences in methodology used across studies, especially differences in target size, distance between targets and speed of selection (Soukoreff & MacKenzie, Citation2004).
With this in mind, the average error rates we found are similar to those reported by Avsar et al. (Avsar, Citation2017; Avsar et al., Citation2015), who found 7% in static and 21% during in-flight conditions. Note that the authors used a similar range of target sizes as our study (0.5 − 2.0 cm). However, our results were higher than those of Lin et al. (Citation2010) who reported a 1% average error rate in static conditions and 14% under ship vibration. Their range of target sizes were larger than in our study (1.0 − 2.5 cm) and their touchscreen was placed in the position of an office monitor, which was likely closer than the distance used in our study. This could help explain their lower static touchscreen error rate. Xie et al. (Citation2023) also reported average touchscreen error rates lower than ours: 3.8% in static conditions and 6.2% under fixed-wing turbulence. Note that they used a larger range of target sizes (0.5 − 3.5 cm), their touchscreen was closer to the participant and the authors did not specify their vibration level, making it difficult to compare against ours. A combination of these factors may explain why their average touchscreen error rates were lower than those found in our study.
Despite these differences in error rate across studies, it appears as though the touchscreen error rate is higher than that reported in the literature for other devices, when performing a similar task, especially under vibration and for smaller target sizes.
For a mouse and trackball, using a target size range from 1 to 2.5 cm, Lin et al. (Citation2010) reported average error rates of less than 2%, across all low frequency ship vibration levels that they tested, with the mouse and trackball having lower error rates than the touchscreen across all vibration levels. Letsu-Dake et al. (Citation2018) found error rates ranging from 1.7% to 5.6% when using a cursor control device under vibration levels higher than those used in our study, including conditions where participants used their non-dominant hands. Although the authors did not specify their target size directly, they appear to have used a target size that was in the range of 0.8–1.0 cm. In our study, we found error rates under vibration of 34.2% and 21.2% when using target sizes of 0.8 cm and 1 cm, respectively. As a result, it appears as though the error rate on touchscreens may be much higher than when using a cursor control device, especially under vibration conditions, and especially for small target sizes.
4.2.1. Impact of target size on error rate
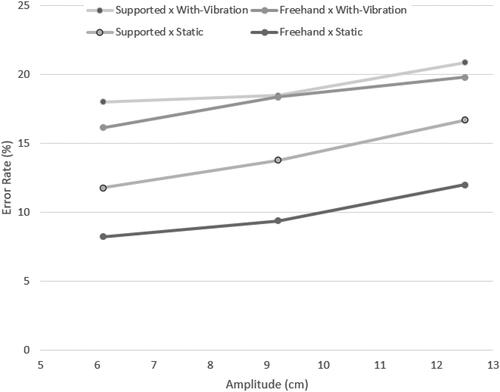
We found that the error rate increased exponentially with decreasing target size when performing the multidirectional selection task on touchscreens. This is in-line with previous research on the subject (Avsar, Citation2017; Avsar et al., Citation2015; Lin et al., Citation2010; Coutts et al., Citation2019). We also found that the difference in error rate between static and vibration conditions decreased with increasing target size. As a result, increasing the target size helped mitigate the impact of vibration on error rate.
In our study, under vibration, the error rates per target size, when averaged across all hand-support and screen conditions, were: 34.2% for 0.8 cm (0.3 inch) targets, 21.2% for 1 cm (0.4 inch) targets, 7.0% for 1.5 cm (0.6 inch) targets, and 4.0% for 2 cm (0.8 inch) targets. In static conditions, the average error rates per target size were: 21.4% for 0.8 cm (0.3 inch) targets, 12.0% for 1 cm (0.4 inch) targets, 5.2% for 1.5 cm (0.6 inch) targets, and 2.7% for 2 cm (0.8 inch) targets.
Averaged across their in-flight conditions where their touchscreen was in a fixed position, Avsar et al. (Citation2015) reported lower average error rates per target size, under vibration, than in our study: 56% for 0.5 cm targets, 12% for 1 cm targets, 5.3% for 1.5 cm targets, and 2% for 2 cm targets.
Averaged across their three vibration conditions (which includes a static condition, as well as two ship vibration conditions), Lin et al. (Citation2010) reported average touchscreen error rates per target size of: 16.7% for 1 cm targets, 7.4% for 1.5 cm targets, 3.8% for 2 cm targets, and 2.1% for 2.5 cm targets. Lin et al.’s error rate per target size results are averaged across both vibration and static conditions, and their vibration conditions also used a lower average intensity (lower acceleration RMS) than in our study. Nevertheless, their error rate per target size results match reasonably closely with those found in our study.
4.3. Hand support
We did not find evidence of a benefit from using the bezel edge as a hand support while performing the multidirectional selection task under either static or with-vibration conditions. On average, throughput was higher and the error rate lower when using the touchscreen freehand, compared to when supporting the hand on the bezel edge. The lack of observed benefit when using the hand support applied to all dependent variables, across all factors and cross-factors in this study, including when looking at error rate and movement time per target angle.
This is in contrast to the results of Hourlier and Servantie (Citation2017), who did find a benefit to using a hand support. However, they used a different task and methodology, and a higher level of vibration, compared to our study.
It should be noted that we observed a significant interaction effect of Vibration × Hand-Support on both throughput and error rate, with the difference between the supported versus freehand conditions becoming smaller under vibration.
The multidirectional selection task has been shown to be representative of one-handed typing on a soft keyboard (Soukoreff & MacKenzie, Citation2004; Soukoreff & Mackenzie, Citation1995). Our results would imply that using the bezel edge as a hand support may not always provide a benefit during the task of typing. That does not necessarily mean it is not beneficial for other types of tasks or under higher levels of vibration, but it does imply that this hand-support method may not provide a benefit, or else provide only limited benefit, for certain types of tasks under vibration levels commonly experienced during helicopter flight. It is important to define the limits of this hand support’s utility, since it is currently being recommended by the SAE ARP60494 (SAE International, Citation2019) standard, and is already being used in the aerospace industry (Rockwell Collins, Citation2015; The Boeing Company, Citation2016).
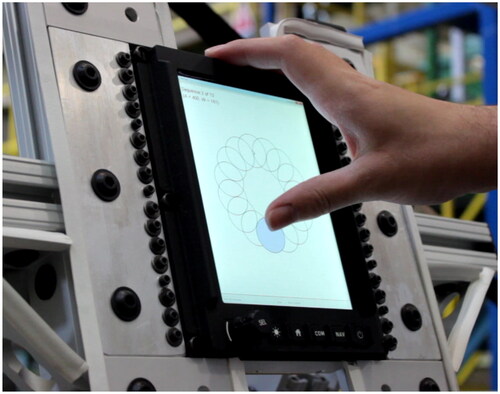
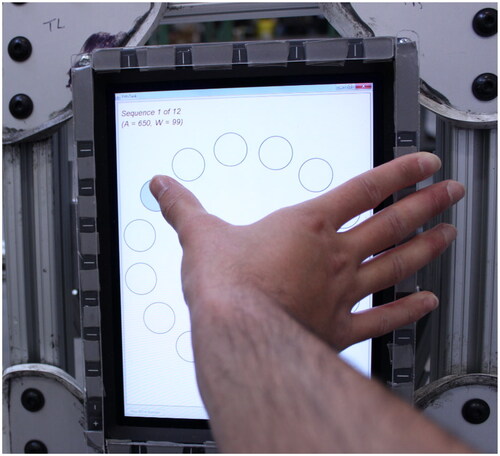
The nature of the multidirectional selection task is that the target alternates back and forth across a circle. As a result, when using the bezel edge as a hand support, acquiring targets farther from the hand may have been negatively impacted by the difficulty to reach them, while closer targets may have been hidden by the hand and acquiring them negatively impacted by occlusion of vision, as shown in . This may be one reason for why we did not observe a benefit when using the bezel edge as a hand support for this task.
Figure 28. In the supported condition, when reaching for a far target, the hand often hid the subsequent target, which was located closer to the hand.
4.4. Screen position
On average, the pedestal position had higher throughput and a lower error rate than the main instrument panel position. The difference in both throughput and error rate between the two positions was not significant in static conditions but became significant under vibration. Hence, vibration appeared to accentuate any differences between the two positions. This may have been due to their differences in reach.
Our results are in contrast to those of Coutts et al. (Citation2019), who reported more problems with accuracy and touches not being recognized on the pedestal versus the main instrument panel position. The authors claimed that this may have been due to the angle of the pedestal touchscreen. In a pre-test we conducted, we found that placing the pedestal screen further out laterally by 6.5 cm appeared to have a negative impact on reported comfort. Coutts et al. used a touchscreen with a 44 cm diagonal in the pedestal position, whereas our study used an iPad 6th generation with a 25 cm diagonal oriented in portrait. Hence, it is possible that screen size, and thus lateral position of some of the targets could also explain the differences between our results, compared to those of Coutts et al.
4.5. Touchscreen technology
The avionic touchscreens performed well when compared against the consumer touchscreens. The MCDU avionic touchscreen had among the highest throughput and the lowest error rate among the screens tested. The MFD screen had the lowest throughput, but also one of the lowest error rates of the screens tested. The MFD screen likely had lower throughput because it was not as responsive, occasionally not registering taps, and having a delay even when taps were registered.
4.6. Implications for design
The results of this study have four main implications for the design of avionics touchscreens.
First, we found that increasing the target size had a greater vibration-mitigating impact than supporting the hand on the bezel edge. The relationship between target size and error rate was exponential meaning that, for smaller target sizes (0.8 cm and 1.0 cm), increasing the target size resulted in larger increments of error rate reduction. For larger target sizes (1.5 cm and 2 cm), increasing the target size provided less incremental error rate reduction. However, we still did find a significant error rate reduction effect, in both static and with-vibration conditions, when increasing the target size from 1.5 cm to 2 cm.
Our results suggest that target sizes of 0.8 cm and 1.0 cm should be avoided since, under vibration, they had high error rates of 34.2% and 21.2%, respectively. This supports the MIL-STD-1472H standard (United States of America Department of Defense, Citation2020), which provides 0.6 inches (1.5 cm) as the minimum touchscreen button size and the recommended touchscreen keyboard size. At 1.5 cm, we found an average error rate of 7.0%, under the with-vibration conditions in this study, which may be deemed too high for certain piloting tasks.
Second, the pedestal position had higher throughput and lower error rate under vibration, compared to the main instrument panel position. However, the two positions performed equivalently in static conditions. This implies that it may be beneficial to place certain controls on the pedestal touchscreen, if one is available in a given cockpit and if those controls may need to be selected during periods of vibration.
Third, even under vibration, the touchscreens had an average throughput of 5.7 bps, which is higher than the throughput results published in the literature for other common cockpit pointing devices in static conditions (Doyon-Poulin & Routhier, Citation2011; Soukoreff & MacKenzie, Citation2004). This implies that touchscreens are a rapid target selection device, even under vibration, although the error rate may be high.
Four, unlike most consumer touchscreens, avionic touchscreens sometimes include bezel keys (Intellisense Systems Inc., Citationn.d.; ScioTeq, Citationn.d.-b). During a pre-test, we found that participants tended to accidentally click in the bezel keys while supporting their hands on the bezel edge and reaching for targets on the screen. Bezel keys on avionic touchscreens should be appropriately designed to reduce the risk of this type of accidentally activation.
4.7. Limitations and future research
Our results are subject to the following limitations.
This study used one vibration profile. Future research should use multiple vibration profiles to build a more comprehensive understanding of the impact of vibration over a representative range.
This study used one cockpit layout, based on smaller aircraft, with two touchscreen positions. In addition, participants were allowed to lean forward, and the amount to which they leaned forward was not tracked. Future research should use different cockpit layouts, and measure the impact of reach dynamics on touchscreen use in vibrating cockpit environments.
Participants used their dominant hand. However, when flying an aircraft manually, the pilot flying often has their dominant hand occupied with controlling the aircraft, and may only have their non-dominant hand free for touchscreen manipulation. In addition, military pilots may need to wear gloves during their mission, impacting the usability of touch interactions. As a result, future research should measure the impact of using the non-dominant hand, as well as gloves, on touchscreen use in vibrating cockpit environments.
The iPad used an on-touch selection method, whereas the other touchscreens in this study used an on-release selection method. The SAE ARP60494 (SAE International, Citation2019) standard recommends using an on-release selection strategy. The audio feedback also lagged behind the selection event on the iPad, and there was no maximum error rate limit per trial, compared to the other screens where participants were asked to redo the trial if the error rate was above 50%. As a result, these limitations for the iPad may have resulted in higher average error rates.
As mentioned previously, the task used in this study was chosen deliberately for a variety of reasons, including the ability to compare against other values in the literature, have better control over the independent variables, and disentangle their impact on the results. However, the task and environment used in this study have limitations, including the following: they were abstracted and not fully representative of a real cockpit task or environment, and the participants were mostly non-pilots. Future studies should measure the impact of using a hand support, and measure error rate and performance during a variety of different realistic cockpit tasks, in a more realistic setting, as well as with pilot participants.
5. Conclusion
As touchscreens are installed in an increasing diversity of aircraft cockpits, there is a need to better understand their strengths and limitations, as well as to develop and evaluate methods for mitigating against these limitations. This study used the ISO 9241-411 standardized multidirectional selection task to quantify the performance and error rate in conditions that could be experienced in a cockpit when using touchscreens to select a sequence of targets. We compared throughput and error rate under helicopter vibration and static conditions and found that the throughput, even under vibration, held up well against that of other common cockpit pointing devices reported in the literature. The error rate did not. Our results showed that the error rate decreased exponentially with increasing target size and that larger target sizes helped mitigate the impact of vibration. We added to the growing body of research into the impact of target size on error rate, under static and vibration conditions. We also measured the impact of using the bezel edge of the touchscreen as a hand support, versus a freehand baseline, and did not find any evidence of a benefit of using this hand-support method for the task and conditions in this study. Using a bezel-edge hand support is a vibration mitigation method that is proposed in an aviation standard and is already being employed in the industry. Our results point toward the need for further research into different types of vibration mitigation methods, as well as to determine the limits of where currently used vibration mitigation methods provide a benefit, and where they do not.
Acknowledgements
During a summer internship, Arthur Bévier wrote a script to calculate preliminary results from the raw data collected as part of this study, which was initially distributed across hundreds of files and folders. Daniel Imbeau provided guidance on how to perform the ISO 2631-1 whole-body vibration analysis and provided the 3-axis wRMS results shown in . The National Research Council of Canada’s Flight Research Laboratory provided Bell-412 helicopter vibration data, which they had recorded with an accelerometer on the pilot’s seat during 120-knot level flight, which formed the basis for the vibration profile used in this study.
Disclosure statement
No potential conflict of interest was reported by the author(s).
Additional information
Funding
Notes on contributors
Adam Schachner
Adam Schachner holds a Master’s of Applied Science in Industrial Engineering, focusing in cognitive ergonomics and human factors, from Polytechnique Montreal. He also holds bachelor’s degrees in mechanical engineering, from McGill University, and film animation from Concordia University. He currently works as a human factors expert in the aerospace field.
Philippe Doyon-Poulin
Philippe Doyon-Poulin is an assistant professor in the Department of Mathematical and Industrial Engineering at Polytechnique Montreal. His research focuses on human factors in aviation, error prevention and decision-making with automated systems. He authored more than 25 aircraft certification reports to show compliance on flight deck usability and pilot error.
References
- American National Standards Institute. (2004). ANSI S1.11-2004: Specification for Octave-Band and Fractional-Octave-Band Analog and Digital Filters. American National Standards Institute.
- Apple. (2021). iPad (6th generation) - Technical Specifications. Apple Inc. Retrieved October 2, from https://support.apple.com/kb/sp774?locale=en_CA
- Avsar, H. (2017). Exploring potential benefits and challenges of touch screens on the flight deck. University of Nottingham.
- Avsar, H., Fischer, J., Rodden, T. (2015). Target size guidelines for interactive displays on the flight deck. 2015 IEEE/AIAA 34th Digital Avionics Systems Conference (DASC). https://doi.org/10.1109/DASC.2015.7311400
- Bachynskyi, M., Palmas, G., Oulasvirta, A., Steimle, J., Weinkauf, T. (2015). Performance and ergonomics of touch surfaces: A comparative study using biomechanical simulation. Proceedings of the 33rd Annual ACM Conference on Human Factors in Computing Systems, Seoul, Republic Of Korea. https://doi.org/10.1145/2702123.2702607
- Bombardier Inc. (n.d.). Global 8000. Bombardier Inc. Retrieved July 1, from https://businessaircraft.bombardier.com/en/aircraft/global-8000#bba-pdp-section-4
- Browning, G., & Teather, R. J. (2014). Screen scaling: Effects of screen scale on moving target selection. CHI'14 Extended Abstracts on Human Factors in Computing Systems (pp. 2053–2058). ACM.
- Chen, Y., Ghinet, S., Price, A., Wickramasinghe, V., & Grewal, A. (2017). Evaluation of aircrew whole-body vibration exposure on a Canadian CH-147F Chinook Helicopter. Journal of the American Helicopter Society, 62(2), 1–11. https://doi.org/10.4050/JAHS.62.022004
- Cockburn, A., Gutwin, C., Palanque, P., Deleris, Y., Trask, C., Coveney, A., Yung, M., MacLean, K. (2017). Turbulent touch: Touchscreen input for cockpit flight displays. Proceedings of the 2017 CHI Conference on Human Factors in Computing Systems (pp. 6742–6753). Association for Computing Machinery. https://doi.org/10.1145/3025453.3025584
- Cockburn, A., Masson, D., Gutwin, C., Palanque, P., Goguey, A., Yung, M., Gris, C., & Trask, C. (2019). Design and evaluation of braced touch for touchscreen input stabilisation. International Journal of Human-Computer Studies, 122, 21–37. https://doi.org/10.1016/j.ijhcs.2018.08.005
- Coutts, L. V., Plant, K. L., Smith, M., Bolton, L., Parnell, K. J., Arnold, J., & Stanton, N. A. (2019). Future technology on the flight deck: Assessing the use of touchscreens in vibration environments. Ergonomics, 62(2), 286–304. https://doi.org/10.1080/00140139.2018.1552013
- Doyon-Poulin, P., & Routhier, N. (2011). Use of throughput to evaluate a Cursor Control Device (CCD) performance. Canadian Aerospace Institute Conference–AERO, Montréal.
- Federal Aviation Administration. (1993). AC 25.773-1 - Pilot Compartment View Design Considerations. (pp. 6). U.S Department of Transportation–Federal Aviation Administration.
- Federal Aviation Administration. (2016). AC 29-2C - Certification of Transport Category Rotorcraft. U.S Department of Transportation–Federal Aviation Administration.
- Fitts, P. M. (1954). The information capacity of the human motor system in controlling the amplitude of movement. Journal of Experimental Psychology, 47(6), 381–391. https://doi.org/10.1037/h0055392
- Garmin. (n.d.). G500H TXi. Retrieved September 20, from https://buy.garmin.com/en-CA/CA/p/625427
- Hourlier, S., Servantie, X. (2017). Avionics touch screen in turbulence: Simulation for design. 19th International Symposium on Aviation Psychology.
- Intellisense Systems Inc. (n.d.). Large Area Display 20 × 8 (LAD-2008). Intellisense Systems Incorporated, https://www.intellisenseinc.com/products/rugged-displays/large-area-display-20-x-8/
- International Organization for Standardization. (1997). ISO 2631-1:1997–Mechanical vibration and shock - Evaluation of human exposure to whole-body vibration–Part 1: General requirements International standard (2nd ed.). International Organization for Standardization.
- International Organization for Standardization (2012). ISO 9241-411–Ergonomics of human-system interaction. Part 411, Evaluation methods for the design of physical input devices International standard (ISO) (1st ed.). ISO.
- Klemmer, S., Wobbrock, J. O. (n.d.). Designing, running, and analyzing experiments. https://www.coursera.org/learn/designexperiments
- Lancaster, J., Mers, B., Rogers, B., Smart, A., & Whitlow, S. (2011). 57.3: The effect of touch screen hand stability method on performance & subjective preference in turbulence. SID Symposium Digest of Technical Papers, 42(1), 841–844. https://doi.org/10.1889/1.3621464
- Letsu-Dake, E., Alves, E., Khatwa, R., Dodd, S. (2018). Motion Simulator Evaluation of a Flight Deck Cursor Control Device (CCD). 2018 IEEE/AIAA 37th Digital Avionics Systems Conference (DASC). IEEE.https://doi.org/10.1109/DASC.2018.8569593
- Lin, C. J., Liu, C. N., Chao, C. J., & Chen, H. J. (2010). The performance of computer input devices in a vibration environment. Ergonomics, 53(4), 478–490. https://doi.org/10.1080/00140130903528186
- MacKenzie, I. S. (2015). Fitts’ throughput and the remarkable case of touch-based target selection. International Conference on Human-Computer Interaction, Springer, Cham.
- MacKenzie, I. S. (2017–2020). GoFitts. https://www.yorku.ca/mack/FittsLawSoftware/doc/GoFitts.html
- MacKenzie, I. S. (2018). Fitts’ law. In Handbook of human-computer interaction (Vol. 1, pp. 349–370). Wiley.
- MacKenzie, I. S., Castellucci, S. (2020). GoFitts FittsTask. Retrieved July 3, from https://www.yorku.ca/mack/FittsLawSoftware/doc/FittsTask.html
- Mansfield, N. J. (2005). Human response to vibration. CRC Press. https://www.taylorfrancis.com/books/e/9780203487228
- Mercury Systems. (n.d.). ACC9220 cursor controller and removable data media server. Mercury Systems. Retrieved July 1, from https://www.mrcy.com/products/military-rugged-display-systems/display-accessories/acc9220-cursor-controller-and-removable-data-media-server
- Mizokami, K. (2021, January 26). F-35 pilot reveals the disappointing truth about the fighter’s cockpit. Popular Mechanics. https://www.popularmechanics.com/military/aviation/a35310375/f-35-pilot-reveals-truth-about-fighter-jet-cockpit/
- Office of the Federal Register–National Archives and Records Administration. (2002). 14 CFR 25.777–Cockpit controls. Office of the Federal Register, National Archives and Records Administration.
- Planar Systems, Inc. (2021). Helium PCT2435–24 touch screen monitor. Planar Systems, Inc.
- Rockwell Collins. (2015). Introducing Touch Screen on Pro Line Fusion® - #3. YouTube. Retrieved July 3, from https://www.youtube.com/watch?v=5sV0133wgw4&t=16s
- SAE International. (2019). Touch Interactive Display Systems: Human Factors Considerations, System Design and Performance Guidelines (ARP60494).
- ScioTeq. (n.d.-a). MDU-268v2. Retrieved November 7, from https://www.scioteq.com/en/avionics/video-displays/mdu-268v2
- ScioTeq. (n.d.-b). RDU-3068. Retrieved July 1, from https://www.scioteq.com/en/avionics/video-displays/rdu-3068
- Scioteq. (n.d.-c). TSCU-5000. Retrieved July 3 from https://www.scioteq.com/en/avionics/smart-displays/tscu-5045
- Shannon, C. E. (1948). A mathematical theory of communication. Bell System Technical Journal, 27(3), 379–423. https://doi.org/10.1002/j.1538-7305.1948.tb01338.x
- Soukoreff, R. W., & Mackenzie, I. S. (1995). Theoretical upper and lower bounds on typing speed using a stylus and a soft keyboard. Behaviour & Information Technology, 14(6), 370–379. https://doi.org/10.1080/01449299508914656
- Soukoreff, R. W., & MacKenzie, I. S. (2004). Towards a standard for pointing device evaluation, perspectives on 27 years of Fitts’ law research in HCI. International Journal of Human-Computer Studies, 61(6), 751–789. https://doi.org/10.1016/j.ijhcs.2004.09.001
- Stibbe, M. (2012, May 19). On Board Boeing’s New 787 Dreamliner. Forbes. Retrieved October 2, from https://www.forbes.com/sites/matthewstibbe/2012/05/19/787-dreamliner/?sh=1522d85c17e9
- Thales Group. (n.d.-a). FlytX flight deck retrofit for mission helicopter. Thales Group. Retrieved October 23, from https://www.thalesgroup.com/en/markets/aerospace/flight-deck-avionics-equipment-functions/flytx-flight-deck-retrofit-mission
- Thales Group. (n.d.-b). FlytX tactile large display flight deck for aircraft & rotorcraft. Thales Group. Retrieved September 20 from https://www.thalesgroup.com/en/markets/aerospace/flight-deck-avionics-equipment-functions/flytx-tactile-large-display-flight-deck
- The Boeing Company. (2016). Touchscreens come to 777X flight deck. Retrieved July 3, from https://www.boeing.com/features/2016/07/777x-touchscreen-07-16.page
- Thomas, P. R. (2018). Performance, characteristics, and error rates of cursor control devices for aircraft cockpit interaction. International Journal of Human-Computer Studies, 109(C), 41–53. https://doi.org/10.1016/j.ijhcs.2017.08.003
- United States of America Department of Defense. (2020). MIL-STD-1472H: Department of defense design criteria standard–human engineering. United States of America Department of Defense.
- Watkins, C. B., Nilson, C., Taylor, S., Medin, K. B., Kuljanin, I., Nguyen, H. B. (2018, Sept 23–27) Development of touchscreen displays for the gulfstream g500 and g600 symmetry™ flight deck. 2018 IEEE/AIAA 37th Digital Avionics Systems Conference (DASC). https://doi.org/10.1109/DASC.2018.8569532
- Wickramasinghe, V. K. (2012). Dynamics control approaches to improve vibratory environment of the helicopter aircrew. Library and Archives Canada. WorldCat.org.
- Wobbrock, J. O., Findlater, L., Gergle, D., Higgins, J. J. (2011). The aligned rank transform for nonparametric factorial analyses using only anova procedures. Proceedings of the SIGCHI Conference on Human Factors in Computing Systems. https://doi.org/10.1145/1978942.1978963
- Wright Beatty, H., Law, A., Thomas, R., Yapa, U. S., Prigli, A., Ensan, M. N., & Wickramasinghe, V. (2016). Effects of vibration level and a vibration mitigating cushion on neck strain using a human rated shaker facility (No. 0384-3157).
- Xie, Y., Zhou, R., & Qu, J. (2023). Fitts’ law on the flight deck: Evaluating touchscreens for aircraft tasks in actual flight scenarios. Ergonomics, 66(4), 506–523. https://doi.org/10.1080/00140139.2022.2097318
- Yong, C., Wickramasinghe, V., Zimcik, D. (2008). Development of Adaptive Helicopter Seat Systems for Aircrew Vibration Mitigation. Proc SPIE, 6928. https://doi.org/10.1117/12.773336
- Zhai, S., Kong, J., & Ren, X. (2004). Speed–accuracy tradeoff in Fitts’ law tasks—on the equivalency of actual and nominal pointing precision. International Journal of Human-Computer Studies, 61(6), 823–856. https://doi.org/10.1016/j.ijhcs.2004.09.007
Appendix A.
ANOVA and pairwise test results for throughput per main independent variable (mean-of-means throughput)
In order to shorten the ANOVA results tables, the following acronyms and truncations have been used: (Non-)Param stands for (non-)parametric, GG stands for Greenhouse-Geisser, Shap stands for Shapiro test, Mauch stands for Mauchly’s test and BF stands for Brown-Forsythe test.
Table A1. ANOVA results for whether each factor and cross-factor had a statistically significant impact on the mean-of-means throughput. The * symbol after a p-value represents statistical significance. In order to shorten this table, the following acronyms and truncations have been used: (Non-)Param stands for (non-)parametric, GG stands for Greenhouse-Geisser, Shap stands for Shapiro test, Mauch stands for Mauchly’s test and BF stands for Brown-Forsythe test.
Appendix B.
ANOVA and pairwise test results for throughput per main independent variable and target size
In order to shorten the ANOVA results tables, the following acronyms and truncations have been used: (Non-)Param stands for (non-)parametric, GG stands for Greenhouse-Geisser, Shap stands for Shapiro test, Mauch stands for Mauchly’s test and BF stands for Brown-Forsythe test.
Table A2. p-value results from pairwise comparisons on the mean-of-means throughput. The * symbol after a p-value represents statistical significance. The pairwise comparisons in this table were done using parametric t-tests.
Table B1. ANOVA results for whether target size, and each combination of factors crossed with target size, had a statistically significant impact on throughput. The * symbol after a p-value represents statistical significance. In order to shorten this table, the following acronyms and truncations have been used: (Non-)Param stands for (non-)parametric, GG stands for Greenhouse-Geisser, Shap stands for Shapiro test, Mauch stands for Mauchly’s test and BF stands for Brown-Forsythe test.
Table B2. p-value results from pairwise comparisons on throughput per target size (W) averages. The * symbol after a p-value represents statistical significance. In this table, a subscript “w” after a p-value denotes that it is the result of a Wilcoxon signed-rank test (in order to distinguish it from the result of a T-Test, which has no additional subscript).
Table B2. (continued)
Appendix C.
ANOVA and pairwise test results for error rate per main independent variable
In order to shorten the ANOVA results tables, the following acronyms and truncations have been used: (Non-)Param stands for (non-)parametric, GG stands for Greenhouse-Geisser, Shap stands for Shapiro test, Mauch stands for Mauchly’s test and BF stands for Brown-Forsythe test.
Table C1. ANOVA results for whether each factor and cross-factor has a statistically significant impact on error rate. The * symbol after a p-value represents statistical significance. In order to shorten this table, the following acronyms and truncations have been used: (Non-)Param stands for (non-)parametric, GG stands for Greenhouse-Geisser, Shap stands for Shapiro test, Mauch stands for Mauchly’s test and BF stands for Brown-Forsythe test.
Table C2. p-value results from pairwise comparisons on error rate per condition. The * symbol after a p-value represents statistical significance. In this table, a subscript “w” after a p-value denotes that it is the result of a Wilcoxon signed-rank test (in order to distinguish it from the result of a T-Test, which has no additional subscript).
Appendix D.
ANOVA and pairwise test results for error rate per main independent variable and target size
Table D1. ANOVA results for whether target size, and each combination of factors crossed with target size, had a statistically significant impact on error rate. The * symbol after a p-value represents statistical significance. In order to shorten this table, the following acronyms and truncations have been used: (Non-)Param stands for (non-)parametric, GG stands for Greenhouse-Geisser, Shap stands for Shapiro test, Mauch stands for Mauchly’s test and BF stands for Brown-Forsythe test.
Table D2. p-value results from pairwise comparisons on error rate per target size (W) averages. The * symbol after a p-value represents statistical significance. In this table, a subscript “w” after a p-value denotes that it is the result of a Wilcoxon signed-rank test (in order to distinguish it from the result of a T-Test, which has no additional subscript).
Table D2. (continued)