
 ?Mathematical formulae have been encoded as MathML and are displayed in this HTML version using MathJax in order to improve their display. Uncheck the box to turn MathJax off. This feature requires Javascript. Click on a formula to zoom.
Abstract
Capturing drivers’ affective responses given driving context and driver-pedestrian interactions remains a challenge for designing in-vehicle, empathic interfaces. To address this, we conducted two lab-based studies using camera and physiological sensors. Our first study collected participants’ (N = 21) emotion self-reports and physiological signals (including facial temperatures) toward non-verbal, pedestrian crossing videos from the Joint Attention for Autonomous Driving dataset. Our second study increased realism by employing a hybrid driving simulator setup to capture participants’ affective responses (N = 24) toward enacted, non-verbal pedestrian crossing actions. Key findings showed: (a) non-positive actions in videos elicited higher arousal ratings, whereas different in-video pedestrian crossing actions significantly influenced participants’ physiological signals. (b) Non-verbal pedestrian interactions in the hybrid simulator setup significantly influenced participants’ facial expressions, but not their physiological signals. We contribute to the development of in-vehicle empathic interfaces that draw on behavioral and physiological sensing to in-situ infer driver affective responses during non-verbal pedestrian interactions.
1. Introduction
There is an increasing interest within the automotive industry to develop empathic cars,Footnote1,Footnote2 which can infer driver emotions (Koch et al., Citation2021). This is partly due to human emotions arising during driving scenarios (particularly anger or stress), which are known to adversely impact driving behavior (Jeon, Citation2015). Therefore, identifying these emotions during driving scenarios and conveying this information to drivers such that emotions may be regulated in a timely manner, can play a crucial role in improving road safety (Jeon et al., Citation2011; Zepf et al., Citation2019, Citation2021). While environmental (weather, roads) and situational (traffic) factors have previously been considered for inferring drivers’ emotional states (Braun et al., Citation2019; Habibovic et al., Citation2018; Jeon, Citation2016), the non-verbal interaction between a driver and pedestrian(s) has received less attention. Considering that pedestrian non-verbal behavior is often a source of negative driver emotion (Zepf et al., Citation2019), automatically capturing drivers’ affective responses toward pedestrian non-verbal actions can aid in designing empathic, in-vehicle interfaces, thus leading to increased road safety.
Non-verbal pedestrian actions (e.g., a nod or eye contact) toward drivers persist for a very brief period of time, and therefore pose a significant challenge when capturing a driver’s affective response induced by such pedestrian actions (Guéguen et al., Citation2015; Mahadevan et al., Citation2018; Ren et al., Citation2016). These affective responses may include voluntary responses, such as vocal expressions, or head and body movements, as well as involuntary responses, such as pupil dilation, heart rate and skin conductance changes or facial expressions. Moreover, several pedestrians performing different actions may be present at the crossing at any given point. Therefore, identifying the relevant pedestrian impacting the driver’s affective state is also not a trivial task (Risto et al., Citation2017). Finally, simulated pedestrians used in traditional driving simulator experiments fail to elicit a realistic driver-pedestrian interaction that is critical in influencing a driver’s behavioral and affective state during driver-pedestrian interaction (Golland et al., Citation2015; Vanutelli et al., Citation2017).
Given these challenges, we ran two studies at Centrum Wiskunde & Informatica (CWI) in The Netherlands with increasing fidelity and realism. First, we conducted a video-based study where participants watched videos of pedestrian actions that ensured a single pedestrian action was being performed at a given time. Following that, we ran a hybrid simulator study with experimental confederates to enhance realism. These confederates acting as pedestrians performed positive and non-positive actions.
In the first study, we asked (RQ1): how do people’s affective (emotional) responses vary in response to different non-verbal, pedestrian crossing actions shown through video stimuli? To answer this, we conducted an in-lab study where participants with driving experience (N = 21) watched 10 short videos of positive and non-positive driving scenarios (involving different pedestrian actions) from the publicly available Joint Attention for Autonomous Driving (JAAD) dataset (Ghosh et al., Citation2022; Rasouli et al., Citation2017a, Citation2017b). The positive and non-positive labels were adapted from prior work that discovered that none of the JAAD videos were rated as very negative by the participants (Ghosh et al., Citation2022). We collected participant behavioral and physiological (heart rate, skin conductance and pupil diameter) signals throughout the entire duration of the study. Using techniques from activity annotation, we segmented and identified relevant participant signals induced by the stimuli (videos). We found that participants reported higher valence (pleasantness) upon observing positive pedestrian crossing action videos. On the other hand, participants reported higher arousal (excitement) upon watching non-positive pedestrian crossing videos. Additionally, participants’ physiological signals were significantly influenced by the different (positive vs. non-positive) non-verbal, pedestrian crossing actions. These signals also vary significantly for different levels of participants’ valence (positive vs. non-positive) and arousal (high vs. non-high) scores. Finally, participants facial temperatures also varied significantly for different levels of participants’ valence (positive vs. non-positive) and arousal (high vs. non-high) scores.
To increase realism and extend the work by Rao et al. (Citation2022), in our second study, we designed a hybrid driving simulator. In the hybrid simulator setup, participants drove a car in a driving simulator and stopped when approaching a zebra crossing in the simulated environment. To enhance realism, a confederate pedestrian crossed the zebra crossing while performing a non-verbal road crossing action toward the participant in the real world. Such a setup would enable us to capture participants’ affective responses (emotion self-reports, physiological signals, facial data) with respect to enacted non-verbal, pedestrian crossing actions. We asked (RQ2): How do people’s affective responses vary upon observing non-verbal actions performed by (confederate) pedestrians within a hybrid driving-simulator setup? To answer this, we ran a lab-based controlled, driving-simulator study (N = 24), where participants (drivers) drove and encountered crossing actions enacted by real-world participants (confederate pedestrians) at mock-up zebra crossings. Prior works have determined that urgency in driving behavior can impair risk detection and driver emotions, which can result in aggressive and risky driving (Chou et al., Citation2007; Megías et al., Citation2011). Accordingly, we also included conditions of driver urgency (driving under a timer) and pedestrian visibility prior to walking along the zebra crossing. We collected drivers’ emotion self-reports, facial expressions, physiological signals, and pupillometry features (fluctuations in pupil diameter in response to the video stimulus).
Findings showed that our hybrid setup can effectively capture driver affective states while driving in a simulated environment and interacting with real-world pedestrian road crossing actions. Specifically, we found participants’ self-reported valence varied significantly across positive, non-positive and no-action pairs, while self-reported arousal varied significantly for both positive and non-positive actions in comparison to no-action. Additionally, participants’ skin conductance (GSR), and heart signals (IBI, BVP, and BPM) varied significantly across self-reported valence scores for all three pedestrian action types. Similarly, heart signals (IBI and BPM), and pupil diameter varied significantly across participants’ self-reported arousal scores. Participants facial landmarks and expressions also varied significantly before and during interaction with the pedestrians, across both positive and non-positive non-verbal, pedestrian crossing actions. However, we found no significant impact of driving conditions (driver urgency and pedestrian visibility) on participants’ affective responses.
Our exploratory work comprises a video-based study, followed by a hybrid simulator study where participants’ affective responses (emotion self-reports, physiological and facial responses) were recorded. In the video-based study, participants watched videos of pedestrian actions from the drivers perspective and rated them for valence and arousal. Next, in the hybrid study, participants drove in a driving simulator while interacting with confederate pedestrians crossing a mock-up zebra crossing and enacting positive and non-positive actions. Our work offers three key contributions: (1) Validation of non-verbal, pedestrian crossing stimuli (JAAD videos) that influence participants’ affective states though multi-modal physiological and camera sensors. (2) Introduction of a novel hybrid simulator setup for capturing drivers’ affective responses toward realistic pedestrian actions within a simulated driving context. (3) Empirical findings from two studies which reveal that non-verbal, pedestrian actions influence participants’ self-reported emotions (valence and arousal), physiological signals, and facial temperatures. In-car emotion recognition research is particularly interested in determining a driver’s high arousal as well as low valence states associated with risky driving (Braun et al., Citation2022; Sani et al., Citation2017). Quantitative results from our study identify positive and non-positive non-verbal pedestrian crossing actions that results in high arousal and low valence participant states. These non-verbal pedestrian actions may aid in identifying risky driving behavior arising from driver-pedestrian interaction. Moreover, the participant affective cues (physiological, behavioral, and emotion self-reports) may also be used by empathic, in-car interfaces to automatically infer drivers’ affective states during driver-pedestrian interactions, as part of an emotion self-regulation framework for improving road safety (Bethge et al., Citation2021; Koch et al., Citation2021).
2. Related work
Several research areas shape our work, including prior research on: (a) driver-pedestrian non-verbal interactions in daily driving scenarios, and (b) measurement of in-vehicle drivers’ affective responses.
2.1. Non-verbal driver-pedestrian interactions
Prior work indicates that non-verbal communication (e.g., body posture) between drivers and pedestrians is a key factor influencing driving behavior (Habibovic et al., Citation2018; Sucha et al., Citation2017). Studies also investigated different aspects of driver-pedestrian interactions at zebra crossings, e.g., eye contact before crossing (Guéguen et al., Citation2015; Schmidt & Färber, Citation2009; Wang et al., Citation2010). Researchers demonstrated that pedestrian body language (e.g., hand, leg and head movement) toward drivers are important cues that influence positive or negative driver-pedestrian interactions (Gueguen et al., Citation2016; Kooij et al., Citation2014; Schulz & Stiefelhagen, Citation2015). Other studies investigated the role of vehicle movement as an implicit form of driver-pedestrian communication. For instance, drivers may signal their intent using vehicle stopping and speeding behaviors, which can influence pedestrian crossing decisions and pedestrian responses (Nathanael et al., Citation2018; Schneemann & Gohl, Citation2016). Researchers noted this form of communication in shared spaces whereby pedestrians demonstrated pro-social behaviors toward drivers by means of gestures, such as nodding, smiling, indicating right of way (Wang et al., Citation2022). Finally, the role of external Human-Machine Interfaces (eHMIs) as an extension of driver communication with pedestrians have also been studied. These studies concluded that eHMIs may enhance driver-pedestrian interactions in some critical situations. However, research has shown that pedestrians were found to be more responsive to drivers and often overlooked the eHMIs (Bazilinskyy et al., Citation2022; Bindschädel et al., Citation2021). Despite the foregoing, research on driver-pedestrian interaction often tends to overlook the impact of pedestrian actions on drivers’ emotional states. Therefore, in this study we contribute to a better understanding of the role that non-verbal pedestrian actions play in influencing a person’s affective state by measuring their self-reports, physiological signals, and facial features across two controlled lab studies—first in response to video stimuli, and the second in response to real-world pedestrians. For the first study, video stimuli was selected from the Joint Attention for Autonomous Driving (JAAD) dataset (Kotseruba et al., Citation2016), which captures pedestrian behavior at crossings from the drivers’ perspective. Joint attention, as defined by Rasouli et al. (Citation2017b), involves the ability to detect and influence another person’s attentional behavior and recognize them as an intentional agent. It encompasses not only simultaneous looking, attention detection, and social coordination, but also a deeper understanding of the other person’s behavior as intentional. We selected the JAAD dataset as it follows the drivers’ perspectives and captures pedestrian behaviors at the point of crossing, demonstrating attention between the two parties and the eventual actions undertaken based on driver-pedestrian interactions (Kotseruba et al., Citation2016).
2.2. Emotion models and self-reports
There are broadly two emotion models—discrete emotion models [e.g., Ekman’s six basic emotions model (Ekman, Citation1992), Plutchik’s emotion wheel (Plutchik, Citation2001)], and dimensional emotion models [e.g., Circumplex emotion model (Russell, Citation1980), which consider human emotions as a combination of valence and arousal; Pleasure-Arousal-Dominance model (Mehrabian, Citation1996)], which considers human emotions to be a combination of valence (displeasure vs. pleasure), arousal (calm vs. excitement), and dominance. In an automotive context, a few studies have explored the most frequently occurring discrete emotions during driving scenarios. For example, Mesken et al. (Citation2007) found that anxiety occurred most frequently, followed by anger and happiness. Based on users ease of use and popularity across emotion-measurement studies, we employ the Self-Assessment Manikin (SAM) model with valence and arousal dimensions, where each dimension runs on a discrete 9-point scale (Bradley & Lang, Citation1994).
2.3. Sensing emotion cues from multi-modal physiological and behavioral signals
Affective neuroscience defines affective or emotion responses as human responses in the form of distinct patterns of conscious or unconscious psycho-physiological activity (Barrett, Citation2017; Fox et al., Citation2018; Picard, Citation2000). Such activity includes changes in autonomic nervous system, facial expressions, bio-signals, and can be measured using self-report questionnaires, physiological measures (e.g., heart rate, skin conductance), and behavioral measures (e.g., facial expressions). In our study, we adopt such a definition of affective responses in line with prior in-car affect recognition studies. We capture signals from the participants’ face and eyes, as well as bio-physiological markers. To capture facial changes, existing approaches identify the regions of interest (ROIs) from thermal images of the face and head region (Ma et al., Citation2017; Paschero et al., Citation2012; Zepf et al., Citation2021). Facial action units (AU) are next identified within the Facial Action Coding System (FACS) that aid in observing changes in facial expressions (Ekman & Friesen, Citation1978). Bio-physiological signals include cardiography [e.g., electrocardiograph (ECG), heart-rate variability (HRV), heart rate (HR)], electrodermal activity, such as Galvanic Skin Response (GSR), as well as respiratory and skin temperature related signals (Zepf et al., Citation2021). These signals when captured from the driving context, contain significant noise due to car movements and so is addressed using pre-processing steps like spike removal (Singh et al., Citation2013), bandpass filtering (Munla et al., Citation2015), and normalization (between 0 and 1) to counter the effect of different baselines and physiological ranges (Singh et al., Citation2013). Work has shown that physiological signals, such as EDA and HR show higher autonomic activity during favorable driving scenarios with the opposite trend during unfavorable situations (Balconi & Bortolotti, Citation2012; Helm et al., Citation2012).
Very few works combined multiple modalities to measure drivers’ affective responses. For example, Malta et al. (Citation2008) combined EDA and Controller Area Network (CAN) behavior signals to study driver irritation; Rigas et al. (Citation2011) combined several bio-physiological signals, CAN-bus data, and the Global Positioning System (GPS) signal to study driver stress. Hoch et al. (Citation2005) and Schuller et al. (Citation2008) combined speech and face to study different sets of driver emotions. Finally, Bethge et al. (Citation2021) developed a novel application to classify drivers’ emotions based on contextual driving data and drivers’ facial expressions. While the foregoing work has focused on identifying and classifying drivers’ emotions using contextual factors, such as traffic or environmental conditions, there has been less emphasis on driver-pedestrian non-verbal interactions. Our two studies provides an initial exploration of the relationship between multi-modal physiological and behavioral signals, and pedestrian crossing actions through (a) video stimuli and (b) real-world pedestrian actions in hybrid driving simulator settings. Thereby, our combined studies provide a systematic understanding of the relationship between driver affective states and non-verbal pedestrian actions, as well as the suitability of multi-modal sensing techniques.
3. Study 1: Video stimuli
Our first lab-based study investigates participants’ affective responses toward video stimuli containing non-verbal, pedestrian crossing actions.
3.1. Study design
Our study is a 1 (IV1: Emotion Rating Task) × 2 (IV2: Pedestrian Crossing Action Video: Positive Action vs. Non-positive Action) within-subjects design, tested in a controlled, laboratory environment. Participants with driving experience watched 10 positive and non-positive videos from the JAAD dataset recorded from the driver’s perspective. These videos show pedestrians crossing the road and performing non-verbal actions toward the driver, such as hand waving, nodding, etc. (Kotseruba et al., Citation2016). The categorization of videos into positive and non-positive labels was determined by prior work that discovered that none of the JAAD videos were rated as very negative by the participants (Ghosh et al., Citation2022).
For each video, participants rated pedestrian actions for valence and arousal using the 9-point discrete Self-Assessment Manikin (SAM) (Bradley & Lang, Citation1994). During the study, participants’ facial temperatures, pupil diameter and physiological signals were recorded. Our study followed strict guidelines from our institute’s ethics and data protection committee.
3.2. Study setup
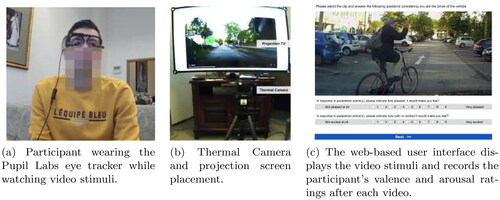
Our in-lab study setup consists of the following key components: (a) video stimuli, (b) web interface for viewing video stimuli, and (c) sensors and sensor synchronization module. Participants are presented with video stimuli through the web interface, that in turn triggers the sensors module to record participants’ physiological signals, pupil diameter, and facial temperatures. shows the setup with the web-based user interface for displaying video stimuli and recording participants’ emotion ratings.
Figure 1. Study setup with thermal camera and projection screen. Participants wear Pupil Labs eye tracker and watch the projection screen which shows the web-based user interface for viewing and rating driver-affect inducing stimuli.
3.2.1. Video stimuli
To induce different types (positive, non-positive) of emotions among participants, we draw on a validated set of JAAD dataset videos from a prior study by Ghosh et al. (Citation2022). In this prior study, 91 participants viewed 25 pedestrian action videos from a driver’s perspective and rated them for valence (pleasant) and arousal (excitement) on a 5-point scale. Ghosh et al. (Citation2022) thereby identified the top-five most positive, and bottom-five most non-positive videos, which we selected for our study. shows these 10 JAAD videos, their corresponding pedestrian action and action type along with the average valence ratings obtained in prior work by Ghosh et al. (Citation2022).
Table 1. The 10 JAAD videos used as participant (driver) emotion-inducing stimuli in this study.
3.2.2. Web-based user interface
To display the video stimuli and collect valence and arousal self-reports from participants, we developed a web-based interface (), that was projected on a 46″ television (full HD, LCD, 1920 × 1080, 100 Hz) shown in . Upon entering demographic details using the laptop mouse, participants pressed the Next button that triggers the interface to send a signal to the hardware setup to start recording data from all sensors. Given the stimuli was video only, there was no audio output.
3.2.3. Hardware setup for sensor logs
The hardware setup comprises of the FLIR Duo Pro R thermal camera,Footnote3 Empatica E4 wristband,Footnote4 and the Pupil Labs Core wearable eye trackerFootnote5 ().
The thermal camera facing the participant (without obstructing their view) is connected to a custom ESP8266 ESP-12 micro-controller, which runs the software for initiating sensor data recording. When powered, the micro-controller starts an HTTP server via WiFi, and awaits commands from the central server. The E4 wristband is connected to an Android mobile device running the EmpaticaRelay application. Once the wristband is switched on, it connects to the software running on the micro-controller, and starts a TCP server to which the central server will connect to fetch data. Finally, the eye tracker is connected to a laptop (MacBook Pro, 1.4 GHz quad core Intel i5, 16GB RAM) running the Pupil Labs Capture software. Once the tracker is connected and calibrated, the setup is complete. Thereafter, the experimenter starts the central recording application, and connects to the sensors via each specified IP address. The setup triggers recording of skin conductance, heart rate, facial temperature, and pupil diameter (PD). Additionally, since pupil diameter is also quite sensitive to light conditions, we fixed the illumination in the lab (350 ± 5 lx) to ensure that participants’ pupil would be unaffected by illumination changes (Pfleging et al., Citation2016).
3.3. Study procedure
Before the study, an explanation of the study task was provided to participants, after which participants’ informed consent was obtained. After the sensor setup was complete, participants entered their demographic (age, gender, location) and driving experience details (years of experience, country where they mostly drove) on the web interface. Upon entering their details, the sensors were synced and the first video stimuli was shown. Following prior work by Lutz et al. (Citation2008), we ensured 10 s of black screen before and after each video to decrease the effects of participants’ emotions overlapping between different videos (Lutz et al., Citation2008). After each video, participants entered their valence and arousal ratings using a 9-point discrete SAM scale (). Positive and non-positive action conditions were counterbalanced across all participants, with the subsequent trials randomized. Upon completion of the study session, a brief, semi-structured interview was conducted to gather participants’ overall impression of the study. The complete study lasted ∼60 min and participants were provided with a 10 Euro gift card for participation.
3.4. Participants
For this study, participants were required to be at least 21 years of age and have a minimum driving experience of 1 year. Participants were also required to not wear eyeglasses that may otherwise impact eye tracking. Twenty-oneFootnote6 participants (7f, 14 m) aged between 22 and 64 (M = 32.4, SD = 11.6) were recruited. Participants were recruited from academic institutes, and comprised diverse cultural backgrounds (66% European, 24% Asian, and 10% North American). 76% of participants had at least three years of driving experience in Western Europe (M = 9.8, SD = 10.7). None reported visual (including color blindness), auditory, or motor impairments.
4. Study 1: Results
In this section, we discuss data pre-processing steps undertaken and report results of participants’ affective response analysis. Specifically, we discuss: (a) variation across emotion self-reports, (b) variation across physiological signals, and (c) variation across facial temperature in different regions of the face with respect to different pedestrian action types. We also summarize the post-study feedback obtained from participants.
4.1. Data pre-processing
We performed different pre-processing steps prior to analyzing the data (resulting dataset is shown in ). These steps are described below:
Table 2. Final dataset details after pre-processing.
4.1.1. Pedestrian action segmentation from video stimuli
Given our interest in studying affective responses of participants toward pedestrian crossing actions, videos from the JAAD dataset had to be segmented to the relevant aspect of the video, i.e., the part where the pedestrian action occurred. The duration of the pedestrian actions in the videos were identified by adapting the temporal localization method which is used in activity annotation (Heilbron & Niebles, Citation2014).
Annotators (N = 7) from our institute were asked to mark the beginning start set and end set of a pedestrian action in the 10 JAAD videos. From this, K-means clustering was used and the centroid of majority clusters (clusters having most data points) for the start set and the end set were used to mark the beginning and the end of an action (Likas et al., Citation2003). To ensure validity of the annotations, and since time is on a continuous scale, we computed the intra-class correlation coefficient (ICC) for the action start and end points which are 0.997 and 0.980, respectively (Ranganathan et al., Citation2017). We used the time values to extract participants’ physiological signals corresponding to the segmented pedestrian action videos. Finally, for each pedestrian, we normalized the physiological signal values to handle inter-subject variability (Dawson et al., Citation2016; Taib et al., Citation2014). We scaled as follows:
(1)
(1)
where X is the set of values recorded for a signal across all individuals, x is one instance of the set X, min(X), max(X) indicate minimum and maximum of the set X.
4.1.2. Valence-arousal ratings transformation
Valence and arousal self-reports corresponding to each video were collected from every participant. In line with the study by Ghosh et al. (Citation2022), which revealed that no videos were rated as very negative (valence scores ≤2), valence scores were grouped into positive or non-positive categories depending on whether they were ≥3 or <3, respectively. Similarly, arousal scores were categorized as high or non-high scores (Ghosh et al., Citation2022). Following Russell’s dimensional model of emotion, positive versus non-positive valence and high versus non-high arousal relates to emotion categories mapped along the axes of valence and arousal (Russell, Citation1980).
4.1.3. Signal cleaning and sensor sampling
We streamed continuous data from the FLIR thermal camera that recorded thermal images; the wearable eye tracker which recorded pupil diameter, and Empatica wristband which recorded skin conductance in the form of galvanic skin response (GSR) and heart rate in the form of blood volume pulse (BVP). First, missing and incorrectly captured values (e.g., NaN) were removed from sensor readings (∼3% samples). Furthermore, since the signals had different sampling rates (thermal camera: 30 FPS, eye tracker: 200 Hz, wristband—GSR: 4 Hz and BVP: 64 HZ), we sampled every signal at a uniform rate of 30 Hz (corresponding to facial thermal camera). BVP was further filtered using second order Butterworth lowpass filtering and Stationary Wavelet Transform (SWT) 7th level Daubechies mother wavelet (Nason & Silverman, Citation1995). Inter-beat Interval (IBI) that represents intermittent heart rateFootnote7 was extracted from BVP and used for the analysis. The raw GSR signals were first filtered using a low-pass filter with a 2 Hz cutoff frequency to remove noise. Then, changes were calculated using the mean of the non-negative, first-order differential of GSR signals (Fleureau et al., Citation2013; Wang & Cesar, Citation2017).
4.2. Emotion self-report variation across pedestrian action videos
We first examined the variance in emotion self-report (valence, arousal) ratings (ranging from 1 to 9) across positive and non-positive pedestrian crossing action types as observed in the videos. The median valence ratings for positive and non-positive actions are 6 and 4, respectively. Since the Shapiro-Wilk test revealed that the responses did not follow a normal distribution (p < 0.05), we ran a Mann–Whitney U test to evaluate the difference in the responses from the 9-point Self-Assessment Manikin (SAM) scale. shows a significant effect of action type on valence ratings (U = 8317, Z = −6.44, p < 0.05, r = 0.44). Similarly, the median arousal ratings for the positive and non-positive actions are 5 and 6, respectively. Once again, Mann–Whitney U test revealed a significant effect of action type on the arousal ratings (U = 3023.5, Z = 5.74, p < 0.05, r = 0.40), as seen in .
Figure 2. Comparison of emotion self-report ratings across different action types present in the video: (a) valence rating (b) arousal rating. Mann–Whitney U test shows both valence and arousal self-report scores to vary significantly (p < 0.05) between two action types.
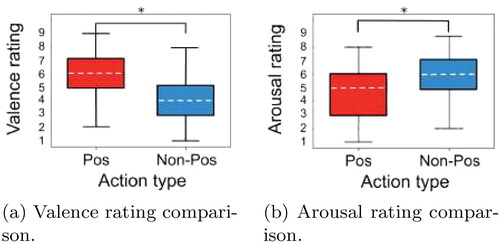
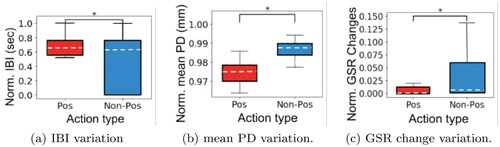
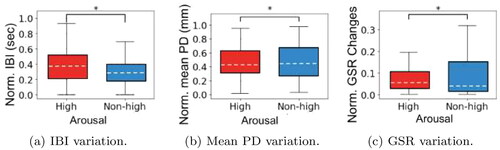
Figure 3. Variation in physiological signals for different pedestrian action types: (a) IBI variation (b) mean PD variation (c) GSR change variation. All values are found to vary significantly (p < 0.05) using Mann–Whitney U test. The plots for Mean PD and GSR changes are zoomed in to show the minute changes, however still follow the normalized range of 0.00–1.00.
To summarize, the Mann–Whitney U test shows both valence and arousal self-report scores to vary significantly (p < 0.05) between positive and non-positive two action types.
4.3. Physiological signal variation across pedestrian action videos
We next investigated the variations in IBI, mean pupil diameter (PD) and GSR changes across positive and non_positive action types. Box-plots in show these changes between two action types (as observed in the videos) for the IBI, mean PD, and GSR signals, respectively. All three signals were normalized and follow the range A Shapiro–Wilk test showed that IBI values are not normally distributed (p < 0.05).Footnote8 Despite having an equal number of positive and non-positive actions, the variability in the action duration resulted in unequal samples being collected from the two action types. As a result, we performed an unpaired Mann–Whitney U test. The median IBI (normalized) for positive and non-positive actions are 0.66 and 0.63, respectively. Here, we find a significant effect of action type on the IBI values (U = 4,031,220, Z = −4.10, p < 0.05, r = 0.05). Next, the median value of mean PD (normalized) for positive and non-positive actions are 0.97 and 0.99, respectively. We find a significant effect of action type on mean PD (U = 209,373, Z = 62.574, p < 0.05, r = 0.81). Finally, median changes in GSR are found to be 0.002 and 0.006 for positive and non-positive actions. We again observe a significant effect of action type on GSR change (U = 159,294, Z = 14.479, p < 0.05, r = 0.37).
We also compared the changes in physiological signals across two levels of self-reported valence (positive vs. non-positive) and arousal (high vs. non-high) scores. shows the IBI, mean pupil diameter (PD), and GSR changes boxplots across positive and non-positive levels of valence. Mann–Whitney’s U tests revealed a significant effect of valence level on IBI values (U = 2,485,728, r = 0.30) and GSR values (U = 6,444,711,
r = 0.09). However, we do not find a significant effect of valence level on mean PD. Similarly, shows the variance in physiological signals for high and non-high levels of arousal scores. The Mann–Whitney U test shows that arousal level has a significant effect on all three signals: IBI (U = 1,939,099,
r = 0.36), mean PD (U = 4,693,302,
r = 0.10) and GSR (U = 4,249,954,
r = 0.08).
Figure 4. Variation in physiological signals for different level of valence: (a) IBI variation (b) Mean PD (Pupil Diameter) variation (c) GSR variation. GSR and IBI values are found to vary significantly (p < 0.05) for valence using Mann–Whitney U test.
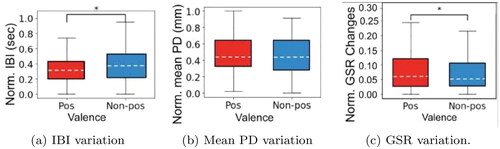
Figure 5. Variation in physiological signals for different level of arousal: (a) IBI variation (b) Mean PD (Pupil Diameter) variation (c) GSR variation. GSR, IBI and mean PD values are found to vary significantly (p < 0.05) using Mann–Whitney U test.
We see that IBI, mean PD and GSR values are found to vary significantly (p < 0.05) for different pedestrian action types using the Mann–Whitney U test. Moreover, we see variation in IBI, Mean PD and GSR for different levels of valence and arousal.
4.4. Facial temperature variation across pedestrian action videos
Facial images (frames) captured by the thermal camera were analyzed to understand variance in facial temperatures across participant self-reports (valence and arousal). For this, we extracted frame-level median values from different regions of interest (ROIs) of the face: face, mouth, nose, and cheeks (both sides). shows a representative thermal image with different ROIs tagged for a subject. We extracted and aggregated median values of ROIs [normalized and with range ] on each frame for all users. We grouped median values independently into two categories based on the self-reported values of valence (positive vs. non-positive) and arousal (high vs. non-high). Next, we examined the valence-wise and arousal-wise variation for different ROIs. A Shapiro–Wilk test revealed that median values did not follow a normal distribution (p < 0.05). The Mann–Whitney U test therefore revealed that the frame-wise median values for all ROIs vary significantly (p < 0.05) for two levels of valence () and arousal (), respectively. The summary statistics for median valence and arousal variation shown in and , respectively. Therefore, median valence variation in frame-wise ROIs for: (a) Face, (b) Nose, (c) Mouth, (d) Cheek1, and (e) Cheek2 all vary significantly (p < 0.05) across two levels of valence and arousal using Mann–Whitney U test.
Figure 6. Facial landmarks are used to automatically generate different ROIs on the face from which the thermal features are extracted.
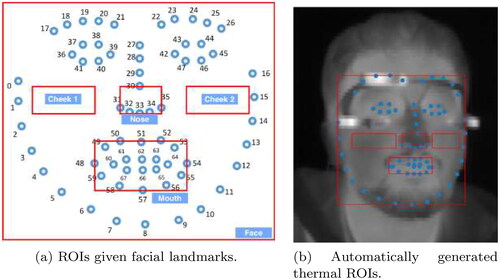
Figure 7. Median valence variation in frame-wise ROIs for: (a) face, (b) nose, (c) mouth, (d) cheek1, and (e) cheek2. All ROI frame-wise median values vary significantly (p < 0.05) across two levels of valence using Mann–Whitney U test.
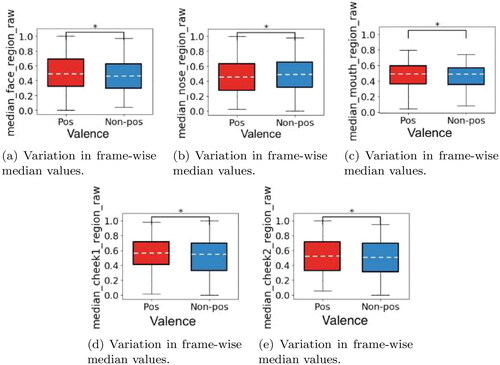
Figure 8. Median arousal variation in frame-wise ROIs for: (a) face, (b) nose, (c) mouth, (d) cheek1, and (e) cheek2. All ROI frame-wise median values vary significantly (p < 0.05) across two levels of arousal using Mann–Whitney U test.
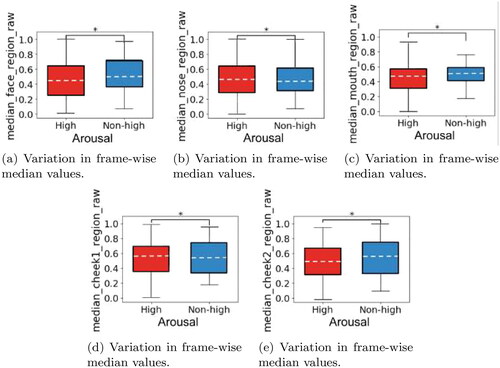
Table 3. Summary statistics for median valence variation in participants’ regions of interest (ROIs).
Table 4. Summary statistics for median arousal variation in participants’ regions of interest (ROIs).
5. Study 2: Hybrid driving simulator
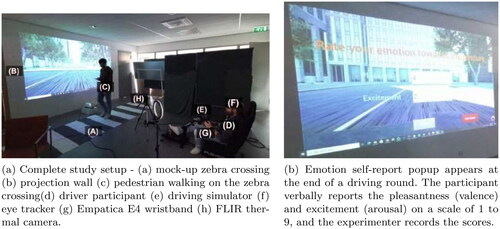
For our second study, we designed a hybrid driving simulator setup () to capture driving context and realistic driver-pedestrian interactions during non-verbal pedestrian road crossing scenarios. The hybrid nature of the setup is achieved by combining a simulated driving environment with real-life confederate pedestrians. During the experiment, participants drive a car using a driving simulator and view the road environment on a projected screen. They interact with a confederate pedestrian who walks across a mock zebra crossing placed in front of the screen and performs non-verbal actions toward the participant.
Figure 9. Study setup for the hybrid driving simulator study that combines a simulated driving environment with real world pedestrians. In this hybrid setup, the participant drives a car using a driving simulator. The participant views the road environment on the projected screen while interacting with a confederate pedestrian who walks across a mock-up zebra crossing placed before the screen.
5.1. Study design
Our study follows a 3 (IV1: Pedestrian Action: Positive vs. Non-positive vs. None) × 2 (IV2: Urgency: Urgent vs. Non-urgent) × 2 (IV3: Pedestrian Visibility at Crossing: Visible vs. Hidden) within-subject study design. The hybrid simulator setup comprises of a mock-up zebra crossing placed in front of a driving simulator. Participants with driving experience (drivers) drove in the driving simulator, and encountered pedestrian confederates who performed non-verbal actions toward the drivers while using the zebra crossing. We had three positive actions, and three non-positive actions. To lower the predictability of the driving setup, two additional conditions were introduced: Urgency and Visibility. The two types of urgency conditions were—(a) Urgent where the driver needs to complete the track within 60 s, a duration that was empirically determined to be suitable for our study setup (b) Non-urgent where the driver has no time limit. The two scenarios for the pedestrian’s visibility are—(a) Seen where the pedestrian is waiting at the zebra crossing and visible to the driver from a distance, (b) Not seen where the pedestrian appears in the driver’s field of view only when the driver is close to the virtual zebra crossing.
During the study, the participant always drove from a starting point to an end point along a pre-designed route (trial). To simulate a real-world crossing, a zebra crossing was also placed on the route (). The study consisted of two sessions, where a session has either urgent or non-urgent trials. As a result, there are 6 (number of) × 2 (pedestrian’s visibility at the zebra crossing) = 12 trials in every session. To further account for any familiarity effects of the pedestrian actions on the driver, we also included four no_action trials randomly within every session, where no interaction between the driver and pedestrian occurs. Therefore, there are 16 trials (12 action trials and four no-action trials) in every session. The order of the trials is randomized within a session. In all cases, the participant is prompted to report their emotion with respect to the pedestrian’s action at the end of the trial. The self-report popup is shown in . At this point, the simulator pauses and the participant verbally reports the valence and arousal scores on a 9-point discrete Self-Assessment Manikin (SAM) scale (Bradley & Lang, Citation1994). As soon as these values are recorded, the next trial begins. Once all the trials in a session are completed, the experimenter terminates the session by clicking on the Exit Game button of the self-report screen (). This stops recording data from all the devices. During the study, participants’ facial expressions, temperatures, pupil diameter and physiological signals were recorded. shows the study setup.
5.1.1. Stimuli
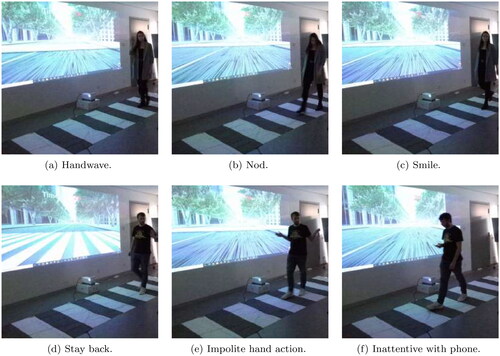
Non-verbal pedestrian crossing actions were selected based on our visual stimuli-based lab study (c.f., Section 3), as well as prior works (Ghosh et al., Citation2022; Kotseruba et al., Citation2016; Yang, Citation2017). The choice of which actions to perform were empirically determined, and constrained by how visible they were to participants, and how reproducible they could be performed by our confederates. Pedestrians in our study performed positive and non-positive actions, where positive actions include handwave, smile, and nod, and non-positive actions include stay_back, impolite_hand_action, inattentive_with_phone. shows a representation of these actions.
Figure 10. Representation of all the six actions as performed during the study. The first three actions (a–c) are considered as positive, while the next three actions (d–f) are considered non-positive.
5.2. Hardware and software
Our complete study setup is shown in and consists of (a) Gaming environment and, (b) Sensor setup for physiological and thermal imaging recording.
5.2.1. Gaming environment
We developed the gaming environment based on Unreal EngineFootnote9 and deployed it on Microsoft Airsim.Footnote10 The gaming environment provides Unity-objects to enable driving in a city-like environment. It consists of a road segment with a pedestrian crossing object, where the driver-pedestrian interaction happens (based on the experimental condition). The gaming environment makes a TCP connection to connect the sensors module. At the start of the game, this connection is established, which is maintained throughout the session. The gaming module also implements a timer-based functionality to implement the urgency condition by displaying the elapsed time since starting the trial.
5.2.2. Integrating sensors module
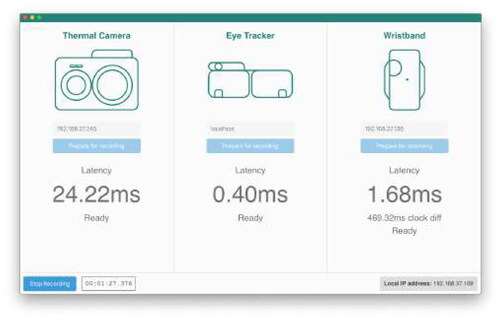
A sensor synchronization application () was developed to start and stop recording participants’ data by syncing the FLIR Thermal Camera wirelessly through a custom WiFi-connected board, a Pupil Labs eye tracker via ZeroMQ and an Empatica E4 wristband connected to a phone via an Android app. This synchronization module connects with the gaming environment as soon as the signal is sent from the gaming environment. The thermal camera connected to a custom ESP8266 ESP-12 micro-controller starts an HTTP server via WiFi. The E4 wristband connected to an Android mobile device running the EmpaticaRelay application, connects to the software running on the micro-controller, and starts a TCP server to which the central server will connect to fetch data. Finally, the eye tracker connected to a laptop (MacBook Pro, 1.4 GHz quad core Intel i5, 16GB RAM) runs the Pupil Labs Capture software. In this manner, at the beginning of every trial (in the gaming environment) all the sensors are synced. The video data is stored on the camera; and eye tracker data and physiological signals are recorded on the machine running the Unreal Engine. Additionally, we fixed and monitored illumination (350 ± 5 lx) near the participant’s face by using an LED ring light (to prevent interference with participant’s facial temperature) and a luminance level lamp (Pfleging et al., Citation2016).
Figure 11. Sensor synchronization application for simultaneously starting and stopping recording of the FLIR thermal camera, Pupil Labs eye tracker and Empatica E4.
5.3. Study procedure
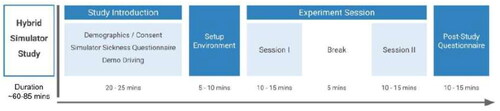
We depict the study procedure in . Participants were introduced to the study, after which we obtained participant consent, demographic details and participant responses to a pre-study simulator questionnaire (SSQ). A demo driving session was provided to familiarize participants with the driving environment. Participants were asked to wear the Empatica E4 wristband (on a non-dominant hand), and the eye tracker. The thermal camera, Microsoft Kinekt camera were also turned on and synced using the sensor synchronization application. At the end of this setup, the first driving session (Session I in ) was initiated, triggering recording of data from all the devices (Empatica wristband, eye tracker, dual camera). In every trial, participants drove on the given track and encountered a pedestrian (except during no_action trials) at the zebra crossing. The pedestrian performed a non-verbal action while crossing the zebra crossing. After crossing, the participant resumed driving till they reached the end of the track whereby participants were prompted for their emotion self-report. The emotion (valence, arousal) ratings were collected on a 9-point Self-Assessment Manikin (SAM) scale (Bradley & Lang, Citation1994). The second session (Session II as highlighted in ) began after a 5 min break upon completion of the first session. The session was identical to Session I, with the exception of the urgency condition. To counter the participant’s bias for a specific urgency condition, Session I and Session II were counterbalanced across participants. At the end of Session II, participants filled out the simulator sickness questionnaire (SSQ), and underwent a brief exit interview, which concluded the study. During the study, COVID-19 safety protocols were followed at all times. The pedestrians did not wear a face mask (given the need to enact actions, such as smiling), so maintained the minimum distance with the participant (>6 ft). All the devices and surfaces were sanitized in between each participant. The complete study lasted ∼60–90 min, and due to the variable study length, participants were provided with a 20 Euro monetary compensation for participation. Our study followed strict guidelines from our institute’s ethics and data protection committee.
Figure 12. Study procedure for the hybrid simulator study that lasted between 65 and 85 min.
5.3.1. Participants
For this study, participants were required to be at least 21 years of age and have a minimum driving experience of at least 5 years in Western Europe (M = 17.7, SD = 10.8). Participants were also required to not wear eyeglasses that may otherwise impact eye tracking. Twenty-fourFootnote11 participants (12f, 12 m) aged between 23 and 64 (M = 37.9, SD = 11.6) were recruited. Participants were recruited through a recruitment agency, and all resided in Europe. None reported visual (including color blindness), auditory, or motor impairments. Additionally, we recruited two experiment confederates (33 year old male; 23 year old female) to act as pedestrians to enact non-verbal crossing actions. Both confederates underwent training sessions to ensure that the performed actions were identical. To avoid any potential effects from interacting with a male/female pedestrian, half of the driving participants observed positive actions from the male pedestrian confederate, while the other half encountered positive actions from the female pedestrian confederate.
6. Study 2: Results
We report our analysis of participants’ (drivers) affective responses from the hybrid simulator study. We first explain the data pre-processing steps undertaken and thereafter discuss: (a) emotion self-report analysis, (b) physiological signal analysis, (c) facial data analysis, and (d) driving behavior analysis. Our study had driving conditions of urgency and pedestrian visibility, however these showed no significant results, and therefore omitted from subsequent analyses.
6.1. Data pre-processing
The Empatica wristband recorded participants’ signals in the form of galvanic skin responses (GSR), and blood volume pulse (BVP). Additionally, we streamed continuous data in the form of thermal and RGB images from the FLIR camera and recorded pupil diameter from the wearable eye tracker. This data underwent several pre-processing steps prior to analysis and the resulting dataset is summarized in . The data pre-processing steps are described below:
Table 5. Final dataset details from the hybrid simulator study.
6.1.1. Before and during driver-pedestrian interactions
To identify participant signals associated with the pedestrian crossing actions, before-action and during-action segments were defined. We empirically defined before-action to be 10 s prior to when the pedestrian started crossing, where we chose to accommodate this larger window as it allowed us to capture the driving state prior to the participant witnessing a pedestrian. For during-action, we defined this as the period from when the pedestrian started crossing the road until the self-report prompt appeared on the screen. This allowed us to focus on the action itself, where some actions are shorter in duration (e.g., nod, impolite hand action) than others (e.g., smile, inattentive with phone).
6.1.2. Valence-arousal ratings transformation
Valence and arousal self-reports corresponding to each pedestrian interaction were collected from every participant. Following the approach by Ghosh et al. (Citation2022), we grouped valence scores into positive or non-positive categories depending on whether they were ≥3 or <3, respectively. Similarly, arousal scores were categorized as high or non-high scores.
6.1.3. Signal cleaning and sensor sampling
First, missing and incorrectly captured values (e.g., NaN) were removed from all sensor readings (∼7% samples). Given the different sampling rates across signals (thermal camera: 30 FPS, eye tracker: 200 Hz, wristband—GSR: 4 Hz and BVP: 64 Hz), all signals were sampled at a uniform rate of 30 Hz (corresponding to the thermal camera). Physiological signals captured by the Empatica included blood volume pulse (BVP) and galvanic skin response (GSR). BVP was filtered using second order Butterworth lowpass technique, and Stationary Wavelet Transform (SWT) 7th level Daubechies mother wavelet (Nason & Silverman, Citation1995). Inter-beat Interval (IBI) that represents intermittent heart rate,Footnote12 and heart beats per minute (BPM) were extracted from BVP and used for the analysis. GSR signals were also filtered using a second order Butterworth lowpass technique with a 2 Hz cutoff frequency to remove noise. Then, changes were calculated using the mean of the non-negative, first-order differential of GSR signals (Fleureau et al., Citation2013; Wang & Cesar, Citation2017).
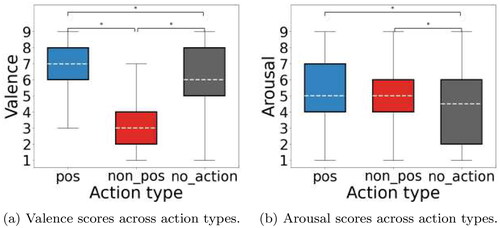
6.2. Emotion self-report variation across action types
We first examined the effect of positive, non-positive, and no-action types on self-reported driver valence and arousal scores (ranging from 1 to 9). shows self-reported valence scores grouped by the three action types and compared using Kruskal Wallis test. The Kruskal Wallis test revealed a significant effect of action type on valence self-reports []. Following Zimasa et al. (Citation2019), a post-hoc Mann–Whitney test with Bonferroni correction also showed significant differences between every pair of action types—pos and non_pos (
), non_pos and no_action (
), and pos and no_action (
). Likewise, shows the analysis for arousal scores where Kruskal Wallis test revealed a significant effect of action type on arousal self-reports [
]. A post-hoc test using Mann–Whitney with Bonferroni correction showed significant differences between action type pairs—non_pos and no_action (
), and pos and no_action (
). Therefore, valence self-report analysis showed significant (p < 0.05) effect of action type between all three action pairs, while arousal analysis revealed significant (p < 0.05) effect of action type between positive and no-action pairs.
Figure 13. Action-type wise emotion self-report variation for (a) valence score comparison reveals a significant effect of action type between all action pairs. (b) Arousal score comparison reveals a significant effect of action type between (non_pos and no_action), (pos and no_action).
6.3. Physiological response variation across action types
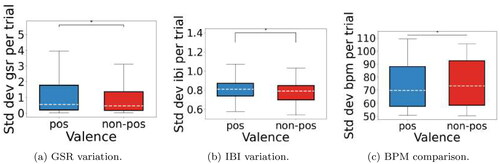
Following prior work that studied driver affect in driving simulators, skin conductance (GSR), heart data (BVP, BPM, and IBI), and pupil diameter (mean PD) were analyzed for their variation in standard deviation (Hu et al., Citation2018; Magaña et al., Citation2020). This is in contrast to examining normalized, mean values in our earlier video-stimuli study. This was conducted across the three action types—pos, non-pos, no-action. The Shapiro–Wilk test revealed a non-normal distribution for all signals (p < 0.05), upon which Kruskal Wallis tests showed that the three action types had no significant effect (p < 0.05) on GSR, BVP, BPM, IBI, and mean PD values. Physiological signals were also analyzed for changes corresponding to participants’ self-reported valence and arousal scores. Non-normalized GSR ranging from (0, 5), IBI from (0.6, 1.1), BPM from (50, 110) and mean PD from (4.9, 5.34). shows the variation of the standard deviation of signals across positive and non-positive levels of valence ratings. Since the Shapiro–Wilk test indicated a non-normal distribution (p < 0.05), the Mann–Whitney’s U tests showed a significant effect (p < 0.05) of action type on GSR values (U = 57,891, p < 0.001, r = 0.09), IBI values (U = 56,477, p < 0.001, r = 0.21) and BPM values (U = 55,512, p < 0.001, r = 0.32) only.
Figure 14. Mann–Whitney’s U test shows significant variation (p < 0.05) in the standard deviation of physiological signals across two levels of valence for (a) GSR, (b) IBI, and (c) BPM.
Likewise, shows the variance in the standard deviation of physiological signals for high and non-high levels of arousal scores. Mann–Whitney’s U test indicated that the two levels of arousal scores have a significant effect on IBI (U = 56,522, p < 0.05, r = 0.24), BPM (U = 55,512, p < 0.001, r = 0.32) and mean PD (U = 99,123, p < 0.001, r = 0.41).
Figure 15. Signal variation in standard deviation across two levels of self-reported arousal scores for (a) IBI, (b) BPM, and (c) mean PD. We observe a significant (p < 0.05) effect of self-reported arousal on IBI, BPM, and mean PD.
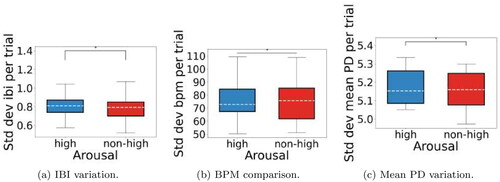
Therefore, we observe significant variation (p < 0.05) in standard deviation of physiological signals across two levels of valence for GSR, IBI and BPM signals. On the other hand, IBI, BPM, and mean PD show significant (p < 0.05) variance in standard deviation for two levels of arousal.
6.4. Facial analysis
The FLIR camera gathered thermal and RGB videos of participants from which we analyzed (a) the dispersion of the combined thermal facial landmarks (mouth, nose, both cheeks, and face) across time, and (b) the facial action units corresponding to facial expressions. Given the more realistic participant-pedestrian interactions within the hybrid simulator study (compared with watching video stimuli), we proceeded to analyze facial action units (FAUs). FAUs in such contexts can better capture subtle and micro facial changes, which are more likely to be elicited as a result of participant-pedestrian interactions within a controlled, lab-based experiment where persons interacts in a face-to-face manner (Ihme et al., Citation2018; Zhi et al., Citation2020). We examined the change in participants’ facial expressions before (before action) and during observing the pedestrian crossing action (during action). This analysis was performed across the three action types—(pos, non_pos, and no_action). Finally, we analyze variation in facial landmarks and expressions corresponding to participants self-reported valence and arousal scores.
6.4.1. Thermal facial landmarks analysis
We used thermal data to identify salient points known as facial landmarks on participants’ faces using Openface (Zadeh et al., Citation2017). From these, we extracted hand-crafted features by measuring the mobility of the face to different stimuli, i.e., different pedestrian crossing actions (Masip et al., Citation2014). Following Masip et al. (Citation2014), for a video composed of N frames f1… fN, the center of each frame fi is defined as the average x and y coordinates of the 66 landmarks appearing in fi. The dispersion of fi is defined to be the average distance of the 66 landmarks to the center. We computed the standard deviation of the dispersion of all the landmarks in frames f1… fN, and the difference between the maximum and minimum dispersions manifested in the frames f1… fN.
shows the comparison for the standard deviation values of the max-min and standard deviation of the dispersion values of all the landmarks. For both measures, a Shapiro–Wilk test revealed the underlying distribution to be non-normal (p < 0.05). Given that the data is paired and from the same modality, we carried out a Wilcoxon signed-rank test. For the standard deviation of the max-min measure, we found significant differences for pos (), non_pos (
), and no_action (
). Also, the standard deviation of the standard deviation of the dispersion showed significant differences for pos (
), non_pos (
), and no_action (
). Finally, we examined variation in facial landmarks corresponding to participants’ self-reported valence and arousal scores. Here, we found no significant differences in facial landmarks for two levels of valence (pos and non-pos) and arousal (high and non-high) scores.
Figure 16. Comparison of the STD values for the dispersion of the facial landmarks across frames before and during the interaction with the pedestrian for all the trials.
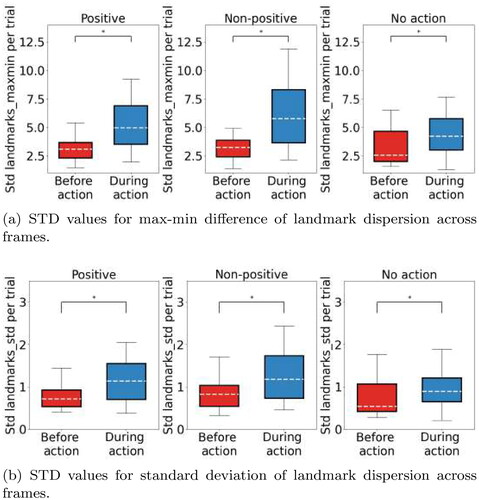
We therefore see significant differences (p < 0.05) in the standard deviation values for the dispersion of the facial landmarks across frames before and during the interaction with the pedestrian for all the trials.
6.4.2. Facial expressions analysis
We analyzed RGB data gathered by the FLIR camera using the Facial Action Coding System (FACS), which defines a set of facial muscle movements corresponding to an emotion (Clark et al., Citation2020). Changes in facial expressions of participants were recorded using degree of activation (0–5) of the facial action units (AU) across time, to identify differences between the data recorded before the driver-pedestrian interaction (before action), and the data from the moment the pedestrian is visible to the driver until the self-report prompt (during action) (Ekman & Friesen, Citation1978). We compared the facial data across different action types—(pos, non_pos, and no_action) and computed the standard deviation values for each segment of time for each AU (Ihme et al., Citation2018). In all three cases (action types), a Shapiro–Wilk test revealed non-normal data distribution (). A Wilcoxon signed-rank test was instead used since data is paired and from the same modality. We found eight significant differences for positive trials, 14 for non-positive, and five for no-action trials, which are reported in Appendix Section A, , respectively. We also examined the changes in facial expressions of participants corresponding to self-reported valence and arousal scores. As the Shapiro–Wilk test revealed non-normal data distribution (p < 0.05), the Mann–Whitney U Test indicated that there was a significant effect of self-reported arousal scores on AU06 indicative of raised cheeks (
). Our FACS analysis revealed eight significant (
) differences for positive trials, 14 for non-positive, and five for no-action trials reported in Appendix Section A.
6.5. Driving behavior analysis
The car driving simulator developed using AirSimFootnote13 recorded participants’ speed (m/s) and braking behavior (0 indicating no brake to 1 indicating full brake). Kinematic quantities of position, orientation and linear velocity were recorded using the North East Down (NED) coordinate system. The car controls were set to automatic driving, and the positions and orientations were aligned as per the location of the road segment provided within the city environment. We analyzed the driving behavior of participants with respect to the three pedestrian action types (pos, non_pos, no_action). Particularly, we investigated the change in mean velocity (m/s) and braking behavior of the participants after encountering different actions (Zhao et al., Citation2021). This is because driving velocity and braking have been shown to serve as reliable indicators for identifying a range of driver emotions (Roidl et al., Citation2014; Schmidt-Daffy, Citation2012). The mean velocity (m/s) for the three action types are—pos: 12.80 m/s, non-pos: 13.10 m/s, no-action: 12.50 m/s and the standard deviations of velocity are—pos: 1.8 m/s, non-pos: 1.89 m/s, no-action: 1.78 m/s. The mean braking (0–1) for the three action types are—pos: 0.71, non-pos: 0.68, no-action: 0.74 and the standard deviations of braking (0–1) are—pos: 0.20, non-pos: 0.21, no-action: 0.17. summarizes the mean velocity and brake across the three action types.
Figure 17. Comparing trial-wise driving behavior parameters across action types—(a) mean velocity (for trials) across action types and (b) mean braking across action types.
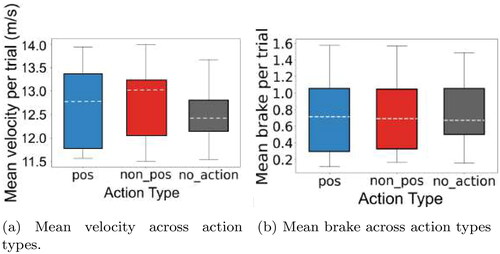
Using the Kruskal Wallis test, we found that the mean trial-wise velocity [] and mean trial-wise braking responses [
] do not vary significantly across different pedestrian action types. The results indicate that the pedestrian actions in the study did not influence simulator driving behavior (speed and braking).
7. Discussion
In this section, we discuss the key findings from our video-based study and the hybrid simulator study. We highlight future steps to be undertaken to address limitations in our work.
7.1. Key findings
To validate whether positive and non-positive pedestrian crossing actions can impact driver emotions, we conducted two systematic in-lab studies. First, we designed an exploratory, in-lab setup using a combination of thermal, physiological and eye tracking sensors to record participants’ affective states in response to non-verbal, pedestrian crossing videos from the JAAD dataset (cf. Section 3.2.1). Our in-lab study showed the influence of non-verbal, pedestrian actions on participants’ physiological responses, facial temperature as well as emotion self-reports: (a) First, we observe that participants’ self-reported emotions vary across positive and non-positive pedestrian crossing actions (). Positive, non-verbal actions (as shown in the videos) elicit higher valence ratings, whereas non-positive actions (as shown in the videos) elicit higher excitement. (b) We observe that physiological signals (IBI, mean PD, and GSR) vary significantly for positive versus non-positive pedestrian actions (). Furthermore, different levels of valence (positive, non-positive) are influenced by pedestrian action types (positive, non-positive) for IBI and GSR signals; while different levels of arousal (high, non-high) are influenced by pedestrian action type (positive, non-positive) for all signals. (c) Similarly, we find variation in facial temperatures across different emotion self-reports. Median values observed at different ROIs (face, mouth, nose, cheeks) of the thermal images are found to vary significantly between different types of actions and valence and arousal self-reports.
Motivated by the results from our exploratory study, we next designed a hybrid study encompassing real world pedestrians and a driving simulator to observe affective responses of drivers toward non-verbal pedestrian crossing actions. Our analysis showed significant influence of non-verbal, pedestrian crossing actions on drivers self-reported emotion scores, physiological responses, and facial expressions: (a) Participants’ valence self-reports vary significantly across positive, non-positive and no-action pairs, and participants’ arousal self-reports vary across positive and no-action and, non-positive and no-action type pairs (). Particularly, we found that participants’ reported higher valence scores upon observing positive, non-verbal crossing actions and lower valence scores for non-positive, crossing actions. (b) Participants’ skin conductance (GSR), heart data (IBI, BVP and BPM), pupil diameter (mean PD) showed no significant variance in standard deviation across different non-verbal pedestrian crossing action types. However, when grouped by positive and non-positive levels of self-reported valence scores, we find that participants skin conductance (GSR), IBI and BPM vary significantly (). Likewise, IBI, BPM and pupil diameter (mean PD) were found to vary significantly across high and non-high levels of arousal (). (c) Facial landmarks analysis revealed significant variation in the standard deviation of dispersion of facial landmarks upon observing positive, non-positive and no-action types (). Facial action units (FAUs) analysis revealed significant changes in participants’ eyelid movements (lid raising, tightening and blinking), nose wrinkling, chin raising, and lips movements (pulling, stretching and tightening) upon observing positive actions (c.f., ). Next, participants’ eyebrows (inner and outer eyebrow raising), eyelids (lid raising, tightening and blinking), cheeks (raising and dimpling), nose wrinkling, chin raising, jaw dropping and lip movements (pulling, stretching, tightening, and parting) all changed significantly upon observing non-positive pedestrian actions (c.f., ). Moreover, participants’ eyebrows and lips also changed significantly in trials where no pedestrians crossed the road (c.f., ). These could be attributed to stray expressions arising from not observing a pedestrian cross the road. Finally, (d) Driving behavior analysis showed no significant influence of the different types of pedestrian actions on the driving speed and braking behavior during trials.
7.2. Implications
Results from our two studies have implications for automatic, in-vehicle driver emotion detection and recognition that use machine learning models to infer driver emotion states using behavioral and bio-physiological signals.
First, our studies contribute a set of affect inducing stimuli in the form of videos and enacted road crossing actions. Our in-lab study validated the suitability of the selected 10 JAAD videos (Ghosh et al., Citation2022), and our hybrid study demonstrated the effectiveness of enacted, non-verbal road crossing actions. These two types of stimuli (video and enacted) can be used across future studies for eliciting driver affect. Furthermore, our novel hybrid simulator setup demonstrated suitability in capturing participants’ affective responses to pedestrian crossing actions, and can serve as an extensible platform for future experimentation through the inclusion of additional sensors. Second, our studies enabled identifying suitable driver affective cues (IBI, GSR, mean PD, and facial expressions) and how they pertain to driver-pedestrian interactions, which can aid researchers in selecting the appropriate sensing modality for detecting emotion signals related to non-verbal, pedestrian crossing actions. The hybrid driving study analysis particularly demonstrated that facial expressions varied significantly based on the observed positive and non-positive pedestrian actions. Non-positive interactions in particular generated the most changes in facial attributes of drivers. These cues can facilitate the development of (supervised) machine learning models for automatic emotion recognition and subsequent emotion-regulation.
Third, both studies also demonstrated the influence of non-positive, pedestrian crossing actions on participants. Participants reported higher arousal upon viewing non-positive road crossing videos in the first lab study, and also showed significant changes in facial expressions upon observing enacted non-positive road crossing actions in the hybrid study. These pedestrian crossing actions can thereby aid in identification of potential on-road factors that may elicit risky driving behavior (Braun et al., Citation2022; Sani et al., Citation2017), which has implications for ensuring driver safety.
7.2.1. Toward just-in-time interventions using physiological and camera sensors for emotion regulation
We observed significant variation in participants’ physiological signals and facial expressions upon observing pedestrian crossing actions (both in videos and enacted). However, the extent to which such signals are robust enough to provide just-in-time interventions, necessary for an empathic vehicle that can facilitate drivers to self-regulate their emotion in-situ remains an open question (Braun et al., Citation2022). Our results provide a first step toward the development of machine learning models that can leverage such physiological signals and facial cues for automatic emotion recognition. In a self-regulation context, this can become a binary classification task (e.g., real-time stress detection (Healey & Picard, Citation2005)) during encounters with such pedestrian actions, which can aid subsequent emotion-regulation.
Furthermore, in a real-world driving context, expecting drivers to provide self-reports across different intervals is impractical. While our study necessitated the need for establishing a ground truth to investigate if such effects exist in the first place, real-world contexts would benefit from considering other sensing modalities, including camera-based sensors, positioning sensors (e.g., GPS), mapping data [e.g., open street maps (Haklay & Weber, Citation2008)], and driving characteristics (e.g., average speed, road type, CAN bus data, etc.) (Koch et al., Citation2021). Cameras in the vehicle allow detecting not only driver facial expressions (which can support the task of automatically identifying in situ emotion expressions), but may also be used for remote physiological marker detection [using, e.g., remote Photoplethyography (rPPG) (Wu et al., Citation2017) to automatically estimate heart rate]. To circumvent the need for widely annotated datasets and extract useful end-to-end features, self-supervised feature learning techniques (Sarkar & Etemad, Citation2020) can be leveraged to make predictions based on the current physiological state of a driver, given the traffic encounter they find themselves in. The specific context of pedestrian crossings would be inferred using a combination of positioning and mapping data. However, physiological signals, such as GSR require contact-based wearable sensors, and in-situ facial expressions analysis require placement of cameras that may be found invasive and obtrusive. These factor may limit the scaling of our approach, and therefore needs greater consideration in terms of real-world feasibility.
Lastly, we caution that our findings do not necessarily factor in all societal and cultural aspects. In developed nations, driver-pedestrian interactions are structured and driven by traffic laws, such as yielding at a pedestrian crossing (Arhin et al., Citation2022). However, this may differ across other countries and cultures where the traffic laws are less structured and/or followed (Ranasinghe et al., Citation2020; Weber et al., Citation2019). For example, crossing a road at places other than the designated crosswalks (so-called “jaywalking”) can commonly occur in certain countries (e.g., South Asia) (Ranasinghe et al., Citation2020). This can result in variation in the affective response of the driver based on the condition where she is used to driving. Therefore, while just-in-time emotion regulation is necessary to ensure driver safety during such interactions, we believe it is essential to consider the cultural and societal aspects for actual deployment of such technology.
7.3. Limitations and future work
There were three challenges that emerged from our studies: First, our studies lack ecological validity as they were conducted in controlled, laboratory setups with limited, controlled driver-pedestrian interactions unlike real world scenarios (e.g., multiple pedestrians concurrently crossing, unpredictable pedestrian behaviors, etc.) This was particularly noted in the hybrid simulator whereby we saw no clear differences between participants’ low and high arousal states resulting from positive and non-positive actions. This was further visible in participants’ physiological signals, which also showed no significant differences (Shi et al., Citation2007; Wang et al., Citation2018). Likewise, while driving conditions of urgency and visibility are known to impact driver emotions and risky driving (Chou et al., Citation2007; Megías et al., Citation2011), we did not find any significant differences in the hybrid simulator study. Moreover, such differences were also not reflected in the driving behaviors analysis, which showed no significant changes in mean velocity and braking. These results could be attributed to the in-lab, controlled nature of the experiment, where driving in a simulator may not have been realistic enough to impart a true sense of urgency and risk traits typically associated with such driving conditions.
Second, the nature of the stimuli (videos and enacted actions) across both studies was unlike real-world driving scenarios. Watching videos of pedestrian road crossing actions may not be considered representative of real-world driver-pedestrian interactions. Moreover, our hybrid simulator study with real-world pedestrian confederates involved a single pedestrian crossing, and them performing a fixed set of non-verbal actions which required extensive training beforehand. This is unlike real-world scenarios that include unpredictable pedestrian behavior, on-road obstructions, and erratic (depending on the city) weather and traffic conditions. However, as an initial step toward understanding driver-pedestrian interactions using multimodal data, examining a single pedestrian crossing and performing an action was required for isolating the impact of the types of pedestrian actions on different driver affective states. To this end, future work could extend this hybrid setup framework by including a greater diversity of pedestrian actions, and further diversifying and increasing the number of acting pedestrian confederates.
Lastly, while we showed that self-reported valence and arousal levels vary according to positive and non-positive actions observed (both in videos and enacted), we cannot make further inferences regarding the exact emotions drivers may experience in real world. For example, inferring that low valence and high arousal relates to general aggressive driving (cf., Sani et al., Citation2017) versus a specific situation that elicited such states, would be erroneous. Such inferences would require considering other sensed data, including scene understanding, driving characteristics (e.g., from CAN bus data), and positioning and mapping data. Nevertheless, even with a combined sensing approach, we believe that for any automated emotion regulation intervention stemming from an empathic car, the interaction may still require a final verification from the user to avoid any false positives, which subsequently helps build more robust self-report emotion annotations.
8. Conclusion
Inferring driver affective states during non-verbal driver-pedestrian interactions is key for developing empathic, in-car interfaces. This is especially so given that positive, implicit communication between drivers and pedestrians are known to influence driving behavior. In our exploratory work, we investigated the impact of non-verbal, pedestrian crossing actions on drivers’ affective states by means of two controlled, in-lab studies. We first observed the impact of pedestrian non-verbal crossing action videos from the JAAD dataset on participants’ (N = 21) affective states (emotion self-reports, physiological responses and facial temperatures). We then investigated the variation in drivers’(N = 24) affective responses (emotion self-reports, physiological responses, and facial landmarks) with respect to enacted pedestrian crossing actions in a hybrid driving simulator setup. Both studies revealed the influence of pedestrian non-verbal crossing actions (presented as video stimuli and enacted by confederates) on participants’ valence and arousal self-reports. Participants’ reported higher valence scores upon observing positive, non-verbal crossing actions and lower valence scores for non-positive, crossing actions. Moreover, participants reported higher arousal from watching positive and non-positive pedestrian crossing action videos, with changes in participants’ mean pupil diameter (mean PD), skin conductance (GSR) and facial temperatures (across face, mouth, nose, and cheeks). Additionally drivers’ facial landmarks (eyelid, cheeks, nose, and lip movements) were significantly affected upon observing enacted pedestrian actions. Our combined studies empirically validate a suitable set of pedestrian non-verbal crossing actions, first depicted in video stimuli and then enacted by pedestrians. As a result, our work provides the basis for developing automatic, in-car empathic interfaces for helping regulate driver-pedestrian affective interactions. We furthermore introduced a novel hybrid setup to capture driver affective states based on non-verbal pedestrian crossing actions can aid in the development of in-vehicle empathic interfaces. These interfaces may be used in conjunction with real-time emotion recognition systems that can infer drivers’ affective states (based on observed pedestrian actions), which can support “just-in-time” driver emotion regulation for improved road safety.
Disclosure statement
No potential conflict of interest was reported by the author(s).
Additional information
Notes on contributors
Shruti Rao
Shruti Rao is a first year PhD candidate at the University of Amsterdam with interests in Affective Computing, and HCI. Presently, for her PhD, she is interested in designing smart, empathic buildings that can understand and interact with occupants to enhance their experiences of comfort and emotional well-being.
Surjya Ghosh
Surjya Ghosh is an assistant professor in the Department of Computer Science and Information Systems at BITS Pilani K. K. Birla Goa. His research interests lie in the areas of Human–Computer Interaction, Applied AI, Affective Computing, and Computer Systems.
Gerard Pons Rodriguez
Gerard Pons Rodriguez is a Computer Vision and Machine Learning Engineer at Bright River, Amsterdam. Prior to this, he worked as a Postdoctoral Research Scientist at the Centrum Wiskunde & Informatica (CWI) where he worked on affective computing and computer vision.
Thomas Röggla
Thomas Röggla is a Scientific Software Developer at Centrum Wiskunde & Informatica (CWI) with a degree in Distributed Computing from VU Amsterdam. He has contributed to several EU-funded research projects and worked with international project partners from industry in fields, such as affective computing, human-centered media and technology-supported media production.
Pablo Cesar
Pablo Cesar leads the Distributed & Interactive Systems (DIS: https://www.dis.cwi.nl) Group at Centrum Wiskunde & Informatica (CWI) and is Professor with TU Delft, The Netherlands. He has received the prestigious 2020 Netherlands Prize for ICT Research because of his work on human-centered multimedia systems. Website: https://www.pablocesar.me
Abdallah El Ali
Abdallah El Ali is a research scientist in Human Computer Interactions at Centrum Wiskunde & Informatica (CWI) in Amsterdam, within the Distributed & Interactive Systems group. He leads the research area on Affective Interactive Systems. He is also on the executive board for CHI Nederland (https://chinederland.nl/). Website: https://abdoelali.com
Notes
6 For effect size f = 0.25 under α = 0.05 and power (1-β) = 0.95, with 10 repeated measurements within factors, we need 20 participants.
8 We have the same finding for mean PD and GSR changes.
11 For effect size f = 0.25 under α = 0.05 and power (1-β) = 0.95, with 32 measurements within factors, we need 10 participants.
References
- Arhin, S. A., Gatiba, A., Anderson, M., Manandhar, B., Ribbisso, M., & Acheampong, E. (2022). Effectiveness of modified pedestrian crossing signs in an urban area. Journal of Traffic and Transportation Engineering (English Edition), 9(1), 21–32. https://doi.org/10.1016/j.jtte.2021.04.001
- Balconi, M., & Bortolotti, A. (2012). Empathy in cooperative versus non-cooperative situations: The contribution of self-report measures and autonomic responses. Applied Psychophysiology and Biofeedback, 37(3), 161–169. https://doi.org/10.1007/s10484-012-9188-z
- Barrett, L. F. (2017). The theory of constructed emotion: An active inference account of interoception and categorization. Social Cognitive and Affective Neuroscience, 12(11), 1833–1833. https://doi.org/10.1093/scan/nsx060
- Bazilinskyy, P., Kooijman, L., Dodou, D., Mallant, K., Roosens, V., Middelweerd, M., Overbeek, L., & de Winter, J. (2022). Get out of the way! Examining eHMIs in critical driver-pedestrian encounters in a coupled simulator. In Proceedings of the 14th International Conference on Automotive User Interfaces and Interactive Vehicular Applications (pp. 360–371). https://doi.org/10.1145/3543174.3546849
- Bethge, D., Kosch, T., Grosse-Puppendahl, T., Chuang, L. L., Kari, M., Jagaciak, A., & Schmidt, A. (2021). Vemotion: Using driving context for indirect emotion prediction in real-time. In The 34th Annual ACM Symposium on User Interface Software and Technology (pp. 638–651). Virtual Event USA; ACM. https://doi.org/10.1145/3472749.3474775
- Bindschädel, J., Krems, I., & Kiesel, A. (2021). Interaction between pedestrians and automated vehicles: Exploring a motion-based approach for virtual reality experiments. Transportation Research Part F: Traffic Psychology and Behaviour, 82, 316–332. https://doi.org/10.1016/j.trf.2021.08.018
- Bradley, M. M., & Lang, P. J. (1994). Measuring emotion: The self-assessment manikin and the semantic differential. Journal of Behavior Therapy and Experimental Psychiatry, 25(1), 49–59. https://doi.org/10.1016/0005-7916(94)90063-9
- Braun, M., Schubert, J., Pfleging, B., & Alt, F. (2019). Improving driver emotions with affective strategies. Multimodal Technologies and Interaction, 3(1), 21. https://doi.org/10.3390/mti3010021
- Braun, M., Weber, F., & Alt, F. (2022). Affective automotive user interfaces? Reviewing the state of driver affect research and emotion regulation in the car. ACM Computing Surveys, 54(7), 1–26. https://doi.org/10.1145/3460938
- Chou, K.-L., Lee, T., & Ho, A. H. (2007). Does mood state change risk taking tendency in older adults? Psychology and Aging, 22(2), 310–318. https://doi.org/10.1037/0882-7974.22.2.310
- Clark, E. A., Kessinger, J., Duncan, S. E., Bell, M. A., Lahne, J., Gallagher, D. L., & O'Keefe, S. F. (2020). The facial action coding system for characterization of human affective response to consumer product-based stimuli: A systematic review. Frontiers in Psychology, 11, 920. https://doi.org/10.3389/fpsyg.2020.00920
- Dawson, M. E., Schell, A. M., & Filion, D. L. (2016). The electrodermal system. In Handbook of psychophysiology (4th ed., pp. 217–243). Cambridge University Press. https://doi.org/10.1017/9781107415782.010
- Ekman, P. (1992). An argument for basic emotions. Cognition and Emotion, 6(3–4), 169–200. https://doi.org/10.1080/02699939208411068
- Ekman, P., & Friesen, W. V. (1978). Facial action coding system: Investigator’s guide. Consulting Psychologists Press.
- Fleureau, J., Guillotel, P., & Orlac, I. (2013). Affective benchmarking of movies based on the physiological responses of a real audience. In 2013 Humaine Association Conference on Affective Computing and Intelligent Interaction (pp. 73–78). IEEE.
- Fox, A. S., Lapate, R. C., Shackman, A. J., & Davidson, R. J. (2018). The nature of emotion: Fundamental questions. Oxford University Press.
- Ghosh, S., Pons Rodriguez, G., Rao, S., El Ali, A., & Cesar, P. (2022). Exploring emotion responses toward pedestrian crossing actions for designing in-vehicle empathic interfaces. In Proceedings of the 2022 CHI Conference on Human Factors in Computing Systems (pp. 1–6). Association for Computing Machinery. https://doi.org/10.1145/3491101.3519764
- Golland, Y., Arzouan, Y., & Levit-Binnun, N. (2015). The mere co-presence: Synchronization of autonomic signals and emotional responses across co-present individuals not engaged in direct interaction. PLOS One, 10(5), e0125804. https://doi.org/10.1371/journal.pone.0125804
- Gueguen, N., Eyssartier, C., & Meineri, S. (2016). A pedestrian’s smile and drivers’ behavior: When a smile increases careful driving. Journal of Safety Research, 56, 83–88. https://doi.org/10.1016/j.jsr.2015.12.005
- Guéguen, N., Meineri, S., & Eyssartier, C. (2015). A pedestrian’s stare and drivers’ stopping behavior: A field experiment at the pedestrian crossing. Safety Science, 75, 87–89. https://doi.org/10.1016/j.ssci.2015.01.018
- Habibovic, A., Lundgren, V. M., Andersson, J., Klingegård, M., Lagström, T., Sirkka, A., Fagerlönn, J., Edgren, C., Fredriksson, R., Krupenia, S., Saluäär, D., & Larsson, P. (2018). Communicating intent of automated vehicles to pedestrians. Frontiers in Psychology, 9, 1336. https://doi.org/10.3389/fpsyg.2018.01336
- Haklay, M. M., & Weber, P. (2008). Openstreetmap: User-generated street maps. IEEE Pervasive Computing, 7(4), 12–18. https://doi.org/10.1109/MPRV.2008.80
- Healey, J., & Picard, R. (2005). Detecting stress during real-world driving tasks using physiological sensors. IEEE Transactions on Intelligent Transportation Systems, 6(2), 156–166. https://doi.org/10.1109/TITS.2005.848368
- Heilbron, F. C., & Niebles, J. C. (2014). Collecting and annotating human activities in web videos. In Proceedings of International Conference on Multimedia Retrieval (pp. 377–384). Association for Computing Machinery. https://doi.org/10.1145/2578726.2578775
- Helm, J. L., Sbarra, D., & Ferrer, E. (2012). Assessing cross-partner associations in physiological responses via coupled oscillator models. Emotion, 12(4), 748–762. https://doi.org/10.1037/a0025036
- Hoch, S., Althoff, F., McGlaun, G., & Rigoll, G. (2005). Bimodal fusion of emotional data in an automotive environment. In Proceedings.(ICASSP’05). IEEE international conference on acoustics, speech, and signal processing, 2005 (Vol. 2, pp. ii–1085). IEEE.
- Hu, H., Zhu, Z., Gao, Z., & Zheng, R. (2018). Analysis on biosignal characteristics to evaluate road rage of younger drivers: A driving simulator study. In 2018 IEEE Intelligent Vehicles Symposium (IV) (pp. 156–161). https://doi.org/10.1109/IVS.2018.8500444
- Ihme, K., Dömeland, C., Freese, M., & Jipp, M. (2018). Frustration in the face of the driver: A simulator study on facial muscle activity during frustrated driving. Interaction Studies, 19(3), 487–498. https://doi.org/10.1075/is.17005.ihm
- Ihme, K., Unni, A., Zhang, M., Rieger, J. W., & Jipp, M. (2018). Recognizing frustration of drivers from face video recordings and brain activation measurements with functional near-infrared spectroscopy. Frontiers in Human Neuroscience, 12, 327. https://doi.org/10.3389/fnhum.2018.00327
- Jeon, M. (2015). Towards affect-integrated driving behaviour research. Theoretical Issues in Ergonomics Science, 16(6), 553–585. https://doi.org/10.1080/1463922X.2015.1067934
- Jeon, M. (2016). Don’t cry while you’re driving: Sad driving is as bad as angry driving. International Journal of Human–Computer Interaction, 32(10), 777–790. https://doi.org/10.1080/10447318.2016.1198524
- Jeon, M., Yim, J.-B., & Walker, B. N. (2011). An angry driver is not the same as a fearful driver: Effects of specific negative emotions on risk perception, driving performance, and workload. In Proceedings of the 3rd International Conference on Automotive User Interfaces and Interactive Vehicular Applications (pp. 137–142). ACM.
- Koch, K., Mishra, V., Liu, S., Berger, T., Fleisch, E., Kotz, D., & Wortmann, F. (2021). When do drivers interact with in-vehicle well-being interventions? An exploratory analysis of a longitudinal study on public roads. Proceedings of the ACM on Interactive, Mobile, Wearable and Ubiquitous Technologies, 5(1), 1–30. https://doi.org/10.1145/3448116
- Kooij, J. F. P., Schneider, N., Flohr, F., & Gavrila, D. M. (2014). Context-based pedestrian path prediction. In European Conference on Computer Vision (pp. 618–633). LNCS.
- Kotseruba, I., Rasouli, A., & Tsotsos, J. K. (2016). Joint attention in autonomous driving (JAAD). arXiv preprint arXiv160904741, 264–269.
- Likas, A., Vlassis, N., & Verbeek, J. J. (2003). The global k-means clustering algorithm. Pattern Recognition, 36(2), 451–461. https://doi.org/10.1016/S0031-3203(02)00060-2
- Lutz, A., Brefczynski-Lewis, J., Johnstone, T., & Davidson, R. J. (2008). Regulation of the neural circuitry of emotion by compassion meditation: Effects of meditative expertise. PLOS One, 3(3), e1897. https://doi.org/10.1371/journal.pone.0001897
- Ma, Z., Mahmoud, M., Robinson, P., Dias, E., & Skrypchuk, L. (2017). Automatic detection of a driver’s complex mental states. In International Conference on Computational Science and Its Applications (pp. 678–691). Springer.
- Magaña, V. C., Scherz, W. D., Seepold, R., Madrid, N. M., Pañeda, X. G., & Garcia, R. (2020). The effects of the driver’s mental state and passenger compartment conditions on driving performance and driving stress. Sensors, 20(18), 5274. https://doi.org/10.3390/s20185274
- Mahadevan, K., Somanath, S., & Sharlin, E. (2018). Communicating awareness and intent in autonomous vehicle-pedestrian interaction. In Proceedings of the 2018 CHI Conference on Human Factors in Computing Systems (p. 429). Associated Computing Machinery.
- Malta, L., Angkititrakul, P., Miyajima, C., & Takeda, K. (2008). Multi-modal real-world driving data collection, transcription, and integration using bayesian network. In 2008 IEEE intelligent vehicles symposium (pp. 150–155). ACM.
- Masip, D., North, M. S., Todorov, A., & Osherson, D. N. (2014). Automated prediction of preferences using facial expressions. PLOS One, 9(2), e87434. https://doi.org/10.1371/journal.pone.0087434
- Megías, A., Maldonado, A., Cándido, A., & Catena, A. (2011). Emotional modulation of urgent and evaluative behaviors in risky driving scenarios. Accident; Analysis and Prevention, 43(3), 813–817. https://doi.org/10.1016/j.aap.2010.10.029
- Mehrabian, A. (1996). Pleasure-arousal-dominance: A general framework for describing and measuring individual differences in temperament. Current Psychology, 14(4), 261–292. https://doi.org/10.1007/BF02686918
- Mesken, J., Hagenzieker, M. P., Rothengatter, T., & de Waard, D. (2007). Frequency, determinants, and consequences of different drivers’ emotions: An on-the-road study using self-reports,(observed) behaviour, and physiology. Transportation Research Part F: Traffic Psychology and Behaviour, 10(6), 458–475. https://doi.org/10.1016/j.trf.2007.05.001
- Munla, N., Khalil, M., Shahin, A., & Mourad, A. (2015). Driver stress level detection using HRV analysis. In 2015 International Conference on Advances in Biomedical Engineering (ICABME) (pp. 61–64). IEEE. https://doi.org/10.1109/ICABME.2015.7323251
- Nason, G. P., & Silverman, B. W. (1995). The stationary wavelet transform and some statistical applications. In Wavelets and statistics (pp. 281–299). Springer.
- Nathanael, D., Portouli, E., Papakostopoulos, V., Gkikas, K., Amditis, A. (2018). Naturalistic observation of interactions between car drivers and pedestrians in high density urban settings. In Congress of the International Ergonomics Association (pp. 389–397).
- Paschero, M., Del Vescovo, G., Benucci, L., Rizzi, A., Santello, M., Fabbri, G., Mascioli, F. F. (2012). A real time classifier for emotion and stress recognition in a vehicle driver. In 2012 IEEE International Symposium on Industrial Electronics (pp. 1690–1695). IEEE.
- Pfleging, B., Fekety, D. K., Schmidt, A., & Kun, A. L. (2016). A model relating pupil diameter to mental workload and lighting conditions. In Proceedings of the 2016 CHI Conference on Human Factors in Computing Systems (pp. 5776–5788). ACM. https://doi.org/10.1145/2858036.2858117
- Picard, R. W. (2000). Affective computing. MIT Press.
- Plutchik, R. (2001). The nature of emotions: Human emotions have deep evolutionary roots, a fact that may explain their complexity and provide tools for clinical practice. American Scientist, 89(4), 344–350. https://doi.org/10.1511/2001.28.344
- Ranasinghe, C., Holländer, K., Currano, R., Sirkin, D., Moore, D., Schneegass, S., & Ju, W. (2020). Autonomous vehicle-pedestrian interaction across cultures: Towards designing better external human machine interfaces (eHMIs). In Extended Abstracts of the 2020 CHI Conference on Human Factors in Computing Systems (pp. 1–8). https://doi.org/10.1145/3334480.3382957
- Ranganathan, P., Pramesh, C., & Aggarwal, R. (2017). Common pitfalls in statistical analysis: Measures of agreement. Perspectives in Clinical Research, 8(4), 187–191. https://doi.org/10.4103/picr.PICR_123_17
- Rao, S., Ghosh, S., Pons Rodriguez, G., Röggla, T., El Ali, A., & Cesar, P. (2022). Investigating affective responses toward in-video pedestrian crossing actions using camera and physiological sensors. In Proceedings of the 14th International Conference on Automotive User Interfaces and Interactive Vehicular Applications (pp. 226–235). https://doi.org/10.1145/3543174.3546842
- Rasouli, A., Kotseruba, I., & Tsotsos, J. K. (2017a). Agreeing to cross: How drivers and pedestrians communicate. In 2017 IEEE Intelligent Vehicles Symposium (IV) (pp. 264–269). IEEE. https://doi.org/10.1109/IVS.2017.7995730
- Rasouli, A., Kotseruba, I., & Tsotsos, J. K. (2017b). Are they going to cross? a benchmark dataset and baseline for pedestrian crosswalk behavior. In Proceedings of the IEEE International Conference on Computer Vision (pp. 206–213). IEEE.
- Ren, Z., Jiang, X., & Wang, W. (2016). Analysis of the influence of pedestrians’ eye contact on drivers’ comfort boundary during the crossing conflict. Procedia Engineering, 137, 399–406. https://doi.org/10.1016/j.proeng.2016.01.274
- Rigas, G., Goletsis, Y., & Fotiadis, D. I. (2012). Real-time driver’s stress event detection. IEEE Transactions on Intelligent Transportation Systems, 13(1), 221–234. https://doi.org/10.1109/TITS.2011.2168215
- Risto, M., Emmenegger, C., Vinkhuyzen, E., Cefkin, M., & Hollan, J. (2017). Human-vehicle interfaces: The power of vehicle movement gestures in human road user coordination. In Proceedings of the Ninth International Driving Symposium on Human Factors in Driver Assessment, Training, and Vehicle Design (pp. 411–420). National Advanced Driving Simulator. https://doi.org/10.17077/drivingassessment.1633
- Roidl, E., Frehse, B., & Höger, R. (2014). Emotional states of drivers and the impact on speed, acceleration and traffic violations—A simulator study. Accident; Analysis and Prevention, 70, 282–292. https://doi.org/10.1016/j.aap.2014.04.010
- Russell, J. A. (1980). A circumplex model of affect. Journal of Personality and Social Psychology, 39(6), 1161–1178. https://doi.org/10.1037/h0077714
- Sani, S. R. H., Tabibi, Z., Fadardi, J. S., & Stavrinos, D. (2017). Aggression, emotional self-regulation, attentional bias, and cognitive inhibition predict risky driving behavior. Accident; Analysis and Prevention, 109(190), 78–88. https://doi.org/10.1016/j.aap.2017.10.006
- Sarkar, P., & Etemad, A. (2020). Self-supervised learning for ECG-based emotion recognition. In ICASSP 2020 – 2020 IEEE International Conference on Acoustics, Speech and Signal Processing (ICASSP) (pp. 3217–3221). IEEE. https://doi.org/10.1109/ICASSP40776.2020.9053985
- Schmidt, S., & Färber, B. (2009). Pedestrians at the kerb–recognising the action intentions of humans. Transportation Research Part F: Traffic Psychology and Behaviour, 12(4), 300–310. https://doi.org/10.1016/j.trf.2009.02.003
- Schmidt-Daffy, M. (2012). Velocity versus safety: Impact of goal conflict and task difficulty on drivers’ behaviour, feelings of anxiety, and electrodermal responses. Transportation Research Part F: Traffic Psychology and Behaviour, 15(3), 319–332. https://doi.org/10.1016/j.trf.2012.02.004
- Schneemann, F., & Gohl, I. (2016). Analyzing driver-pedestrian interaction at crosswalks: A contribution to autonomous driving in urban environments. In 2016 IEEE Intelligent Vehicles Symposium (IV) (pp. 38–43). https://doi.org/10.1109/IVS.2016.7535361
- Schuller, B., Wimmer, M., Arsic, D., Moosmayr, T., & Rigoll, G. (2008). Detection of security related affect and behaviour in passenger transport. In Ninth annual conference of the international speech communication association (p. 265–268). IEEE.
- Schulz, A. T., & Stiefelhagen, R. (2015). Pedestrian intention recognition using latent-dynamic conditional random fields. In 2015 IEEE Intelligent Vehicles Symposium (IV) (pp. 622–627). IEEE. https://doi.org/10.1109/IVS.2015.7225754
- Shi, Y., Ruiz, N., Taib, R., Choi, E., & Chen, F. (2007). Galvanic skin response (GSR) as an index of cognitive load. In CHI ’07 Extended Abstracts on Human Factors in Computing Systems (pp. 2651–2656). Association for Computing Machinery. https://doi.org/10.1145/1240866.1241057
- Singh, R. R., Conjeti, S., & Banerjee, R. (2013). A comparative evaluation of neural network classifiers for stress level analysis of automotive drivers using physiological signals. Biomedical Signal Processing and Control, 8(6), 740–754. https://doi.org/10.1016/j.bspc.2013.06.014
- Sucha, M., Dostal, D., & Risser, R. (2017). Pedestrian-driver communication and decision strategies at marked crossings. Accident; Analysis and Prevention, 102(107050), 41–50. https://doi.org/10.1016/j.aap.2017.02.018
- Taib, R., Tederry, J., & Itzstein, B. (2014). Quantifying driver frustration to improve road safety. In CHI’14 Extended Abstracts on Human Factors in Computing Systems (pp. 1777–1782). ACM. https://doi.org/10.1145/2559206.2581258
- Vanutelli, M. E., Gatti, L., Angioletti, L., & Balconi, M. (2017). Affective synchrony and autonomic coupling during cooperation: A hyperscanning study. BioMed Research International, 2017(14), 1–9. https://doi.org/10.1155/2017/3104564
- Wang, C., & Cesar, P. (2017). The play is a hit: But how can you tell? In Proceedings of the 2017 ACM SIGCHI Conference on Creativity and Cognition (pp. 336–347). Association for Computing Machinery. https://doi.org/10.1145/3059454.3059465
- Wang, C.-A., Baird, T., Huang, J., Coutinho, J. D., Brien, D. C., & Munoz, D. P. (2018). Arousal effects on pupil size, heart rate, and skin conductance in an emotional face task. Frontiers in Neurology, 9, 1029. https://doi.org/10.3389/fneur.2018.01029
- Wang, T., Wu, J., Zheng, P., & McDonald, M. (2010). Study of pedestrians’ gap acceptance behavior when they jaywalk outside crossing facilities. In 13th International IEEE Conference on Intelligent Transportation Systems (pp. 1295–1300). IEEE.
- Wang, Y., Hespanhol, L., Worrall, S., & Tomitsch, M. (2022). Pedestrian-vehicle interaction in shared space: Insights for autonomous vehicles. In Proceedings of the 14th International Conference on Automotive User Interfaces and Interactive Vehicular Applications (pp. 330–339). https://doi.org/10.1145/3543174.3546838
- Weber, F., Chadowitz, R., Schmidt, K., Messerschmidt, J., Fuest, T. (2019). Crossing the street across the globe: A study on the effects of eHMI on pedestrians in the US, Germany and China. In International Conference on Human–Computer Interaction (pp. 515–530).
- Wu, B.-F., Chu, Y.-W., Huang, P.-W., Chung, M.-L., & Lin, T.-M. (2017). A motion robust remote-PPG approach to driver’s health state monitoring. In C.-S. Chen, J. Lu, & K.-K. Ma (Eds.), Computer Vision – ACCV 2016 Workshops (pp. 463–476). Springer International Publishing.
- Yang, S. (2017). Driver behavior impact on pedestrians’ crossing experience in the conditionally autonomous driving context.
- Zadeh, A., Chong Lim, Y., Baltrusaitis, T., & Morency, L.-P. (2017). Convolutional experts constrained local model for 3D facial landmark detection. In Proceedings of the IEEE International Conference on Computer Vision Workshops (pp. 2519–2528).
- Zepf, S., Dittrich, M., Hernandez, J., & Schmitt, A. (2019). Towards empathetic car interfaces: Emotional triggers while driving. In Extended Abstracts of the 2019 CHI Conference on Human Factors in Computing Systems (pp. 1–6). ACM.
- Zepf, S., Hernandez, J., Schmitt, A., Minker, W., & Picard, R. W. (2021). Driver emotion recognition for intelligent vehicles: A. ACM Computing Surveys, 53(3), 1–30. https://doi.org/10.1145/3388790
- Zhao, Y., Miyahara, T., Mizuno, K., Ito, D., & Han, Y. (2021). Analysis of car driver responses to avoid car-to-cyclist perpendicular collisions based on drive recorder data and driving simulator experiments. Accident; Analysis and Prevention, 150, 105862. https://doi.org/10.1016/j.aap.2020.105862
- Zhi, R., Liu, M., & Zhang, D. (2020). A comprehensive survey on automatic facial action unit analysis. The Visual Computer, 36(5), 1067–1093. https://doi.org/10.1007/s00371-019-01707-5
- Zimasa, T., Jamson, S., & Henson, B. (2019). The influence of driver’s mood on car following and glance behaviour: Using cognitive load as an intervention. Transportation Research Part F: Traffic Psychology and Behaviour, 66, 87–100. https://doi.org/10.1016/j.trf.2019.08.019
Appendix A.
Study 2: Hybrid driving simulator facial expressions analysis
The following tables describe the statistically significant results from analysis of the facial action units described in Section 6.4.2.
Participant wearing the Pupil Labs eye tracker while watching video stimuli. (a) Thermal Camera and projection screen placement. (b) The web-based user interface displays the video stimuli and records the participant’s valence and arousal ratings after each video (c).
Table A1. Statistically significant results using Wilcoxon Signed Rank Test for changes in AUs of participants before and during positive pedestrian crossing actions.
Table A2. Statistically significant results using Wilcoxon Signed Rank Test for changes in AUs of participants before and during non-positive pedestrian crossing actions.
Table A3. Statistically significant results using Wilcoxon Signed Rank Test for changes in AUs of participants during no pedestrian crossing actions.