
Abstract
Mastering the art of stopping initiated actions is vital when playing video games. However, what characteristics make up the perfect warning or stop-signal remains unclear. In the present study we compared performance in a basic and a gamified stop-signal task depending on different stop-signal modalities: auditory, haptic and audio-haptic. Data from a complete within-subjects design (N = 24), revealed an advantage of haptic or audio-haptic stop-signals as compared to purely auditory ones. Further, results show an overall slower performance in the game-version compared to the basic version. With regards to the subjective experience, the results revealed higher motivation to perform in the gamified task, but a somewhat deeper flow experience in the basic task. In sum, these results confirm that stop-signal modality influences reactive response inhibition in both basic and gamified tasks. Future research may extend and generalize these findings to other cross-modal and more complicated gaming setups. Game developers may draw on these findings to optimize the communication of stop signals via vibrations in a handheld controller.
1. Introduction
Over the last decade, the ways of interacting with digital games have drastically changed and new devices for the gaming experience, other than the classic joystick, have been introduced. For example, the current version of the PlayStation 5 controller not only has classic input buttons but also gyroscope and accelerometer sensors to track the overall movement and rotation of the device, touch sensors on the back to track the user’s fingers on the back of the controller but foremost a complex system of haptic feedback systems, allowing players to experience games not only visually but also through touch. Within the gaming context most games use tactile stimulation. This has been used in games to either enhance visual and acoustic feedback or to reproduce realistic feedback, but also to support the interaction with user interfaces, especially in mixed reality applications (e.g., the controller vibrates if the users exit the tracking area of the VR hardware; Gatti et al., Citation2017). Research about user preferences indicate that players prefer the additional tactile feedback (Brewster et al., Citation2007) and the tactile sensation has a positive effect on the immersion of players (Bowman & McMahan, Citation2007; Goncalves et al., Citation2020; Lemmens et al., Citation2009; Normand et al., Citation2011). Besides the strong preferences for gaming experiences of players, researchers emphasize that tactile feedback can increase the user’s performance. The increased performance through tactile feedback is linked to the task and only applicable when a player is not disturbed by other sources (e.g., when playing on a moving train; Brewster et al., Citation2007). However, tactile feedback in games have not been leveraged outside of special applications such as assistive technologies (Jeong et al., Citation2023). The different forms of feedback (i.e., tactile, or auditory) can especially be useful for stopping initiated actions, both in gaming as in other areas. Therefore, this study aims to contribute to the understanding of this feedback on stopping initiated actions in a game environment.
1.1. Information processing in digital spaces
Naturally humans have a limit to process information, leading to the need to focus and filter out unnecessary information (Koessmeier & Büttner, Citation2021; Pashler & Wagenmakers, Citation2012). However, task irrelevant information may shift the user’s focus and therefore distract the individual from successfully finishing their task (Lang, Citation2000). Distractions, lower the individuals’ performance in their tasks (Beland & Murphy, Citation2016; Horberry et al., Citation2006; Liebl et al., Citation2012) and can have severe consequences, such as when steering a car. Therefore, optimizing interfaces to reduce the risk of distractions has been explored in many areas, including digital games (Kulshreshth et al., Citation2012; Symeonidis, Citation2014). Ways to prevent distraction include software solutions, such as blocking out notifications (Stothart et al., Citation2015; Warnock et al., Citation2011), but exploring diverse ways how to use secondary communication ways, e.g., by stimulating other senses, instead of using the visual one.
1.2. Gamification and the stop-signal task
Reactive response inhibition is about stopping an already initiated action in response to an external stimulus, which can take various forms, such as auditory, visual, or tactile. In laboratory conditions, reactive inhibition can be tested by using the Stop-Signal Task (SST) paradigm (Verbruggen & Logan, Citation2008). In SST, participants perform a “go-task”, such as indicating the direction of a figure displayed on the screen by clicking a button corresponding with the correct direction. However, once every few trials, the go-signal is followed by a stop-signal, in this case it could be a vibration on the controller with the buttons, which instructs the participant to withhold the response, that is to not click the corresponding button. Successful reactive inhibition cannot be observed directly, since it results in a lack of response (Verbruggen et al., Citation2019). As mentioned before, stop-signals can occur in various modalities, and there is a question as to which modality is the most effective in withholding an already initiated action. Research showed that auditory stop signals are more effective than visual stop signals and that stop-signal intensity matters (Ramautar et al., Citation2006; Van Der Schoot et al., Citation2005). However, in general, tactile signals result in shorter reaction times than auditory or visual signals in otherwise dominantly visual tasks (Scott & Gray, Citation2008). However, there is still no research that compares tactile stop-signals with auditory stop-signals in a typical stop-signal task paradigm.
As previous studies with a typical stop-signal task show, participants tend to find them tedious and cognitively demanding, and have little motivation to perform the task correctly. As a result, many participants perform poorly or drop out of the study, which may lead to inferior quality of the data. That is why the idea of gamification of the stop-signal task emerged. Gamification refers to using typical element of game design in non-gaming settings (Deterding et al., Citation2011). Using a gamified version of the standard stop-signal task leads to increased motivation and flow experience in participants, hopefully resulting in better quality of the collected data. Therefore, the current study uses both a game-like version of the task and a standardised non-gaming version to compare the experience of flow and motivation of participants and find further proof for the benefits of gamification of stop-signal tasks. For example, flow in video games can foster optimal involvement in a task, which creates great enjoyment for users and can be experienced as being fully and actively engaged in a specific assignment (Sharek & Wiebe, Citation2011). Further, intrinsic motivation is understood as an inner drive which prompts individuals to engage in a task based on their goals, interests, or values (for a review see, Xu et al., Citation2021). A relevant aspect for maintaining intrinsic motivation is to enjoy the task, and to meet the needs for autonomy, competence, and relatedness (Xu et al., Citation2021). Thus, the current study will try to reach these requirements for both flow and motivation.
1.3. Current study & hypothesis
The aim of this study is to bridge the gap in the existing work frame by investigating whether one modality of stop-signals is more effective at stopping an already initiated response as compared to another. This is done by means of an experimental study using both a game-like environment and a standardised non-gaming environment. We have two main hypotheses relating to the task performance as well as the experience during the task:
Performance:
We hypothesize that tactile stop-signals are processed more effectively, and that the inhibition process (as measured by stop-signal reaction time; SSRT) is enhanced in the tactile task condition as compared to the auditory task condition.
We hypothesized that general reaction speed and error rates are not affected by stop-signal modality (game, basic) or task condition (tactile, audio, combined).
We hypothesize that there is no difference in task performance between the SSG and the SST and thereby replicating previous work (Friehs et al., Citation2020).
Experience:
We hypothesize that SSG will enhance the perceived intrinsic motivation for task performance as previously shown in Friehs et al. (Citation2020).
We hypothesize that the SSG will lead to an enhanced flow experience, thereby replicating previous work by Friehs et al. (Citation2020).
Although, the present study is rooted in prior research and partially aims to replicate previous findings, the study notably adds to previous knowledge and has implications for practice and theory alike. First, to increase our understanding of reactive response inhibition in real-life we need to define the relevant boundary conditions. Thus it is also important to replicate the effect across both basic and visually more complex setups. Second, while we strongly rely on visual and auditory input to perceive our environment to act sensibly and safely (for example when driving a car – one relies heavily on visual and auditory input to scan the surroundings and drive safely), the utilization of tactile modality is still in development (e.g., vibrating steering wheels for line crossings exist but are also problematic because of the inherent vibrations of the car). If inhibitory processes can be initiated by tactile stimulation, this would call for the development of touch-based inhibitory systems. Third, for game designers it has always been a challenge to communicate the information as effectively as possible. If haptic feedback (notably transmitted via a vibrating controller) is indeed more effective at initiating a reactive action stop, then this may directly inform future game-design decisions.
2. Methods
2.1. Sample
The study comprised a final sample of 24 participants, consisting of 15 males (62.5%) and 9 females (37,5%), with a mean age of 24 years (SD = 5.2)Footnote1. Fifteen of them were University of Twente students, and the remaining nine were from the Max Planck Institute for Human Cognitive and Brain Sciences. Participants from the University of Twente were rewarded SONA credit points and participants from the University of Leipzig were given 10€/h. All participants were adults over 18 years old without any relevant medical conditions. Participants provided written consent to take part in the study before participation. The research was approved by the University of Twente Ethics Committee and the Ethics Committee from the University of Leipzig.
2.2. Design
The current study used a repeated-measures design. The most important dependent variable was the Stop-Signal Reaction Time (SSRT, performance estimate of how much time it took participants to withhold their reaction in response to the stop signal). Apart from SSRT, other performance variables were logged such as Stop-Signal Delay (SSD, an estimate of how much time passed between the go and stop signals), Overall accuracy (composed of omission and commission errors), p(response|signal) (probability of making the wrong choice in reaction to the signal), and correct Reaction Times (RTs). The independent variables were the modalities of signals the participants received (i.e., haptic, auditory, haptic, and auditory) and the condition of the task (game vs basic). Thus, a 3 (stop-signal modality: auditory vs. haptic vs. auditory and haptic) × 2 (task condition: game vs basic) mixed design was used. The order in which the participants received the different signals was randomly assigned to counterbalance its effect among people. Indeed, the analysis revealed no effects of order. Every participant completed two task variants in one session, one with a game-like design and one with a non-game design (only right/left arrows). The order in which the participant received the different game settings were also randomly assigned. Participants were asked to come to the lab for three separate sessions, with at least a day, but no more than a week between, that lasted approximately an hour.
2.3. Procedure
Upon entering the laboratory, participants were seated in front of a PC with Windows 11 equipped with Sennnheiser HD 201 or JBL Quantum 400 headphones (overall attenuation for Sennheiser: −7.23 dB and for JBL: −14.94 dB) and an Xbox Elite gaming controller. The standard viewing distance from the computer was ∼60 cm. The auditory signal lasted for 0.5 s with a loudness of ∼60 dB. The tactile signal lasted for 0.5 s and had a frequency of ∼250 Hz with a peak-to-peak amplitude of about 128 µm. During the participants’ first session, the researchers thoroughly explained the rules of the task to the participants and asked them to fill in the consent form and the first part of the questionnaire containing demographic data and previous gaming experience. Before the actual game or non-game tasks, participants played a tutorial version, to understand the concept and instructions. For subsequent sessions, participants were briefly reminded of the rules of the task.
Based on the randomized order in the catalogue, researchers set up the corresponding version (basic or gaming) and condition of the task (auditory, tactile, auditory, and tactile). During one session, participants played both versions of the task with the same modality of the signals (for instance the basic version with auditory signals and the gaming version with auditory signals).
After completing the first version of the task in one modality, participants were asked to report their perceived motivation and flow of the task in a questionnaire and proceeded to complete the other version of the task in the same modality. Afterwards, researchers asked the participants to report perceived motivation and flow for the second task in the questionnaire as well. Then, the session was finished.
2.4. Questionnaires
The first time that the participants filled in the questionnaire, they were asked to provide some demographic information, such as gender and age. After this, they were asked to indicate how much they consider themselves to be a “gamer”. The participants were also asked to indicate how comfortable they feel with using a controller using a slide index going from 0 (complete beginner in handling controllers) to 100 (expert in handling controllers).
The flow component was measured using the Flow Short Scale (FSS) (Engeser & Rheinberg, Citation2008; Rheinberg et al., Citation2016), which consists of a total of 13 items. Ten items measure the flow experience, with the subscale’s fluency of performance (i.e., “I feel that I have everything under control”) and absorption by activity (i.e., “I do not notice time passing”) (Kyriazos et al., Citation2018). Three additional items measure perceived importance (i.e., “I am worried about failure”). Participants indicated their level of agreement with the statements on a 7-point Likert scale ranging from “Fully disagree” to “Fully agree”. The Flow Short Scale was validated and used within multiple studies, both experimental as correlational, but also in experience-sampling methods (Engeser & Rheinberg, Citation2008; Kyriazos et al., Citation2018). Further, to measure participants’ motivation, the Intrinsic Motivation Inventory (IMI) (Ryan & Deci, Citation2000) questionnaire was filled in. The scale consisted of a total of 12 items, with 4 subscales. The subscales were: interest enjoyment (i.e., “I enjoyed this game very much”), perceived competence (i.e., “I think I am pretty good at this game”), effort importance, (i.e., “I put a lot of effort into this game”), and pressure tension (i.e., “I was anxious while playing the game”). The participants indicated their level of agreement with the statements on a 5-point Likert scale ranging from “Disagree” to “Agree”.
2.5. Stop-signal task
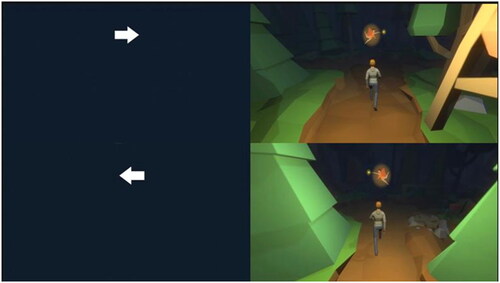
Both Stop-signal Task (SST) and Stop-signal Game (SSG) (Friehs et al., 2022, Citation2022; Friehs et al., Citation2020; Kirsten et al., Citation2023) were created using Game Engine by Unity 3D (2022.1.2 version). Each session contained 350 trials. These trials were distributed over 7 blocks with a 15-second break in between every block during which the game automatically reminded participants of the rules of the task. After every stop-signal, the maximal response time length was set to 2 s. Out of all the trials, 75% were go-trials and 25% were stop-trials. Researchers informed participants to react to the go-stimulus (an arrow pointing either right or left) by clicking a button on the gaming controller corresponding with the correct direction (either left or right). In the basic version, the arrows were white on a dark blue background, and in the gamified version, the arrows were presented by a red fairy with a magical wand on the green forest background. Additionally, it was explained that every few trials a stop signal will occur, indicating to the participants they should withhold their response and not click the button. It was emphasized to participants that their reactions should be fast, and they should not wait for the stop-signal to occur. The stop signal was presented either as a short sharp sound, vibrations on the gaming controller, or both signals together. In the SST, the white arrows appeared on a dark blue background, pointing either left or right. In the SSG, participants played from the third-person perspective with an avatar, who was lost in the woods and tried to get out with the help of the fairy, with the evil witch trying to lure the avatar back into the forest. The fairy was pointing the avatar in the correct direction, with a red arrow either pointing left or right. However, every few trials the evil witch took over and tried to steer the avatar further into the forest, and that was when the stop signal occurred to not follow the witch. After participants made their decision and clicked the button, regardless of whether it was in the correct direction or not, the camera rolled over in the direction they chose to turn. shows how the game task and the basic task were displayed for the participants.
Figure 1. On the left the basic task is shown and on the right the game task.
To ensure that participants were not waiting for the stop signal to occur, the Stop-Signal Delay (SSD, estimate of how much time passed between the go and stop signals), which was originally set to 250 msec was adjusted accordingly to the performance with the staircase procedure. When the initiated reaction was successfully withheld, the SSD increased by 50 msec to make it less likely that successful inhibition will occur on the next trial. Contrarily, when participants failed to stop their reaction, the SSD decreased by 50 msec to increase the probability of successful inhibition on the next trial.
While performing the task, the system logged several performance, accuracy, and reaction time (RT) measures. The SSD and p(response|signal) were both measures of performance. Furthermore, accuracy measures such as the number of omission errors (probability of missing the response on trials without any signal), and commission errors (probability of a wrong response on trials without any signal), were combined in the overall accuracy variable. Moreover, the no-signal RT, signal RT, and probability of the correct inhibition were recorded. For the trials without a stop signal, no-signal RT is an indicator of the rate of the right response, while for the trials with a stop signal, the signal RT estimates a delay on the wrong responses. The probability of the correct inhibition indicates how likely it is that they will inhibit an action they already initiated. Based on the abovementioned performance measures of participants, the Stop-signal reaction time (SSRT) can be estimated.
2.6. Data reduction
Following the recommendations by Verbruggen et al. (Citation2019), the participants who did not meet the horse-race assumption had to be excluded from the dataset. The horse-race assumption claims that the estimate of the SSRT can be reliable only if there is a statistical difference between the mean go-RT and the RT on unsuccessful stop trials. Furthermore, participants that responded to fewer than 25% or more than 75% of signal trials per session were excluded as well. Moreover, if participants dropped out of the study and did not complete the required three sessions, they were excluded too. In the questionnaires, if there was a noticeable flatline pattern in responses, that would indicate that participants chose their responses randomly, such results were invalid and had to be excluded as well. Based on these criteria 13 participants needed to be excluded, leading to the final sample of 24 participants.
2.7. Data analysis
To analyze the performance data collected from the task and the questionnaire data, researchers used the R Studio Program. First, the horse-race assumption needed to be checked for each participant to validate the data. To achieve that, a 2 (signal or no signal) × 3 (modality of a stop signal: auditory, tactile, or auditory and tactile) × 6 (order) GLM was conducted to prove if there is a significant statistical difference between the average signal RT and average no-signal reaction time.
Then, all relevant performance, accuracy, and reaction time variables were submitted to a 3 (modality of a stop signal: auditory, tactile, or auditory and tactile) × 2 (condition of the task: game vs basic) GLM. The effects of the order were counterbalanced among the participants through random assignment. The results of this analysis showed how the three different modalities of stop signals and two different conditions of the task influenced the SSRT, mean SSD, p(response|signal), go mean RT, and overall accuracy to distinguish which modality and condition are more effective in reactive response inhibition.
To analyze the Flow Short Scale and Intrinsic Motivation Inventory, a linear model or generalized linear model of 2(task: SSG vs SST) × 3(modality: tactile × both × auditory) was used. The results following this analysis showed how and whether the three stop signal modalities and the different task types have influenced the questionnaire results and their subscales. This distinguished which task type or modality was more effective in getting higher scoring from participants. Additionally, we computed Cronbach’s alpha to check the internal consistency, and the means (M) and standard deviations (SD) to look at the differences in scores for the scales and subscales, depending on the task type or stop signal type.
To ensure that the sample is large enough for what is researched, a power analysis was performed. This is to report the sample power and estimate the smallest sample size needed to see an effect. This has been done with the G*power program (3.1). An F -test as a statistical test an ANOVA: repeated measures, within factors, was chosen. The type of power analysis was A priori. Input provided to the program was the effect size (f), which was put to be 0.3, assuming a lower to medium size effect, the ɑ error probability was set to 0.05 with a Power (1-β) probability of 0.95, the number of groups was put to 1 with 6 measurements, and lastly the correlation among rep measures was set to 0.4. After calculating with the input given, a total sample size of 24 was received as the sample size needed to see an effect.
3. Results
3.1. Task performance
summarizes the descriptive performance data of the main performance variables: SSRT, SSD, p(response|signal), correct go RT, and overall accuracy, depending on the condition of the task and modality of the stop signal. represents the distribution of the SSRT scores depending on the modality of the stop signal. Results show that the tactile modality shows lower SSRT scores than the auditory modality, suggesting better inhibitory control of the haptic signals. Additionally, the figure presents the distribution of the SSRT scores depending on the condition of the task: game vs basic. It displays that the basic version has lower SSRT scores than the game condition, which indicates that the basic version is performing better in reactive response inhibition.
Figure 2. SSRT scores depend on the signal modality and task condition. Results show that the tactile modality has lower SSRT’s than the auditory modality, suggesting faster response times for tactile. Additionally, the SSRT scores are lower for the basic condition of the task, indicating a better reactive inhibition than the game version. It should be noted that there is an outlier in the game condition, but even after the removal of that person, the results remain the same. Data from this individual was satisfactory overall, albeit their overall performance was subpar.
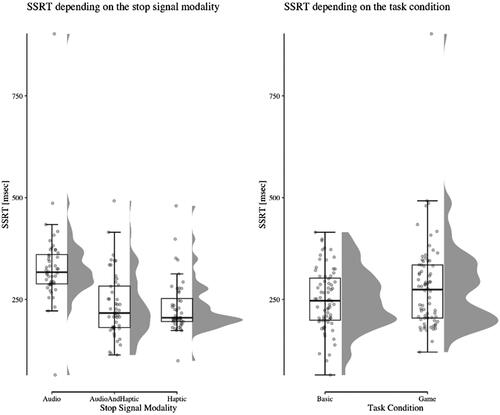
Table 1. Descriptive performance data split by task condition and stop-signal type.
3.1.1. Stop-signal reaction time (SSRT)
SSRT was submitted to a 2 (Task Condition: game vs basic) × 3 (Stop Signal Type: auditory vs. haptic vs auditory and haptic) general linear model using the lmerTest and lme4 packages in R (Bates et al., Citation2015; Kuznetsova et al., Citation2017). Further, because of the significant correlation between the experience in controller usage and SSRT (r = −0.19, p < 0.05), the controller use experience was used as a random factor in the model to control for it. Analysis revealed a significant effect for Task Condition (F(1, 133.84) = 5.54, p < 0.05, Ωp2 = 0.03) and Stop Signal Type (F(2, 133.84) = 23.61, p < 0.0001, Ωp2 = 0.25), but no significant interaction (F(2, 133.84) = 1.1, p = 0.33)Footnote2. Thus, the game condition yielded higher SSRTs (i.e., worse performance) compared to the basic task condition (281.72 vs. 249.80). Further, descriptively, the mean SSRT for the tactile stop-signal was lower than for the auditory modality (230.62 vs. 331.62) and slightly lower than the SSRT for the auditory and tactile (235.04). The post-hoc analysis of the three-level stop signal type variable revealed two statistically significant contrasts between audio vs combined (estimate: 97 ms difference, p < 0.0001), and audio vs haptic (estimate: 101 ms difference, p < 0.001). No significant contrast between combined and haptic was identified (estimate: 4 ms difference, p = 0.9638).
3.1.2. Stop-signal delay (SSD)
Analysis revealed a main effect of Task Condition (F(2, 130.53) = 4.69, p < 0.05, Ωp2 = 0.03) and Stop Signal Type (F(2, 130.53) = 3.25, p < 0.05, Ωp2 = 0.03), but no significant interaction (F(2, 130.53) = .02, p = 0.98). Results show higher SSDs for the game condition, indicative of better response inhibition, than for the basic version. Further, the data shows the highest SSD in the Audio-Haptic as compared to the higher two conditions. However, given the small effect sizes this should not be overinterpreted.
3.1.3. Correct go mean RT
Analysis revealed a main effect of Task Condition (F(2, 138) = 6.17, p < 0.05, Ωp2 = 0.04) but not Stop Signal Type (F(2, 138) = 3.25, p = 0.18), and no significant interaction (F(2, 138) = 0.02, p = 0.98). Overall correct go mean RTs were higher in the game condition compared to the basic version, indicating overall slower reactions in the gamified task version (665.82 vs 788.11).
3.1.4. Overall error rate
Due to the low number of overall errors, omission and commission errors were combined. The overall accuracy was on average 98.78% with a median of 99.25% across conditions, which is indicative of a ceiling effect. In concordance, no significant effects emerged (p’s between 0.15 and 0.71).
3.2. Questionnaires
3.2.1. Flow
Firstly, the validity of the Flow questionnaire and its subscales was tested by computing Cronbach’s alpha. The overall Flow scale had a score of α = 0.68, which is an acceptable internal consistency. When looking at the subscales, Subscale 1, fluency of performance, had an alpha of α = 0.81, Subscale 2, absorption by activity, had an alpha of α = 0.27, and Subscale 3, perceived importance, had an alpha of α = 0.36. Fluency of performance had a good internal consistency, while the other two had an unsatisfactory score. For this reason, the analysis will only focus on the first subscale. To assess whether participants were having a flow-like experience while playing the assigned game, the differences between the task type and signal type were analyzed. Specifically, it was assessed whether flow was influenced by the task type, and by the signal type. For this, a generalized linear regression of 2 (game vs. non-game) × 3 (auditory vs. tactile vs. both) using the lmerTest and lme4 packages in R (Bates et al., Citation2015; Kuznetsova et al., Citation2017) was conducted, first for flow in general, and then for the first subscale.
This model revealed no significant effects of condition (F(1, 134.59) = 1.99, p = 0.16) or modality (F(2, 134.59) = 1.31, p = 0.27). Additionally, there were no significant interaction effects (F(2, 134.59) = 0.06, p = 0.94). Since only the first subscale, fluency of performance had a good internal consistency, it was submitted to the generalized linear regression. Neither condition (F(1, 134.29) = 1.02, p = 0.90) nor stop signal type (F(2, 134.29) = 0.88, p = 0.87) revealed any significant results. No interaction effects were found (F(2, 134.29) = 0.22, p = 0.81).
When computing the means and standard deviations, there were again some differences. Participants experienced higher flow in the game condition, and the stop signals tactile and auditory and tactile showed higher flow than the auditory signal. The only exception is that flow was higher in the basic condition for the tactile signal (M = 3.38; SD = 1.37) than in the game condition (M = 3.15; SD = 1.19). See for a detailed description of the means and standard deviations of the flow questionnaire and its subscales.
Table 2. Means and standard deviations of the flow scale per task and stop signal type.
3.2.2. Intrinsic motivation
The validity of the Intrinsic Motivation Inventory was checked by computing Cronbach’s alpha. Overall, the questionnaire had an α = 0.82, which means the scale has a good internal consistency. Cronbach’s alpha was also computed for the subscales, and all of them were found to have good internal consistency: interest enjoyment had an α = 0.89, perceived competence had an α = 0.81, effort importance had an α = 0.85, and pressure tension had an α = 0.85.
In the analysis it was assessed for which game condition and stop signal participants were more motivated to play the game. Specifically, it was checked whether motivation was influenced by the task type, and by the signal type. For this, a generalized linear regression of 2 (game vs. non-game) x 3 (auditory vs. tactile vs. both) using the lmerTest and lme4 packages in R (Bates et al., Citation2015; Kuznetsova et al., Citation2017) was used.
The analysis revealed significant main effect of condition (F(1, 129.04) = 10.34, p = 0.045, Ωp2 = 0.07) but not stop signal type (F(2,129.04) = 0.37, p = 0.97). No interaction effects were identified (F(2,129.04) = 0.19, p = 0.83).
Further, the same analysis was performed for each subscale. The analysis of the first subscale, interest enjoyment, only revealed significant main effect of condition (F(1,133.72) = 36.16, p < 0.001, Ωp2 = 0.21). For the remaining subscales of perceived competence, effort importance, and pressure tension, the analysis resulted in insignificant effects (all F’s < 1, p’s between 0.6 and 0.9). Thus, no further differences based on the task condition or stop signal type or their interaction emerged. When comparing the means, overall the game task has higher scores for all modalities indicating better motivation in the game task ().
Table 3. Means and standard deviations of the intrinsic motivation Inventory (IMI) per task and stop signal type.
4. Discussion
The present study investigated the impact of gamification and different stop-signal modalities on task performance in a reactive response inhibition task.
With regards to our hypothesis, we could confirm H1a (i.e., better performance for tactile stop signals) and H1b (i.e., no difference in general error rates or RTs depending on task condition or stop-signal type), but H1c had to be rejected since the data revealed a worse performance in the SSG as compared to the SST.
However, even though the result was significant, the effect size was small. This may be due to heightened visual fidelity and increased visual processing demands placed on the player as has been argued before (for a discussion see Friehs et al., Citation2020). Nevertheless, importantly, in both basic and gamified task version, the performance was best whenever there was a tactile signal present as indicated by a large effect of Ωp2 = .25. A tactile stop-signal as compared to a purely auditory stop-signal, resulted in a significantly better performance and notably the audio-tactile condition added no additional performance boost. These results are in line with previous studies investigating the influence of visual distractors on stopping performance (Verbruggen, Stevens, et al., Citation2014). Results show that perceptually distracting stimuli impair stopping and general reaction speed (see also Wessel & Aron, Citation2014). These ideas are in line with the capacity sharing account (Verbruggen & Logan, Citation2015), which states that as cognitive demands increase (e.g., via selective and more complex stopping rules, low discriminability, or intensity of the stop-signal), the processing rates for individual stimuli decrease and RTs are slowed. Additionally, it was proposed that stopping as a form of action control is also dependent on sensory processing; or put differently, detecting the stop-signal is the first step towards successful inhibition (Verbruggen, McLaren, et al., Citation2014). An example of this can be a player in a video game that enters a fight, in which at any given moment a lot of information is presented on screen. A player has to select the attack best suited for the current situation, discriminate the movements of the own character and that of the enemy against the background, and potentially block, or evade an enemy attack which may entail aborting the own attack. If a cue, indicating a need to change the behavior, is highly salient it is easy to identify. Thus, a tactile stop-signal may increase the likelihood of a player being able to notice thew warning signal as compared to just another visual on-screen indicator.
With regards to the subjective experience during the task, the data revealed a higher enjoyment of the game version as measured by the Intrinsic Motivation Inventory, thereby confirming H2a (replicating Friehs et al., Citation2020). However, H2b had to be rejected because participants indicated in the present study that they achieved a stronger flow-state in the basic task version as opposed to the gamified version. This is in direct contrast to previous results (Friehs et al., Citation2020).
Although the results indicate that participants experienced a deeper flow state in the basic version, the results need to be carefully judged. First, the flow scale used in the present study was different as compared to the previously used scale and the overall reliability of the scale was lower. This may indicate an unstable effect or a lack of fit between the sample and scale. Second, the button presses with the left and right hand on the controller may map better on the directional arrows as compared to the pointing fairy. Thus, less additional resources for a translation of visual information into meaningful action may have been required in the basic version.
In sum, these results show that the SSG has differential effects on experience. Notably, while motivation was enhanced for the SSG, the flow experienced was reduced in the same task. This result is in partial contrast to previous research (Friehs et al., Citation2020) and may be due to the change in input method (from keyboard to controller) or the change in the specific flow-scale used.
5. Practical implications
User interface designers and game designers have always been challenged to balance the amount of information communicated to their users while interacting with the application or the game. Our results show that haptic feedback can be an additional tool to communicate information efficiently to the user. The positive echo about the haptic feedback channels implemented in the PlayStation 5 show that gamers welcome these additional haptic stimulations. Also, other areas of interface design benefit from the usage of haptic feedback, such as the design of car interfaces (Kern et al., Citation2009). Depending on the hardware’s limitation and layout (e.g., a game pad versus a steering wheel), designers may use distinctive characteristics of the haptic feedback to communicate information to the user. However, it is essential to balance out communication through other senses but also noise produced through the environment (Warnock et al., Citation2011). Overall, our results encourage designers to explore haptic feedback as a fast communication channel between the user and the interface.
6. Conclusion
In sum, three conclusions can be drawn from our data. First, that a tactile stop-signal or the addition of a tactile stop-signal in an otherwise visual reactive response inhibition task leads to better performance. Notably, this cannot only be due to a mismatch of stop- and go-modalities, as auditory stop-signals were worse compared to tactile ones. Second, the impact of increased visual fidelity on performance remains unclear and future research may investigate this more systematically. Third, simple gamification (e.g., increasing visual fidelity and adding story elements) can result in a heightened experience for the participants.
Acknowledgements
We thank the other students of M7 for their support.
Disclosure statement
The authors have no conflict of interest to declare.
Data availability statement
All data can be accessed free of charge at https://osf.io/y7b8u/.
Additional information
Funding
Notes on contributors
Nikola Markiewicz
Nikola Markiewicz Bachelor Student at the University of Twente (NL). This publication is a direct result of a study project.
Miruna Russa
Miruna Russa Bachelor Student at the University of Twente (NL). This publication is a direct result of a study project.
Annemiek Fokkens
Annemiek Fokkens Research associate at the Psychology of Conflict, Risk and Safety Section at the University of Twente (NL). Formerly employed at the Ministry of Justice and Security in the Netherlands.
Martin Dechant
Martin Dechant Lecturer in Digital Mental Health at the University College London Interaction Center (UK).
Maximilian A. Friehs
Maximilian A. Friehs Assistant Professor at University of Twente (NL). Visiting Researcher at the Max-Planck Institute for Human Cognitive and Brain Sciences (DE) and the University College Dublin (IRE).
Notes
1 37 people were initially recruited in total but 13 had to be excluded for various reasons. See Data Reduction section for more details on the process.
2 An ordinary ANOVA or ANCOVA yields the same pattern of results as compared to the GLM approach. F values computed using Type III Analysis of Variance with Satterthwaite’s method. Ωp² was used instead of ηp² because it is less biased for mixed effects models. However, in our case, both yield the same pattern of results.
References
- Bates, D., Mächler, M., Bolker, B., & Walker, S. (2015). Fitting linear mixed-effects models using lme4. Journal of Statistical Software, 67(1), 1–48. https://doi.org/10.18637/jss.v067.i01
- Beland, L.-P., & Murphy, R. (2016). Ill communication: Technology, distraction & student performance. Labour Economics, 41(C), 61–76. https://doi.org/10.1016/j.labeco.2016.04.004
- Bowman, D. A., & McMahan, R. P. (2007). Virtual reality: How much immersion is enough? Computer Magazine, 40(7), 36–43. https://doi.org/10.1109/MC.2007.257
- Brewster, S., Chohan, F., Brown, L. (2007). Tactile feedback for mobile interactions. Proceedings of the SIGCHI Conference on Human Factors in Computing Systems (pp. 159–162). https://doi.org/10.1145/1240624.1240649
- Deterding, S., Dixon, D., Khaled, R., Nacke, L. (2011). From Game Design Elements to Gamefulness: Defining “Gamification.” Proceedings of the 15th International Academic MindTrek Conference: Envisioning Future Media Environments, MindTrek 2011. https://doi.org/10.1145/2181037.2181040
- Engeser, S., & Rheinberg, F. (2008). Flow, performance and moderators of challenge-skill balance. Motivation and Emotion, 32(3), 158–172. https://doi.org/10.1007/s11031-008-9102-4
- Friehs, M. A., Dechant, M., Schäfer, S., & Mandryk, R. L. (2022). More than skin deep: About the influence of self-relevant avatars on inhibitory control. Cognitive Research, 7(1), 31. https://doi.org/10.1186/s41235-022-00384-8
- Friehs, M. A., Dechant, M., Vedress, S., Frings, C., & Mandryk, R. L. (2020). Shocking advantage! Improving digital game performance using non-invasive brain stimulation. International Journal of Human-Computer Studies, 148(2), 102582. https://doi.org/10.1016/j.ijhcs.2020.102582
- Friehs, M. A., Dechant, M., Vedress, S., Frings, C., Mandryk, R. L., Mandryk, L. Regan, & Mandryk, R. L. (2020). Effective gamification of the stop-signal task: Two controlled laboratory experiments. JMIR Serious Games, 8(3), e17810. https://doi.org/10.2196/17810
- Gatti, E., Pittera, D., Berna Moya, J., & Obrist, M. (2017). Haptic rules! Augmenting the gaming experience in traditional games: The case of foosball. 2017 IEEE World Haptics Conference (WHC) (pp. 430–435). https://doi.org/10.1109/WHC.2017.7989940
- Goncalves, G., Melo, M., Vasconcelos-Raposo, J., & Bessa, M. (2020). Impact of different sensory stimuli on presence in credible virtual environments. IEEE Transactions on Visualization and Computer Graphics, 26(11), 3231–3240. https://doi.org/10.1109/TVCG.2019.2926978
- Horberry, T., Anderson, J., Regan, M. A., Triggs, T. J., & Brown, J. (2006). Driver distraction: The effects of concurrent in-vehicle tasks, road environment complexity and age on driving performance. Accident Analysis and Prevention, 38(1), 185–191. https://doi.org/10.1016/j.aap.2005.09.007
- Jeong, S., Yun, H. H., Lee, Y., & Han, Y. (2023). Glow the buzz: A VR puzzle adventure game mainly played through haptic feedback [Paper presentation]. Extended Abstracts of the 2023 CHI Conference on Human Factors in Computing Systems (pp. 1–6). https://doi.org/10.1145/3544549.3583827
- Kern, D., Marshall, P., Hornecker, E., Rogers, Y., & Schmidt, A. (2009). Enhancing navigation information with tactile output embedded into the steering wheel. In H. Tokuda, M. Beigl, A. Friday, A. J. B. Brush, & Y. Tobe (Eds.), Pervasive computing (Vol. 5538, pp. 42–58). Springer. https://doi.org/10.1007/978-3-642-01516-8_5
- Kirsten, H., Dechant, M., Gibbons, H., & Friehs, M. A. (2023). Tasting inhibition: A proof-of-concept study of the food stop-signal game. Progress in Brain Research, 279, 57–80. https://doi.org/10.1016/bs.pbr.2022.12.002
- Koessmeier, C., & Büttner, O. B. (2021). Why are we distracted by social media? Distraction situations and strategies, reasons for distraction, and individual differences. Frontiers in Psychology, 12, 711416. https://doi.org/10.3389/fpsyg.2021.711416
- Kulshreshth, A., Schild, J., LaViola, J. J. (2012). Evaluating user performance in 3D stereo and motion enabled video games. Proceedings of the International Conference on the Foundations of Digital Games (pp. 33–40). https://doi.org/10.1145/2282338.2282350
- Kuznetsova, A., Brockhoff, P. B., & Christensen, R. H. B. (2017). lmerTest package: Tests in linear mixed effects models. Journal of Statistical Software, 82(13), 1–26. https://doi.org/10.18637/jss.v082.i13
- Kyriazos, T. A., Stalikas, A., Prassa, K., Galanakis, M., Flora, K., & Chatzilia, V. (2018). The flow short scale (FSS) dimensionality and what MIMIC shows on heterogeneity and invariance. Psychology, 09(06), 1357–1382. https://doi.org/10.4236/psych.2018.96083
- Lang, A. (2000). The limited capacity model of mediated message processing. Journal of Communication, 50(1), 46–70. https://doi.org/10.1111/j.1460-2466.2000.tb02833.x
- Lemmens, P., Crompvoets, F., Brokken, D., Van Den Eerenbeemd, J., & De Vries, G.-J. (2009). A body-conforming tactile jacket to enrich movie viewing. World Haptics 2009 - Third Joint EuroHaptics Conference and Symposium on Haptic Interfaces for Virtual Environment and Teleoperator Systems (pp. 7–12). https://doi.org/10.1109/WHC.2009.4810832
- Liebl, A., Haller, J., Jödicke, B., Baumgartner, H., Schlittmeier, S., & Hellbrück, J. (2012). Combined effects of acoustic and visual distraction on cognitive performance and well-being. Applied Ergonomics, 43(2), 424–434. https://doi.org/10.1016/j.apergo.2011.06.017
- Normand, J.-M., Giannopoulos, E., Spanlang, B., & Slater, M. (2011). Multisensory stimulation can induce an illusion of larger belly size in immersive virtual reality. PLoS One, 6(1), e16128. https://doi.org/10.1371/journal.pone.0016128
- Pashler, H., & Wagenmakers, E. J. (2012). Editors’ introduction to the special section on replicability in psychological science: A crisis of confidence? Perspectives on Psychological Science, 7(6), 528–530. https://doi.org/10.1177/1745691612465253
- Ramautar, J. R., Kok, A., & Ridderinkhof, K. R. (2006). Effects of stop-signal modality on the N2/P3 complex elicited in the stop-signal paradigm. Biological Psychology, 72(1), 96–109. https://doi.org/10.1016/j.biopsycho.2005.08.001
- Rheinberg, F., Vollmeyer, R., & Engeser, S. (2016). Flow Short Scale, [dataset]. https://doi.org/10.1037/t47787-000
- Ryan, R. M., & Deci, E. L. (2000). Self-determination theory and the facilitation of intrinsic motivation, social development, and well-being. The American Psychologist, 55(1), 68–78. https://doi.org/10.1037/0003-066X.55.1.68
- Scott, J. J., & Gray, R. (2008). A comparison of tactile, visual, and auditory warnings for rear-end collision prevention in simulated driving. Human Factors, 50(2), 264–275. https://doi.org/10.1518/001872008X250674
- Sharek, D., & Wiebe, E. (2011). Using flow theory to design video games as experimental stimuli. Proceedings of the Human Factors and Ergonomics Society Annual Meeting, 55(1), 1520–1524. https://doi.org/10.1177/1071181311551316
- Stothart, C., Mitchum, A., & Yehnert, C. (2015). The attentional cost of receiving a cell phone notification. Journal of Experimental Psychology. Human Perception and Performance, 41(4), 893–897. https://doi.org/10.1037/xhp0000100
- Symeonidis, S. (2014). The use of tactile feedback for mobile devices. https://www.academia.edu/6356819/The_use_of_tactile_feedback_for_mobile_devices
- Van Der Schoot, M., Licht, R., Horsley, T. M., & Sergeant, J. A. (2005). Effects of stop signal modality, stop signal intensity and tracking method on inhibitory performance as determined by use of the stop signal paradigm. Scandinavian Journal of Psychology, 46(4), 331–341. https://doi.org/10.1111/j.1467-9450.2005.00463.x
- Verbruggen, F., Aron, A. R., Band, G. P. H., Beste, C., Bissett, P. G., Brockett, A. T., Brown, J. W., Chamberlain, S. R., Chambers, C. D., Colonius, H., Colzato, L. S., Corneil, B. D., Coxon, J. P., Dupuis, A., Eagle, D. M., Garavan, H., Greenhouse, I., Heathcote, A., Huster, R. J., … Boehler, C. N. (2019). A consensus guide to capturing the ability to inhibit actions and impulsive behaviors in the stop-signal task. eLife, 8, e46323. https://doi.org/10.7554/elife.46323
- Verbruggen, F., & Logan, G. D. (2008). Response inhibition in the stop-signal paradigm Successful stopping: Inhibition and performance monitoring. Trends in Cognitive Sciences, 12(11), 418–424. https://doi.org/10.1016/j.tics.2008.07.005
- Verbruggen, F., & Logan, G. D. (2015). Evidence for capacity sharing when stopping. Cognition, 142, 81–95. https://doi.org/10.1016/j.cognition.2015.05.014
- Verbruggen, F., McLaren, I. P. L., & Chambers, C. D. (2014). Banishing the control homunculi in studies of action control and behavior change. Perspectives on Psychological Science, 9(5), 497–524. https://doi.org/10.1177/1745691614526414
- Verbruggen, F., Stevens, T., & Chambers, C. D. (2014). Proactive and reactive stopping when distracted: An attentional account. Journal of Experimental Psychology, 40(4), 1295–1300. https://doi.org/10.1037/a0036542
- Warnock, D., McGee-Lennon, M. R., Brewster, S. (2011). The Impact of Unwanted Multimodal Notifications. Proceedings of the 13th International Conference on Multimodal Interfaces (pp. 177–184). https://doi.org/10.1145/2070481.2070510
- Wessel, J. R., & Aron, A. R. (2014). Inhibitory motor control based on complex stopping goals relies on the same brain network as simple stopping. NeuroImage, 103, 225–234. https://doi.org/10.1016/j.neuroimage.2014.09.048
- Xu, J., Lio, A., Dhaliwal, H., Andrei, S., Balakrishnan, S., Nagani, U., & Samadder, S. (2021). Psychological interventions of virtual gamification within academic intrinsic motivation: A systematic review. Journal of Affective Disorders, 293, 444–465. https://doi.org/10.1016/j.jad.2021.06.070