
Abstract
Over-trusting AI systems can lead to complacency and decision errors. However, human and system variables may affect complacency and it is important to understand their interplay for HCI. In our experiment, 90 participants were confronted with traffic route problems guided by AI recommendations and thereby assigned to either a transparent system providing reasons for recommendations or a non-transparent system. We found transparent systems to lower the potential to alleviate workload (albeit not to neglect monitoring), but to simultaneously foster actual complacent behavior. On the contrary, we found performance expectancy to foster the potential to alleviate workload, but not complacent behavior. Interaction analyses showed that effects of performance expectancy depend on system transparency. This contributes to our understanding how system- and person-related variables interact in affecting complacency and stresses the differences between dimensions of complacency and the need for carefully considering transparency and performance expectancy in AI research and design.
1. Introduction
Recent advances in machine learning algorithms and computing power have led to an improvement in information technology, which has resulted in an increase in the use of artificial intelligence (AI). AI can assist humans in making informed and optimized decisions during work processes in areas like medicine (Rajpurkar et al., Citation2022) or business (Chen & Lan, Citation2016).
However, a significant challenge arises from the inherent complexity and opacity of AI systems, which can impede successful human-AI collaboration, also known as the “black box” dilemma of AI (e.g., Adadi & Berrada, Citation2018). With the rise of AI and other highly complex systems in various areas of daily lives, not only expert users but increasingly non-experts work with such systems (e.g., Ribera & Lapedriza García, Citation2019). Especially non-experts may lack a deep understanding of how an AI system came to its decision or recommendation, and therefore may uncritically trust in and overly rely on the system leading to suboptimal decisions. This may not only affect critical areas like aviation or medicine but also less risky areas, where a false sense of security leads to a lack of attention and may reduce performance.
Thus, a crucial goal for human-AI collaboration is to empower users to develop well-calibrated trust, avoiding both over-skepticism and uncritical over-reliance on AI systems. Achieving this requires AI systems to be trustworthy and reliable (Barredo Arrieta et al., Citation2020; Glikson & Woolley, Citation2020). However, higher trust will not necessarily result in better understanding of the system or better decision-making. What rather matters is an appropriate calibration of trust—where users’ trust in the system matches its capabilities, promoting appropriate trust in and use of the system, neither over- nor under-trusting the system (Lee & See, Citation2004).
In the absence of an appropriate level of trust, suboptimal decision-making due to over-trust in and over-reliance on the system is a negative side effect of trust, in literature often referred to as “complacency” (Parasuraman & Manzey, Citation2010). People may assume that an automated system will always function flawlessly and may be unprepared to deal with situations when the system fails. They may give up agency and responsibility, and adopt recommendations without critical evaluation (Parasuraman & Riley, Citation1997; Sheridan & Parasuraman, Citation2005). Ultimately, over-trust due to suboptimal monitoring processes and alleviating workload by delegating responsibility to the system (Merritt et al., Citation2019) may lead to performance failures, for example, when people neglect monitoring the traffic when using driver assistance systems (Dunn et al., Citation2019).
Recent research has increasingly emphasized the human side of human-AI collaboration, aiming to provide a comprehensive understanding of how both system and user factors interact in the calibration of trust and to identify mechanisms to prevent over-reliance and complacency while promoting successful human-AI collaboration. Factors related to system transparency (e.g., Molina & Sundar, Citation2022; Shin et al., Citation2020) but also person-related factors like expectancies regarding the system (Amin et al., Citation2014; Wu & Chen, Citation2005; e.g., Zhang et al., Citation2019) may affect trust in and use of technology, and by that, also complacency. Mixed results in research highlight the need for a closer examination of how the interplay of both system and human factors influences shaping trust in human-AI collaboration.
An overarching question is how to design AI systems to prevent complacency while fostering agency and trust. There is still a gap in research regarding an adequate calibration of trust considering system factors (like transparency) and user factors (like performance expectancies), and how they are interrelated and influence complacency in technology. We thus address the question how human-AI collaboration can be supported by designing an AI system in a transparent and understandable way for its users to foster trust and reduce complacency. Therefore, in this paper, we focus on basic mechanisms of transparency (as a system feature) and performance expectancy (as a person-specific variable related to an individual’s perception of technology) and investigate their (interaction) effects on complacency potential and complacent behavior.
1.1. Calibration of trust in human-AI collaboration
When people work with AI or other complex systems, trust is a core feature that influences the success of their collaboration and is extensively discussed on a societal and socio-political level (European Commission, Citation2019) and in research (Bach et al., Citation2022; e.g., Glikson & Woolley, Citation2020; Shin et al., Citation2020).
There are various models of trust that have been increasingly discussed in the context of the use of technologies (including AI) in recent years. For example, Vorm and Combs (Citation2022) review three well-known models on trust: Mayer’s Integrated Model of Organizational Trust (Mayer et al., Citation1995), Lee and See’s model of Trust in Automated Systems (Lee & See, Citation2004), and Hoff and Bashir’s Trust in Advanced Systems model (Hoff & Bashir, Citation2015). In their model, Vorm and Combs (Citation2022) suggest integrating trust and transparency as key elements in technology use and acceptance. These three reviewed models have two things in common. First, all of them refer to system and person factors, as well as context or situational factors as drivers in the formation of trust. Second, a conceptual distinction can be made between trust as an individual predisposition and trust as actual manifested behavior (in the form of relying on the technology). Similarly, for this paper, we adopt the differentiation between over-trust as an individual predisposition and (over)reliance as behavioral manifestation. Distinguishing trust as attitude and behavior stresses that observable behavior—use or non-use of a system—is not based on trust alone but can be influenced by other factors such as situational awareness or workload (Bahner, Citation2008; Lee & See, Citation2004).
For successful and meaningful use of (and collaboration with) a complex system, users need to understand and trust the system output (Barredo Arrieta et al., Citation2020). An adequate calibration of trust is necessary to ensure that users accurately judge the reliability of such systems. According to Lee and See (Citation2004), adequately calibrated trust is when users’ trust matches the system’s capabilities and leads to appropriate usage. This is to be distinguished from over-trust (i.e., trust exceeding the system’s capabilities) and distrust (i.e., trust falling short of the system’s capabilities). Both, too high or too low trust can have negative consequences. Distrust may result in disuse of a system, while over-trust can lead to misuse when users overly rely on the system and make erroneous decisions as they blindly or uncritically follow system recommendations, referred to in literature as “complacency” (Parasuraman & Manzey, Citation2010).
1.2. Complacency
Historically, the term “complacency” is rooted in the aviation sector and describes a lack of monitoring automation in the aircraft cockpit and its resulting risks and performance failures (Bahner, Citation2008; Wiener, Citation1985). Despite the lack of a universally accepted definition (for a discussion, see Bahner, Citation2008), for the occurrence of complacency, three factors seem to be central: (1) a human operator controls an automated system; (2) the frequency of control behavior is suboptimal; and (3) suboptimal control leads to performance failures (Parasuraman & Manzey, Citation2010). Thereby, complacency can be understood as a feature of human-machine interaction that is related to over-trust in the functional and performance capabilities of automation (Merritt et al., Citation2019). Other definitions argue that not only the operator is at fault when errors occur but that also system characteristics play a role considering the allocation of attention shifting between concurring manual and automated tasks as a eutactic and rather meaningful attention strategy (Moray, Citation2003). In high-risk contexts, individuals often need to monitor multiple tasks simultaneously, and thus making it rather a strategic decision where to focus attention than a monitoring failure. Complacency thus may not only depend on the user but also on system and contextual factors.
Similar to the models on trust (see Section 1.1), on a conceptual level, complacency can be described as an individual behavioral tendency and the actual manifested behavior, influenced by factors of the system, the operator, and the context (Bahner, Citation2008; Merritt et al., Citation2019). The framework of complacency by Bahner and Manzey (Bahner, Citation2008; Manzey & Bahner, Citation2005) describes the relationship of complacency potential (as behavioral tendency) and complacency behavior (as manifested behavior), and its influencing factors. It puts forward person, automation, and context features affecting complacency as well as a feedback loop based on behavioral consequences. Thereby, complacent behavior is preceded by the tendency for complacent behavior (complacency potential), the underlying propensity for suboptimal monitoring of automation.
Complacency potential differs inter-individually, meaning that in relation to automation features, some individuals develop a stronger automation-induced propensity to over-trust (i.e., a higher complacency potential) than others (Merritt et al., Citation2019; Parasuraman & Manzey, Citation2010). Looking at the characteristics of complacency potential, two sub-facets can be distinguished: the tendency to neglect monitoring activities and the tendency to alleviate workload by delegating responsibility to the system (Merritt et al., Citation2019). At the behavioral level (complacency behavior), complacency is reflected by inadequate human monitoring of automated systems which can lead to overlooking of critical system conditions and thus, overly relying on the system and making performance failures (Bahner, Citation2008). For the purposes of our study, we refer to Bahner (Citation2008) and Merritt et al. (Citation2019) and define complacency behavior as a behavior that is reflected by an inadequate monitoring of automated systems, is associated with an over-trust and over-reliance on automation and can subsequently lead to the overlooking of critical system conditions (Bahner, Citation2008). We refer to complacency potential as the individual propensity to delegate workload and neglect monitoring activities (Merritt et al., Citation2019).
According to the framework of complacency, complacency can be influenced by automation features, person features, and situational features (Bahner, Citation2008; Manzey & Bahner, Citation2005; Parasuraman & Manzey, Citation2010). These factors can shift the user’s attention either toward or away from monitoring the system’s performance. (1) Automation (or system) features include the reliability of the system, its predictability, and its transparency. For example, complacency may be reduced by designing systems in a transparent and understandable way (Wright et al., Citation2020). (2) Person features include characteristics of individuals that can influence complacency potential and ultimately behavior, like technology-related attitude (Singh et al., Citation1993b), the tendency to cognitive errors, or boredom (Prinzel et al., Citation2001). (3) Situational features include concurring tasks or mental workload, for example, competing tasks in multitasking situations are cited as particular triggers of complacency behavior in the situational context (Bahner, Citation2008; Manzey & Bahner, Citation2005; Parasuraman & Manzey, Citation2010) as especially in such situations, users’ attention can shift easily between different tasks.
When investigating the role of complacency potential and behavior, an adequate assessment of complacency is crucial for explaining their relationship. Self-reported behavior and exhibited behavior do not necessarily coincide (e.g., Dang et al., Citation2020). For example, Holt and Laury (Citation2002) show that users are not always aware how they would behave in authentic situations (e.g., regarding risk-aversion) and we can therefore assume that contextual features may influence the manifestation of actual behavior. Consequently, when analyzing the relationship between complacency potential and behavior, besides the theoretical-conceptual level, methodological decisions must also be carefully considered. This concerns the operationalization of complacency potential and behavior and the validity of the measurement instruments. Complacency potential is usually assessed via self-report (e.g., Complacency Potential Rating Scale, CPRS, Singh et al., Citation1993a; Automation-Induced Complacency Potential-Revised Scale, AICP-R, Merritt et al., Citation2019). Merritt et al. (Citation2019) show that the two theoretically assumed components (monitoring and alleviating workload) are distinct in representing different facets of complacency potential, but that the subscale monitoring seems to be better at predicting estimated complacency behavior in hypothetical situations involving automated system use. Because adequate assessment of complacency potential is scarce, one additional aim of this study is to use the AICP-R by Merritt et al. (Citation2019) to add to the discussion of the assessment of complacency potential.
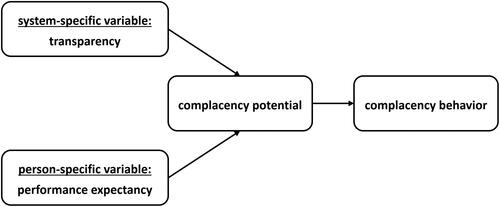
The framework of complacency has not been investigated sufficiently (Bahner, Citation2008). In our study, we contribute to empirically testing the framework and focus on transparency as a system-specific variable and individual performance expectancy as a person-specific expectancy regarding the system. While not strictly merely a person factor, performance expectancy incorporates the person-specific perception of a system. We also aim at contributing to a better understanding of the construct complacency and therefore focus both complacency potential and behavior ().
Figure 1. Conceptual overview of the relationship between transparency (as a system-specific variable), performance expectancy (as a person-specific variable), and complacency (as an individual behavioral tendency and manifested behavior) as central aspects of this paper.
In research on complacency, scenarios and tasks are traditionally associated with three aspects: (1) The system is used in a critical domain (e.g., aviation safety, medicine), and there can be severe consequences if errors occur. (2) The workload is usually very high, often involving concurrent or secondary tasks that compete for cognitive resources when switching attention. (3) The system and task require highly specialized users, and the system is often not intuitively usable, requiring expertise through training or education. However, people’s daily lives are increasingly influenced by highly complex systems, often based on machine learning or AI, which aim to assist in various everyday activities and decision-making and are often designed for easy and intuitive usage. Thus, in contrast to previous research, we will focus on systems that (1) comprise non-critical domains that are (2) not associated with a particularly high workload and (3) generally occur in everyday situations where no specialized knowledge is required.
1.3. System and human factors regarding trust and complacency
Models of trust and complacency provide an understanding for the relationship between system, user, and context factors, as well as the relationship between individual predispositions and actual behavior. These models emphasize the importance to understand the multifaceted construct of trust, including—in its negative form—complacency, which can result from a complex interaction between these factors.
Recently, the debate about the concept of transparent, understandable and trustworthy systems gained renewed attention, and interdisciplinary research tried to bring more clarity into concepts like transparency, understandability, explainability, interpretability, or comprehensibility (Adadi & Berrada, Citation2018; Barredo Arrieta et al., Citation2020; e.g., Speith, Citation2022). A core issue of this debate concerns the duality of human and system perspectives. For human-AI-interaction, there is not only the more or less transparent system, but also the system users with their diverse backgrounds and their perception of the system’s comprehensibility to be considered when investigating dimensions of trust in and usage of technology. Thus, more recent human-centered research focusses on understanding of a system from the user perspective (Holzinger et al., Citation2020; e.g., Lopes et al., Citation2022). A deeper understanding of the effects of highly complex and automated systems on trust and under which circumstances complacency may occur requires integrating findings from psychology and computer science and to investigate system, person, context factors as well as their interaction.
1.3.1. System-specific variable: transparency
There has been much debate and research on the role of transparency in the context of AI and similar highly complex systems in recent years (Barredo Arrieta et al., Citation2020; e.g., Larsson & Heintz, Citation2020; Shin et al., Citation2020). Transparency as a system-specific variable is considered to be one of seven key requirements for realizing trustworthy AI (European Commission, Citation2019). It is thereby regarded as an antecedent of trust in a system (Shin et al., Citation2020), and it is thus assumed that trust increases with a higher level of transparency (e.g., Mercado et al., Citation2016).
Recently, research focused on the role of understandability as an important feature of AI systems, which includes aspects like interpretability, explainability, or transparency. For system understandability to result in human understanding, the system needs to be transparent (Adadi & Berrada, Citation2018). The underlying idea is to foster trust in AI systems by designing them in a transparent way, often associated with (self-)explainable AI (xAI, Barredo Arrieta et al., Citation2020). Thereby, one approach to enhance trust through transparency is by providing explanations or additional information regarding the system’s output, functioning, or reasoning (Adadi & Berrada, Citation2018). However, instead of merely striving for higher trust, it is a properly calibrated trust that is critical for successful human-system collaboration.
Research findings are mixed, indicating that transparency can have both positive and negative effects on trust. On the one hand, empirical studies provide evidence that transparent and explainable systems positively affect trust (Molina & Sundar, Citation2022; e.g., Shin et al., Citation2020). On the other hand, empirical studies also indicate that higher transparency may negatively affect trust, and induce complacency or overreliance in automation (Anaraky et al., Citation2020; Eiband et al., Citation2019). Thus, it seems crucial to carefully calibrate transparency to foster understanding and reduce complacency when interacting with AI.
In transparent systems, various parts of the system are made traceable (e.g., the data set or the algorithm that lead to system decisions) enabling identification of reasons why an AI decision is correct or erroneous (Adadi & Berrada, Citation2018; European Commission, Citation2019). A system thus can be seen as transparent if it provides additional information that intents to make the system and its underlying process or reasoning understandable and can thus help human users to understand the black box (Chen et al., Citation2018; Fallon & Blaha, Citation2018). For example, Lee et al. (Citation2023) manipulated transparency by providing information about the user data the algorithm utilized for learning, and found that transparency (mediated by perceiving the system as a helpful social actor) led to higher trust and intention to use the system. Providing transparency led to higher understanding of and (attitudinal and behavioral) trust in the system (Molina & Sundar, Citation2022).
Research regarding the relationship between transparency of a system and users’ complacency is ambiguous and empirical evidence confirms both negative and positive effects of system transparency on complacency (e.g., Anaraky et al., Citation2020; Bussone et al., Citation2015; Eiband et al., Citation2019; Wright et al., Citation2020). This indicates that a careful calibration of transparency is needed for successful human-AI collaboration. In the Situational Awareness-based Agent Transparency (SAT) model, Chen et al. (Citation2018) refer to the reasoning component as not only affecting the understanding of the system’s goals, actions, and projections, but also the calibration of trust. The reasoning component is defined as providing insight into its consideration process and the conditions on which it bases its output or decisions. Based on the transparency levels of the SAT model, Wright et al. (Citation2020) investigated how different levels of access to the reasoning behind an automated system affect users’ ability to interact effectively with the system. Within a navigation task assisted by intelligent agents, participants were provided with varied access to the agents’ reasoning and received either no transparency on agent reasoning, or explanations in form of reasons for suggested route change, or time-related information to get access about timeliness of agent information. The authors found transparency to have a negative effect on trust in automation, and a higher transparency to have an inhibitory effect on individuals’ complacency behavior in a multitasking situation. Specifically, results of the study showed that complacency was highest when no explanation of agent reasoning or when time-related information was provided, while with moderate transparency (i.e., when explanations as reasons for route changes were provided), complacency was reduced. This U-shaped relationship indicates that transparency may also have enhancing effects on complacency and thus, may have its limitations (Ananny & Crawford, Citation2018). Research on “mindless compliance” shows that humans rather unconsciously or automatically rely on provided information if it seems plausible enough (Langer et al., Citation1978). Similarly, Anaraky et al. (Citation2020) confirm these findings showing that participants follow initial system suggestions regardless of the content of provided justifications. In our context, compliance is comparable to complacency as both concepts describe that individuals follow information without actively reflecting on the provided information. Transferring this to transparency via explanations, this means that explanations may not only reduce but also enhance complacency.
In sum, in this paper, similar to Wright et al. (Citation2020), we refer to transparency as a system-specific variable in the form of additional information via an explanation that provides insights into the reasoning behind a system’s recommendation with the goal to make the system and its underlying reasoning process understandable for users. Since there are research findings that, on the one hand, argue for an increase in complacency due to transparency of a system, and, on the other hand, for a reduction in complacency, one goal of this paper is to bring more clarity into the relationship between transparency and complacency.
1.3.2. Person-specific variable: Performance expectancy
Besides system-specific features (like transparency), person-related variables affect human interaction with, trust in and acceptance of technology. These comprise, for example, users’ experience with technology in general (Marangunić & Granić, Citation2015), their different needs and capabilities when using technology (Putnam & Conati, Citation2019) like information processing capacities or prior knowledge, and how these factors are related to situational or context features (e.g., tasks demanding different amounts of workload, or shifting attention between concurrent tasks). Complacency thus may also depend on person-specific variables like technology-related attitudes (Bahner, Citation2008; Manzey & Bahner, Citation2005) or individual expectancies regarding the interaction with the system.
Users may have specific expectations regarding a system, for example regarding its performance and ease of use (Davis, Citation1989; Venkatesh et al., Citation2003, Citation2012). Such system-related expectancies can be subsumed under the construct of technology acceptance. Technology acceptance is defined as “the demonstrable willingness within a user group to employ information technology for the tasks it is designed to support” (Dillon, Citation2001, p. 5). Models of technology acceptance like the Technology Acceptance Model (TAM, Davis, Citation1989) and its extensions, the Unified Theory of Acceptance and Use of Technology (UTAUT, Venkatesh et al., Citation2003; UTAUT-2, Venkatesh et al., Citation2012), explain how person- and system-specific features affect the intention to use a technology and are still a valid way to access technology acceptance (Al-Emran & Granić, Citation2021).
In the UTAUT-2 model (Venkatesh et al., Citation2012), the term performance expectancy is introduced for perceived usefulness. Extensions of the TAM additionally assume trust (and over-trust) to play a crucial role in technology use (Holden & Karsh, Citation2010) and empirical research reveals a positive relationship between performance expectancy and initial trust in systems such as automated vehicles or mobile technology (Amin et al., Citation2014; Zhang et al., Citation2019). Regarding interaction with an AI system, Choung et al. (Citation2021) show that users who evaluate a system as useful and easy to use, report a higher intention to use it. Research on effects of perceived ease of use on behavioral intention, however, often reports insignificant findings (Holden & Karsh, Citation2010; Wu & Chen, Citation2005). Following up on these issues and considering the aim to generalize the results to other technologies, we focus on the effect of performance expectancy on complacency. Please note that we will exclusively use the term “performance expectancy” as used in the UTAUT-2 for better readability (which corresponds to “perceived usefulness” as used in the TAM). Although technology acceptance and its component performance expectancy are generally perceived as desirable aspects of human-computer interaction, it stands to reason that they may also relate to complacency when this trust is overrated.
In a more recent extension of technology acceptance, the Intelligent Systems Technology Acceptance Model (ISTAM, Vorm & Combs, Citation2022) incorporates transparency, trust, and acceptance into the model and explicitly relates to the context of intelligent systems. Though not validated yet, it offers a perspective for future research on the interrelationship of system factors (like transparency), user factors (like performance expectancy), and the calibration of trust, and thus may provide an umbrella for our study.
1.4. Research questions and hypotheses
The aim of the current study is to examine the influence of transparency of AI recommendations (via explanations) on complacency potential, including its subcomponents (neglecting monitoring and alleviating workload), and complacency behavior (following an incorrect recommendation by the system). Further, we investigate the effect of performance expectancy regarding AI systems on complacency and the interaction between transparency and performance expectancy. Relating to the complacency framework (Bahner, Citation2008; Manzey & Bahner, Citation2005), we thus study the role of system- and person-specific variables and their interplay regarding complacency potential and behavior to answer the question: How do system transparency and performance expectancy affect complacency when working with AI recommendations?
1.4.1. Effect of transparency on complacency (hypothesis 1)
Following the framework of complacency (Bahner, Citation2008; Manzey & Bahner, Citation2005), we hypothesize a relationship between complacency potential and behavior, and both to be influenced by system-specific (transparency) and person-specific variables (performance expectancy). Thereby, we firstly hypothesize transparency of AI recommendations to have a negative effect on complacency potential and complacency behavior (high transparency leads to low complacency potential and behavior). Research shows that additional information on a system positively influences human understanding (Fallon & Blaha, Citation2018) and also enhances trust in the system (Barredo Arrieta et al., Citation2020; Lee et al., Citation2023). However, individuals who trust systems may over-rely on these systems and show complacent behavior (Lee & See, Citation2004), therefore, an adequate calibration of trust seems to be relevant for reducing the risk of complacent behavior (Chen et al., Citation2018). One way to calibrate trust (reducing over-trust and complacency) is to enhance transparency of a system (Chen et al., Citation2018; Wright et al., Citation2020), for example via additional information in form of explanations that help to understand system functioning and constraints (Barredo Arrieta et al., Citation2020). However, research shows that transparency may also increase complacency (e.g., Anaraky et al., Citation2020; Eiband et al., Citation2019; Wright et al., Citation2020) and thus, we aim to bring more clarity into the relationship between transparency and complacency. We ultimately expect a transparent system providing additional information about its underlying reasoning to make it easier to detect logical flaws, errors, or inconsistencies between system recommendation and situational requirements. Thus, transparency via explanations might make users more capable to identify inconsistencies, and thus, they may be less prone to over-relying on the system. This low-threshold system feature can encourage individuals to actively engage with the system, triggering monitoring activities because errors are easy to identify. Users may find it more useful to review the systems’ recommendations and monitor its functioning than with a non-transparent system and may also be less inclined to hand over decisions without due diligence. Despite the ambiguity of existing research, we thus hypothesize that transparent systems engage users in more monitoring activities and delegating less workload to the system (less complacency potential) and, therefore, users are less prone to accepting flawed system recommendations (less complacency behavior).
1.4.2. Effect of performance expectancy on complacency (hypothesis 2)
Secondly, we hypothesize performance expectancy to have a positive effect on complacency potential and its subcomponents neglecting monitoring and alleviating workload as well as on complacency behavior. The intention to use a system does not only depend on system-specific variables, but also on person-specific variables like technology-related attitudes (Bahner, Citation2008; Manzey & Bahner, Citation2005) or person-specific expectations regarding a system like performance expectancy. Research shows that individuals who perceive a system as useful (high performance expectancy) have a higher intention to use the system (Choung et al., Citation2021; Venkatesh et al., Citation2012). Further, research reveals a positive relationship between performance expectancy on initial trust (Amin et al., Citation2014; Zhang et al., Citation2019). In line with the above shown relationship between trust and complacency (see hypothesis 1, Lee & See, Citation2004), we expect individuals who assume a well performing system to have a higher tendency to trust the system and may even over-trust or over-rely on the system. This may result in a tendency to engage less in monitoring activities and reduce workload by handing it off to the system. Including considerations of the framework by Bahner, (Citation2008; Manzey & Bahner, Citation2005) (see Section 1.2), where complacency potential precedes complacency behavior, a similar effect of performance expectancy on complacency potential can be expected. Thus, we expect individuals who perceive an AI system as useful (high performance expectancy) put more trust in its recommendations, which may affect complacency potential and behavior alike.
1.4.3. Interaction effect of performance expectancy and transparency on complacency (hypothesis 3)
Thirdly, we hypothesize the effect of performance expectancy on complacency potential and its subcomponents as well as complacency behavior to be less pronounced if the system is transparent (interaction effect). In a non-transparent system, no system features are implemented to enhance understanding the system and individuals may be rather guided by person-specific expectations regarding the system as a default mode of interacting with the system. In this scenario, the system does not support checking for inconsistencies or otherwise evaluating whether to trust the system. A transparent system, however, may ease checking system recommendations for errors. This may make users more prone to monitor the system’s performance and rely less on personal expectations or positions towards the technology. Thus, while we hypothesize performance expectancy to positively affect complacency when interacting with transparent as well as non-transparent systems (see hypothesis 2), we expect the effect to be weaker for transparent systems.
1.4.4. Explorative analyses: Relationship between complacency potential and complacency behavior
Further, from a conceptual as well as methods-oriented perspective, we take an exploratory look at the relationship between complacency as a behavior (assessed using behavioral data) and potential (assessed via self-report). Our exploratory research questions are thus: How do different complacency concepts (i.e., complacency potential and complacency behavior) relate (EQ1)? Can the subscales of complacency potential (i.e., (neglecting) monitoring and alleviating workload) be confirmed (EQ2)?
2. Methods
To answer our research questions, we conducted a two-groups between-subject online experiment, in which participants had to decide upon a traffic route supposedly guided by an AI system. However, to systematically study the psychological effects of AI guidance, we prepared all information beforehand and used a fixed algorithm (not a real AI system). The study was approved by the local ethics committee (study ID: psychmeth_2021_HKI-05_36, ethics vote: 2201PFGE5211).
2.1. Sample, design, and procedure
A total of 146 participants were recruited via social media and mailing lists of whom 104 completed the study. They were not rewarded for participation. Average completion time was about 14 minutes (M = 13.98, SD = 17.59). After exclusion of 14 participants (3 had previously participated in a similar study; 11 had too short/long completion times), the final sample consisted of N = 90 participants with a mean age of 33.77 (SD = 12.74, 18–65 years), 40 of which identified as women, 50 as men. Most participants reported high- or middle-school as highest educational degree (34.5%), followed by Master-equivalent (31.1%) or Bachelor-equivalent (25.6%), or other academic degrees (8.9%). 92.2% reported having a driver’s license. All participants stated that they conducted the study conscientiously. An a-priori power analysis using G*Power for the main effects resulted in a sample size of N = 94 to detect moderate to large effects (Faul et al., Citation2007). A post-hoc power analysis for interaction analyses showed that our moderation analysis with the sample size of N = 90 and a large sized effect f = 0.51 (Cohen, Citation1992) achieved a power of 99.79%.
The experiment was a one-factorial between-subject design. The two-level randomized between-subject factor was the transparency of the AI recommendation with explanatory information provided only in the transparency condition (T+), but not in the control condition (T−). Conditions did not differ regarding possession of a driver’s license. Instructions, materials, procedure, and timeframe were pre-tested in a small pilot study (N = 8), and instructions adapted accordingly.
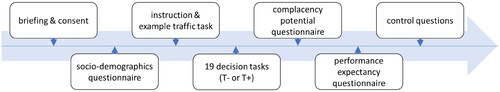
The study was conducted in an online setting with instructions provided visually via computer (see for overview). After participants were briefed and had given consent, they were asked to provide sociodemographic information. They then received instructions on the traffic route tasks (see Section 2.2) and an example task before completing a set of 19 traffic route tasks guided by recommendations provided by a (bogus) AI system. Here, participants received additional explanatory information according to experimental condition (T+/T−). Afterwards, they answered questionnaires regarding complacency potential, technology acceptance, and further questionnaires including two control questions asking about a driver’s license (“Do you have a driver’s license?” [yes vs. no]) and whether participants had trusted the AI blindly (“Did you trust the AI blindly?” [yes vs. no]). This latter measure was merely used as an indicator of the participants’ perception and interpretation of their own (previous) behavior relating to the specific task rather than a general potential to trust the AI.
Figure 2. Experimental procedure including relevant steps and variables.
2.2. Decision task and manipulation of the independent variable
The task and design of transparency as the independent variable was based on Wright et al. (Citation2020). The decision task consisted of a set of 19 traffic route problems presented in a fixed order, in which participants were provided with a traffic route map and had to select the fastest route from a starting point to a given destination while being assisted by a bogus AI-based recommendation system. Participants were told in the beginning of the study that they were to interact with an AI system and that it was not perfect but supposed to support their decisions.
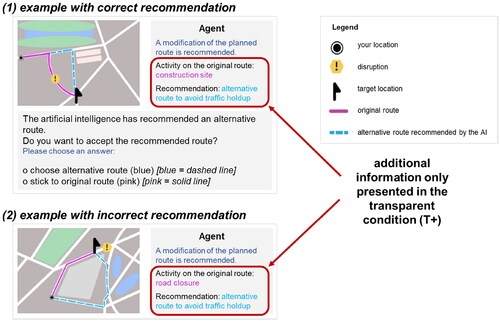
For each task, a traffic map depicted two routes between a starting point and a destination: an initial route (: solid lines) and an alternative route recommended by the AI (dashed lines). In addition, the map showed warning labels for disruptions on the map that caused time delays. The recommendations of the AI system were varied systematically and could be either correct (i.e., the alternative route was the better choice due to a disruption on the initial route) or incorrect (i.e., the initial route was the better choice because the disruption was not actually on the initial route). In total, 15 of the recommendations were correct, four incorrect. Participants could either decide to stick to their initial route or select the alternative route. They did not have a time limit but were instructed to decide on a route as quickly as possible. We recorded the participants’ choices to identify complacent behavior (see Section 2.3.2). They did not receive any feedback.
Figure 3. Traffic problem for correct (1) and incorrect (2) recommendation; comments in italics were added for clarity.
In our study, we used a scenario and task based on Wright et al. (Citation2020), but that diverges from typical research on complacency which often investigates critical domains with high workload and highly specialized users. Instead, we used a system in (1) a non-critical domain (route navigation) that is (2) not associated with a particularly high workload (we used no second task, like monitoring traffic on the road), and (3) generally occur in everyday situations where no specialized knowledge is required (no specific skills for route navigation needed). Our goal is to contribute to complacency research when people interact with AI-assisted recommendation systems in such in these everyday scenarios.
The independent variable was the transparency of the AI recommendation varied by providing (T+) or not providing (T−) additional explanations on the reasons for recommending a specific route change (). While participants in the control condition (T−) did not receive any explanation by the system and had to rely on the traffic map and recommendation for judging the situation, the explanations provided in the transparency condition (T+) consisted of stating the specific reason for (a) the disruption (e.g., road closure, snowfall, accident), and (b) the decision to switch course (e.g., to avoid a traffic jam). The reasons for disruption were pre-defined and not based on AI predictions themselves. While AI is frequently used to detect disruptions based on traffic data, we used the AI to recommend a more suitable traffic route. Like in the study of Wright et al. (Citation2020), we varied the level of transparency participants received. Transparency was intended to provide access to the system’s reasoning (low transparency: no access to system reasoning; high transparency: access to system reasoning via explanations in the form of reasons for suggested route change).
2.3. Measures and variables
While we manipulated system transparency, we assessed complacency and performance expectancy (as predictor for complacency).
2.3.1. Performance expectancy (PE)
Performance expectancy (PE) as a person-specific variable was measured by using the respective technology acceptance subscale based on the UTAUT (Venkatesh et al., Citation2003). The scale for performance expectancy consists of four items (e.g., “I find the system to be useful in my job”) to be answered on a five-point Likert-like scale from strongly disagree (1) to strongly agree (5). We translated the items to German and replaced “system” with “AI” and “job” with “task.” The internal consistency was acceptable (Cronbach’s α = .718). Thus, we used the mean across items as indicator of performance expectancy regarding the AI with high values indicating high performance expectancy.
2.3.2. Complacency (potential and behavior)
Our main dependent variable was complacency, regularly measured either as potential or behavior. However, we argue that both are not merely different measures assessing the same construct but have conceptual differences. While complacency potential assesses a (psychological) tendency of an individual to blindly hand over their tasks to a specific system while neglecting monitoring activities, complacent behavior measures mainly erroneous decisions based on unfounded trust in the system. Thus, the latter indicates that complacency is not an individual decision but also depends on the system-specific feature to fail. In contrast, complacency as a psychological construct should be independent of actual system functioning (albeit not necessarily independent of perceived system functioning). Thus, we measured both independently.
We measured complacency potential using the (revised) Automation-Induced Complacency Potential (AICP-R) scale (Merritt et al., Citation2019), which we translated into German replacing “automation” with “AI.” The AICP-R consists of two subscales with five items each to be answered on a five-point Likert-like scale from strongly disagree (1) to strongly agree (5). The first subscale—alleviating workload (AW)—measures the tendency to delegate work to AI when under high workload conditions (e.g., “When I have a lot to do, it makes sense to delegate a task to the AI.”). Internal consistency was good (Cronbach’s α = .852). Thus, we used the mean across items as an indicator of alleviating workload with high values indicating a high tendency to delegate to the AI. The second subscale—monitoring—measures the tendency to neglect monitoring activities when working with an AI (e.g., “Constantly monitoring an AI’s performance is a waste of time.”). Internal consistency—again—was good (Cronbach’s α = .825). Thus, we again used the mean across items (two needed to be reversed) as indicator of monitoring with high values indicating a high tendency to neglect monitoring. In accordance with this, we renamed the scale “neglecting monitoring” (NM) to avoid confusion (as higher values come with less monitoring). Both subscales together were used as an indicator for complacency, the full ten-item scale also had a good internal consistency (Cronbach’s α = .841).
We additionally measured complacency behavior. Here, we used the behavioral data from the decision tasks. Within the tasks, users were asked whether they wanted to follow the AI’s recommendation. Thereby, we need to differentiate between two conditions: following the AI’s recommendation when it was correct (15 times) and following the recommendation when it was false (4 times) (see section 2.2). In accordance with Wright et al. (Citation2020), we used the frequency with which users followed false recommendations as indicator for complacency. We slightly adapted this mechanism by using the rate with which users followed the erroneous recommendations for better interpretability. Thus, the higher this rate, the higher the complacency (0–100%). Further, to account for different (e.g., random or non-compliant) answer patterns and possible response biases, we contrasted this with the rate of following correct recommendations. Complacency thus can be observed when users follow correct recommendations but also follow incorrect recommendations and both rates are (fairly) high. When both are low, this is an indicator of mistrust or reactance, while following correct and rejecting incorrect recommendations can be interpreted as a healthy level of system monitoring and control. Lastly, following only incorrect (but not correct) recommendations may be interpreted as an issue with understanding the instruction or task compliance.
3. Results
The results were obtained using Jamovi version 2.0.0.0 (confirmatory factor analysis/CFA and descriptive data) and SPSS version 27 (further analysis). In case of violations of assumptions, we used bootstrapping or other robust methods whenever reasonable considering the data structure.
3.1. Descriptive statistics and intercorrelations (EQ1)
shows the descriptive statistics of the variables within the model.
Table 1. Descriptive statistics of tested variables.
shows the intercorrelations between the variables. Correlations were analyzed using Pearson’s r, with values of r ≥ 0.01 indicating a weak, r ≥ 0.03 indicating a moderate, and r ≥ 0.05 indicating a strong correlation (Cohen, Citation1988). Results indicate that transparency (as the between-subjects factor) is significantly and strongly associated with complacency potential and behavior. However, neither of the complacency potential subscales, alleviating workload (AW) nor neglecting monitoring (NM), correlates with actual complacency behavior. Furthermore, 87.8% of the participants reported to not have blindly trusted the system’s recommendation. The answer to this item shows significant and strongly positive correlations with performance expectancy (PE) and complacency potential (full scale and NM, but not AW).
Table 2. Bivariate correlations of main variables (Pearson’s r).
3.2. CFA for the AICP-R scale (EQ2)
Our analysis is based on a relatively new instrument for measuring complacency potential. Thus, we used CFA to assess the dimensionality and construct validity of the Automation-Induced Complacency Potential-Revised scale (AICP-R, Merritt et al., Citation2019). This method allows us to evaluate if a specified number of factors (latent variables) is validly represented by our indicators (observed measures, Brown & Moore, Citation2012). To access the fit of our specified models with empirical data, we used the cut-off criteria (Hu & Bentler, Citation1999). Specifically, values of the Standardized Root Mean Residual (SRMR) < .08 and values of the Root Mean Square Error of Approximation (RMSEA) > .10 indicate a good model fit; Comparative Fit Index (CFI) values > .90 indicate acceptable and values > .95 indicate a good fit with the data.
Additionally, chi-square value divided by degrees of freedom < 3 is an indicator of acceptable model fit (Carmines & McIver, Citation1981). McDonald’s ω was used as measure of reliability, with coefficients > 0.7 indicating acceptable internal consistency (Hayes & Coutts, Citation2020). We use this reliability measure, because when a set of items is congeneric and tau equivalence is not assumed, McDonald’s ω estimates reliability more accurately than Cronbach’s α (for a comprehensive discussion on the issue please refer to Hayes and Coutts, Citation2020).
Three models were calculated to examine the structure of the scale. Model 1 consists of one general complacency factor. By testing this model, we analyze if the scale contains two separate factors or if complacency is better captured with one overarching factor. Model 2 contains two factors forming complacency (NM and AW), and represents the original structure suggested by AICP-R. Lastly, we tested Model 3, which considers only the items of NM with one factor. This third model is tested because Merritt et al. (Citation2019) state that based on their validation results, the two subscales could represent two distinct constructs—of which the factor NM would best predict complacent behavior. Also, the factor NM, adds explanatory power to existing scales such as the Complacency Potential Rating Scale (CPRS, Singh et al., Citation1993a). By testing these three models we make sure that our further analysis uses valid and distinct dimensions of our main construct, complacency.
Model 1 with one general complacency factor shows no acceptable model fit (cf. ). Specifically, the SRMR is above the acceptable value of .08, the RMSEA is above .10, the CFI is below .95, and the relation between the χ2 and the degrees of freedom is above 3. The internal consistency of the one-factor scale (McDonald’s ω) equals .85. Model 2 with the two factors NM and AW, on the other hand, shows an acceptable fit with an internal consistency (McDonald’s ω) of .86 for AW and .83 for NM. The estimated correlation between the two latent factors is significant, but not too high (r = .36) indicating two separate factors that can be viewed as latent dimensions. Model 3 with only the one factor (NM) also shows an acceptable fit with an internal consistency (ω) of .83.
Table 3. Goodness-of-fit of proposed scale structures.
Merritt et al. (Citation2019) suggest considering both factors separately when measuring complacency potential (represented by Model 2). Results of the CFA show that both Model 3 (NM) and Model 2 (two separate factors) show an acceptable model fit. As we expect the dimension of AW to contribute to a better understanding of complacency potential, we chose to use the version of the scale represented by Model 2 and thus consider both subscales to be relevant for complacency potential. shows the factor loadings of the AICP-R (Merritt et al., Citation2019), represented by the used Model 2. Results indicate that all standardized factor loadings (β) are above 0.5, therefore showing sufficient discriminatory power. Furthermore, β values are below 1.0 indicating a problematic Haywood case (Brown, Citation2006). Also, SE values are not too high, indicating reliable estimate values.
Table 4. Unstandardized and standardizes factor loadings for the two subscales alleviating workload (AW) and neglecting monitoring (NM) of the automation-Induced complacency potential-Revised scale (AICP-R); items are re-translated from German.
3.3. Manipulation check
The percentage of accepted recommendations can be treated as an indicator for task understanding. If participants did not understand the difference between correct and incorrect recommendations, they would follow the incorrect recommendations with the same probability as the correct ones. An equal percentage of accepted recommendations would indicate that our task was not suitable to measure complacent behavior. Participants followed 80.1% of correct and only 46.1% of incorrect recommendations, indicating that, overall, participants were able to understand the difference between correct and incorrect recommendations and that the task was thus solvable (despite occurrences of complacent behavior). An exemplary incorrect recommendation is shown in . The disruption is not located on any of the routes. Participants showing non-complacent behavior would therefore identify the recommendation as incorrect and decide in favor of the original (shorter) route. No further manipulation checks were implemented.
3.4. Effect of transparency on complacency (hypothesis 1)
We first tested hypothesis 1 “Transparency negatively affects the complacency potential and its subcomponents neglecting monitoring (NM) and alleviating workload (AW) as well as complacency behavior” using a Welch t-test to test the effects on complacency potential. We found a significant difference between the transparency conditions for the combined complacency potential scale, t(87.30) = 2.07, p = 0.041, d = 0.44. The group presented with a transparent system showed a significantly lower complacency potential (M = 3.17, SD = 0.73) than the group with a non-transparent system (M = 3.46, SD = 0.58), supporting hypothesis 1. To specify the effect of transparency on complacency, we performed a one-way MANOVA for the complacency scale’s subscales. Results showed no significant overall effect, F(2, 87) = 2.49, p = 0.089, ηp2 = .05, Pillai’s Trace = .054, but a significant difference for the subscale AW, F(1, 88) = 2.72, p = 0.031, ηp2 = .05, albeit not for NM, F(1, 88) = 1.52, p = 0.222, ηp2 = .02. AW was lower when working with a transparent (M = 3.74, SD = 0.87) than with a non-transparent system (M = 4.09, SD = 0.59). Due to deviations from normality distribution and homogeneity of variances for alleviating workload, we confirmed the difference with a more robust Welch t-test, t(82.82) = 2.24, p = 0.028, d = .47.
To explore the relationship between transparency and complacency behavior, we performed a repeated measures ANOVA with the between-factor transparency and the within-factor correctness of recommendations. The dependent variable was the rate with which participants followed system recommendations. The ANOVA showed a significant main effect of correctness of recommendations, F(1, 88) = 150.54, p < 0.001, ηp2 = .63, with participants overall following correct recommendations more consequently (80.15%) than incorrect recommendations (46.11%). We also found a main effect of transparency, F(1, 88) = 0.50, p = 0.002, ηp2 = .11, although this cannot be globally interpreted due to the interaction effect. The interaction effect between the correctness of recommendations and transparency was highly significant, F(1, 88) = 29.91, p < 0.001, ηp2 = .25. As shown in , participants interacting with a transparent system differentiated between correct and incorrect recommendations less consequently than participants interacting with a non-transparent system. Thus, in a transparent system, users seem to follow incorrect recommendations more often indicating complacency.
Figure 4. Plotted results of the repeated measures ANOVA testing hypothesis 1 for complacency behavior.
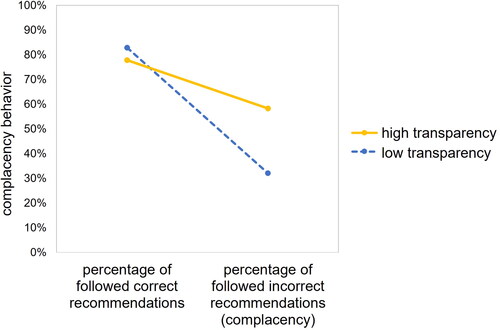
We conducted (bootstrapped) parametric analyses due to the nature of the data (despite not being able to assume a normal distribution due to the fixed boundaries of the percentage scale) and results should thus be treated with caution. To substantiate the findings, we additionally conducted a Mann-Whitney-U test, which confirmed the statistically significant difference in complacency behavior between low (Mdn = 25, IQR = 25) and high transparency (Mdn = 50, IQR = 25), U = 477.00, p < 0.001, r = .53.
We thus reject hypothesis 1 for complacency behavior as we had expected a negative effect of transparency. For complacency potential, our results cautiously support the hypothesis, at least for AW.
3.5. Effect of performance expectancy on complacency (hypothesis 2)
We tested hypothesis 2 “Performance expectancy (PE) positively affects the complacency potential and its subcomponents neglecting monitoring (NM) and alleviating workload (AW) as well as complacency behavior.” using two linear regressions with performance expectancy as the predictor. Percentile bootstrapping with 10,000 samples was employed to compute confidence intervals. For complacency potential, the linear regression shows that PE significantly predicts complacency potential, β = .410, t(89) = 4.21, p < 0.001, 95% CI[0.208, 0.587], and explains a significant proportion of its variance, R2 = .17, F(1, 88) = 17.74, p < 0.001, which corresponds to a large effect, f = 0.45 (Cohen, Citation1992). We further conducted linear regressions for the two subscales of complacency potential. We found PE significantly predicting AW, β = .495, t(89) = 5.34, p < 0.001, 95% CI[0.309, 0.755], explaining a considerable proportion of the variance, R2 = .25, F(1, 88) = 28.52, p < 0.001, which again corresponds to a strong effect, f = 0.58 (Cohen, Citation1992). However, it does not predict NM, β = .199, t(89) = 1.91, p = 0.060, 95% CI[0.020, 0.527], and therefore does not explain a significant proportion of its variance, R2 = .04, F(1, 88) = 3.63, p = 0.060.
For complacency behavior, we used the frequency of following incorrect recommendations as proxy for complacency (in accordance with Wright et al., Citation2020). Linear regression analysis showed that performance expectancy does not predict complacency behavior (β = .119, t(89) = 1.12, p = 0.265, 95% CI[-0.036, 0.157]) and thus does not explain a significant proportion of its variance, R2 = .01, F(1, 88) = 1.26, p = 0.265. As PE did show deviations from the normality assumption, the results have to be interpreted with caution (though we used bootstrapping, again, to counteract negative effects).
We partially reject hypothesis 2 as we did not find a significant effect on complacency behavior, but on complacency potential, especially AW.
3.6. Interaction effect of performance expectancy and transparency on complacency (hypothesis 3)
With hypothesis 3, we tested if “the effect of performance expectancy (PE) on complacency potential and its subcomponents as well as complacency behavior is less pronounced when the system is transparent than when it is not transparent,” using the interaction term in a moderation analysis. We performed a first moderation analysis using the PROCESS Macro for SPSS version 4.1 (Hayes, Citation2022). Percentile bootstrapping with 10,000 samples was employed to compute confidence intervals. The overall model for complacency potential was significant, F(3, 86) = 8.66, p < 0.001, explaining R2 = 20.86% of the variance. Nevertheless, the interaction term was not significant, F(1, 86) = 2.20, p = 0.142, 95% CI[−0.692, 0.107]. Similarly, the interaction terms for the subscales were not significant, neither for AW, F(1, 86) = 2.12, p = 0.149, 95% CI[−0.716, 0.134], nor for NM, F(1, 86) = 0.79, p = 0.377, 95% CI[−0.823, 0.305]. We performed another moderation analysis for complacency behavior, using the same bootstrapping settings. Due to the design, we again used the frequency of following incorrect recommendations as proxy for complacency (in accordance with Wright et al., Citation2020). The overall model for complacency behavior was significant, F(3, 86) = 16.34, p < 0.001, explaining R2 = 33.75% of the variance. This time, the interaction term was significant, F(1, 86) = 9.24, p = 0.003, 95% CI[0.391, 1.764]. However, and in contrast to our hypothesis, the simple slope analysis revealed that the effect of PE on complacency behavior seems to be stronger when interacting with a transparent than with a non-transparent system (). Under the condition of low transparency, PE does not seem to have any effect on complacency behavior, whereas it has a considerable positive effect under the condition of high transparency (). Thus, only when provided with additional information (high transparency), higher acceptance also leads to higher complacency. Please note again the violation of the normality assumption.
Figure 5. Simple slopes for the effect of performance expectancy on complacency behavior for levels of transparency.
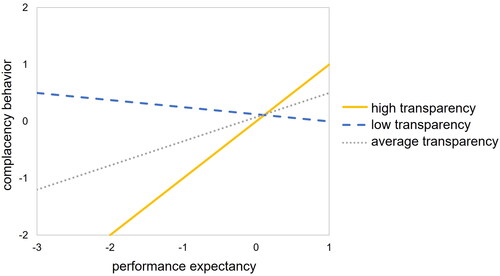
Table 5. Simple slope estimates for complacency behavior.
In sum, we reject hypothesis 3 because the interaction effect between PE and transparency was only found for complacency behavior (but not for complacency potential) and here, the interaction contradicted our initial assumptions.
4. Discussion
The aim of our study was to examine how system-specific (transparency) and person-specific (performance expectancy) variables affect complacency potential and behavior. Overall, we found that both variables influence different dimensions of complacency, albeit not always as expected.
4.1. Key findings
4.1.1. Relationship between complacency potential and behavior (EQ1 + EQ2)
Before we tested our hypotheses, we took a closer look at our complacency measures (EQ1, EQ2). Complacency potential was assessed via the AICP-R (Merritt et al., Citation2019), a relatively new scale based on CPRS (Singh et al., Citation1993a). Results of a CFA confirmed the two-factorial structure with the two subscales (neglecting) monitoring and alleviating workload, which intercorrelated with a medium effect size, but did not correlate significantly with actual complacency behavior. In line with Merritt et al. (Citation2019), the two-factorial structure allowed us to differentiate between monitoring and using AI to complete tasks. The decision to include both subscales separately was substantiated by our empirical results as we found alleviating workload to be more susceptible to system- and person-related influences. While we assumed a person’s underlying complacency potential to vary depending on system features, the AICP-R refers to AI systems in general, which may have suggested a rather stable construct. However, we still found the scale to be context sensitive resulting in a difference in complacency potential between our experimental conditions. For a relatively new scale, context sensitivity is an important finding, which may affect future research using complacency potential as a dependent variable.
4.1.2. Effect of transparency on complacency (hypothesis 1)
Regarding our first hypothesis, we found transparency to negatively affect complacency potential, or rather alleviating workload, while neglecting monitoring was not affected (hypothesis 1, complacency potential). When provided with additional information about the AI system’s recommendations, users seem to show a lower propensity to overly trust the system by delegating tasks and alleviating their workload. Although prior research found a positive relationship between provided explanations of AI systems and trust in the system (e.g., Barredo Arrieta et al., Citation2020; Lee et al., Citation2023), other research indicates that understanding the underlying reasoning of a system (because the system is transparent) may reduce over-trust and complacency (Chen et al., Citation2018; Wright et al., Citation2020). This fosters the notion that trust is a double-edged sword and supporting the accurate calibration of trust in a system may be more helpful than fostering or inhibiting trust per se (Lee & See, Citation2004).
While these findings were in line with our assumptions, results regarding complacency behavior were unexpected (hypothesis 1, complacency behavior). Here, we compared the percentage to which users followed correct and incorrect recommendations of the AI system for more and less transparent systems. Interaction analysis showed that if the system is transparent, users seem to differentiate less between correct and incorrect recommendations than if the system is not. Thus, it was actually favorable for task performance to have less information on the system’s recommendation process. This shows that the effect of transparency is not due to a general shift in the decision criterion from more conservative to more liberal (which may result in more hits and thus better performance with better performing systems), but a lack of accurately differentiating between incorrect and correct recommendations. However, these results need to be interpreted cautiously due to violations of statistical assumptions (for details see Section 4.2). There may be several explanations for these findings.
First, it may be that the additional information may have bound cognitive resources otherwise delegated to scrutinize the system’s decisions. Research on multimedia learning shows that unnecessary (but interesting) information (seductive details) may bind cognitive resources and shift the attention at the expense of actually useful information (see Noetel et al., Citation2021, for an overview). In our study, while the additional information was helpful to understand the reasons for the recommendation (e.g., accident on the road), details about the type of disruption may have drawn attention away from the location of the disruption, refocusing users’ attention on interesting but not technically crucial information (see Rey, Citation2012, for overviews on the seductive detail effect). These effects may have been enhanced by the physical distance between the information and the traffic map leading to a potential split attention effect (Sweller et al., Citation2011). However, since we did not measure the strain on the cognitive system, this remains purely speculative.
Second, an alternative explanation would be that users’ actual cognitive resources were sufficient, but the (illustrating) specific context information may have reduced perceived psychological distance (Construal-Level Theory, Trope & Liberman, Citation2010), leading to increased reliance on the system. Describing the source of the disruption (e.g., accident) may have affected the perceived plausibility of the scenario, reduced the need to check for inconsistencies, as users felt closer (thus, less distant) to the system (i.e., they experienced lower psychological distance). In contrast, users without additional textual information may have felt more distant to the system (i.e., they experienced higher psychological distance), studied the map more carefully and consequently were better at detecting the discrepancy between route and disruption location.
Third, another explanation would be that users tend to follow system recommendations when given any form of explanations. For example, Eiband et al. (Citation2019) show that users trusted both real and placebic explanations. Placebic explanations provide no more information about the system’s underlying algorithm beyond what users could infer from the given scenario, while real explanations provide detailed information about the decision-making process and the system’s confidence in its recommendations. In our study, participants who closely examined the map (low transparency group) may have noticed a mismatch between the system recommendation and the provided explanation. On the other hand, participants with more additional information (high transparency group) might have blindly trusted on the correctness of the information and became complacent. Thus, the additional information may have inadvertently encouraged uncritical reliance on the recommendations, irrespective of their correctness, instead of appropriate calibrated trust.
Regarding the discrepancy between complacency potential and behavior, research on mindless compliance (e.g., Anaraky et al., Citation2020; Langer et al., Citation1978) and self-reporting methods (e.g., Dang et al., Citation2020) may provide an explanation. Asking explicitly about social constructs (like complacency) might break mindlessness as individuals become more self-conscious and cognitive-actively reflect on their behavioral intentions. In our study, participants may have experienced the justifications within the scenario plausible and authentic, and thus, rather mindlessly followed system recommendations instead of actively reflecting them. During past experience, they may have developed a script for “using a navigation system” that suggests them to comply with the system recommendations (route changes) rather mindlessly as they have to pay attention to traffic. However, explicitly asking users whether they would neglect monitoring or hand over workload to the system may have triggered a more cognitive processing resulting in conscious responses.
4.1.3. Effect of performance expectancy on complacency (hypothesis 2)
Apart from system-specific variables, we investigated the role of person-specific performance expectancy for complacency (hypothesis 2). Our analyses confirm a positive relationship between performance expectancy and complacency potential, especially propensity to alleviate workload, albeit not for neglecting monitoring or complacency behavior. This is somewhat surprising as Amin et al. (Citation2014) found a positive relationship between perceived usefulness (corresponding to performance expectancy) and initial trust in a system. Following their argumentation, we also expected performance expectancy to have a positive effect on (over)trust in the system, which might ultimately lead to users not engaging in monitoring activities, to delegate work, and to behave complacently. However, as with transparency, we found neglecting monitoring to be less sensitive towards influences than alleviating workload. While performance expectancy is frequently believed to be a desirable state in a technologized world (Adadi & Berrada, Citation2018), our results strengthen the notion that a nuanced view on fostering performance expectancy needs to be taken. The goal thus cannot be to generally foster technology acceptance (especially performance expectancy) but an accurate understanding of the system’s performance. Thus, rather than merely targeting explainability in terms of system functioning, transparency may additionally target system performance (i.e., how accurate is the system) which may also counteract the (unwanted) effects of transparency on complacency behavior (e.g., Buçinca et al., Citation2021).
4.1.4. Interaction effect of performance expectancy and transparency on complacency (hypothesis 3)
Although behavior seems not to be overly affected by performance expectancy, a more differentiated view shows that performance expectancy actually seems to foster complacency behavior, but this is limited to transparent systems (hypothesis 3). Again, low transparency may have users engage with the original data provided more deeply, levelling out effects of initial acceptance or trust in the system, while additional information may lull users into a false sense of security enhanced by high performance expectancy. Thus, performance expectancy in combination with easy-to-process information explaining decisions seem to be especially critical when it comes to complacency behavior and thus judgment errors.
This phenomenon may be related to aspects of the scenario and the task. Individuals with high task familiarity tend to report more trust in AI systems, but also may overly trust in AI when explanations are provided leading to less compliance with given recommendations (Schaffer et al., Citation2019). In our study, participants in transparent systems may have operated in a “blind default mode,” possibly due to the plausibility or familiarity with the scenario. We used an everyday AI-assisted route navigation recommendation system which may have led to a gradual development of trust, based on previous experiences and evaluations of the performance, trustworthiness, and reliability of such systems. In our study, participants may have automatically trusted recommendations to an initially fairly high degree, independent of their amount of provided additional information about the reasoning behind the recommendation. While in transparent systems that appear authentic (e.g., accident as a reason for suggested route alternative seems reasonable), they may have overly relied on the recommendation, even regardless of their individual expectation of the system’s usefulness, in less transparent systems that offer less information, however, they are cognitively more active and “forced” to check whether the route recommendation is meaningful, and, therefore, may be more likely to be guided by system features than by their own expectations.
The challenge, then, is to prevent overtrust and complacency when initial trust is relatively high, and people tend to operate in a rather “blind default mode.” With regard to Dual Process Theory, one approach is to use Cognitive Forcing Functions (CFFs) to move users from an automatic to an analytical thinking mode that is more deliberative and less error-prone (Kahneman, Citation2011; Wason & Evans, Citation1974). Buçinca et al. (Citation2021) show that CFF are effective in reducing overreliance on AI compared to simply providing explanations for a system recommendation. However, the results of their study revealed a trade-off between trust, preference for the AI system, and human-AI performance. Users tended to trust and prefer systems that they perceived as less cognitively demanding, even if their joint performance suffered. Moreover, the study highlighted the influence of individual characteristics, in particular, the positive influence of CFF on trust for users with a high willingness to engage in cognitive processing activities (i.e., a high Need for Cognition, see Cacioppo & Petty, Citation1982). Considering our study, this could mean that for trust calibration, CFF may be a good way to engage users in critical thinking to reduce the mental shortcuts of blindly trusting and overrelying on provided recommendations. However, as the authors also conclude, the amount and timing of CFF needs further research because user characteristics interact with system characteristics (here, system preference, Need for Cognition and also mental demand).
4.2. Limitations
One central limitation is that the statistical analyses should be interpreted cautiously. There were some deviations from the normality assumption and homogeneity of variance, especially for AICP-R’s subscale alleviating workload. While bootstrapping and the use of robust methods may counteract to some extent, it is important to acknowledge potential downsides of the analyses conducted.
Additionally, complacency behavior was operationalized in accordance with Wright et al. (Citation2020) using the frequency (or rate) of following incorrect recommendations. This measure neglects that complacency is a personal variable that should not per se depend on system functioning (outcome orientation). While we compared the error rate with the rate of following correct recommendations to counteract some of these downsides, there were considerably less incorrect than correct recommendations and thus, the statistical basis was much smaller for the former. However, this discrepancy was necessary to simulate a rather trustworthy and generally well performing AI system. In general, we recommend levelling the effect of system performance by looking more closely at how users differentiate between correct and incorrect recommendations. However, this measuring approach additionally comes with severe downsides regarding statistical analyses. Our dependent variable had fixed boundaries not consistent with the theoretical assumption of normality distribution. While we chose to conduct parametric analyses anyway due to the specific data structure which limits the range of statistical approaches (and confirmed most relevant effects with non-parametric measures), Signal Detection Theory (see Macmillan, Citation1993) as done in decision research may provide a better framework to do so in the future. This would allow to judge complacency behavior more independently of system performance and to identify and compare shifts in individual decision thresholds.
A further limitation concerns the investigation of only very selected person- and system-specific variables, neglecting the complexity of the situation and potential interrelations with other variables. Manzey and Bahner (Citation2005) and Bahner (Citation2008) describe a number of person, system, but also situational features to be considered when analyzing complacency. While our analyses contribute to the validation of the complacency framework and our selected variables seem to be relevant, including more variables may further increase our understanding of the multifaceted construct of complacency when interacting with an AI system. In a similar vein, we focused on performance expectancy which we considered most relevant for the scenario and neglected other aspects of technology acceptance. However, including effort expectancy, trust, and stable person characteristics (e.g., a general attitude towards technology) may well contribute to understanding complacency. In our data, prerequisites for calculating a structural equation model (SEM) were not met, for example, variables did not correlate, and the sample was small for a reliable SEM (e.g., Wang & Rhemtulla, Citation2021). To bring more clarity into the relationships between variables in the framework (Bahner, Citation2008; Manzey & Bahner, Citation2005), we thus encourage future research to specifically design studies meeting especially sample-size requirements to use more complex statistical analyses, such as SEM or mediation analyses, to explore complacency behavior and its antecedents more comprehensively.
Further, our results cannot be generalized towards high-risk scenarios like aviation or automatic driving, which are areas of special interest for complacency research. Our scenario was set in the context of mobility and in general, people report a lower tendency to use AI in transport-related contexts, though this might also be due to contextual and practical reasons (like unavailability of AI) rather than merely opportunity-risk assessments (such as a general negative attitude towards AI) (Schwesig et al., Citation2023). Thus, although we found effects regarding complacency, contextual features may have influenced the results and may thus constrain the generalizability of our results. Our findings contribute to the field of complacency in daily life, particularly in the context of the increasing presence of AI and similar complex systems, where systems belong to non-critical domains, involve relatively low workloads, and are typically encountered in everyday situations that do not demand specialized knowledge.
Finally, to get first insights into interrelations between system- and person-specific variables, we used a simple form of transparency mechanism. We provided additional explanations regarding reasons for disruptions on the traffic route but did not provide users with information on performance or functioning of the system. We based our transparency manipulation roughly on Wright et al. (Citation2020), using two instead of three levels of system reasoning (low/high transparency). However, when calibrating the adequate level of trust, variations of levels of transparency should be taken into account (Chen et al., Citation2018). Besides information on the system’s state or the underlying reasoning process, Chen et al. (Citation2018) suggest to also provide transparency in form of information about the likelihood of the system’s success or failure. This also aligns with Bernstein (Citation2017) who suggests four components of transparency to consider (transparency for monitoring, transparency for process visibility, transparency for surveillance, and transparency for disclosure). Considering these varying levels of explanations may shed further light on the design of explanations to calibrate transparency. Our operationalization of transparency was based on Wright et al. (Citation2020), however, no full degree of transparency regarding the system was provided. However, even our basic transparency manipulation (on a not very detailed level) affected complacency.
4.3. Implications and conclusions
In sum, the study provides evidence regarding the interaction of system-specific and person-specific variables in affecting complacency potential (i.e., the tendency to suboptimal monitoring and handing over work to the system) and behavior. While we confirmed some hypothesized effects, other results were rather unexpected.
On a methodological level, one central outcome is that alleviating workload and neglecting monitoring—while empirically related—seem to be affected differently by system- and person-specific variables. This supports the idea of two rather distinct scales that should be considered separately as opposed to two subfactors of the same construct (Merritt et al., Citation2019). While Merritt et al. (Citation2019) assume a neglect of monitoring to be at the core of complacency in terms of diversion of attention, our analyses not only indicate that alleviating workload seems to be more sensitive to influential factors, but that both are not significantly related to complacency behavior in terms of identifying and reacting to flawed recommendations. Further, transparency seems to affect complacency potential rather different than complacency behavior, which strengthens the notion that these are different concepts rather than merely different assessment methods or layers of the same concept. Complacency potential thereby refers to covert psychological characteristics that may remain undetected (if not assessed explicitly) if the AI system performs well but may have severe negative consequences when the system fails (which may be especially problematic in high-risk areas like aviation). In contrast, complacency behavior is the observable result of a human interacting with (AI) systems.
Another central result is that while system- and person-specific variables (as described in Bahner, Citation2008; Manzey & Bahner, Citation2005) interact in affecting complacency, higher levels of transparency and performance expectancy may also have adverse effects on performance. While the general drive towards transparent systems is obviously commendable from an agency perspective (Barredo Arrieta et al., Citation2020), our results show that the potential for taking on responsibility and agency may not always result in respective behavior. Counteracting these effects must thus be considered when designing transparent systems and practitioners are advised to carefully consider the provision of additional explanations especially if they provide context information but are not strictly critical for judging the situation or system performance. However, as we only manipulated transparency in terms of the reasons for recommendations, we cannot conclude that other measures to foster transparency (e.g., regarding system performance) may not have different effects. Nonetheless, one important result of our study is that even small changes in the design (our explanations did not provide much additional information) may rather severely affect complacency behavior and potential. Earlier research indicates that an adequate calibration of trust is necessary to prevent complacent behavior (Parasuraman & Riley, Citation1997) which can be confirmed by contemporary research. For example, Mercado et al. (Citation2016) show that complacency behavior may be reduced if the level of system transparency is adequately adjusted. They found that correctly accepting or rejecting AI recommendations increased as a function of transparency. One approach to enhance understanding, agency, and balanced trust, while mitigating complacency, is to foster critical thinking in users when interacting with AI-based systems. Implementing cognitive forcing functions could help enhance critical thinking and reduce overreliance on system recommendations (e.g., Buçinca et al., Citation2021).
In xAI, incorporating aspects of explanation’s understandability for more diverse and non-expert users gains more attention (e.g., Gupta, Citation2023), thereby subsuming insights from various research disciplines regarding the design of “good explanations” (e.g., Miller, Citation2019; Srinivasan & Chander, Citation2020) and human-AI interaction (e.g., Lopes et al., Citation2022). Focusing humans with their individual needs and competencies (Putnam & Conati, Citation2019) is necessary to gain deeper understanding of human-AI collaboration. Although there is no need for users to fully understand the overall AI system or every detail of its functioning, a basic mutual understanding is necessary for effective human-AI collaboration (Ananny & Crawford, Citation2018; Balfe et al., Citation2018; Miller, Citation2019). Regarding the calibration of transparency when interacting with highly intelligent and complex systems, instead of aiming at complete transparency, embracing the boundaries of understanding and focusing on what needs to be understood (rather than on what can be understood) may be the sensible way forward.
Therefore, it is necessary to gain more insight into the relationship between system transparency, user understanding, and complacency. Even our simple transparency manipulation affected complacency and thus, a next step is to systematically study how complacency can be calibrated via transparency to gain targeted access to system reasoning. More systematic research on transparency via explanations (e.g., varying content features or their elaborateness) may provide insight into which parts of explanations are most critical for reducing (and increasing) complacency, and how users evaluate the appropriateness of explanations to understand the system (e.g., Holzinger et al., Citation2020).
Usage of technology should be informed decision-making, especially if humans should collaborate with AI or other highly intelligent algorithm-based systems. They should understand how the system came to its output and then decide whether to follow a provided recommendation, or not. They should thus at least understand the basic underlying functioning of how the system came to its output, what data it used, and how in principle it processed it. Thus, basic knowledge about the functioning of the system is needed and optimally should be incorporated into the AI system and being presented to the users.
From a theoretical perspective, our findings can contribute to models on (calibrated) trust in and use of technology. The ISTAM (Vorm & Combs, Citation2022) provides a comprehensive framework for future research. We can confirm transparency as a system-specific variable, and performance expectancy as a person-specific variable and especially their interaction to be crucial to consider when investigating complacency in the context of AI systems. To gain deeper understanding in complacency, we need to further examine how behavioral intentions to use AI are formed and under what conditions it comes to an appropriate calibration of trust. Here, context factors (like the scenario and the task) might come into play.
In sum, a healthy relationship between system performance, system understanding, and performance expectancy should be the goal of human-centric AI. While this sentiment is not new and a specific focus of xAI research (e.g., Barredo Arrieta et al., Citation2020), our study supports this view and contributes to the understanding of complacency as a multifaceted psychological construct under multi-factorial influence.
Acknowledgements
We would also like to thank the student project “Do(n’t) tell me what to do! Influences on the effects of AI-based recommendations” for their support in planning and conducting the study.
Disclosure statement
No potential conflict of interest was reported by the author(s).
Additional information
Funding
Notes on contributors
Lydia Harbarth
Lydia Harbarth is a researcher at the Research Methods in Psychology – Media-based Knowledge Construction chair at the University of Duisburg-Essen, Germany. She is involved in the BMBF-project “Human-centred AI in the chemical industry” and investigates how AI can support humans in education and industry focusing on trust, understanding, and agency.
Eva Gößwein
Eva Gößwein focuses on the human part in human machine interaction, bringing together hands-on experience as an IT-Consultant and formal education. Her research focus lies on cognitive functions and the adoption process of new technologies.
Daniel Bodemer
Daniel Bodemer holds the chair on Research Methods in Psychology – Media-based Knowledge Construction at the University of Duisburg-Essen, Germany. His research interests and funded projects focus on analyzing and guiding self-regulated, collaborative, and/or technology-enhanced learning processes in various formal and informal educational contexts.
Lenka Schnaubert
Lenka Schnaubert is Assistant Professor in Learning Sciences at the Learning Sciences Research Institute, University of Nottingham, UK. Her research interconnects metacognitive and self-regulatory processes, computer-supported collaborative learning, and innovative technology. Lenka is involved in various interdisciplinary research projects bridging gaps between research and its application in education, industry, healthcare.
References
- Adadi, A., & Berrada, M. (2018). Peeking inside the black-box: A survey on explainable artificial intelligence (XAI). IEEE Access, 6(1), 52138–52160. https://doi.org/10.1109/ACCESS.2018.2870052
- Al-Emran, M., & Granić, A. (2021). Is it still valid or outdated? A bibliometric analysis of the Technology Acceptance Model and its applications from 2010 to 2020. In M. Al-Emran & K. Shaalan (Eds.), Recent Advances in Technology Acceptance Models and Theories (pp. 1–12). Springer International Publishing. https://doi.org/10.1007/978-3-030-64987-6_1
- Amin, M., Rezaei, S., & Abolghasemi, M. (2014). User satisfaction with mobile websites: The impact of perceived usefulness (PU), perceived ease of use (PEOU) and trust. Nankai Business Review International, 5(3), 258–274. https://doi.org/10.1108/NBRI-01-2014-0005
- Ananny, M., & Crawford, K. (2018). Seeing without knowing: Limitations of the transparency ideal and its application to algorithmic accountability. New Media & Society, 20(3), 973–989. https://doi.org/10.1177/1461444816676645
- Anaraky, R. G., Knijnenburg, B. P., & Risius, M. (2020). Exacerbating mindless compliance: The danger of justifications during privacy decision making in the context of Facebook applications. AIS Transactions on Human-Computer Interaction, 12(2), 70–95. https://doi.org/10.17705/1thci.00129
- Bach, T. A., Khan, A., Hallock, H., Beltrão, G., & Sousa, S. (2022). A systematic literature review of user trust in AI-enabled systems: An HCI perspective. International Journal of Human–Computer Interaction, 1–16. Advance online publication. https://doi.org/10.1080/10447318.2022.2138826
- Bahner, J. E. (2008). Übersteigertes Vertrauen in Automation: Der Einfluss von Fehlererfahrungen auf Complacency und Automation Bias [Overtrust in automation: The impact of failure experience on complacency and automation bias] [Dissertation]. Technische Universität Berlin. https://doi.org/10.14279/depositonce-1990
- Balfe, N., Sharples, S., & Wilson, J. R. (2018). Understanding is key: An analysis of factors pertaining to trust in a real-world automation system. Human Factors, 60(4), 477–495. https://doi.org/10.1177/0018720818761256
- Barredo Arrieta, A., Díaz-Rodríguez, N., Del Ser, J., Bennetot, A., Tabik, S., Barbado, A., Garcia, S., Gil-Lopez, S., Molina, D., Benjamins, R., Chatila, R., & Herrera, F. (2020). Explainable Artificial Intelligence (XAI): Concepts, taxonomies, opportunities and challenges toward responsible AI. Information Fusion, 58(1), 82–115. https://doi.org/10.1016/j.inffus.2019.12.012
- Bernstein, E. S. (2017). Making transparency transparent: The evolution of observation in management theory. Academy of Management Annals, 11(1), 217–266. https://doi.org/10.5465/annals.2014.0076
- Brown, T. A. (2006). Confirmatory factor analysis for applied research (pp. xiii–x475). The Guilford Press.
- Brown, T. A., & Moore, M. T. (2012). Confirmatory factor analysis. In R. H. Hoyle (Ed.), Handbook of structural equation modeling (pp. 361–379). The Guilford Press.
- Buçinca, Z., Malaya, M. B., & Gajos, K. Z. (2021). To trust or to think: Cognitive forcing functions can reduce overreliance on AI in AI-assisted decision-making. Proceedings of the ACM on Human-Computer Interaction, 5(CSCW1), 1–21. https://doi.org/10.1145/3449287
- Bussone, A., Stumpf, S., & O’Sullivan, D. (2015). The role of explanations on trust and reliance in clinical decision support systems. In International Conference on Healthcare Informatics (pp. 160–169). IEEE. https://doi.org/10.1109/ICHI.2015.26
- Cacioppo, J. T., & Petty, R. E. (1982). The need for cognition. Journal of Personality and Social Psychology, 42(1), 116–131. https://doi.org/10.1037/0022-3514.42.1.116
- Carmines, E. G., & McIver, J. P. (1981). Analyzing models with unobserved variables: Analysis of covariance structures. In G. W. Bohrnstedt & E. F. Borgatta (Eds.), Social measurement: Current issues (pp. 65–115). Sage Publications, Inc.
- Chen, J. Y. C., Lakhmani, S. G., Stowers, K., Selkowitz, A. R., Wright, J. L., & Barnes, M. (2018). Situation awareness-based agent transparency and human-autonomy teaming effectiveness. Theoretical Issues in Ergonomics Science, 19(3), 259–282. https://doi.org/10.1080/1463922X.2017.1315750
- Chen, Y.-F., & Lan, Y.-C. (2016). An empirical study of the factors affecting mobile shopping in Taiwan. International Journal of Technology and Human Interaction, 10(1), 19–30. https://doi.org/10.4018/ijthi.2014010102
- Choung, H., David, P., & Ross, A. (2021). Trust in AI and its role in the acceptance of AI technologies. International Journal of Human–Computer Interaction, 39(9), 1727–1739. https://doi.org/10.1080/10447318.2022.2050543
- Cohen, J. (1988). Statistical power analysis for the behavioral sciences (2nd ed.). Lawrence Erlbaum Associates. https://doi.org/10.4324/9780203771587
- Cohen, J. (1992). Statistical power analysis. Current Directions in Psychological Science, 1(3), 98–101. https://doi.org/10.1111/1467-8721.ep10768783
- Dang, J., King, K. M., & Inzlicht, M. (2020). Why are self-report and behavioral measures weakly correlated? Trends in Cognitive Sciences, 24(4), 267–269. https://doi.org/10.1016/j.tics.2020.01.007
- Davis, F. D. (1989). Perceived usefulness, perceived ease of use, and user acceptance of information technology. MIS Quarterly, 13(3), 319–340. https://doi.org/10.2307/249008
- Dillon, A. (2001). User acceptance of information technology. In W. Karwowski (Ed.), Encyclopedia of human factors and ergonomics (1st ed., Vol. 1, pp. 1–11). Taylor and Francis.
- Dunn, N., Dingus, T., & Soccolich, S. (2019). Understanding the impact of technology: Do advanced driver assistance and semi-automated vehicle systems lead to improper driving behavior? [Technical Report] (pp. 1–103). AAA Foundation for Traffic Safety. https://trid.trb.org/view/1673569
- Eiband, M., Buschek, D., Kremer, A., & Hussmann, H. (2019). The impact of placebic explanations on trust in intelligent systems. In Extended Abstracts of the 2019 CHI Conference on Human Factors in Computing Systems (pp. 1–6). ACM. https://doi.org/10.1145/3290607.3312787
- European Commission (2019). Ethics guidelines for trustworthy AI. https://digital-strategy.ec.europa.eu/en/library/ethics-guidelines-trustworthy-ai
- Fallon, C. K., & Blaha, L. M. (2018). Improving automation transparency: Addressing some of machine learning’s unique challenges. In D. D. Schmorrow & C. M. Fidopiastis (Eds.), Augmented cognition: Intelligent technologies (Vol. 10915, pp. 245–254). Springer International Publishing. https://doi.org/10.1007/978-3-319-91470-1_21
- Faul, F., Erdfelder, E., Lang, A.-G., & Buchner, A. (2007). G*Power 3: A flexible statistical power analysis program for the social, behavioral, and biomedical sciences. Behavior Research Methods, 39(2), 175–191. https://doi.org/10.3758/BF03193146
- Glikson, E., & Woolley, A. W. (2020). Human trust in artificial intelligence: Review of empirical research. Academy of Management Annals, 14(2), 627–660. https://doi.org/10.5465/annals.2018.0057
- Gupta, M. (2023). Explainable Artificial Intelligence (XAI): Understanding and future perspectives. In A. E. Hassanien, D. Gupta, A. K. Singh, & A. Garg (Eds.), Explainable edge AI: A futuristic computing perspective (Vol. 1072, pp. 19–33). Springer. https://doi.org/10.1007/978-3-031-18292-1_2
- Hayes, A. F. (2022). Introduction to mediation, moderation, and conditional process analysis: A regression-based approach (3rd ed.). Guilford Press.
- Hayes, A. F., & Coutts, J. J. (2020). Use omega rather than Cronbach’s alpha for estimating reliability. But…. Communication Methods and Measures, 14(1), 1–24. https://doi.org/10.1080/19312458.2020.1718629
- Hoff, K. A., & Bashir, M. (2015). Trust in automation: Integrating empirical evidence on factors that influence trust. Human Factors, 57(3), 407–434. https://doi.org/10.1177/0018720814547570
- Holden, R. J., & Karsh, B.-T. (2010). The Technology Acceptance Model: Its past and its future in health care. Journal of Biomedical Informatics, 43(1), 159–172. https://doi.org/10.1016/j.jbi.2009.07.002
- Holt, C. A., & Laury, S. K. (2002). Risk aversion and incentive effects. American Economic Review, 92(5), 1644–1655. https://doi.org/10.1257/000282802762024700
- Holzinger, A., Carrington, A., & Müller, H. (2020). Measuring the quality of explanations: The System Causability Scale (SCS). Kunstliche Intelligenz, 34(2), 193–198. https://doi.org/10.1007/s13218-020-00636-z
- Hu, L.-T., & Bentler, P. M. (1999). Cutoff criteria for fit indexes in covariance structure analysis: Conventional criteria versus new alternatives. Structural Equation Modeling: A Multidisciplinary Journal, 6(1), 1–55. https://doi.org/10.1080/10705519909540118
- Kahneman, D. (2011). Thinking, fast and slow. Macmillan.
- Langer, E. J., Blank, A., & Chanowitz, B. (1978). The mindlessness of ostensibly thoughtful action: The role of “placebic” information in interpersonal interaction. Journal of Personality and Social Psychology, 36(6), 635–642. https://doi.org/10.1037/0022-3514.36.6.635
- Larsson, S., & Heintz, F. (2020). Transparency in artificial intelligence. Internet Policy Review, 9(2), 1–16. https://doi.org/10.14763/2020.2.1469
- Lee, J. D., & See, K. A. (2004). Trust in automation: Designing for appropriate reliance. Human Factors, 46(1), 50–80. https://doi.org/10.1518/hfes.46.1.50_30392
- Lee, S., Moon, W.-K., Lee, J.-G., & Sundar, S. S. (2023). When the machine learns from users, is it helping or snooping? Computers in Human Behavior, 138, 107427. https://doi.org/10.1016/j.chb.2022.107427
- Lopes, P., Silva, E., Braga, C., Oliveira, T., & Rosado, L. (2022). XAI systems evaluation: A review of human and computer-centred methods. Applied Sciences, 12(19), 9423. https://doi.org/10.3390/app12199423
- Macmillan, N. A. (1993). Signal detection theory as data analysis method and psychological decision model. In G. Keren & C. Lewis (Eds.), A handbook for data analysis in the behavioral sciences: Methodological issues (pp. 21–57). Lawrence Erlbaum Associates.
- Manzey, D., & Bahner, J. E. (2005). Vertrauen in Automation als Aspekt der Verlässlichkeit von Mensch-Maschine-Systemen [Trust in automation as an aspect of the reliability of human-machine systems]. In K. Karrer, B. Gauss, & C. Steffens (Eds.), Beiträge zur Mensch-Maschine-Systemtechnik aus Forschung und Praxis – Festschrift für Klaus-Peter Timpe (1st ed., pp. 93–109). Springer.
- Marangunić, N., & Granić, A. (2015). Technology acceptance model: A literature review from 1986 to 2013. Universal Access in the Information Society, 14(1), 81–95. https://doi.org/10.1007/s10209-014-0348-1
- Mayer, R. C., Davis, J. H., & Schoorman, F. D. (1995). An integrative model of organizational trust. The Academy of Management Review, 20(3), 709. https://doi.org/10.2307/258792
- Mercado, J. E., Rupp, M. A., Chen, J. Y. C., Barnes, M. J., Barber, D., & Procci, K. (2016). Intelligent agent transparency in human-agent teaming for multi-UxV management. Human Factors, 58(3), 401–415. https://doi.org/10.1177/0018720815621206
- Merritt, S. M., Ako-Brew, A., Bryant, W. J., Staley, A., McKenna, M., Leone, A., & Shirase, L. (2019). Automation-induced complacency potential: Development and validation of a new scale. Frontiers in Psychology, 10(1), 225. https://doi.org/10.3389/fpsyg.2019.00225
- Miller, T. (2019). Explanation in artificial intelligence: Insights from the social sciences. Artificial Intelligence, 267, 1–38. https://doi.org/10.1016/j.artint.2018.07.007
- Molina, M. D., & Sundar, S. S. (2022). When AI moderates online content: Effects of human collaboration and interactive transparency on user trust. Journal of Computer-Mediated Communication, 27(4), 1–12. https://doi.org/10.1093/jcmc/zmac010
- Moray, N. (2003). Monitoring, complacency, scepticism and eutactic behaviour. International Journal of Industrial Ergonomics, 31(3), 175–178. https://doi.org/10.1016/S0169-8141(02)00194-4
- Noetel, M., Griffith, S., Delaney, O., Harris, N. R., Sanders, T., Parker, P., del Pozo Cruz, B., & Lonsdale, C. (2021). Multimedia design for learning: An overview of reviews with meta-meta-analysis. Review of Educational Research, 92(3), 413–454. https://doi.org/10.3102/00346543211052329
- Parasuraman, R., & Manzey, D. (2010). Complacency and bias in human use of automation: An attentional integration. Human Factors, 52(3), 381–410. https://doi.org/10.1177/0018720810376055
- Parasuraman, R., & Riley, V. (1997). Humans and automation: Use, misuse, disuse, abuse. Human Factors: The Journal of the Human Factors and Ergonomics Society, 39(2), 230–253. https://doi.org/10.1518/001872097778543886
- Prinzel, L. J., DeVries, H., Freeman, F. G., & Mikulka, P. (2001). Examination of automation-induced complacency and individual difference variates. [Technical Memorandum No. TM-2001-211413]. National Aeronautics and Space Administration Langley Research Center.
- Putnam, V., & Conati, C. (2019). Exploring the need for Explainable Artificial Intelligence (XAI) in Intelligent Tutoring Systems (ITS). In C. Trattner, D. Parra, & N. Riche (Eds.), Joint Proceedings of the ACM IUI 2019 Workshops (Vol. 2327). http://ceur-ws.org/Vol-2327/IUI19WS-ExSS2019-19.pdf
- Rajpurkar, P., Chen, E., Banerjee, O., & Topol, E. J. (2022). AI in health and medicine. Nature Medicine, 28(1), 31–38. https://doi.org/10.1038/s41591-021-01614-0
- Rey, G. D. (2012). A review of research and a meta-analysis of the seductive detail effect. Educational Research Review, 7(3), 216–237. https://doi.org/10.1016/j.edurev.2012.05.003
- Ribera, M., & Lapedriza García, À. (2019). Can we do better explanations? A proposal of user-centered explainable AI. In C. Trattner, D. Parra, & N. Riche (Eds.), Joint Proceedings of the ACM IUI 2019 Workshops co-located with the 24th ACM Conference on Intelligent User Interfaces (ACM IUI 2019), Los Angeles, USA. ACM. http://hdl.handle.net/10609/99643
- Schaffer, J., O’Donovan, J., Michaelis, J., Raglin, A., & Höllerer, T. (2019). I can do better than your AI: Expertise and explanations. In Proceedings of the 24th International Conference on Intelligent User Interfaces (pp. 240–251). ACM. https://doi.org/10.1145/3301275.3302308
- Schwesig, R., Brich, I., Buder, J., Huff, M., & Said, N. (2023). Using Artificial Intelligence (AI)? Risk and opportunity perception of AI predict people’s willingness to use AI. Journal of Risk Research, 26(10), 1053–1084. https://doi.org/10.1080/13669877.2023.2249927
- Sheridan, T., & Parasuraman, R. (2005). Human-automation interaction. Reviews of Human Factors and Ergonomics, 1(1), 89–129. https://doi.org/10.1518/155723405783703082
- Shin, D., Zhong, B., & Biocca, F. A. (2020). Beyond user experience: What constitutes algorithmic experiences? International Journal of Information Management, 52(1), 102061. https://doi.org/10.1016/j.ijinfomgt.2019.102061
- Singh, I. L., Molloy, R., & Parasuraman, R. (1993a). Automation-induced “complacency”: Development of the Complacency-Potential Rating Scale. The International Journal of Aviation Psychology, 3(2), 111–122. https://doi.org/10.1207/s15327108ijap0302_2
- Singh, I. L., Molloy, R., & Parasuraman, R. (1993b). Individual differences in monitoring failures of automation. The Journal of General Psychology, 120(3), 357–373. https://doi.org/10.1080/00221309.1993.9711153
- Speith, T. (2022). A review of taxonomies of Explainable Artificial Intelligence (XAI) methods. In 2022 5th ACM Conference on Fairness, Accountability, and Transparency (FAccT ’22), Seoul, Republic of Korea (pp. 2239–2250). Association for Computing Machinery. https://doi.org/10.1145/3531146.3534639
- Srinivasan, R., & Chander, A. (2020). Explanation perspectives from the cognitive sciences — A survey. In C. Bessiere (Ed.), Proceedings of the 29th International Joint Conference on Artificial Intelligence (pp. 4812–4818). International Joint Conferences on Artificial Intelligence Organization. https://doi.org/10.24963/ijcai.2020/670
- Sweller, J., Ayres, P., & Kalyuga, S. (2011). The split-attention effect. In Cognitive load theory. explorations in the learning sciences, instructional systems and performance technologies (1st ed., Vol. 1, pp. 111–128). Springer.
- Trope, Y., & Liberman, N. (2010). Construal-level theory of psychological distance. Psychological Review, 117(2), 440–463. https://doi.org/10.1037/a0018963
- Venkatesh, V., Morris, M. G., Davis, G. B., & Davis, F. D. (2003). User acceptance of information technology: Toward a unified view. MIS Quarterly, 27(3), 425. https://doi.org/10.2307/30036540
- Venkatesh, V., Thong, J. Y. L., & Xu, X. (2012). Consumer acceptance and use of information technology: Extending the unified theory of acceptance and use of technology. MIS Quarterly, 36(1), 157–178. https://doi.org/10.2307/41410412
- Vorm, E. S., & Combs, D. J. Y. (2022). Integrating transparency, trust, and acceptance: The Intelligent Systems Technology Acceptance Model (ISTAM). International Journal of Human–Computer Interaction, 38(18-20), 1828–1845. https://doi.org/10.1080/10447318.2022.2070107
- Wang, A. Y., & Rhemtulla, M. (2021). Power analysis for parameter estimation in structural equation modeling: A discussion and tutorial. Advances in Methods and Practices in Psychological Science, 4(1), 251524592091825. https://doi.org/10.1177/2515245920918253
- Wason, P. C., & Evans, J. S. B. T. (1974). Dual processes in reasoning? Cognition, 3(2), 141–154. https://doi.org/10.1016/0010-0277(74)90017-1
- Wiener, E. L. (1985). Cockpit automation: In need of a philosophy. SAE Transactions, 94(6), 952–958.
- Wright, J. L., Chen, J. Y. C., Baker, M. J., & Hancock, P. A. (2020). Agent reasoning transparency: The influence of information level on automation-induced complacency. IEEE Transactions on Human-Machine Systems, 50(3), 254–263. https://doi.org/10.1109/THMS.2019.2925717
- Wu, I.-L., & Chen, J.-L. (2005). An extension of trust and TAM model with TPB in the initial adoption of on-line tax: An empirical study. International Journal of Human-Computer Studies, 62(6), 784–808. https://doi.org/10.1016/j.ijhcs.2005.03.003
- Zhang, T., Tao, D., Qu, X., Zhang, X., Lin, R., & Zhang, W. (2019). The roles of initial trust and perceived risk in public’s acceptance of automated vehicles. Transportation Research Part C: Emerging Technologies, 98(1), 207–220. https://doi.org/10.1016/j.trc.2018.11.018