
Abstract
In this work, an integrative theoretical structure for the propensity to trust (PTT) is derived from literature. In an online study (N = 669), the validity of the structure was assessed and compared in two domains: propensity to trust in humans (PTT-H) and propensity to trust in automated technology (PTT-A). Based on this, an economic scale to measure PTT-A was derived and its psychometric quality was explored based on the first and an additional second study. The observed correlational pattern to basic personality traits supports the convergent validity of PTT-A. Moreover, discriminative predictive validity of PTT-A over PTT-H was supported by its higher relationships to technology-related outcomes. Additionally, incremental validity of PTT-A over basic personality traits was supported. Finally, the internal validity of the scale was replicated in an independent sample and re-test reliability was established. The findings support the added value of integrating PTT-A in research on the interaction with automated technology.
1. Introduction
While automated and AI-based technical systems are applied in more and more areas, they become increasingly intransparent. Trust as a foundation for human collaboration helps to better understand the underlying processes of making sense and deciding (how) to interact with technological systems (e.g., Hoff & Bashir, Citation2015; Kraus, Citation2020; J. D. Lee & See, Citation2004; Lewandowsky et al., Citation2000; Madhavan & Wiegmann, Citation2007).
In the last decades, research on the role of trust in the adoption of and interaction with technology has gained momentum. Under the term trust in automation, research was conducted to explain the human interaction with automated technical systems in safety-critical tasks like industrial plant simulations (e.g., J. D. Lee & Moray, Citation1992, Citation1994; Muir, Citation1987, Citation1994; Muir & Moray, Citation1996). Over recent years, the application areas have become diverse, covering the domain of automated driving vehicles (Beggiato & Krems, Citation2013; Kazi et al., Citation2007; Rudin-Brown & Parker, Citation2004), manufacturing systems (Legler et al., Citation2020; Rahman & Wang, Citation2018), service and (Babel, Kraus, Miller, et al., Citation2021; Carli & Najjar, Citation2021; Gompei & Umemuro, Citation2018; Langer et al., Citation2019; W. H. Lee et al., Citation2018; Tussyadiah et al., Citation2020) social robots multimedia applications (e.g., Zhang & Wang, Citation2013), websites (Karimov et al., Citation2011; Ou & Sia, Citation2010) and AI software (Asan et al., Citation2020; Glikson & Woolley, Citation2020; Kaplan et al., Citation2021).
In the face of these diverse technological application areas, it is not surprising that there are considerable inconsistencies in the literature in terms of labeling, definitions, dimensions, and the measurement of trust. As the labels trust in automation and trust in technology have been most prominently used, in the following, we use the term trust in automated technology as a general umbrella term for all types of automated technical systems. While different trust variables (e.g., dispositional, learned, or situational trust, e.g., S. Marsh & Dibben, Citation2003) have been discussed in most application domains, these have not consistently been differentiated on both a theoretical and measurement level. Additionally, it becomes apparent that research on trust in automated technology is mostly separated from research on trust in other humans and trust in organizations, inhibiting consolidated theorizing and methodological progress. Indeed, different theoretical concepts of trust coexist in different research streams and domain-specific operationalizations render comparisons even harder, restricting synergetic energies and a clear research agenda.
As a starting point to integrate trust research from different domains, this research focuses on the most general trust variable – the propensity to trust (PTT) – a relatively stable tendency explaining individual differences in the perception and decision-making in trust-related phenomena. Interestingly, theoretical considerations about a trait-like component of trust in automated technology often draw from findings and considerations from interpersonal trust literature (e.g., Hoff & Bashir, Citation2015; J. D. Lee & See, Citation2004), where a PTT for other humans has been established at least since the early works of Rotter (Citation1967, Citation1971).
As the way of thinking about the PTT in automated technology was clearly influenced by the way psychologists think about the PTT in humans, this research aims to investigate the relationship between PTT towards automated technology (PTT-A) and the more general PTT towards other humans (PTT-H) along the following questions:
Which underlying facets can be meaningfully distinguished in both forms of PTT?
How can PTT-A be measured in a valid manner?
How can the parsimony of a PTT-A scale be optimized?
How do PTT-A and PTT-H relate to basic personality in a nomological network? Footnote1
How well do the two forms of PTT predict technology-related decision-making? Does PTT-A provide incremental predictive validity over other personality traits?
To answer these questions, based on a thorough literature and scale review combining different streams of research including general personality research and specific research on trust in different phenomenological domains, a theoretically derived factorial structure for generalizing PTT-H to PTT-A is derived in this paper. In this, we combine theoretical underpinnings of trust in these different, widely unrelatedly discussed domains to enhance the foundation of our PTT conceptualization. Building on assumptions of hierarchical personality approaches (e.g., 3M model; Mowen, Citation2000), we propose that PTT-H builds a generalized form of PTT, on which the more specific PTT-A is based. This builds the basis for constructing, refining and validating a scale to measure PTT-A. The introduced scale contributes to the field by introducing a theoretically founded definition, multidimensional structure and measurement for PTT-A, allowing to better understand and investigate the development of trust in automated technology. The developed scales, together with all data and the analyses scripts, are freely available at the Open Science Framework (OSF; https://osf.io/ntypg/).
1.1. What is trust? – Definitions, layers, and processes
Arguably, with over 27,000 citations, the most popular definition of trust was brought forward by Mayer et al. (Citation1995), defining trust as “the willingness of a party to be vulnerable to the actions of another party based on the expectation that the other will perform a particular action important to the trustor, irrespective of the ability to monitor or control that other party” (p. 712). Although originating from organizational psychology, the article spread across fields – besides others, to the domains of interpersonal trust (e.g., Colquitt et al., Citation2007; Thielmann & Hilbig, Citation2015) and trust in automation (e.g., Hoff & Bashir, Citation2015).
However, across the spectrum of trust-related research, the term trust is not uniformly used to describe a single psychological variable with specific characteristics (see, e.g., Colquitt et al., Citation2007). Exemplarily, Mayer et al. (Citation1995) conceptualize trust as an intention (to accept vulnerability), while in the field of automated technology, J. D. Lee and See (Citation2004) conceptualize trust as the attitude “that an agent will help achieve an individual’s goals in a situation characterized by uncertainty and vulnerability” (p. 2). Indeed, it is common to label various variables relating to information processing and decision-making in reliance-related behavior as trust. To advance theorizing and knowledge on trust and its relation to phenomena like technology adoption and use, a key is to establish shared definitions and understanding across fields. One meaningful approach here is to not define trust exclusively as one of these variables referring to trust processes. Instead, trust can be conceptualized as a term to describe variables with different characteristics in a psychological process leading to trusting behavior. Thereby, these variables differ in their reference object and underlying basis in the process of learning about a trustee.
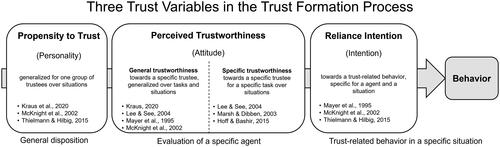
Under this perspective, trust can be meaningfully divided into three different trust variables reflecting the evolving psychological character of trust at different points of trust formation and its relation to behavior (see ; Kraus, Citation2020; Mayer et al., Citation1995; McKnight et al., Citation2002; Merrit & Ilgen, 2008; Thielmann & Hilbig, Citation2015): (1) the propensity to trust (e.g., Gurtman, Citation1992; Rotter, Citation1967, Citation1980; Thielmann & Hilbig, Citation2015) – a relatively stable tendency describing the generalized expectation that a group of trustees (e.g., humans, technology, or organizations) can be relied upon and the general willingness to rely on those trustees, (2) the perceived trustworthinessFootnote2 – an attitude describing the general expectation that a specific individual trustee can be relied on over a broad variety of situations and tasks which can be further differentiated along its specificity, and (3) the reliance intention – the willingness to show trust-related behavior in a specific situation of risk and uncertainty resulting in some degree of vulnerability to the actions of a trustee (e.g., Colquitt et al., Citation2007; Mayer et al., Citation1995; McKnight et al., Citation2002).
Figure 1. Differentiation of trust variables with different characteristics in the trust formation process. Note. A feedback loop is assumed but not illustrated (see Kraus, Citation2020).
This work focuses on the PTT as a personality basis for trust processes, for which different substructures have been brought forward in several areas (e.g., Mayer et al., Citation1995; McKnight et al., Citation2002). To understand the relatedness of PTT-H and PTT-A and to derive measurement methods for both, this work essentially focuses on the comparability and the nature of the underlying dimensions of the PTT construct in the two domains. As such, we focus on the mere structure of PTT with no regard to its function across time (for this see, e.g., Kraus, Citation2020; Jones & Shah, Citation2016).
1.2. The propensity to trust in technology – Domain-specific, meaningful, and distinguishable?
PTT has been investigated for several decades now, especially in the interpersonal domain. One of the earliest and arguably most influential works stems from Rotter (Citation1967, Citation1971), who proposed that expectations about a specific other can be generalized to a whole group. He further proposed that the generalized expectation that the “oral or written statements of other people can be relied upon” (Rotter, Citation1967, p. 653) can be seen as a personality trait (Rotter, Citation1971, Citation1980). Many researchers subsequently adopted this view of trust as a stable personality trait (e.g., Dasgupta, Citation1988; Das & Teng, Citation2004; Farris et al., Citation1973; Gill et al., Citation2005; McKnight et al., Citation1998), including Mayer et al. (Citation1995) which defined PTT as the “general willingness to trust others” (p. 715).
In research on trust in technological systems of various kinds, the role of such a dispositional domain-specific trust tendency for explaining individual differences in the perception, adoption, and decision-making with technology has often been included in theoretical discussions (e.g., Hoff & Bashir, Citation2015; J. D. Lee & See, Citation2004; Merritt & Ilgen, Citation2008; Parasuraman et al., Citation1993; Citation2014) and empirical work (e.g., Kraus et al., Citation2021; Merritt et al., Citation2013; Miller et al., Citation2021). A central question for PTT-A is whether it builds on the same individual differences and psychological processes as PTT-H and whether these two forms of the disposition to trust can be theoretically and empirically distinguished in a meaningful way. Indeed, similarities and differences between interpersonal trust and trust in technology have been discussed for many years. In this, researchers differ in their arguments regarding the level of resemblance of concepts and the transferability of trust processes and findings over domains (e.g., Hoff & Bashir, Citation2015; Jian et al., Citation2000; Kraus, Citation2020; J. D. Lee & Moray, Citation1992; J. D. Lee & See, Citation2004; Lewandowsky et al., Citation2000; Muir, Citation1987, Citation1994). A strong case for the conceptual relatedness of the two forms of PTT is that researchers in the automated technology domain draw strongly from PTT-H theory when conceptualizing PTT-A (e.g., Hoff & Bashir, Citation2015; J. D. Lee & Moray, Citation1992; J. D. Lee & See, Citation2004; Muir, Citation1987, Citation1994). Popular definitions of PTT-A do not fundamentally differ from those of PTT-H. To give an example, similar to the definitions by Rotter (Citation1967) and Mayer et al. (Citation1995), PTT-A has been defined as “an individual’s overall tendency to trust automation” (Hoff & Bashir, Citation2015, p. 413) or “a generalized form of trustworthiness expectation towards all kinds of automated systems” (Kraus, Citation2020, p. 36). Indeed, there is little specific theorizing building a case to detach theorizing in PTT-A from this of PTT-H. Rather, based on the assumption of the Three Stages of Trust framework (Kraus, Citation2020) that PTT-A is built up by a combination of – besides others – general personality variables and the individual learning history with technology it seems promising to conceptualize PTT-A as a specific form of PTT-H. On this basis, it is suggested that PTT-H builds a personality foundation on which the more specific PTT-A is based and attenuated along individual experiences with technology. In line with this and based on the general assumption of hierarchical personality structure (e.g., Allport, Citation1961; Mowen, Citation2000) that specific traits (e.g., PTT-A) provide better predictions for specific outcomes than general traits (e.g., PTT-H), Kraus et al. (Citation2021) found that indeed PTT-H was weaker related to trust in automation than PTT-A and that PTT-A was significantly predicted by PTT-H.
The assumption of similar processes in the formation of PTT-A and PTT-H is further supported by the Computers are social actors framework (CASA), proposing that people automatically (a) apply social categories to technological agents, (b) behave prosocially towards them, and (c) apply notions of self and other to technology (see, e.g., Nass et al., Citation1994; Nass & Moon, Citation2000; Nielsen, Thielmann, et al., Citation2022; Reeves & Nass, Citation1996). In a recent review on CASA (Nielsen, Pfattheicher, et al., Citation2022), four processes are identified as foundations for prosocial behavior towards technology: (1) perceiving machines as (somewhat) human, (2) social categorization, (3) social influence, and (4) affectively motivated prosociality. These processes can be considered essential for the conceptual closeness of PTT-A to PTT-H as they might contribute to people building evaluations of the trustworthiness of technology, at least to some degree, on the same basis as they do for other people. Beyond merely machine-like characteristics (e.g., performance and competence), this includes human-like, social and moral attributions reflected in trustworthiness expectations like integrity. The transfer of these social attributions to assess the trustworthiness of technology is supported by their integration in frameworks (e.g., Malle & Ullman, Citation2021) and discussions (e.g., Coeckelbergh, Citation2012) in the domain of trust in automated technology.
Based on this reasoning, we propose to conceptualize PTT-A as a more specific personality trait referring to the category of automated technology involving all kinds of technologies like robots, automated vehicles, and other AI-based systems. As such, we argue that, from a psychological viewpoint, the underlying cognitive and affective processes of PTT-H and PTT-A are functionally equivalent. At the same time, while the involved psychological processes are hypothesized to share fundamental comparability, we follow the reasoning of Madhavan and Wiegmann (Citation2007), de Visser et al. (Citation2016), Alarcon et al. (Citation2021, Citation2023), and others that the degree of comparability of the output of these shared processes varies considerably on the basis of unique characteristics technical systems possess and the specific mental models that are involved in information processing when dealing with those agents.
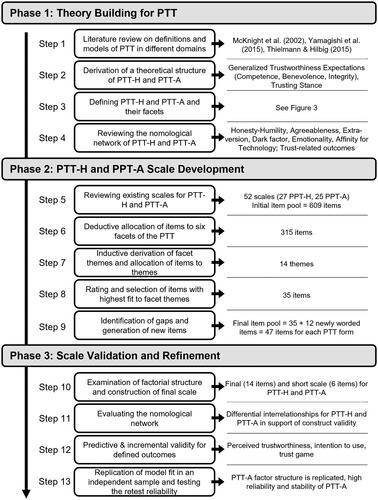
Against this, the main goal of this research is to compare these two forms of PTT in terms of their dimensionality and structure and, on this basis, to derive a valid and parsimonious measurement of PTT-A. The procedure of this endeavor is illustrated in . In the first phase (theory building), PTT models are reviewed and integrated into a structure of PTT-H. From this, a construct definition and facet structure of PTT-A are derived. In the second phase (scale development), scales for measuring both forms of PTT are constructed from existing scales. In the third phase (scale validation), the structure of both forms of PTT is investigated and an economic scale for measuring PTT-A is derived. Finally, to support construct validity its relationships with basic personality variables and its predictive validity is investigated.
Figure 2. Process of this research including three phases from theory building to scale development and scale validation.
1.3. Literature review on models of PTT
In PTT literature, many definitions and/or structures of the construct have been proposed. Overall, there are two approaches: First, theoretically derived models defining several underlying dimensions of PTT and second, empirically derived factor structures based on exploratory analyses.
Although essential to advance the field’s theoretical foundation, the first category is scarce compared to the latter category. At this point, a considerable number of unintegrated, partly contradicting PTT structures and measurements exist, not sufficiently differentiating between components and correlates of trust variables. Exemplarily, for predictability, while clearly related to trust-related outcomes on an empirical level, it remains an open question if it is a part of the trustworthiness expectation itself on a conceptual level or a distinct variable affecting the trustworthiness evaluation. This cannot be solved with mere factor analysis alone, as two constructs can correlate because (a) they are part of the same higher-order construct (typical for personality psychology), (b) because there is a direct causal relationship between them (predictor → outcome), or (c) even just because of other covariates. Thus, this status of the field might be addressed by extending the theoretical basis of conceptualizing variables as either being facets of trust variable themselves or if they represent distinct antecedents or outcomes of these (content validity; see Hinkin, Citation1998).
In the following, we propose a definition and structure of PTT based on the integration of three models proposing theoretical structures for PTT (see ; McKnight et al., Citation2002; Thielmann & Hilbig, Citation2015; Yamagishi et al., Citation2015). These models considerably contribute to the theoretical understanding of psychological processes in PTT and go well beyond approaches assigning “trust propensity scores to individuals who differ in trust behavior,” which, in the end, represents “a mere redescription of observed behavior” (Thielmann & Hilbig, Citation2015, p. 250).
Figure 3. Proposed integrated structure of the propensity to trust with four facets and their relation to previously proposed structures. Note. aMcKnight et al. (Citation2002); Mayer et al. (Citation1995); bMayer et al. (Citation1995); cMayer et al. (Citation1995); Colquitt et al. (Citation2007).
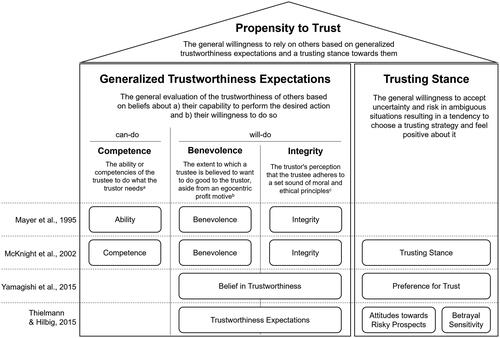
In their conceptualization of trust in e-commerce, McKnight et al. (Citation2002) proposed that, based on a thorough literature review, three beliefs are relevant for trust in a specific trustee and can be generalized to PTT (Rotter, Citation1967): Competence (i.e., beliefs about the trustee’s capability), Benevolence (i.e., beliefs about the trustee’s goodwill), and Integrity (i.e., beliefs about the trustee’s ethical code). As such, this work replicated Mayer et al. (Citation1995),Footnote3 who suggested the same beliefs for organizational trust. Note that in this, McKnight et al. (Citation2002) consequently adopted the notion of Rotter (Citation1967), that beliefs (or expectancy about others) about the individual can be generalized, also applying this for can-do beliefs (in this case Competence) and not only will-do beliefs (i.e., Benevolence and Integrity). McKnight et al. (Citation2002) then further subsumed these generalized beliefs under the label Faith in Humanity. In addition, they proposed Trusting Stance as a PTT facet – a tendency for the “economic choice” (McKnight et al., Citation2002, p. 340) to rather expect trustworthiness of a stranger rather than not, regardless of what one thinks about them. The authors empirically validated their proposed structure of PTT, i.e., two-higher-order factors (Trusting Stance and Faith in Humanity), with three facets (i.e., lower order factors) for Faith in Humanity (i.e., Competence, Benevolence, and Integrity).
Similarly, Yamagishi et al. (Citation2015) proposed a two-factor model for PTT-H. Their first factor, Belief in Trustworthiness, similar to McKnight et al.’s (Citation2002) Faith in Humanity, captures the generalized beliefs about others’ trustworthiness. However, in contrast, Yamagishi et al. (Citation2015) do not include beliefs about others’ competence. Different to McKnight et al. (Citation2002), the second factor, Preference for Trust, does not involve an economic choice but affective aspects, i.e., how trusting someone makes one feel.
Furthermore, in their review on interpersonal trust, Thielmann and Hilbig (Citation2015) propose a multifactorial model for PTT-H, emphasizing the role of affective aspects as a basis for PTT in addition to merely cognitive beliefs about others. As in the two former models, one factor, here labeled Trustworthiness Expectations, summarizes cognitive beliefs about others. Two additional factors capture affective aspects. First, Attitudes towards Risky Prospects encompasses the general acceptance of uncertainty, risk and losses, i.e., risk and loss aversion. Second, Betrayal Sensitivity captures the acceptance of possible negative outcomes when trusting someone.
Taken together, in the realm of theoretically founded, multifactorial PTT-H models, there is consensus that it is at least constituted by two factors. Furthermore, there is considerable agreement that one of these factors captures generalized beliefs about others’ trustworthiness. Yet, there are inconsistencies, in regard to inclusion of (a) the tendency to strategically choose a trusting behavior (trusting stance) or (b) affective components. Also, unlike the other two approaches, McKnight et al. (Citation2002) conceptualize Competence as a generalized belief about others.
We argue that the three reviewed theoretical models do not contradict each other but have different foci and thus can be integrated, providing a more holistic representation of psychological mechanisms contributing to individual differences in PTT. This integrated PTT structure is built up by four basic facets representing the sum of influencing factors discussed: (1) Competence, (2) Benevolence, (3) Integrity, and (4) Trusting Stance. As argued above, we assume that this structure can be transferred to different domain-specific forms of PTT (e.g., interpersonal and automated technology). depicts this structure along with definitions of the proposed PTT dimensions.
The first three facets describe generalized trustworthiness beliefs about others, thus, they can be summarized under the term Generalized Trustworthiness Expectations. Here, a differentiation between can-do beliefs (e.g., Competence) – representing beliefs about the trustee’s ability to act in the trustor’s interest – and will-do beliefs (i.e., Benevolence and Integrity) – referring to whether the trustee will actually use their ability notwithstanding of whether this is within the trustee’s capabilities – can be drawn. There is considerable empirical evidence that both can-do beliefs and will-do beliefs are important predictors of the perceived trustworthiness of a specific other (for a meta-analysis, see Colquitt et al., Citation2007) and are thus proposed to be an essential part of PTT-H (Lankton et al., Citation2015; McKnight et al., Citation2002).
We define the fourth factor – Trusting Stance (adopted from McKnight et al., Citation2002) – as the general willingness to accept uncertainty and risk in ambiguous situations, resulting in a tendency to choose a trusting strategy and feel positive about it. This extends McKnight et al.'s (Citation2002) view of the Trusting Stance as a merely cognitive and conscious strategic trusting choice to a decision-making tendency, which is also nourished by positive emotions when granting trust closely related to the affective aspects suggested by Yamagishi et al. (Citation2015) and Thielmann and Hilbig (Citation2015). Based on this structure, we define PTT-H as the general willingness to rely on other people based on Generalized Trustworthiness Expectations and a Trusting Stance towards them.
As we are not aware of comparably fine-grained theoretical considerations for PTT-A in the literature about the structure of PTT-A and thus its components, we propose that the facets underlying PTT-H are also relevant for PTT-A. However, information processes in forming these two forms of PTT might differ, for instance, in the character of trust cues, their availability in the familiarization process and attributions like social projection (Thielmann & Hilbig, Citation2015), subjectivism or rationality. We further propose that these differences are the very reasons why it seems meaningful to differentiate between trusting humans and technology (Nielsen, Pfattheicher, et al., Citation2022). On this basis, we define PTT-A as the general willingness to rely on automated technology based on Generalized Trustworthiness Expectations and a Trusting Stance towards them.
Based on the integrated PTT model in this research, we investigate how well the theoretically derived facets resemble the empirical structure of PTT and if they are empirically distinguishable. A central question is whether it makes sense to include the Benevolence and Integrity facets of the “will-do” component in the domain of trust in automated technology. This tests the underlying assumption of many popular scales to measure trust in automated technology which include items referring to intentions or morality of technology, e.g., “Automation is deceptive” (Chien et al., Citation2014) or “The system has integrity” (Jian et al., Citation2000) or a general trusting stance, e.g., “I usually trust a technology until it gives me a reason not to trust it” (McKnight et al., Citation2011). Thus, we formulate the following research question:
RQ1: How many dimensions (facets) do accurately reflect the constructs PTT-H and PTT-A and what is their factorial structure?
1.4. Theoretical basis for the nomological network and study hypotheses
As an implication of the assumption that PTT-H and PTT-A are related but distinguishable constructs, they should have (a) similar, yet clearly distinguishable ties to basic personality and (b) differ considerably in their domain-specific outcome prediction. For investigating the foundation of PTT in basic personality, we focus on the HEXACO model (Ashton et al., Citation2004; Ashton & Lee, Citation2007), as it offers comprehensive coverage of broad personality (see Thielmann et al., Citation2021, for a meta-analytic comparison with the Five Factor Model). In the following, based on theoretical considerations, we derive the nomological networks for both PTT-H and PTT-A consisting of (1) basic personality, (2) technology-specific dispositions and (3) domain-specific trust-related outcomes.
A theoretically well-founded discussion of the rooting of PTT-H in basic personality stems from Thielmann and Hilbig (Citation2015). They propose that mainly three of the HEXACO dimensions are influential for PTT-H. First, they suggest that trustworthiness expectations are, besides, e.g., trust cues and prior experience, built up by social projection, which refers to the assumption that others behave similarly to oneself. In this respect, the process of social projection is especially relevant for the Honesty-Humility dimension of the HEXACO (Thielmann, Hilbig, et al., Citation2020), which describes the tendency “to be fair and genuine in dealing with others” (Ashton & Lee, Citation2007, p. 156). Thus, when one perceives oneself as fair and honest, social projection processes might lead to the assumption that others are also being fair and honest, which should, in turn, increase the likelihood of trusting others in general.
Second, Thielmann and Hilbig (Citation2015) propose that dispositional risk and loss aversion affect trust. This, in turn, should be determined by trait anxiety and fear, which are facets of the HEXACO Emotionality, defined as the experience of “fear of physical dangers” and “anxiety in response to life’s stresses” (K. Lee & Ashton, Citation2009). Someone high on (trait) fear will probably worry more about potential risk and losses, thus, experience more anxiety when trusting someone. This link between trait fear and risk/loss aversion has been supported empirically (Maner & Gerend, Citation2007; McCarter et al., Citation2010). This relation is further strengthened by negative relationships between state anxiety and learned trust in automated technology (Kraus, Scholz, et al. Citation2019; Miller et al., Citation2021).
Third, as for the theoretical link between dispositional betrayal sensitivity and PTT-H, Thielmann and Hilbig (Citation2015) propose forgivingness as a personality foundation of PTT, which is a facet of Agreeableness and captures “one’s willingness to feel trust” (Ashton et al., Citation2014, p. 142). In addition to this, it can be hypothesized that, based on the associated interaction styles specified in their respective definitions, also the Gentleness – being “mild and lenient in dealings with other people” (Ashton et al., Citation2014, p. 142) – and the Flexibility facet – “one’s willingness to compromise and cooperate with others” (Lee & Ashton, 2014, p. 142) – support a link between Agreeableness and PTT-H, as both, expecting others not to exploit oneself and a general willingness to cooperate, are important for trust (Ashton et al., Citation2014; Thielmann & Hilbig, Citation2014).
In addition to these three factors, Thielmann and Hilbig (Citation2015) note that Extraversion might also affect the formation of trust. Indeed, based on the definition of Extraversion – “enjoy social gatherings and interactions” (K. Lee & Ashton, Citation2009) – people high in Extraversion might find it rewarding to engage in social situations in general and seek these more. In turn, as many social interactions require trust, individuals high in Extraversion might be more willing to rely on others, as it fulfils their need for sociality.
Moreover, PTT-H might be related to the Dark Factor of Personality, which describes the tendency to maximize one’s own utility at the cost of others (Moshagen et al., Citation2018). By definition, this tendency is accompanied by beliefs that may justify such behavior. In this regard, especially beliefs relating to (not) trusting others’ intentions have been found to correlate considerably with the Dark Factor of Personality (Hilbig et al., Citation2022; Scholz et al., Citation2022). Thus, whereas Honesty-Humility indirectly (through social projection) may affect PTT-H, the Dark Factor of Personality should directly be related to a lower PTT-H, as people high in the Dark Factor of Personality have a negative view on others, thus potentially judging humanity to be less trustworthy as a whole.
For PTT-A, while theoretical work on the personality foundations is scarce (but see Kraus et al., Citation2021), as outlined above, similar effects are reasonable to assume. However, although machines might be perceived as social actors, people still differentiate between humans and machines (Nielsen, Pfattheicher, et al., Citation2022). Given the (typically) more restricted social character of technological trustees, we argue that while social mechanisms might be essential psychological foundations for PTT-A, they should play a reduced role compared to PTT-H. Based on this and assumptions of hierarchical personality models (e.g., Mowen, Citation2000), effect sizes of correlations between basic personality and PTT-A can be expected to be lower than those with PTT-H. This was essentially supported by Kraus et al. (Citation2021), who report considerably higher correlations between Big-Five Extraversion, Agreeableness, Neuroticism, and PTT-H compared to PTT-A in the domain of automated driving. In sum, we hypothesize relationships of PTT-H and PTT-A with basic personality in the same directions, but smaller in size for traits related to prosociality (i.e., Honesty-Humility, Agreeableness, Extraversion, Dark Factor of Personality) for PTT-A as compared to PTT-H.
H1:
PTT-H is stronger related to Honesty-Humility, Agreeableness, Extraversion (positively) and the Dark Factor of Personality (negatively) than PTT-A.
H2:
PTT-H and PTT-A are comparably negatively related to Emotionality.
Along the same rationale, it has been proposed that PTT-A, as a specific personality trait, is more strongly related to specific traits affecting the interaction with technology as compared to PTT-H (Kraus et al., Citation2021). A central personality trait specific for the interaction with technology is the Affinity for Technology. Karrer et al. (Citation2009) define Affinity for Technology as a positive attitude and enthusiasm towards technology. This was extended by Franke et al. (Citation2019) to “the tendency to actively engage in intensive technology interaction […] [as] a key personal resource for coping with technology” (p. 456). In line with Kraus et al. (Citation2021), it can be concluded that people with high Affinity for Technology are more optimistic towards unfamiliar technology and emphasize potential advantages instead of potential downsides and risks in their evaluation. Accordingly, it is hypothesized:
H3:
PTT-A is stronger related to Affinity for Technology (positively) than PTT-H.
To establish further construct validity of PTT-A, it is hypothesized that PTT-A provides better explanations of evaluations and behavior related to relying on automated technology than PTT-H (and vice versa for human-related outcomes):
H4:
PTT-H and PTT-A predict domain-specific outcomes better, respectively:
H4.1
PTT-A is stronger related to the perceived trustworthiness of a specific technological system.
H4.2:
PTT-A is stronger related to the intention to use a specific technological system.
H4.3:
PTT-H is stronger related to behavior in a trust game with a human interaction partner than PTT-A, while PTT-A is stronger related to the behavior in a trust game with a technological system.
A central question of any additionally introduced specific trait is whether it helps to explain additional variance in outcomes over and above established traits or whether it is redundant. As already established for PTT-H (Alarcon et al., Citation2018), we explored the following research question for PTT-A:
RQ2: Does PTT-A predict incremental variance in domain-specific outcomes over and above a) PTT-H, b) the HEXACO traits, c) the Dark Factor of Personality, and d) Affinity for Technology?
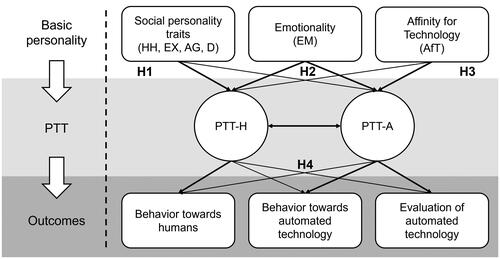
Figure 4. Summary of hypotheses for assessing the construct and predictive validity in the nomological network of the proposed scales. Note. Relative strengths of assumed correlations are illustrated by line thickness. PTT-H = propensity to trust in humans; PTT-A = propensity to trust in automated technological systems; HH = Honesty-Humility, EX = Extraversion; AG = Agreeableness; D = Dark Factor; EM = Emotionality; AfT = Affinity for Technology.
2. Method
2.1. Sample recruitment and study procedure
The main study was conducted online with a British sample recruited from an online panel provider between July and September 2021. The main study was split into three waves (T1, T2, & T3) to avoid fatigue and boredom for participants (see ). An additional follow-up wave was conducted approximately one year after T1 (August 2022). At T1, the basic personality variables were assessed (together with other variables not relevant to the study). At T2, participants answered the PTT items (see Section 2.3.2 for details). At T3, two trust games were implemented and participants evaluated two robots in randomized order (see Section 2.3.3). At the end of T3, participants rated the applicability of benevolence and integrity items framed for automated technology. At the follow-up measurement, participants answered for the 14 items for final scale of PTT-A (see Section 2.3.2) again. Thus, there were overall four measurement occasions for the whole study.
Table 1. Sample characteristics and measures at each wave.
The order of scales within the waves was as follows: All scales were randomized between participants at T1. At T2, PTT-H and PTT-A were presented in randomized blocks, with the respective facets within the blocks being randomized as well. At T3, the interaction partner within the trust game was randomized between participants, as well as the order of the two robot stimuli. For the latter, the evaluation scales were randomized within the respective robot block. Participants were reimbursed according to the panel provider’s regulations. The study was conducted in full accordance with the Ethical Guidelines of the American Psychological Association and informed consent was obtained from all participants. Approval by institutional review boards or committees are not mandatory in the country where the study was run.
2.2. Sample characteristics
N = 815 participants completed T3. Exclusion criteria were applied to ensure high data quality (see Leiner, Citation2019). These criteria were (a) failing at least one of the attention checks, (b) speeding,Footnote4 and (c) flatlining (zero variance on scales with reverse coded items), resulting in a final sample of N = 669 with a mean age of M = 50.6 years (SD = 13.3) and gender distribution of 53% male, 46% female, and 1% other. We refer to that sample as Sample A in the following. Sample A was used for all analyses when not stated otherwise.
The follow-up sample consisted of participants who answered the PTT-A questionnaire already and those who did not. Accordingly, we split the follow-up sample into two sub samples (see ). Sample B consists of participants who already answered the PTT-A at T3 and fulfilled the above-mentioned inclusion criteria for all waves. Sample B was later used to assess the retest reliability of the PTT-A scale. Sample C consists of participants of the follow-up who were not part of Sample A and fulfilled all inclusion criteria. Sample C thus served as an independent sample to validate the model fit of the PTT-A scale.
2.3. Materials
2.3.1. Criteria for the PTT scales
As one aim of the study was to integrate theorizing of PTT-H and PTT-A and compare the nomological network of the two constructs, the following criteria for such a comparison were defined:
High content validity: Items must cover all facets deductively ought to be part of PTT in their full bandwidth, otherwise, outcome prediction might be biased.
Symmetric scale bandwidth: The content (e.g., facets) captured by the scales for each domain must be comparable as otherwise correlations in the nomological network could be biased due to incomparable scale contents.
Comparable number of items: The overall number of items should be comparable to avoid bias by imbalanced scale reliabilities (Lissitz & Green, Citation1975).
Balanced item poling: The number of positively and negatively framed items should be balanced between PTT-H and PTT-A to reduce bias from response styles (Podsakoff et al., Citation2003).
For this, we first collected and reviewed existing scales that ought to measure PTT. As no single scale fulfilled all these criteria, we developed new scales to measure PTT-H and PTT-A.
2.3.2. Scale development
For an overview of the item selection process, see (section “Phase 2: PTT-H and PTT-A Scale Development”). As a first step, an extensive literature review of trust measures was conducted, including scales directly measuring PTT and scales measuring the perceived trustworthiness of a specific agent, resulting in a list of potential trust items.Footnote5 Altogether, in the review, 27 scales from the interpersonal trust domain (20 ought to measure PTT-H; 7 ought to measure trust as an attitude) and 25 scales from the trust in automation domain (11 ought to measure PTT-A; 14 ought to measure trust as an attitude) were collected – which add up to 52 scales with 609 items in total (see Supplementary Table 1 in the OSF for the full list of considered scales).
Before data collection, all items were sorted deductively along the facets of PTT they measure on the basis of the provided definitions. Besides the four facets of PTT we added two more categories – one for items directly measuring PTT on a general level (e.g., “My tendency to trust automated technological systems is high.”) and one for the Generalized Trustworthiness Expectations (e.g., “I generally have faith in automated technological systems”). While on this basis, altogether 315 items could be ordered to one of the six categories, some items had to be omitted as they measured aspects that are not part of PTT on a conceptual level (e.g., enjoying using an automated system) and thus their inclusion would violate content validity (Hinkin, Citation1998).
Next, we noticed that items within one facet of PTT tend to systematically describe different themes. For example, although the items “Automated technological systems are very capable.” and “Automated technological systems have sound knowledge about problems for which they are intended.” both measure Competence, they describe different themes of that aspect (Capability vs. Knowledge). Thus, we inductively derived themes of each facet of PTT and sorted similar items under one umbrella term referring to these themes (see ).
Table 2. Themes identified during the item collection with exemplary items.
Following this, we further reduced the remaining 315 items, as best practice recommendations warn about the threat to model fit due to badly written items (Ford & Scandura, Citation2005; Hinkin, Citation1998). This was done by rating the items by four experts according to how well they reflect the respective theme on a scale from 1 (very unsuitable) to 5 (very suitable), also taking other criteria for each item into account, i.e., understandability, generalizability over a certain situation and avoidance of a double meaning. After a discussion of conflicting ratings and overly represented themes, items with the highest mean scores were included in the final scale to represent each theme of the PTT facets.
In addition, some overly lengthy or complex item wordings were adapted. Also, in some cases, quantifiers were omitted or extreme statements were softened. Finally, to balance out the item pooling and control for response bias, we reframed some items to also measure the low end of PTT,Footnote6 aiming at about one-third of negatively framed items per facet equally distributed over themes. Furthermore, we noticed that for Competence, no item captured the theme Goal Achievement, although mentioned in the definition by McKnight et al. (Citation2002). Similarly, no item covered the Trusting Stance themes of a positive affective reaction to giving trust (Positive Emotions), a focus on positive outcomes when trusting someone (Focus on Positive Outcomes) or the ability to handle uncertainty (Uncertainty). Thus, new items for these four themes were formulated.
This resulted in a final item pool of 47 items for the PTT facets and additional items directly measuring PTT and Generalized Trustworthiness Expectations (6 and 10 items respectively) used for data collection. Of the 47 items,15 referred to Trusting Stance, 13 to Competence, 9 to Benevolence, and 10 to Integrity. Each item was framed for “humans” and “automated technological systems” respectively. The items were measured on a five-point Likert-type scale ranging from 1 (“strongly disagree”) to 5 (“strongly agree”). Afterwards, participants were asked to indicate if they felt they could answer the items of the Benevolence and Integrity facets properly for the framing to technological systems (Yes/No).
The item pool was used to evaluate the best-fitting model for each PTT. Based on this, we constructed the final scales (14 items) and additional short scales (6 items) for both PTT-H and PTT-A in alignment with the described criteria (see Section 2.3.1). Items with an item-rest correlation of <.30 in one domain and an inter-item correlation of >.75 were omitted. To enhance content validity, we aimed at a compromise between scale reliability and the full bandwidth of PTT by selecting at least one item of each theme and a resulting equal number of negatively and positively framed items per PTT facet. This was done based on the loadings on the respective g-factors. For the short scale, based on the same criteria, two items for the can-do, will-do beliefs and Trusting Stance were included, respectively. The full and short PTT-A scales are included in and can also be found in the OSF (https://osf.io/ntypg/) together with instructions on how to administer the scales, as well as, the full item pool.
2.3.3. Other measures
The HEXACO traits were measured with the 60-item version of the HEXACO Personality Inventory-Revised (HEXACO-60; K. Lee & Ashton, Citation2009). The Dark Factor of Personality was measured with 16 items (D16; Moshagen et al., Citation2020) and Affinity for Technology with 9 items (Franke et al., Citation2019) at T1. These scales were measured with a five-point Likert-type scale ranging from 1 (“strongly disagree”) to 5 (“strongly agree”).
At T3, we implemented two forms of the trust game (see, e.g., Johnson & Mislin, Citation2011; Thielmann et al. Citation2021) – an economic game measuring trusting behavior (Thielmann et al., Citation2021) – in which usually two agents (sender and receiver) play together. The sender receives a fixed amount of money and is informed that any amount sent to the receiver is multiplied for the receiver (tripled in this study). Then, the receiver can send money back to the original sender. Multiple rounds can be included. In our study, participants played one round in which they acted as senders and were instructed to imagine playing the game with either a stranger or an unfamiliar robot, respectively. They were asked how much of their money (£10) they want to send to the receiver. The minimum amount was £0 and the maximum amount was £10.
Furthermore, the perceived trustworthiness of two robots (operationalized with 12 items by Jian et al., Citation2000) and the intention to use them were measured at T3 with a five-point Likert-type scale ranging from 1 (“strongly disagree”) to 5 (“strongly agree”). The latter was operationalized with five items (two from Venkatesh & Davis, Citation1996, and three self-formulated). Finally, we measured the answerability of the will-do beliefs for the automated technological systems framing (Yes/No).
2.3.4. Robot stimuli
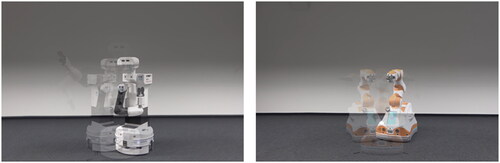
To evaluate the predictive validity of the PTT-A scale, the perceived trustworthiness and the intention to use were assessed for two specific robots. For this, videos (39s and 49s) from Babel, Kraus, Hock, et al. (Citation2021, see ) were presented with short self-introductions of two robots with comparable capabilities but different degrees of human-likeness – the humanoid TiaGO (PalRobotics, left) and the zoomorphic Lio (F&P Robotics, right). In the videos, the robots demonstrated some of their capabilities (e.g., movement of the manipulator, turning).
Figure 5. Robots used in the video stimuli: TiaGO (left) and Lio (right). Note. The figure depicts a combination of different screenshots to visualize the shown movements.
2.4. Statistical analyses
All analyses were conducted using R (version 4.2, R Core Team, Citation2022). For calculations with latent variables, the package lavaan (version 0.6-11, Rosseel et al., Citation2021) and for comparing correlations, the package corcor (version 1.1-3, Diedenhofen & Musch, Citation2015) were used. For latent modeling, raw items scores were used. Variance of latent variables was fixed to 1 to enable model identification. All analyses were based on latent variables utlizing the "MLM"-estimator of lavaan using a robust estimation method (Satorra & Bentler, Citation1994). Data, scripts, and supplementary analyses are available in the OSF (https://osf.io/ntypg/).
2.4.1. Testing the structure of PTT and its facets
For testing RQ1, whether the facets of PTT-H can be distinguished on an empirical level, which factorial structure best represents the nature of the construct, and if a comparable structure describes PTT-A, a series of confirmatory factor analysis (CFA) was conducted to compare possible model structures with the final item pool of 47 for PTT-H and PTT-A respectively ().
Figure 6. Tested model structures. Note. Model comparison was conducted along model fit and information criteria (AIC, BIC) for both trust domains (humans and automated technological systems) separately. PTT = propensity to trust; GTE = generalized trustworthiness expectations.
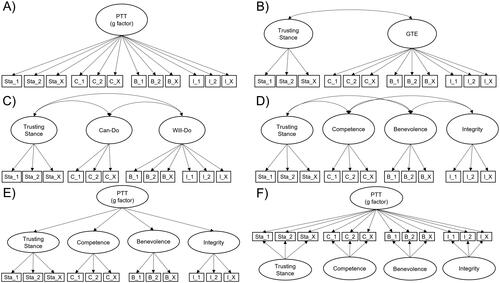
Models A–D resemble different numbers of PTT facets. Model A assumes one general PTT factor (g-factor) for all items, whereas Model D differentiates all four proposed facets. Models B and C contain a reduced number of factors. Models E and F additionally test different factorial structures of a four-factor model, with Model E testing a hierarchical and Model F a bi-factor structure, both introducing a common denominator explaining the covariance between latent factors.Footnote7 Higher-order and bi-factor models differ in the representation of covariances, with a facet in bi-factor models representing the covariance of items after controlling for what all items have in common. For the full and short scales, only a single latent factor model was considered, as the low number of indicators would not allow for a meaningful representation of the facets. Note that all models for PTT-H and PTT-A were run separately, in order to evaluate the model fit of PTT-H independent of PTT-A (and vice versa).Footnote8
We followed the recommendations by Moshagen and Auerswald (Citation2018) to evaluate absolute model fit with RMSEA and SRMR as primary fit indicators, as they are sensitive to different types of model misspecification. Due to recent criticism about incremental fit indices, such as CFI, TFI (Moshagen & Auerswald, Citation2018; van Laar & Braeken, Citation2022) being less adequate to indicate model fit, we did not consider them.
Following popular heuristics, we considered RMSEA ≤ .06 and SRMR ≤ .08 as good and RMSEA ≤ .10 and SRMR ≤ .11 as acceptable model fit (Browne & Cudeck, Citation1992; Hu & Bentler, Citation1999). As such heuristics have been considered as too strict in many cases (see, e.g., H. W. Marsh et al. Citation2004; Moshagen, Citation2012 for details), we also followed a norm-reference approach by H. W. Marsh et al. (Citation2004) and evaluated the model fit of the final scales based on what is usually achieved by comparable scales in the field.
For comparisons between models, the AIC and BIC information criteria (e.g., Kuha, Citation2004) were used to indicate balance between model fit and parsimony. Lower values in AIC and BIC indicate a better model (i.e., a model with a better trade-off between model fit and parsimony). We did not consider the chi-square difference test to evaluate difference in model fit, due to the high power of the current study and its lack of consideration of parsimony. Internal consistency was assessed primarily with McDonald’s omega (ω; McDonald, Citation1999). Additionally, Cronbach’s alpha (α) is reported.
2.4.2. Hypothesis testing of interrelationships in the nomological network
For testing our hypothesis on the interrelations of the two PTT forms with the personality variables and outcomes, structural equation modeling (SEM, see, e.g., Bowen & Guo, Citation2012) was used. To test the differences in the latent correlations of the variables in the nomological net for PTT-H and PTT-A, the difference test for correlations by Zou (Citation2007) was used.
2.4.3. Incremental predictive validity for outcomes
To test RQ2, whether PTT-A can explain incremental variance in technology-specific outcomes, a latent sequential regression approach was used. Hereby, the first step was to regress the outcomes on PTT-A, PTT-H, Affinity for Technology, the HEXACO traits, and the Dark Factor of Personality, respectively, in four separate bivariate regression models to obtain zero-order effects (R2) of each predictor. Next, four multiple regression models were fitted, each containing PTT-A as one predictor and either PTT-H, Affinity for Technology, all HEXACO traits, or the Dark Factor of Personality as additional predictors to obtain the incremental explained variance (ΔR2) of PTT-A over and above PTT-H, Affinity for Technology, all HEXACO traits, or the Dark Factor of Personality respectively (and vice versa).
3. Results
3.1. Testing the structure of PTT and its facets
The OSF contains descriptive values and observed correlations between all scales (Supplementary Table 2). In the following, latent correlations are reported.
First, the facets of both PTTs modelled as separate single factors were correlated. As shown in , the four facets of PTT were highly correlated within one domain (median rPTT-A = .78; median rPTT-H = .76), but considerably weaker correlated between domains (median r = .36). This supports a) that PTT-H and PTT-A are related but not the same construct and b) the existence of a meaningful general factor for both PTT forms.
Table 3. Latent correlations and internal consistencies of the facets of each PTT among each other.
To further test the nature of the dimensionality, the depicted series of model comparisons was conducted (). All models showed at least acceptable model fit. However, for the bi-factor model, AIC and BIC indicated the best trade-off between model fit and parsimony, which was therefore used in subsequent analyses.Footnote9 This was further strongly supported by normalized evidence ratios (Wagenmakers & Farrell, Citation2004) indicating that the bi-factor was 1,000 times more likely to reflect the true nature of interrelations than all other models. In the bi-factor model, all items loaded significantly and overall strongly on the g-factor (median λPTT-A = .59; median λPTT-H = .58; for details see Supplementary Table 7 on the OSF). Consequently, the general factors of both domains showed very good internal consistency (ωPTT-A = .86; αPTT-A = .96; ωPTT-H = .87; αPTT-H = .96) and a high ECV (PTT-A = 66%, PTT-H = 68%). Together with a PUC for both PTT-A and PTT-H of .76, this indicates that the assumption of unidimensionality is sufficiently met (Hammer, Citation2016; Reise et al., Citation2013), and thus, the respective g-factor best captures PTT in both domains. In the presence of a strong g-factor, facets are usually hard to interpret on a content level (Sellbom & Tellegen, Citation2019) and thus should not be interpreted (Rodriguez et al., Citation2016a, Citation2016b).Footnote10 It is still worthwhile to model the facets, however, as they capture “method or other significant nuisance variance” (Sellbom & Tellegen, Citation2019, p. 1438), which would otherwise distort model fit when omitted. A subsequent analysis of PTT-A and PTT-H (both as g-factors in a bi-factor model) in tandem revealed a latent correlation between PTT-H and PTT-A of r = .45, p < .001.
Table 4. Model fit of all model structures for PTT-A and PTT-H.
Modelling the items directly measuring PTT-H and PTT-A on a single factor resulted in an inacceptable model fit (PTT-H: χ2(9) = 209, p < .001, RMSEA = .182, SRMR = .092; PTT-A: χ2(9) = 122, p < .001, RMSEA = .137, SRMR = .055). The same was true for modelling the items directly measuring Generalized Trustworthiness Expectations on a single factor (Human: χ2(35) = 538, p < .001 RMSEA = .147, SRMR = .071; Automation: χ2(35) = 360, p < .001 RMSEA = .118, SRMR = .050). Accordingly, as the fit for models including items directly referring to PTT with a general trust framing or items reflecting Generalized Trustworthiness Expectations directly could not be validated, these were not further analyzed. Thus, in the following, we focus on those models which have their basis in items reflecting the trustworthiness beliefs and Trusting Stance.
3.2. Evaluation of the short scales
As described in Section 2.3.2, for each PTT form, two scale versions were constructed – a final scale (14 items) and a short scale (6 items). The short scales overall showed adequate fit to the data and very good reliability (). Item descriptives of the final scales are depicted in . In the second sample (Sample C), in which the PTT-A scale versions were administered (see ), adequate fit for the 14-item version and acceptable model fit for the 6-item version (RMSEA slightly exceeded the threshold) could be replicated. Retest reliability (correlation of the PTT-A scales between Sample A and B) was acceptable and indicated that PTT-A is relatively stable over approximately one year.
Table 5. Reliability and model fit of the final and short scales for both PTTs.
Table 6. Final scale of the propensity to trust in other humans (PTT-H) and the propensity to trust in automated technology (PTT-A).
Correlations of the respective final scales with the g-factor from the full item pools were in both cases very high (rPTT-H = .96; rPTT-A = .96). The same was true for the short scales (rPTT-H = .92; rPTT-A = .92). Accordingly, the final and short scales overall replicated the correlation pattern of the full scales with the personality traits and outcomes (see Supplementary Table 3 and Table 4 in the OSF). In sum, the validity and applicability of the final and short scales to measure PTT in both domains were supported. Accordingly, we report only the analyses with the final scales of PTT-A and PTT-H in the following sections of the manuscript, i.e., the 14 item versions. Analyses with the full item pool or the 6-item short scale led to the same conclusion regarding all hypotheses (see Supplementary Table 3 and Table 4 in the OSF).
3.3. Hypothesis testing of interrelationships in the nomological network
Overall, analyses on the relative strength of relationships of PTT-H and PTT-A with the included personality traits (H1-H3) and outcomes (H4a-c) were in alignment with the hypothesized pattern ( and ).
Figure 7. Latent correlations of the final item sets (14 items) for measuring PTT-H and PTT-A with dispositional variables representing the nomological networks. Note. Error bars indicate 95% CIs for the correlations; *p < .05.
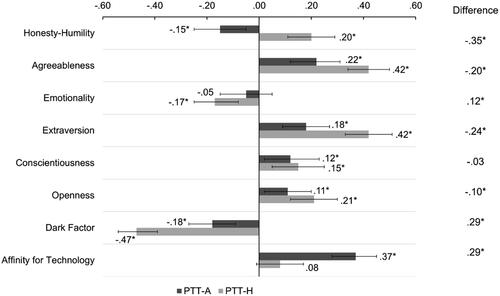
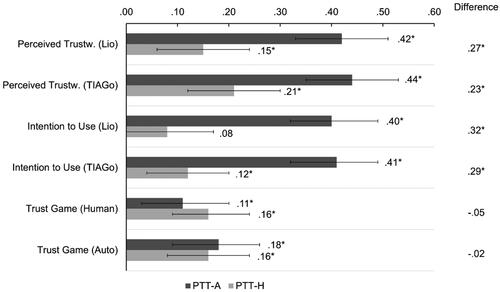
Figure 8. Latent correlations of the final item sets (14 items) for measuring PTT-H and PTT-A with outcome variables indicating predictive validity. Note. Error bars indicate 95% CIs for the correlations; *p < .05; Perceived Trustw. = Perceived Trustworthiness; Lio and TIAGo are the two robot stimuli.
Regarding H1, PTT-H was generally stronger related to the (pro-)social personality traits than PTT-A. Surprisingly however, it was also stronger related to Emotionality than PTT-A, contradicting H2. In fact, PTT-A was not significantly related to Emotionality at all. In line with H3, PTT-A was stronger related to Affinity for Technology than PTT-H. Although not hypothesized, a significant difference was also found for the HEXACO facet Openness (PTT-H > PTT-A) but not for Conscientiousness, with which both PTTs were significantly positively related.
Regarding the relationships to the outcome variables (H4), in support of H4.1 and H4.2, PTT-A predicted trust in the robots and the intention to use these significantly better than PTT-H. However, H4.3 was not supported. While both forms of PTT significantly predicted the amount of money sent in the trust game, no differences were found between the two PTT forms for the two agents (human vs. robots).
To investigate the role of subjective answerability of the will-do items with the framing to automated technology, a series of correlational analyses was conducted only with items rated as answerable by at least 75% of participants (6 items). Results lead to the same conclusions for all hypotheses (see Supplementary Table 3 in the OSF).
3.4. Predictive validity for outcomes
To answer RQ2, if PTT-A is able to explain additional variance in technology-related outcomes over PTT-H and the other included personality variables, sequential latent regression analyses of PTT-A against PTT-H, Affinity for Technology, the HEXACO model, and the Dark Factor of Personality were conducted (). Results revealed that PTT-A improved outcome prediction over and above PTT-H (ΔR2: 1–17%), Affinity for Technology (ΔR2: 1–8%), the HEXACO traits (ΔR2: 1–10%), and the Dark Factor of Personality (ΔR2: 3–21%). For more details on the beta-coefficients for each regression model see Supplementary Table 6 in the OSF. Taken together, this indicates that PTT-A has vital incremental validity over established personality traits in all outcomes.
Table 7. Explained variance (R2) and incremental validity (ΔR2) of the final PTT-A scale (14 items) and other traits beyond each other for automated technology specific outcomes.
4. Discussion
4.1. Summary of findings and theoretical Implications
This study aimed to compare PTT-A to PTT-H and to develop and validate measurement instruments for both domains. To do so, different theoretical conceptualizations of PTT were integrated into a combined structure of PTT constituting the basis for scale development. In this, available scales from various domains of trust research were reviewed and items were ordered in the integrated PTT structure and reduced to represent specific themes. To shorten and validate the scales, we conducted an online study (N = 669) and analysed data with CFAs and SEMs. The presented research is the first of its kind to establish a theoretically well-founded structure of PTT-A and thoroughly investigate the communalities and differences of the embeddedness of PTT in other humans and PTT in automated technology. In this, five research questions were answered.
4.1.1. Which underlying dimensions (facets) are meaningful to be distinguished in both forms of PTT?
This research is based on the general idea that PTT-H constitutes a more general form of PTT-A and that these constructs are built on a comparable structure of underlying facets. Based on three existing theoretical models (McKnight et al., Citation2002; Thielmann & Hilbig, Citation2015; Yamagishi et al., Citation2015), an integrated PTT structure was introduced, proposing four facets: the three Generalized Trustworthiness Expectations (i.e., beliefs) Competence, Benevolence, and Integrity and the Trusting Stance as a dispositional strategic trusting choice. The results of the bi-factor model imply that these are all part of an essentially unidimensional general PTT-factor.
4.1.2. How can PTT-A be measured in a valid manner?
In the empirical validation, overall, the proposed facets of PTT were highly related within domains (median r = .77) and less related across domains (median r = .35). To better capture the underlying structure of PTT, six models were fitted and compared with CFAs for PTT-A and PTT-H. All models showed acceptable model fit, indicating high internal validity. Considering the principle of parsimony, the bi-factorial model showed the best convergence with the data in both domains, implying a g-factor resembling PTT with the four facets Competence, Benevolence, Integrity, and Trusting Stance. In this, the presented findings validate the inclusion of affective aspects (e.g., Thielmann & Hilbig, Citation2015; Yamagishi et al., Citation2015). Also, the inclusion of both a can-do and will-do component as the foundation of the individual tendency to trust were supported (e.g., Mayer et al., Citation1995; McKnight et al., Citation2002). Moreover, in addition to merely belief-based variance portions, also an individual tendency to choose trust or trusting behavior as a strategy associated with a positive feeling in face of uncertainty and risk, i.e., Trusting Stance, constitutes an essential personality component of PTT (in line with reasoning by McKnight et al., Citation2002 and Yamagishi et al., Citation2015). Notably, the factors in the present study were considerably stronger correlated than in McKnight et al. (Citation2002), which might result from their framing of the Competence beliefs for professionals, while the remaining factors were framed for humans in general.
Also, the answerability of the will-do items for automated technology was investigated. Interestingly, comparable to the findings by Chita-Tegmark et al. (Citation2021), about 35% of these items were not perceived as answerable. We further analysed the relation of these items to those items rated as answerable by most participants. Interestingly, the subjectively less answerable items produced meaningful answers comparable to the subjectively answerable ones. Therefore, while initially attributing the more human-like characteristics of the will-do facets to automated technology, when being directly asked for answerability, different processes seem to be at play – possibly leading to overly rationalized arguments that do not resemble the automated attribution of these human-like characteristics. Thus, in general, we agree with the statement of Chita-Tegmark et al. (Citation2021) that “simply discarding items from measures for being too anthropomorphic is not a good idea […as…] we would be missing out on information about people’s tendencies to place social and relational trust in robots” (p. 8). Seemingly, people, at least for PTT, are able to assess the Benevolence and Integrity of automated technology. Therefore, keeping these items in a PTT-A scale seems recommendable while N/A answering options render the application of many common and powerful statistical methods difficult.
Taken together, this structure supports the role of trustworthiness expectations towards both groups of trustees. In both domains, PTT is not merely a result of assessing the generalized Competence of members of the groups but also based on the perception of goodwill (Benevolence and Integrity). Additionally, PTT is established by the individual tendency to choose trust as a default strategic choice associated with positive feelings in the presence of uncertainty and risk (Trusting Stance).
4.1.3. How do PTT-A and PTT-H relate to personality variables in the nomological network?
The reported interrelationships to variables in the nomological network, mostly in line with hypotheses, support construct validity of both the proposed theoretical conception and the derived scales to measure PTT-H and PTT-A. First of all, the general factors of both PTT forms showed a moderate correlation, indicating a conceptual overlap between PTT-H and PTT-A, which is further supported by a shared personality foundation as reflected by significant correlations with Agreeableness, Extraversion, and the Dark Factor of Personality to both forms of PTT. Whatsoever, in line with our hypothesizing, the higher correlations of PTT-H to these basic personality traits (H1) support the assumption that PTT-H is a more general trait closer to basic personality than PTT-A. This is further supported by a positive relationship of PTT-H to Honesty-Humility, which was not found for PTT-A. Interestingly, there was also a significant difference for Emotionality, contradicting H2. This unexpected pattern might result from the character of Emotionality, which can be thought of as a social factor representing kin altruism (Ashton & Lee, Citation2007), which might not be a basis for interacting with technology. Also, in line with H3, PTT-A was positively related to Affinity for Technology, while PTT-H was not.
Taken together, while these findings support a some sort of shared variance of the two PTT forms, it also shows that they are not the same and that PTT-A exists on a more specific level than PTT-H. This supports and extends the findings of Kraus et al. (Citation2021), who found similar patterns in comparing PTT-H and PTT-A. This research essentially adds to the understanding of the personality of those that tend to trust automated technology more than others. These people mainly tend to be more interested in and optimistic about technology, are more agreeable and extraverted, and score lower on the Dark Factor of Personality. These differences, on the one hand, help to understand the psychological processes in forming and calibrating one’s trust in technology. On the other hand, they help to provide directions for the design of information and interaction concepts for automated technology, aiming at well-balanced learned trust and usage decisions of these systems (see practical implications).
4.1.4. How well do the two forms of PTT predict technology-related decision-making?
Furthermore, in substantial support of the predictive validity of PTT-A, essential predictions of the perceived trustworthiness and the intention to use two robots were found, supporting H4.1 and H4.2. Construct validity of PTT-A was thereby strongly supported by better predictions of these technology-specific outcomes than PTT-H. This pattern of findings further supports the idea that PTT-A constitutes a domain-specific form of PTT-H relevant for understanding trust-related decisions and behavior in the interaction with automated technology.
Both forms of PTT were found to significantly predict decisions in the trust game with human and robotic agents. This is especially important for PTT-A as researchers have noted than links between self-reported PTT-A and behaviour is scarce (Jessup et al., Citation2019). The resulting magnitudes of effects are in line with the expected, commonly small, effect sizes of relationships between personality traits and specific behavior (see Thielmann, Spadaro, et al., Citation2020). However, the two forms of PTT did not show the hypothesized differential pattern of predictions for the trust games with the respective agents, contradicting H4.3. In retrospect, the restricted realism of the presented material as a basis for evaluating the perceived trustworthiness and intention to use of the introduced robots and an actual cooperative task allowing for learning and expectation building might not reflect well enough the character of tasks that are actually conducted together with automated technology.
4.1.5. Does PTT-A provide incremental predictive validity over other personality traits?
While previous research has shown that PTT-H has incremental validity above basic personality traits (Alarcon et al., Citation2018), empirical support for this was missing for PTT-A. Latent sequential regression analyses supported incremental explanatory power for the perceived trustworthiness of and the intention to use two robots and trust behavior in a trust game with imagined robotic interaction partners over general and established personality traits (HEXACO, Affinity for Technology, Dark Factor of Personality, PTT-H). Hence, PTT-A constitutes a promising variable to predict trust variables in various automated technological systems – including but not limited to automated driving systems, social robots, AI algorithms and conversational agents.
4.1.6. How can the economy of a PTT-A scale be optimized?
Based on the promising support for the proposed structure of PTT-A, a final economic version of the scale representing each theme of the PTT facets was constructed and further validated. Additionally, a short scale reflecting PTT with six items was constructed. These scales include a balanced number of positive and negative items in order to control for response bias (e.g., Wetzel et al., Citation2016). For both scales, model fit was acceptable and within the range of what is usually achieved by PTT scales of comparable length in both domains (see, e.g., Frazier et al. Citation2013; Merritt et al., Citation2019), which indicates that the model fit can be assumed as “good-enough” according to a norm-reference approach (H. W. Marsh et al., Citation2004). Furthermore, reliability and retest reliability after one year were supported (comparable to that of, e.g., Agreeableness; Gnambs, Citation2014). As virtually the same pattern of correlations to the variables in the nomological networks was found, these scales can be used as economical alternatives to the initial full item set in research and practical work. Anyhow, the full item set seems still valuable in work addressing the role of the single facets in trust formation and calibration processes.
Taken together, this research contributes to understanding the psychological processes of trust formation towards automated technology as well as its relatedness to trust in other humans. The introduced PTT-A scale provides an economical, valid and reliable way of measuring the individual tendency to trust automated technology. Thereby, a key potential of PTT-A is its inclusion as a moderator. Especially in longitudinal analyses, this allows an observation of individual patterns of the formation and calibration of trust in specific automated systems (e.g., why initial trust levels differ). Comparable research has already been undertaken in the field of interpersonal trust (Alarcon et al., Citation2016) and has started in the domain of human-robot interaction (Miller et al., Citation2021). Further directions for future research based on the provided PTT structure and scale for which the presented work constitutes a meaningful starting point are discussed in the following.
4.2. Future research
The developed structure and measure in this study are limited to PTT, i.e., a dispositional trust variable reflecting a personality trait. Based on the provided findings, the construction and validation of trust scales to measure the trustworthiness expectations (learned trust as an attitude) and reliance intentions towards a specific agent (and possibly a specific situation) constitutes a meaningful endeavour to enhance clarity of the theoretical conception and psychometric assessment of trust in automation (see ). In this, the role of some beliefs might be attenuated in certain tasks, contexts and specific systems (e.g., work vs. healthcare robots). Especially interesting will be the role of PTT-A and its facets in trusting and relying on technology with different levels of human-likeness (see Lankton et al., Citation2015). Also, possibly the relative role of Generalized Trustworthiness Expectations facets and Trusting Stance might change over trust variables (e.g., will-do beliefs might be more relevant in trustworthiness expectations and Trusting Stance might be more relevant for the reliance intention), which might be further addressed in future research.
In terms of the specificity of PTT, additional, more narrow forms of PTT-A can be thought of (e.g., specific for social robots). While respective measures could be better adapted to the domain (e.g., for social robots, will-do beliefs might be more important than for automated driving systems), and thus have more predictive validity (Jessup et al., Citation2019), more specific forms of PTT might be overly tailored to a very narrow application field (e.g., healthcare robot) and thus hard to interpret on a theoretical level a (see also bandwidth-fidelity dilemma, e.g., Mowen, Citation2000). Anyhow, the initial item pool presented in this study can serve as a starting point for adaptations to other forms of PTT – also for other domains of trusting a group of agents like organizations. The item set is freely available (see OSF) and we are happy to collaborate in translating the scale into other languages or adapting it to other groups of agents.
Last, during the scale construction, we came to the conclusion that out of the 609 items from the 52 initially identified trust scales, many items did not measure trust. This issue could be further investigated by conducting factorial analyses over different scales ought to measure trust in order to identify whether they all load on one factor (a necessity if they all measure trust) or on different factors.
4.3. Practical implications
This research holds several meaningful implications for designing trustworthy automated technological systems. Foremost, the individual disposition as the sum of experiences provides a meaningful starting point for understanding initial differences in trust towards specific automated technological systems (e.g., Miller et al., Citation2021). The presented PTT-A scale provides an economic tool for practitioners to measure and control these differences in usability and user experience studies. Furthermore, the economic and valid measurement of PTT-A facilitates the design of individualized information in the dissemination of new technological systems and personalized interaction strategies which foster trust calibration in the adoption and familiarization phases of these systems. For new technology, which is starting to spread in society, this implies that especially early interactions with these systems might form the basis for learning to trust it, which is then transferred and used as a reference point in future interactions with the subsequent members of this group of technical systems. The presented structure of PTT and the embeddedness of PTT-A in basic personality thereby sheds light on the underlying processes of developing trust, providing directions for designing trustworthy automated systems. In this regard, the communication of information related to trustworthiness beliefs seems especially worthwhile to be designed in an informed manner to calibrate trust levels early on in the dissemination processes of new automated technology (see also Kraus et al., Citation2020).
4.4. Limitations
Regarding study limitations, first, the item pool might be biased as items were pre-selected according to expert ratings. However, a pre-selection based on deductively derived criteria seemed necessary as inclusion of the initial 609 items would have been misleading as many of these did not measure trust but rather antecedent or outcome variables. Also, with the 315 items identified in the first step of selection, a merely explorative approach might neither have let to high reliability or validity as some of the items were not written adequately for our purpose (see Ford & Scandura, Citation2005). In this respect, the testing of competing models in our approach seems very reassuring that, indeed, a consideration of all proposed facets seems meaningful. As a second limitation, the focus of this research on PTT-A led to a somewhat peripheral role of the proposed PTT-H scale, which by itself likely constitutes a considerable advancement of measurement of this trait as well. Further validation of this scale falls into the domain of future research. A third limitation is the restriction to robot-related criteria for assessing the predictive validity of the PTT-A scale. This might also be extended in future research to domains like AI recommender systems and automated driving. Fourth, the HEXACO-60 did not allow for an analysis of differential effects of the HEXACO facets (especially the sentimentally, dependability, fear, and anxiety facets of Emotionality). Future research might further examine the link of the HEXACO facets with PTT-H and PTT-A. Fifth, the results regarding the two versions of the trust games were quite similar. Although imagining hypothetical others in the trust game has been found to reproduce very similar findings to playing with real incentives (Thielmann et al., Citation2016), it might not be suited for comparing trust-based decisions with a human and an automated interaction partner. For this, more graphical instructions might be needed (e.g., photo of the partner). However, the hypothetical version of the trust game has the advantage that, in accordance with the ethical code of the APA, no deception is needed (APA, Citation2022; Hilbig et al., Citation2022). Last, the presented study mainly included self-reports. While this is common in the field, comparing self and observed reports might constitute a worthwhile step to further contribute to the scale’s validity.
4.5. Conclusion
The individual disposition to trust is a key variable for investigating initial expectation building and trust formation in early familiarization with automated technological systems. Against this, a structure and scales for measuring PTT-H and PTT-A were developed and validated in this research. Findings support a conceptualization of PTT-A as a specific personality trait referring to the individual tendency to be willing to rely on automated technology as a narrower derivative of the general PTT-H. The resulting 14-item scale has excellent reliability and validity and provides good predictions of the perceived trustworthiness of robots and decisions in a trust game with a robot. These predictions go well beyond the propensity to trust humans and other established technological-specific traits underlining the incremental value of PTT-A and the presented measure. The factorial structure was replicated in a second study and its retest reliability was established. Taken together, this work essentially contributes to a better understanding of the basis of trust in automation in general personality and its relation and embeddedness in the psychological processes of trusting other people.
Data availability statement
All data, analyses scripts, and the developed scales are freely available at the Open Science Framework (OSF): https://osf.io/ntypg/.
Disclosure statement
No potential conflict of interest was reported by the author(s).
Additional information
Funding
Notes on contributors
David D. Scholz
David D. Scholz is a PhD student at the Experimental Psychology & Personality Lab at the University of Kaiserslautern-Landau (RPTU). He has a background in Personality Psychology and Human Factors. His research interests are individual differences in applied fields such as human-machine interaction or Clinical Psychology.
Johannes Kraus
Johannes Kraus is an assistant professor at the Johannes Gutenberg-University of Mainz. One of his main research interests is decision-making processes in the interaction with intelligent systems. In this, besides others, his research focuses on trust processes and the role of user personality and attitudes.
Linda Miller
Linda Miller is a PhD student at the Department Human Factors at Ulm University. She has a background in Psychology and Human Factors. Her research interests are information processing and decision-making in human-robot interaction, automated driving, and human-machine cooperation.
Notes
1 A nomological network is a tool for construct validation. In this, relationships of a given construct with other constructs (e.g., antecedents, covariates, outcomes) are theoretically defined and empirically tested, forming a “net” of theoretically informed associations (for details see, e.g., Cronbach & Meehl, Citation1955; Preckel & Brunner, Citation2017).
2 Also labeled as learned trust (e.g., in J. D. Lee & See, Citation2004; Kraus, Citation2020).
3 Mayer et al. (Citation1995) focused on trust as an attitude in their work.
4 At T1 and T2, speeding was defined as taking less than 2 seconds per item on average. On T3, as there were less questionnaires and more behavioral tasks to complete, we excluded participants which completed the survey in less than 40% of the median duration (see Greszki et al., Citation2014).
5 As argued before, it is widely assumed that the same beliefs which are important for a specific agent, are also important for PTT (Rotter, Citation1967; Citation1971; McKnight et al. Citation2002).
6 Note that there is an ongoing debate whether the low end of trust can be seen as distrust. While some researchers, in line with Mayer et al. (Citation1995), clearly conceptualize distrust as the low end of the unidimensional variable trust (see also, e.g., Jian et al., Citation2000; Schoorman et al., Citation2007; Thielmann & Hilbig, Citation2015) some researchers argue that distrust is an independent dimension (e.g., Lewicki et al., Citation1998; McKnight & Chervany, Citation2001; van de Walle & Six, Citation2014). As Alarcon et al. (Citation2022) show, such a two-dimensional trust-distrust concept does not withstand empirical testing at least for PTT, wherefore we included negatively framed items for our measure of PTT. A discussion on whether this is also appropriate for other levels of trust, i.e., attitude, intention, is beyond the scope of this work.
7 Note that with only three factors, a correlated factor model and a higher-order model are empirically not distinguishable, i.e., they lead to the exact same variance-covariance structure.
8 For readers interested in the covariation of items between PTT-H and PTT-A, we refer readers to the OSF, where a code for the respective model is provided.
9 This was also supported by explorative factor analyses, also indicating a strong general factor and four facets for PTT-H and PTT-A respectively (for details please see the respective supplement in the OSF).
10 We included an analysis of the correlations of the four correlated factors structure with all outcomes in the OSF (Supplementary Table 5). However, because the facets are highly correlated and reliability of the g-factor is high, a bi-factor model is the more appropriate modeling approach here.
References
- Alarcon, G. M., Capiola, A., Hamdan, I. A., Lee, M. A., & Jessup, S. A. (2023). Differential biases in human-human versus human-robot interactions. Applied Ergonomics, 106, 103858. https://doi.org/10.1016/j.apergo.2022.103858
- Alarcon, G. M., Capiola, A., Lee, M. A., & Jessup, S. A. (2022). The effects of trustworthiness manipulations on trustworthiness perceptions and risk-taking behaviors. Decision, 9(4), 388–406. https://doi.org/10.1037/dec0000189
- Alarcon, G. M., Gibson, A. M., Jessup, S. A., & Capiola, A. (2021). Exploring the differential effects of trust violations in human-human and human-robot interactions. Applied Ergonomics, 93, 103350. https://doi.org/10.1016/j.apergo.2020.103350
- Alarcon, G. M., Lyons, J. B., & Christensen, J. C. (2016). The effect of propensity to trust and familiarity on perceptions of trustworthiness over time. Personality and Individual Differences, 94, 309–315. https://doi.org/10.1016/j.paid.2016.01.031
- Alarcon, G. M., Lyons, J. B., Christensen, J. C., Bowers, M. A., Klosterman, S. L., & Capiola, A. (2018). The role of propensity to trust and the five factor model across the trust process. Journal of Research in Personality, 75, 69–82. https://doi.org/10.1016/j.jrp.2018.05.006
- Allport, G. W. (1961). Pattern and growth in personality. Holt, Reinhart & Winston. https://psycnet.apa.org/record/1962-04728-000
- APA. (2022). Ethical principles of psychologists and code of conduct. https://www.apa.org/ethics/code#807
- Asan, O., Bayrak, A. E., & Choudhury, A. (2020). Artificial intelligence and human trust in healthcare: Focus on clinicians. Journal of Medical Internet Research, 22(6), e15154. https://www.jmir.org/2020/6/e15154/; https://doi.org/10.2196/15154
- Ashton, M. C., & Lee, K. (2007). Empirical, theoretical, and practical advantages of the HEXACO model of personality structure. Personality and Social Psychology Review, 11(2), 150–166. https://doi.org/10.1177/1088868306294907
- Ashton, M. C., Lee, K., Perugini, M., Szarota, P., Vries, R. E. d., Di Blas, L., Boies, K., & Raad, B. d (2004). A six-factor structure of personality-descriptive adjectives: Solutions from psycholexical studies in seven languages. Journal of Personality and Social Psychology, 86(2), 356–366. https://doi.org/10.1037/0022-3514.86.2.356
- Ashton, M. C., Lee, K., & de Vries, R. E. (2014). The HEXACO Honesty-Humility, Agreeableness, and Emotionality factors: A review of research and theory. Personality and Social Psychology Review, 18(2), 139–152. https://doi.org/10.1177/1088868314523838
- Babel, F., Kraus, J. M., Hock, P., Asenbauer, H., & Baumann, M. (2021). Investigating the validity of online robot evaluations: Comparison of findings from an one-sample online and laboratory study [Paper presentation]. In C. Bethel, A. Paiva, E. Broadbent, D. Feil-Seifer, & D. Szafir (Eds.), Companion of the 2021 ACM/IEEE International Conference on Human-Robot Interaction (pp. 116–120). ACM. https://doi.org/10.1145/3434074.3447141
- Babel, F., Kraus, J., Miller, L., Kraus, M., Wagner, N., Minker, W., & Baumann, M. (2021). Small talk with a robot? The impact of dialog content, talk initiative, and gaze behavior of a social robot on trust, acceptance, and proximity. International Journal of Social Robotics, 13(6), 1485–1498. https://doi.org/10.1007/s12369-020-00730-0
- Beggiato, M., & Krems, J. F. (2013). The evolution of mental model, trust and acceptance of adaptive cruise control in relation to initial information. Transportation Research Part F: Traffic Psychology and Behaviour, 18, 47–57. https://doi.org/10.1016/j.trf.2012.12.006
- Bowen, N. K., & Guo, S. (2012). Structural equation modeling. Pocket guide to social work research methods series. Oxford University Press.
- Browne, M. W., & Cudeck, R. (1992). Alternative ways of assessing model fit. Sociological Methods & Research, 21(2), 230–258. https://doi.org/10.1177/0049124192021002005
- Carli, R., & Najjar, A. (2021). Rethinking trust in social robotics. SCRITA. https://arxiv.org/pdf/2109.06800
- Chien, S. ‑Y., Semnani-Azad, Z., Lewis, M., & Sycara, K. (2014). Towards the development of an inter-cultural scale to measure trust in automation. In D. Hutchison, T. Kanade, J. Kittler, J. M. Kleinberg, A. Kobsa, F. Mattern, J. C. Mitchell, M. Naor, O. Nierstrasz, C. Pandu Rangan, B. Steffen, D. Terzopoulos, D. Tygar, G. Weikum, P. L. P. Rau, & P. P. Rau (Eds.), Lecture notes in computer science Information systems and application, incl. Internet/web and HCI: Vol. 8528. Cross-cultural design: 6th International Conference, CCD 2014, held as part of HCI International 2014 [16th International Conference on Human-Computer Interaction], Heraklion, Crete, Greece, June 22-27, 2014; proceedings (Vol. 8528, pp. 35–46). Springer. https://doi.org/10.1007/978-3-319-07308-8_4
- Chita-Tegmark, M., Law, T., Rabb, N., & Scheutz, M. (2021). Can you trust your trust measure? In C. Bethel, A. Paiva, E. Broadbent, D. Feil-Seifer, & D. Szafir (Eds.), Companion of the 2021 ACM/IEEE International Conference on Human-Robot Interaction (pp. 92–100). ACM. https://doi.org/10.1145/3434073.3444677
- Coeckelbergh, M. (2012). Can we trust robots? Ethics and Information Technology, 14(1), 53–60. https://doi.org/10.1007/s10676-011-9279-1
- Colquitt, J. A., Scott, B. A., & LePine, J. A. (2007). Trust, trustworthiness, and trust propensity: A meta-analytic test of their unique relationships with risk taking and job performance. The Journal of Applied Psychology, 92(4), 909–927. https://doi.org/10.1037/0021-9010.92.4.909
- Cronbach, L. J., & Meehl, P. E. (1955). Construct validity in psychological tests. Psychological Bulletin, 52(4), 281–302. https://doi.org/10.1037/h0040957
- Das, T. K., & Teng, B. ‑S. (2004). The risk-based view of trust: A conceptual framework. Journal of Business and Psychology, 19(1), 85–116. https://doi.org/10.1023/B:JOBU.0000040274.23551.1b
- Dasgupta, P. (1988). Trust as a commodity. In D. G. Gambetta (Ed.), Trust (pp. 49–72). Basil Blackwell. https://philpapers.org/rec/dastaa-2
- De Visser, E. J., Monfort, S. S., McKendrick, R., Smith, M. A., McKnight, P. E., Krueger, F., & Parasuraman, R. (2016). Almost human: Anthropomorphism increases trust resilience in cognitive agents. Journal of Experimental Psychology. Applied, 22(3), 331–349. https://doi.org/10.1037/xap0000092
- Diedenhofen, B., & Musch, J. (2015). Cocor: A comprehensive solution for the statistical comparison of correlations. PloS One, 10(3), e0121945. https://doi.org/10.1371/journal.pone.0121945
- Farris, G. F., Senner, E. E., & Butterfield, D. A. (1973). Trust, culture, and organizational behavior. Industrial Relations: A Journal of Economy and Society, 12(2), 144–157. https://doi.org/10.1111/j.1468-232X.1973.tb00544.x
- Franke, T., Attig, C., & Wessel, D. (2019). A personal resource for technology interaction: development and validation of the Affinity for Technology Interaction (ATI) Scale. International Journal of Human–Computer Interaction, 35(6), 456–467. https://doi.org/10.1080/10447318.2018.1456150
- Frazier, M. L., Johnson, P. D., & Fainshmidt, S. (2013). Development and validation of a propensity to trust scale. Journal of Trust Research, 3(2), 76–97. https://doi.org/10.1080/21515581.2013.820026
- Ford, L. R., Scandura, T. A. (2005). Garbage-in, garbage-out: Item generation as a threat to construct validity [Paper presentation]. Proceedings of the Southern Management Association.
- Gill, H., Boies, K., Finegan, J. E., & McNally, J. (2005). Antecedents of trust: Establishing a boundary condition for the relation between propensity to trust and intention to trust. Journal of Business and Psychology, 19(3), 287–302. https://doi.org/10.1007/s10869-004-2229-8
- Glikson, E., & Woolley, A. W. (2020). Human trust in artificial intelligence: Review of empirical research. Academy of Management Annals, 14(2), 627–660. https://doi.org/10.5465/annals.2018.0057
- Gnambs, T. (2014). A meta-analysis of dependability coefficients (test–retest reliabilities) for measures of the Big Five. Journal of Research in Personality, 52, 20–28. https://doi.org/10.1016/j.jrp.2014.06.003
- Gompei, T., & Umemuro, H. (2018). Factors and development of cognitive and affective trust on social robots. In S. S. Ge, J.-J. Cabibihan, M. A. Salichs, E. Broadbent, H. He, A. R. Wagner, & Á. Castro-González (Eds.), Social robotics: 10th International Conference, ICSR 2018, Qingdao, China, November 28 - 30, 2018, Proceedings (Vol. 11357, pp. 45–54). Springer International Publishing. https://doi.org/10.1007/978-3-030-05204-1_5
- Greszki, R., Meyer, M., & Schoen, H. (2014). The impact of speeding on data quality in nonprobability and freshly recruited probability-based online panels. In M. Callegaro, R. Baker, J. Bethlehem, A. S. Göritz, J. A. Krosnick, & P. J. Lavrakas (Eds.), Online panel research (pp. 238–262). John Wiley & Sons, Ltd. https://doi.org/10.1002/9781118763520.ch11
- Gurtman, M. B. (1992). Trust, distrust, and interpersonal problems: A circumplex analysis. Journal of Personality and Social Psychology, 62(6), 989–1002. https://doi.org/10.1037/0022-3514.62.6.989
- Hammer, J. H. (2016, October). Percent of Uncontaminated Correlations (PUC) Calculator: A Microsoft Excel-based tool to calculate the PUC statistic. http://DrJosephHammer.com/.
- Hilbig, B. E., Thielmann, I., & Böhm, R. (2022). Bending our ethics code: Avoidable deception and its justification in psychological research. European Psychologist, 27(1), 62–70. https://doi.org/10.1027/1016-9040/a000431
- Hinkin, T. R. (1998). A brief tutorial on the development of measures for use in survey questionnaires. Organizational Research Methods, 1(1), 104–121. https://doi.org/10.1177/109442819800100106
- Hoff, K. A., & Bashir, M. (2015). Trust in automation: Integrating empirical evidence on factors that influence trust. Human Factors, 57(3), 407–434. https://doi.org/10.1177/0018720814547570
- Hu, L., & Bentler, P. M. (1999). Cutoff criteria for fit indexes in covariance structure analysis: Conventional criteria versus new alternatives. Structural Equation Modeling: A Multidisciplinary Journal, 6(1), 1–55. https://doi.org/10.1080/10705519909540118
- Jian, J. Y., Bisantz, A. M., & Drury, C. G. (2000). Foundations for an empirically determined scale of trust in automated systems. International Journal of Cognitive Ergonomics, 4(1), 53–71. https://doi.org/10.1207/S15327566IJCE0401_04
- Jessup, S. A., Schneider, T. R., Alarcon, G. M., Ryan, T. J., & Capiola, A. (2019). The measurement of the propensity to trust automation. In Virtual, augmented and mixed reality. Applications and case studies: 11th International Conference, VAMR 2019, held as part of the 21st HCI International Conference, HCII 2019, Orlando, FL, USA, July 26–31, 2019, Proceedings, Part II 21 (pp. 476–489). Springer International Publishing.
- Johnson, N. D., & Mislin, A. A. (2011). Trust games: A meta-analysis. Journal of Economic Psychology, 32(5), 865–889. https://doi.org/10.1016/j.joep.2011.05.007
- Jones, S. L., & Shah, P. P. (2016). Diagnosing the locus of trust: A temporal perspective for trustor, trustee, and dyadic influences on perceived trustworthiness. The Journal of Applied Psychology, 101(3), 392–414. https://doi.org/10.1037/apl0000041
- Kaplan, A. D., Kessler, T. T., Brill, J. C., & Hancock, P. A. (2021). Trust in artificial intelligence: Meta-analytic findings. Human Factors, 65(2), 337–359. https://doi.org/10.1177/00187208211013988
- Karimov, F. P., Berngman, M., & Van Hove, L. (2011). The effect of website design dimensions on initial trust: A synthesis of the empirical literature. Journal of Electronic Commerce Research, 12(4), 272–301. http://www.jecr.org/sites/default/files/12_4_p04.pdf
- Karrer, K., Glaser, C., Clemens, C., & Bruder, C. (2009). Technikaffinität erfassen – der Fragebogen TA-EG. TU-Berlin. http://www.tu-berlin.de/fileadmin/f25/dokumente/8bwmms/13.3-karrer.pdf
- Kazi, T. A., Stanton, N. A., Walker, G. H., & Young, M. S. (2007). Designer driving: Drivers’ conceptual models and level of trust in adaptive cruise control. International Journal of Vehicle Design, 45(3), 339–360. https://doi.org/10.1504/IJVD.2007.014909
- Kraus, J. M. (2020). Psychological processes in the formation and calibration of trust in automation. Ulm University. https://doi.org/10.18725/OPARU-32583
- Kraus, J., Scholz, D., & Baumann, M. (2021). What’s driving me? Exploration and validation of a hierarchical personality model for trust in automated driving. Human Factors, 63(6), 1076–1105. https://doi.org/10.1177/0018720820922653
- Kraus, J., Scholz, D., Messner, E. M., Messner, M., & Baumann, M. (2019). Scared to trust?–Predicting trust in highly automated driving by depressiveness, negative self-evaluations and state anxiety. Frontiers in Psychology, 10, 2917. https://doi.org/10.3389/fpsyg.2019.02917
- Kraus, J. M., Scholz, D., Stiegemeier, D., & Baumann, M. (2020). The more you know: Trust dynamics and calibration in highly automated driving and the effects of take-overs, system malfunction, and system transparency. Human Factors, 62(5), 718–736. https://doi.org/10.1177/0018720819853686
- Kuha, J. (2004). AIC and BIC: Comparisons of assumptions and performance. Sociological Methods & Research, 33(2), 188–229. https://doi.org/10.1177/0049124103262065
- Langer, A., Feingold-Polak, R., Mueller, O., Kellmeyer, P., & Levy-Tzedek, S. (2019). Trust in socially assistive robots: Considerations for use in rehabilitation. Neuroscience and Biobehavioral Reviews, 104, 231–239. https://doi.org/10.1016/j.neubiorev.2019.07.014
- Lankton, N., McKnight, D. H., & Tripp, J. (2015). Technology, humanness, and trust: Rethinking trust in technology. Journal of the Association for Information Systems, 16(10), 880–918. https://doi.org/10.17705/1jais.00411
- Lee, K., Ashton, M. C. (2009). The HEXACO Personality Inventory – Revised. https://hexaco.org/scaledescriptions
- Lee, J. D., & Moray, N. (1992). Trust, control strategies and allocation of function in human-machine systems. Ergonomics, 35(10), 1243–1270. https://doi.org/10.1080/00140139208967392
- Lee, J. D., & Moray, N. (1994). Trust, self-confidence, and operators’ adaptation to automation. International Journal of Human-Computer Studies, 40(1), 153–184. https://doi.org/10.1006/ijhc.1994.1007
- Lee, J. D., & See, K. A. (2004). Trust in automation: Designing for appropriate reliance. Human Factors, 46(1), 50–80. https://doi.org/10.1518/hfes.46.1.50_30392
- Lee, W. H., Lin, C. W., & Shih, K. H. (2018). A technology acceptance model for the perception of restaurant service robots for trust, interactivity, and output quality. International Journal of Mobile Communications, 16(4), 361–376. https://doi.org/10.1504/IJMC.2018.092666
- Legler, F., Langer, D., Dittrich, F., & Bullinger, A. C. (2020). Vertrauen bei der Kollaboration mit Schwerlastrobotik-Realstudie zum Einfluss von Geschwindigkeit und Systemfehler. In G. f. A. Dortmund (Ed.), Digitaler Wandel, digitale Arbeit, digitaler Mensch? https://gfa2020.gesellschaft-fuer-arbeitswissenschaft.de/inhalt/b.12.5.pdf
- Leiner, D. J. (2019). Too Fast, too straight, too weird: Non-reactive indicators for meaningless data in internet surveys. Survey Research Methods, 13(3), 229–248. https://doi.org/10.18148/srm/2019.v13i3.7403
- Lewandowsky, S., Mundy, M., & Tan, G. P. A. (2000). The dynamics of trust: Comparing humans to automation. Journal of Experimental Psychology. Applied, 6(2), 104–123. https://doi.org/10.1037/1076-898x.6.2.104
- Lewicki, R. J., McAllister, D. J., & Bies, R. J. (1998). Trust and distrust: New relationships and realities. Academy of Management Review, 23(3), 438–458. https://doi.org/10.5465/amr.1998.926620
- Lissitz, R. W., & Green, S. B. (1975). Effect of the number of scale points on reliability: A Monte Carlo approach. Journal of Applied Psychology, 60(1), 10–13. https://doi.org/10.1037/h0076268
- Madhavan, P., & Wiegmann, D. A. (2007). Similarities and differences between human–human and human–automation trust: An integrative review. Theoretical Issues in Ergonomics Science, 8(4), 277–301. https://doi.org/10.1080/14639220500337708
- Malle, B. F., & Ullman, D. (2021). A multidimensional conception and measure of human-robot trust. In C. S. Nam and J. B. Lyons (Eds.), Trust in human-robot interaction (pp. 3–25). Academic Press.
- Maner, J. K., & Gerend, M. A. (2007). Motivationally selective risk judgments: Do fear and curiosity boost the boons or the banes? Organizational Behavior and Human Decision Processes, 103(2), 256–267. https://doi.org/10.1016/j.obhdp.2006.08.002
- Marsh, H. W., Hau, K. T., & Wen, Z. (2004). In search of golden rules: Comment on hypothesis-testing approaches to setting cutoff values for fit indexes and dangers in overgeneralizing Hu and Bentler’s (1999) findings. Structural Equation Modeling: A Multidisciplinary Journal, 11(3), 320–341. https://doi.org/10.1207/s15328007sem1103_2
- Marsh, S., & Dibben, M. R. (2003). The role of trust in information science and technology. Annual Review of Information Science and Technology, 37(1), 465–498. https://www.learntechlib.org/p/96318/ https://doi.org/10.1002/aris.1440370111
- Mayer, R. C., Davis, J. H., & Schoorman, F. D. (1995). An integrative model of organizational trust. The Academy of Management Review, 20(3), 709–734. https://doi.org/10.5465/amr.1995.9508080335
- McCarter, M. W., Rockmann, K. W., & Northcraft, G. B. (2010). Is it even worth it? The effect of loss prospects in the outcome distribution of a public goods dilemma. Organizational Behavior and Human Decision Processes, 111(1), 1–12. https://doi.org/10.1016/j.obhdp.2009.06.003
- McDonald, R. P. (1999). Test theory: A unified approach. Erlbaum.
- McKnight, D. H., Carter, M., Thatcher, J. B., & Clay, P. F. (2011). Trust in a specific technology. ACM Transactions on Management Information Systems, 2(2), 1–25. https://doi.org/10.1145/1985347.1985353
- McKnight, D. H., & Chervany, N. L. (2001). Trust and distrust definitions: One bite at a time. In Trust in cyber-societies (pp. 27–54). Springer. https://doi.org/10.1007/3-540-45547-7_3
- McKnight, D. H., Choudhury, V., & Kacmar, C. (2002). The impact of initial consumer trust on intentions to transact with a web site: A trust building model. The Journal of Strategic Information Systems, 11(3–4), 297–323. https://doi.org/10.1016/S0963-8687(02)00020-3
- McKnight, D. H., Cummings, L. L., & Chervany, N. L. (1998). Initial trust formation in new organizational relationships. Academy of Management Review, 23(3), 473–490. https://doi.org/10.5465/amr.1998.926622
- Merritt, S. M., Ako-Brew, A., Bryant, W. J., Staley, A., McKenna, M., Leone, A., & Shirase, L. (2019). Automation-induced complacency potential: Development and validation of a new scale. Frontiers in Psychology, 10, 225. https://doi.org/10.3389/fpsyg.2019.00225
- Merritt, S. M., Heimbaugh, H., LaChapell, J., & Lee, D. (2013). I trust it, but I don’t know why: Effects of implicit attitudes toward automation on trust in an automated system. Human Factors, 55(3), 520–534. https://doi.org/10.1177/0018720812465081
- Merritt, S. M., & Ilgen, D. R. (2008). Not all trust is created equal: Dispositional and history-based trust in human-automation interactions. Human Factors, 50(2), 194–210. https://doi.org/10.1518/001872008X288574
- Miller, L., Kraus, J. M., Babel, F., & Baumann, M. (2021). More than a feeling-interrelation of trust layers in human-robot interaction and the role of user dispositions and state anxiety. Frontiers in Psychology, 12, 592711. https://doi.org/10.3389/fpsyg.2021.592711
- Moshagen, M. (2012). The model size effect in SEM: Inflated goodness-of-fit statistics are due to the size of the covariance matrix. Structural Equation Modeling: A Multidisciplinary Journal, 19(1), 86–98. https://doi.org/10.1080/10705511.2012.634724
- Moshagen, M., & Auerswald, M. (2018). On congruence and incongruence of measures of fit in structural equation modeling. Psychological Methods, 23(2), 318–336. https://doi.org/10.1037/met0000122
- Moshagen, M., Hilbig, B. E., & Zettler, I. (2018). The dark core of personality. Psychological Review, 125(5), 656–688. https://doi.org/10.1037/rev0000111
- Moshagen, M., Zettler, I. & Hilbig, B. E. (2020). Measuring the Dark Core of Personality. Psychological Assessment, 32(2), 182–196. https://doi.org/10.1037/pas0000778
- Mowen, J. C. (2000). The 3M model of motivation and personality: Theory and empirical applications to consumer behavior. Kluwer Academic Publishers.
- Muir, B. M. (1987). Trust between humans and machines, and the design of decision aids. International Journal of Man-Machine Studies, 27(5-6), 527–539. https://doi.org/10.1016/s0020-7373(87)80013-5
- Muir, B. M. (1994). Trust in automation: Part I. Theoretical issues in the study of trust and human intervention in automated systems. Ergonomics, 37(11), 1905–1922. https://doi.org/10.1080/00140139408964957
- Muir, B. M., & Moray, N. (1996). Trust in automation. Part II. Experimental studies of trust and human intervention in a process control simulation. Ergonomics, 39(3), 429–460. https://doi.org/10.1080/00140139608964474
- Nass, C., & Moon, Y. (2000). Machines and mindlessness: Social responses to computers. Journal of Social Issues, 56(1), 81–103. https://doi.org/10.1111/0022-4537.00153
- Nass, C., Steuer, J., & Tauber, E. R. (1994). Computers are social actors [Paper presentation]. Proceedings of the SIGCHI Conference on Human Factors in Computing Systems, April (pp. 72–78). https://doi.org/10.1145/191666.191703
- Nielsen, Y. A., Pfattheicher, S., & Keijsers, M. (2022). Prosocial behavior toward machines. Current Opinion in Psychology, 43, 260–265. https://doi.org/10.1016/j.copsyc.2021.08.004
- Nielsen, Y. A., Thielmann, I., Zettler, I., & Pfattheicher, S. (2022). Sharing money with humans versus computers: On the role of honesty-humility and (non-)social preferences. Social Psychological and Personality Science, 13(6), 1058–1068. https://doi.org/10.1177/19485506211055622
- Ou, C. X., & Sia, C. L. (2010). Consumer trust and distrust: An issue of website design. International Journal of Human-Computer Studies, 68(12), 913–934. https://doi.org/10.1016/j.ijhcs.2010.08.003
- Parasuraman, R., de Visser, E., Wiese, E., & Madhavan, P. (2014). Human trust in other humans, automation, robots, and cognitive agents. Proceedings of the Human Factors and Ergonomics Society Annual Meeting, 58(1), 340–344. https://doi.org/10.1177/1541931214581070
- Parasuraman, R., Molloy, R., & Singh, I. L. (1993). Performance consequences of automation-induced ‘complacency’. The International Journal of Aviation Psychology, 3(1), 1–23. https://doi.org/10.1207/s15327108ijap0301_1
- Podsakoff, P. M., MacKenzie, S. B., Lee, J. ‑Y., & Podsakoff, N. P. (2003). Common method biases in behavioral research: A critical review of the literature and recommended remedies. The Journal of Applied Psychology, 88(5), 879–903. https://doi.org/10.1037/0021-9010.88.5.879
- Preckel, F., & Brunner, M. (2017). Nomological nets. In V. Zeigler-Hill & T. K., Shackelford (Eds.), Encyclopedia of personality and individual differences (pp. 1–4). Springer International Publishing. https://doi.org/10.1007/978-3-319-28099-8_1334-1
- R Core Team. (2022). R: A language and environment for statistical computing. R Foundation for Statistical Computing. https://www.r-project.org/. https://cran.microsoft.com/snapshot/2014-09-08/web/packages/dplr/vignettes/xdate-dplr.pdf
- Rahman, S. M. M., & Wang, Y. (2018). Mutual trust-based subtask allocation for human–robot collaboration in flexible lightweight assembly in manufacturing. Mechatronics, 54, 94–109. https://doi.org/10.1016/j.mechatronics.2018.07.007
- Reeves, B., & Nass, C. (1996). The media equation: How people treat computers, television, and new media like real people. Cambridge.
- Reise, S. P., Scheines, R., Widaman, K. F., & Haviland, M. G. (2013). Multidimensionality and structural coefficient bias in structural equation modeling: A bifactor perspective. Educational and Psychological Measurement, 73(1), 5–26. https://doi.org/10.1177/0013164412449831
- Rodriguez, A., Reise, S. P., & Haviland, M. G. (2016a). Applying bifactor statistical indices in the evaluation of psychological measures. Journal of Personality Assessment, 98(3), 223–237. https://doi.org/10.1080/00223891.2015.1089249
- Rodriguez, A., Reise, S. P., & Haviland, M. G. (2016b). Evaluating bifactor models: Calculating and interpreting statistical indices. Psychological Methods, 21(2), 137–150. https://doi.org/10.1037/met0000045
- Rosseel, Y., Jorgensen, T. D., Oberski, D., Byrnes, J., Vanbrabant, L., Savalei, V., Merkle, E., Hallquist, M., Rhemtulla, M., Katsikatsou, M., Barendse, M., Scharf, F., Du, H. (2021). Package ‘lavaan’ [Computer software]. https://cran.r-project.org/web/packages/lavaan/lavaan.pdf
- Rotter, J. B. (1967). A new scale for the measurement of interpersonal trust. Journal of Personality, 35(4), 651–665. https://doi.org/10.1111/j.1467-6494.1967.tb01454.x
- Rotter, J. B. (1971). Generalized expectancies for interpersonal trust. American Psychologist, 26(5), 443–452. https://doi.org/10.1037/h0031464
- Rotter, J. B. (1980). Interpersonal trust, trustworthiness, and gullibility. American Psychologist, 35(1), 1–7. https://doi.org/10.1037/0003-066X.35.1.1
- Rudin-Brown, C. M., & Parker, H. A. (2004). Behavioural adaptation to adaptive cruise control (ACC): Implications for preventive strategies. Transportation Research Part F: Traffic Psychology and Behaviour, 7(2), 59–76. https://doi.org/10.1016/j.trf.2004.02.001
- Satorra, A., & Bentler, P. M. (1994). Corrections to test statistics and standard errors in covariance structure analysis. In A. von Eye & C. C. Clogg (Eds.), Latent variables analysis: Applications for developmental research (pp. 399–419). Sage Publications, Inc.
- Scholz, D. D., Hilbig, B. E., Thielmann, I., Moshagen, M., & Zettler, I. (2022). Beyond (low) agreeableness: Toward a more comprehensive understanding of antagonistic psychopathology. Journal of Personality, 90(6), 956–970. https://doi.org/10.1111/jopy.12708
- Schoorman, F. D., Mayer, R. C., & Davis, J. H. (2007). An integrative model of organizational trust: Past, present, and future. Academy of Management Review, 32(2), 344–354. https://doi.org/10.5465/amr.2007.24348410
- Sellbom, M., & Tellegen, A. (2019). Factor analysis in psychological assessment research: Common pitfalls and recommendations. Psychological Assessment, 31(12), 1428–1441. https://doi.org/10.1037/pas0000623
- Thielmann, I., Heck, D. W., & Hilbig, B. E. (2016). Anonymity and incentives: An investigation of techniques to reduce socially desirable responding in the Trust Game. Judgment and Decision Making, 11(5), 527–536. https://doi.org/10.1017/S1930297500004605
- Thielmann, I., & Hilbig, B. E. (2015). Trust: An integrative review from a person–situation perspective. Review of General Psychology, 19(3), 249–277. https://doi.org/10.1037/gpr0000046
- Thielmann, I., & Hilbig, B. E. (2014). Trust in me, trust in you: A social projection account of the link between personality, cooperativeness, and trustworthiness expectations. Journal of Research in Personality, 50, 61–65. https://doi.org/10.1016/j.jrp.2014.03.006
- Thielmann, I., Hilbig, B. E., & Zettler, I. (2020). Seeing me, seeing you: Testing competing accounts of assumed similarity in personality judgments. Journal of Personality and Social Psychology, 118(1), 172–198. https://doi.org/10.1037/pspp0000222
- Thielmann, I., Moshagen, M., Hilbig, B. E., & Zettler, I. (2021). On the comparability of basic personality models: Meta-analytic correspondence, scope, and orthogonality of the big five and HEXACO dimensions. European Journal of Personality, 36(6), 870–900. https://doi.org/10.1177/08902070211026793
- Thielmann, I., Spadaro, G., & Balliet, D. (2020). Personality and prosocial behavior: A theoretical framework and meta-analysis. Psychological Bulletin, 146(1), 30–90. https://doi.org/10.1037/bul0000217
- Tussyadiah, I. P., Zach, F. J., & Wang, J. (2020). Do travelers trust intelligent service robots? Annals of Tourism Research, 81, 102886. https://doi.org/10.1016/j.annals.2020.102886
- Van de Walle, S., & Six, F. (2014). Trust and distrust as distinct concepts: Why studying distrust in institutions is important. Journal of Comparative Policy Analysis: Research and Practice, 16(2), 158–174. https://doi.org/10.1080/13876988.2013.785146
- Van Laar, S., & Braeken, J. (2022). Caught off base: A note on the interpretation of incremental fit indices. Structural Equation Modeling: A Multidisciplinary Journal, 29(6), 935–943. https://doi.org/10.1080/10705511.2022.2050730
- Venkatesh, V., & Davis, F. D. (1996). A model of the antecedents of perceived ease of use: Development and test. Decision Sciences, 27(3), 451–481. https://doi.org/10.1111/j.1540-5915.1996.tb00860.x
- Wagenmakers, E.-J., & Farrell, S. (2004). AIC model selection using Akaike weights. Psychonomic Bulletin & Review, 11(1), 192–196. https://doi.org/10.3758/BF03206482
- Wetzel, E., Lüdtke, O., Zettler, I., & Böhnke, J. R. (2016). The stability of extreme response style and acquiescence over 8 years. Assessment, 23(3), 279–291. https://doi.org/10.1177/1073191115583714
- Yamagishi, T., Akutsu, S., Cho, K., Inoue, Y., Li, Y., & Matsumoto, Y. (2015). Two-Component Model of General Trust: Predicting Behavioral Trust from Attitudinal Trust. Social Cognition, 33(5), 436–458. https://doi.org/10.1521/soco.2015.33.5.436
- Zhang, Z., & Wang, K. (2013). A trust model for multimedia social networks. Social Network Analysis and Mining, 3(4), 969–979. https://doi.org/10.1007/s13278-012-0078-4
- Zou, G. Y. (2007). Toward using confidence intervals to compare correlations. Psychological Methods, 12(4), 399–413. https://doi.org/10.1037/1082-989X.12.4.399