
Abstract
Ophthalmoscopy is a required clinical skill which is difficult to learn. This paper describes the development of a VR ophthalmoscopy app to support learning of this skill. It was developed using the Unity game engine, Google CardboardTM and smart phone. Forty-eight clinicians agreed to evaluate it for system usability (SUS), technology acceptance and knowledge acquisition (pre and post quizzes). Twenty-seven volunteers undertook the quiz. Mean scores improved by all (6.3 ± 1.5 to 8.4 ± 0.8 p < 0.001); medical students (6.2 ± 1.5 to 8.5 ± 0.9 p < 0.001 n:20); doctors (6.4 ± 1.5 to 8.3 ± 0.8 p < 0.05 n:7). Overall, SUS was 74 ± 11 (n:33), medical students rating 72 ± 12 (n:20) and doctors 77 ± 9 (n:13). Forty-eight volunteers provided feedback on technology acceptance. All highly rated its ease of use and how it improved their confidence in being able to perform this diagnostic procedure. Regression analyses emphasized the importance of usability, ability to perform the task and ease of use as predictors of success. Ninety percent of users felt that this type of technology would benefit their clinical training but should not replace other forms of teaching. Owing to the lack of technical-focused development frameworks this study also defines an appropriate framework that ensures clinicians are central to the process.
1. Introduction
Medical education requires constant innovation to keep pace with the demands of clinical practice. This has seen a move away from traditional rote classroom teaching to newer forms of learning that are more reflective of the experience trainees will encounter in clinical practice. Simulations are a key component of this and form one of The General Medical Council three levels of competencies for newly qualified doctors (General Medical Council, Citation2019). If they are well designed, they are ideal for providing real time feedback on the users’ performance, an approach that is beneficial to the knowledge, skills, and behaviour of medical students (Cook et al., Citation2011). Simulations can take various forms including interaction with physical manikins, patient actors or be computer-based.
Virtual reality naturally lends itself to a range of clinical skills whereby the users interact with realistic scenarios in computer generated worlds. By digitally recreating patient interactions both financial cost and physical space requirements can be lowered as there is no need for large high-cost training centres with specialised medical equipment, actors to portray patients, teaching staff, and physical space (Pottle, Citation2019; Zendejas et al., Citation2013). They also offer the advantages that they are easily and consistently repeatable, meaning that students can learn from their mistakes and apply new knowledge to the same situation (Pottle, Citation2019).
There are many important clinical skills required by the GMC (Citation2019) that can benefit from computer-based simulation. One important example is how to perform examinations of the back of the eye (ophthalmology). Direct ophthalmoscopy is the only tool available to non-ophthalmologic physicians to do this as a way of providing essential information for guiding clinical decision-making and subsequently has an impact on patient outcomes (MacKay et al., Citation2015). The GMC (Citation2019) requires that all medical students can perform this skill and identify common abnormalities. However, ophthalmology is difficult to master and requires significant practice to reach the level of competence required. In the UK, ophthalmology is normally taught during a clinical placement where students learn by lectures and shadow experienced ophthalmologists. Unfortunately, this approach does not give students much opportunity to learn by working with actual patients as the clinics and senior staff are often very busy. These limitations were exemplified in a UK national survey of junior doctors who were working in emergency departments. It found that only 6% of them had confidence in dealing with ophthalmic cases (Sim et al., Citation2020). Developing measures to tackle this issue presents a significant modern clinical challenge (Biousse et al., Citation2018; MacKay et al., Citation2015).
Apart from the need for high quality clinically accurate computer-based simulations a framework for their systematic development and evaluation is required too. The NHS has specific guidelines for commissioning technology enhanced learning that requires all technologies to be patient-centred and service driven. They need to be educationally coherent, innovative and evidence based, deliver high quality educational outcomes (impact) and value for money whilst ensuring equity of access and quality of provision (Department of Health, Citation2011; Health Education England, Citation2016).
The limited information on development and evaluation processes for computer-based clinical simulation is highlighted in a review by Olszewski and Wolbrink (Citation2017). They identified that studies often only explained clinical or educational frameworks rather than the technical aspects of the development. In other words, current software development frameworks for clinical computer-based simulations are not service-driven. As a result, these authors propose a three-phase iterative framework which comprises a preparation and design stage, a development phase and formative evaluations. This framework addresses the lack of technical focus in current software development frameworks for clinical computer-based simulations. The latter relying on evaluation using ‘Think Aloud Protocol’ and the System Usability Scale (SUS) (Brooke, Citation1996). This framework provides a basis for the development of clinical computer-based simulations but there is still a need for a more comprehensive approach that covers definition of requirements, implementation, and more formal evaluation methods. These evaluations should measure improvements in the understanding of the clinical skill, the ability to repeatedly perform it correctly as well as assess the users’ self-belief in their ability to perform the task on patients in future.
In medicine the randomised controlled trial is the gold standard evaluation method for clinical treatments. These can be time consuming to organise and conduct. By the time they have been conducted the technology used may well be dated. Therefore, there is a need for evaluations which are acceptable and credible but quick to perform in clinical settings, where time to conduct evaluations is limited. The SUS (Brooke, Citation1996) provides a quick method for assessing usability, whereas the Technology Acceptance Model (Davis, Citation1989) assesses perceived ease of use, usefulness, and behavioural intent. The latter focuses on system development so its statements are not necessarily relevant to virtual reality educational tools. Pre-post tests are a standard way of evaluating knowledge acquisition. A combination of all three offers a quick but comprehensive insight into the effectiveness of a computer-based clinical simulation.
This paper is structured around three main themes i) description of the development of the ophthalmology training simulation ii) its evaluation and the investigation of common human factors which may affect its acceptance and adoption iii) description of the development process used to make the simulation.
2. Methods
2.1. Requirements gathering and specifications
Requirements for the app were gathered from the clinical teaching teams at Sandwell and West Birmingham NHS Trust (UK). The outcome was that it must:
Be an intermediary teaching tool bridging a gap between the theory behind performing this diagnostic skill and using the actual ophthalmoscope with people.
Teach the correct systematic processes needed for examining the back of the eye.
Users must be able to distinguish between normal eyes and those with pathologies.
Be inexpensive.
2.2. Ethics
Ethics approval was reviewed by Birmingham City University (UK) for permission to work with its staff during the evaluation process. The type of survey used to evaluate the ophthalmology app is standard practice at Sandwell and West Birmingham NHS Trust (UK), when gathering views on novel approaches to learning and teaching. It would not be expected to be placed before the NHS Trust’s ethics committee, but the medical school knew of the project.
2.3. Design
During discussions with the clinical teams the ophthalmology app was designed to have a series of levels which progressively introduce the user to the key elements of ophthalmology. These include a tutorial level which teaches how to use the app, one to teach how to correctly locate the red reflex, and levels that teach retinal navigation and pathologies as well as a final quiz to test the users’ diagnostic skills (). Gamification (Deterding et al., Citation2011) was incorporated to give the user feedback reinforcing to them that they are correctly performing the task. Examples include when the user correctly locates the the red reflex or they successfully navigate each of the four quadrants of the retina and correctly identify the optic disc. These are all rewarded with a score. Successfully completing all activities within each level results in a virtual badge as does successfully completing all levels. In the quiz section the user must correctly answer eight questions, which are then scored relative to the time taken to answer them. Based upon this score the user is awarded a virtual badge of achievement in the form of either a bronze, silver or gold virtual ophthalmoscope. The process is not linear as once a level has been completed the user can retake it to consolidate their learning. More detail on the app, its levels and use of gamification has been previously discussed (Wilson et al., Citation2017a, Citation2017b).
Figure 1. Examples of the VR app and educational scenes [A] app, phone and Google CardboardTM, [B] red reflex, [C] haemorrhage and [D] quiz.
![Figure 1. Examples of the VR app and educational scenes [A] app, phone and Google CardboardTM, [B] red reflex, [C] haemorrhage and [D] quiz.](/cms/asset/651ba756-4e81-4bbc-9271-1e147eb5a25f/hihc_a_2318535_f0001_c.jpg)
2.3.1. Development and testing
2.3.2. Proof of concept
Using rapid application development (RAD) (Martin, Citation1991) a proof of concept/minimal viable product (MVP) was created to help focus discussions on the app’s functionality. As the app was to be inexpensive it was developed using the Unity Game Engine (2019.4.2f1), Google CardboardTM (v1) and a smartphone (Samsung Galaxy S6). To ensure its clinical accuracy images of the retina and the written narratives that explained the eye were supplied by clinical experts from the NHS Trust. A custom-built text-to-speech conversion program (Visual Studio 2015 and C#) was used to create the audio narration from these written narratives. Once the MVP was created formative feedback on its design, usability issues and adjustments to its clinical accuracy were given by the clinical teams.
2.3.3. Internal functional testing and user experience
An iterative development process was then used to systematically refine any issues associated with usability, user experience and functionality. Eight members of staff in the Faculty of Computing, Engineering and the Built Environment (Birmingham City University, UK) who had no previous experience of using VR and did not have a medical background were asked to provide formative feedback on it. Items where feedback was requested included its ease of use, determining whether the tutorial was explanatory to them, the quality of feedback given in the app, and how long it took them to complete the program. They were also asked to identify any problems with the app’s functionality. Of these eight users who evaluated the app, seven of them felt that it was easy to use giving it an average rating of 4.4/5. All felt the tutorial level was clear; it helped them understand how to use it, as well as showing them how to undertake the simulated diagnostic procedure. All testers successfully worked through all the levels with a mean time to completion of 7.4 ± 3.1 minutes.
2.3.4. Evaluation
The evaluation was conducted on two separate occasions at City Hospital, Sandwell and West Birmingham NHS Trust (UK). A convenience sample totalling 48 clinical volunteers agreed to participate in the studies. The initial cohort comprising 15 medical students were asked to answer statements based upon an adapted version of Technology Acceptance Model (TAM)(Davis, Citation1989). Based upon the observations and feedback from that group the second cohort comprising both doctors and medical students (n = 33) were asked to additionally complete the System Usability Scale (SUS) (Brooke, Citation1996) and undertake a knowledge quiz. Factors that may influence their engagement with the app were also collected. This included self-reported views on their digital literacy, video gaming habits, prior experience of using VR educational apps and enthusiasm for using technology in their medical education. Informal focus groups were conducted to gain the participants responses on what they liked and disliked about the app; how the app compared as a learning tool to the EYE Exam Simulator and areas where they felt VR would have positive application to their education.
All the medical students had previous ophthalmoscopy teaching in the form of a practical consultant-led session earlier in the academic term (in the previous year for 4th year). During the clinical skills sessions, students used the app and also had access to the EYE Exam Simulator (Kyoto Kagaku Co. Ltd., Kyoto, Japan). This is a model of a head where slides with different pathologies of the eye can be inserted, and students then use a direct ophthalmoscope to practice looking into the eye as they would a real patient. Prior to using the app the medical students completed a 10-point quiz to assess their prior knowledge of eye related anatomy and pathology. They repeated the quiz again after using the app. All questions were based on topics covered within the app and assessed students on their basic anatomy, recognition of pathologies and the clinical relevance of these findings. The questions were organised as follows:
Medical students were shown an image of a normal retina and asked to identify the macula and the optic disc. A point was awarded for correctly identifying each of them.
The second question showed three different pathologies and required their correct identification.
a. Papilloedema
b. Blot haemorrhages
c. Cotton wool spots
Students were requested to establish the diagnosis with a point for each correct answer as follows:
Identify features associated with hypertensive retinopathy. They were given ten pathology descriptors and were asked to choose the correct three. A point awarded for each correct answer.
State the clinical relevance of papilloedema with a point awarded for correctly identifying that it was a sign of raised intra-cranial pressure.
Identify the clinical significance of an absent red reflex and a point would be awarded for answering with cataracts.
3. Data analyses
The following analyses were conducted:
A description of the profile of the participants.
Analysis of responses to the SUS. Data are combined into agree/strongly agree with the positive SUS statements and disagree/strongly disagree with negative SUS statements (). Mean ± SD are presented.
Analysis of responses to questions based upon those used in the TAM (TA) (). Data are combined into agree/strongly agree with the statements. Mean ± SD are presented.
Both responses to individual SUS and technology acceptance statements were compared to the volunteers self-reported ratings for their digital literacy, video gaming habits, prior experience of using a virtual education app, enthusiasm for learning new technology in clinical skills training, age and gender. Data are presented as mean ± SD of responses on 5-point Likert scale (5- strongly agree, 4- agree, 3- neutral, 2-disagree and 1- strongly disagree). Normality of the data was assessed using the Anderson-Darling test. Between group comparison of responses to individual SUS and TA statements were conducted using unpaired T-Test for two groups or one-way Anova for multiple groups. Intra-group comparisons of the individual SUS and TA statements were conducted using one-way ANOVA with Tukey post comparison. Given the small number of individuals in particular subgroups only main effects could be analysed.
Analyses of results from the pre - post test knowledge quiz were conducted using a paired Student T-Test.
In order to measure the components that influence the acceptance of use of VR in medical education, linear regression analysis was used.
Table 1. SUS statements.
Table 2. TA statements.
4. Results
4.1. Participant profiles
Of the forty-eight volunteers who agreed to participate thirty-five were medicals students and thirteen were qualified doctors. Of those that agreed to supply the information twenty medical students (8 male and 12 female) and thirteen qualified doctors (5 male and 8 female) were in the age range 18-27 years with four over the age of 27.
When asked to rate their digital literacy, video game playing habits, prior experience of using VR education apps and enthusiasm for learning new technology in clinical skills training, thirty-three participants responded to the questions as follows:
Twenty-three (12 medical students and 11 doctors) considered their digital literacy skills to be strong or very strong, seven (5 medical students and 2 doctors) were neutral and three medical students considered themselves to be weak. In terms of their video game playing habits, eighteen (14 medical students and 4 doctors) had never played them, eight (4 medical students and 4 doctors) played less than monthly and seven (3 medical students and 4 doctors) played more than monthly. When asked about their previous experience of using a VR education app four (3 medical students and one doctor) said they had. Twenty-nine had no prior experience. Three (medical students) were neutral on their enthusiasm for learning new technology in clinical skills training and thirty agreed/strongly agreed with the statement (17 medical students 13 doctors).
4.2. System Usability and technology acceptance
4.2.1. Overall cohort responses
Thirty-three people (20 medical students and 13 doctors) provided feedback on the system’s usability using SUS. The overall SUS value of this cohort was 74 ± 11 (good) with medical students rating it as 72 ± 12 (good) and the doctors as 77 ± 9 (good). There was no significant difference between the two groups.
SUS was also broken down into positive and negative statements. The order of agreement with the positive SUS statements for all respondents (n:33) was as follows: S7. ‘I would imagine that most people would learn to use this technology very quickly’ (n:33 100%), S5. ‘I found the various functions in this technology were well integrated’ (n:29 88%), S3. ‘I thought this technology was easy to use’ (n:28 85%), S9. ‘I felt very confident using this technology’ (n:25 76%). The lowest ranked statement was S1. ‘I think I would like to use this technology frequently’ (n:22 67%).
Respondents (n:33) were statistically more likely to agree with the positive statements: S7. ‘I would imagine most people would learn to use this technology very quickly’ (4.3 ± 0.8) compared to S1. ‘I think I would like to use this technology frequently’ (3.8 ± 0.6: p < 0.01) and S9. ’I felt very confident using the technology’ (3.6 ± 0.8: p < 0.001). They were also statistically (p < 0.05) more likely to agree with the statement S3. ‘I thought that the technology was easy to use’ (4.1 ± 0.8: p < 0.05) compared to S9.’I felt very confident using the technology’ (3.6 ± 0.8).
When doctors’ responses to medical students were compared there were no statistically significant differences between the responses given to the positive statements between either group. Within group comparisons showed that medical students were statistically (p < 0.05) more likely to agree with the positive statements S7.’ I would imagine most people would learn to use this technology very quickly’ (4.4 ± 0.5) than either S1. ’I think I would like to use this technology frequently’ (3.7 ± 0.5 n:20) and S9.’ I felt very confident using the technology’ (3.7 ± 0.8). There were no statistically significant differences between any of the individual positive statements from the doctors.
The order to which the respondents (n:33) disagreed with the negative SUS statements were: S10. ‘I needed to learn a lot of things before I could get going with this technology’ (n:30 91%), S6. ‘I thought there was too much inconsistency in this technology’ (n:29 88%), S2. ‘I found this technology unnecessarily complex’ (n:25 76%), S8. ‘I found this technology to be cumbersome/awkward to use’ (n:21 63%). The number of respondents were equally split on S4. ‘I think that I would need support of a technical person to use this technology’ (all n:17 51%).
Respondents (n:33) were statistically more likely to disagree with the following statements: S2. ‘I found the technology unnecessarily complex’ (1.9 ± 0.8: p < 0.05), S6. ‘I thought there was too much inconsistency in this technology’ (1.9 ± 0.7: p < 0.05) and S10. ‘I needed to learn a lot of things before I could get going with this technology’ (1.8 ± 0.6: p < 0.01) when compared to S4. ‘I think that I would need support of a technical person to use this technology’ (2.6 ± 1.2).
Doctors (n:13) and medical students (n:20) responses to the negative statements were compared. Within the doctors’ group there were no statistically significant differences in their responses to any of the positive or negative statements. Medical students were more likely to agree with the statement S7. ‘I would imagine most people would learn to use this technology very quickly’ than S1. ‘I think I would like to use this technology frequently’ (3.7 ± 0.5: p < 0.05) and S9. ‘I felt very confident using the technology’ (3.7 ± 0.8: p < 0.05). There were no statistically significant differences between any of the negative statements by the medical students.
When all respondents (n:48) were considered, those questions associated with technology acceptance including better ability to perform the tasks were ranked in the order: T3. ‘The app improves my ability to recognise abnormalities within the eye’ (n:46 96%), T2. ‘The app improves my ability to identify the main landmarks in the eye’ (n:45 94%), T1. ‘The app improves my understanding of the processes involved in ophthalmoscopy’ (n:43 90%), and T4. ‘The app will give me the confidence to perform this task on a person in future’ (n:38 79%).
When all respondents were considered, those questions associated with the ease of use of the app the statements were ranked in the order: T5. ‘Learning to use the app would be easy for me’ (n:44 92%), T7. ‘I would find it easy to understand how to use the app in future’ (n:44 92%), T6. ‘I would find it easy to control the app so it will do what I want it to’ (n:40 83%), and T8. ‘Overall I find it easy to use the app’ (n:40 75%).
There were no significant differences in responses to any of the statements associated with their ability to perform the task and ease of use between the doctors and medical students or within either group.
4.2.2. Breakdown by digital literacy
Responses to SUS were compared to digital literacy based upon an individual’s self-reported score of weak (n:3), neutral (n:7) and strong/very strong (n:23). The overall SUS ratings were (weak: 61 ± 6 acceptable, neutral: 65 ± 12 acceptable and strong/very strong: 78 ± 9 good). There was a significant difference between weak and strong (p < 0.05) and neutral and strong (p < 0.01) SUS scores.
Comparing agreement with positive statements: Those with strong/very strong skills were significantly (4.4 ± 0.7: p < 0.05) more likely to agree with the statement S3. ‘I thought this technology was easy to use’ compared to weak digital literacy skills (3.3 ± 0.6). Those with strong digital literacy skills were also significantly (4.1 ± 0.5: p < 0.001) more likely to agree with the statement S9. ‘I felt very confident using this technology’ than those who were neutral (3.0 ± 0.8).
There were no statistically significant differences between the responses to positive statements within either the strong or weak groups. There was a statistically significant difference (p < 0.05) between the responses to the positive statement in the neutral group S7. ‘I would imagine most people would learn to use this technology very quickly’ (4.3 ± 0.5) and S9. ‘I felt very confident using the technology’ (neutral 3.0 ± 0.8)
Comparing disagreement with negative statements: Those with both strong/very strong (1.7 ± 0.5: p < 0.001) and neutral skills (2.0 ± 0.8: p < 0.001) were significantly more likely to disagree with the statement S10. ‘I needed to learn a lot of things before I could get going with this technology’ compared to those with weak digital literacy skills. Those with strong digital literacy skills were significantly more likely (1.6 ± 0.7: p < 0.001) to disagree with the statement S2. ‘I found this technology unnecessarily complex’ compared to those with weak digital literacy skills (3.0 ± 0.0).
Within group comparisons showed that in the weak group there was a statistically significant (p < 0.05) difference between their responses to the statements S6. ‘I thought there was too much inconsistency in this technology’ (2.0 ± 0.0) and S10. ‘I needed to learn a lot of things before I could get going with this technology’ (4.3 ± 0.6) (p < 0.05). In the neural group there were statistically significant (p < 0.05) difference between the statements S10. ‘I needed to learn a lot of things before I could get going with this technology’ (2.0 ± 0.8) and S4. ‘I think that I would need support of a technical person to use this technology’ (3.4 ± 0.8).
There were no significant differences between the groups for statements associated with their ability to perform the task. However, there were significant differences found between weak (3.7 ± 0.6: p < 0.05), neutral (3.7 ± 0.5: p < 0.01) and strong groups (4.5 ± 0.5) for T5 ‘Learning to use the app would be easy for me’. Weak and strong (3.3 ± 0.6 vs 4.2 ± 0.4 p < 0.05) as well as neutral and strong (3.4 ± 0.5 vs 4.2 ± 0.4: p < 0.001) for T6 ‘I would find it easy to control the app so it will do what I want it to’.
There were no statistically significant differences within any of the groups for any of the ability to perform tasks or ease of use statements.
4.2.3. Breakdown by gaming habits
Responses to SUS were compared to gaming habits based upon an individual’s self-report of never played them (n:18), played monthly or less (n:8) or more than monthly (n:7). The overall SUS ratings were (never: 69 ± 11 acceptable, monthly, or less: 77 ± 9 good and more than monthly: 83 ± 9 good). There was a significant difference (p < 0.05) in the SUS scores between never playing video games and those that played more than monthly.
Comparing agreement with positive statements: These was a significant difference (p < 0.01) between those that never played video games (3.5 ± 0.5) and those that played monthly or more (4.4 ± 0.5) to the statement S1. ‘I think I would like to use this technology frequently.’ There were no statistically significant differences between any of the statements for the less than or more then monthly gaming groups. There were statistically significant differences between statements S1. ’I think I would like to use this technology frequently’ (3.5 ± 0.5) and S9. ‘I felt very confident using the technology’ (3.5 ± 0.7) with S7. ‘I would imagine most people would learn to use this technology very quickly’ (4.3 ± 0.5: p < 0.05).
Comparing disagreement with negative statements: There were no statistically significant differences between or within any of the group’s responses to negative statements.
When considering gaming habits there were no significant differences between the groups for statements associated with their ability to perform the task. There were significant differences (p < 0.05) between those who never played video games (4.1 ± 0.5) and those that played monthly or more (4.9 ± 0.4) in the statement T5. ‘Learning to use the app would be easy for me.’ There were significant differences (p < 0.05) between those who never played video games (4.1 ± 0.5) and those that played monthly or more (4.7 ± 0.5) in the statement T7. ‘I would find it easy to understand how to use the app in future’.
There were no statistically significant differences within the groups to any of the statements associated with the ability to perform tasks or ease of use statements.
4.2.4. Prior experience of using a virtual education app
Responses to SUS and TA were compared to respondents’ prior experience of using virtual educational apps. Four had previously used them (80 ± 5 good) and 29 had not (73 ± 12 good). There were no significant differences between these two groups in their SUS scores. When comparing the order of agreement with both the positive and negative statements between those with and without prior experience of VR education apps there were no significant differences in the responses between the two groups.
Within group analysis for those who had not used VR educational apps showed a statistically significant difference between the positive statement S7. ‘I would imagine most people would learn to use this technology very quickly’ (4.3 ± 0.5) when compared to both S1. ‘I think I would like to use this technology frequently’ (3.7 ± 0.6: p < 0.01) and S9. ‘I felt very confident using the technology’ (3.8 ± 0.7: p < 0.05). There were no significant differences between each of the positive statements for those that had previously used VR educational apps.
There were no significant differences between any of the negative statements for those who had not used VR educational apps before. Those that had used apps before were statistically (p < 0.05) more likely to disagree with the statements S2. ‘I found the technology unnecessarily complex‘(1.3 ± 0.5), S6. ‘I thought there was too much inconsistency in this technology’ (2.0 ± 0.8) and S10. ‘I needed to learn a lot of things before I could get going with this technology’ (2.0 ± 0.0) when compared to S4. ‘I think that I would need support of a technical person to use this technology’ (2.3 ± 1.3).
There were no significant differences in any of the TA statements associated with better ability to perform the task and ease of use for those respondents who had or had no prior experience of virtual education apps. Within group analysis showed no significant differences to any of these statements either.
4.2.5. Enthusiasm for technology
Respondents were asked to rate their view on the statement ‘I enjoy learning how new technologies can help in my clinical skills training.’ Those who were neutral (n:3) on this statement rated SUS as 63 ± 1 (acceptable). Those that agreed/strongly agreed with the statement (n:30) rated it as 75 ± 10 (good). There was no statistically significant difference between the two groups. There were significant differences (p < 0.01) between the two groups for S3. ‘I thought that the technology was easy to use’ (neutral: 2.7 ± 1.2 vs agree/strongly agree: 4.2 ± 0.6) and S9. ‘I felt very confident using the technology’ (neutral: 3.0 ± 0.6 vs agree/strongly agree: 3.9 ± 0.7: p < 0.05). There were no significant differences between the two groups for any of the negative statements.
Within group analysis showed no significant difference between each on the positive or negative statements for the neutral group. Those who agreed/strongly agreed with the statement ‘I enjoy learning how new technologies can help in my clinical skills training’ were statistically (p < 0.05) more likely to agree with the positive statement S7. ‘I would imagine most people would learn to use this technology very quickly’ (4.3 ± 0.5) when compared to S1. ‘I think I would like to use this technology frequently’ (3.8 ± 0.6). There were statistically more likely to disagree with the negative statements S2. ‘I found the technology unnecessarily complex’ (1.8 ± 0.8: p < 0.05), S6. ‘I thought there was too much inconsistency in this technology’ (1.9 ± 0.7: p < 0.05) and S10. ‘I needed to learn a lot of things before I could get going with this technology’ (1.8 ± 0.6: p < 0.01) when compared to S4. ‘I think that I would need support of a technical person to use this technology’ (2.6 ± 1.3).
There were no significant differences in responses to statements associated with better ability to perform the task between those who were neutral or agree/strongly agree about enthusiasm for using innovative technology in clinical training. There was a significant (p < 0.05) difference between the two groups (neutral: 3.7 ± 0.6 vs agree/strongly agree: 4.4 ± 0.5) to statement T7 ‘I would find it easy to understand how to use the app in future’ which is associated with ease of use. There were no significant differences between the statements for ability to perform the task and ease of use within either of the two groups.
4.2.6. Breakdown by age
Responses to SUS were compared to age groups. The overall SUS ratings were 18-21 (n:10 71 ± 14 good), 22–24 (n:8 76 ± 9 good), 25-27 (n:11 74 ± 11 good) and 28+ (n:4 77 ± 11 good). There was no significant difference between any age group. The oldest age group (28+: 2.0 ± 0.8) were significantly less likely to agree with the statement S9. ‘I felt very confident using this technology’ when compared to 18-21 (3.6 ± 1.0: p < 0.01), 22–24 (4.0 ± 0.5: p < 0.001) and 25–27 (3.9 ± 0.5: p < 0.01). Younger age groups 18-21(1.8 ± 0.8), 22–24 (2.0 ± 0.5), 25-27 (1.9 ± 0.3) were all statistically significantly (p < 0.001) more likely to disagree with the statement S10 ‘I needed to learn a lot of things before I could get going with this technology’ than the older age group (3.8 ± 1.0).
Within group analysis showed a statistically significant difference (p < 0.05) in the 22–24 years old for the positive statements S3. ‘I thought that the technology was easy to use’ (4.6 ± 0.5) and S1. ‘I think I would like to use this technology frequently’ (3.8 ± 0.5) and in the 28+ year old group to the positive statements: S1. ‘I think I would like to use this technology frequently’ (3.5 ± 0.6: p < 0.05), S3. ‘I thought that the technology was easy to use’ (4.3 ± 0.5: p < 0.001), S5. ‘I found the various functions were well integrated’ (3.8 ± 0.5: p < 0.01) and S7. ‘I would imagine most people would learn to use this technology very quickly’ (4.3 ± 0.5: p < 0.001) when compared to S9. ‘I felt very confident using the technology’ (2.0 ± 0.8). There was a statistically significant (p < 0.05) difference between the negative statements for the 22–24 years old for the negative statements S2. ‘I found the technology unnecessarily complex’ (1.6 ± 0.5) and S4. ‘I think that I would need support of a technical person to use this technology’ (2.9 ± 1.1).
There were no significant differences between or within the two groups to any of the TA statements associated with better ability to perform the task and ease of use for different age groups.
4.2.7. Gender
When SUS was compared to gender the ratings were: male (n:13 75 ± 8 good) and female (n:20 73 ± 13 good). There was no significant difference between genders. The were no significant differences in the responses to the positive or negative statements between the two groups. Within group analyses showed that males were statistically more likely to agree with the positive statements S3. ‘I thought that the technology was easy to use’ (4.2 ± 0.7: P < 0.01) and S7. ‘I would imagine most people would learn to use this technology very quickly’ (4.2 ± 0.4: p < 0.01) when compared to S9. ‘I felt very confident using the technology’ (3.4 ± 0.5). Females were statistically more likely to agree with the positive statement S7. ‘I would imagine most people would learn to use this technology’ (4.5 ± 0.5) when compared to S1. ‘I think I would like to use this technology frequently’ (3.8 ± 0.6: p < 0.05) and S9. I felt very confident using the technology’ (3.7 ± 0.9: p < 0.01). There were no statistically significant differences within either group for each of the negative statements.
When technology acceptance was compared between genders (M:13 and F:20) for ability to perform the tasks and ease of use there was a significant difference between the two groups (M:4.6 ± 0.5 vs F: 4.0 ± 0.7 p < 0.001) for T7 ‘I would find it easy to understand how to use the app in future’. Within group analysis showed no significant differences between any of the statements for ability to perform tasks and ease of use.
4.3. Influencing factors
It can be seen in the model summary table () that the independent variables SUS, ease of use (EOU) and ability to perform task (APT) explain 40% of total variation of dependent variable (VR ACCEPTANCE).
Table 3. Model summary table.
indicates that the regression model significantly (p < 0.005) predicts the dependent variable VR ACCEPTANCE.
Table 4. Regression model.
The Coefficients table () predicts VR ACCEPTANCE from EOU (0.73).
Table 5. Coefficients.
These analyses show that ease of use (EOU) plays a significant role in the acceptance of the app by the participants. Both overall usability (SUS) and ability to perform task (APT) are also influencing factors but these were not statistically significant.
4.4. Skill evaluation
In the following section the pre-post test scores are compared for all participants, medical students, doctors, and, with respect to the participants digital literacy skills, video gaming habits, prior experience of VR education app, age and gender ().
Table 6. Breakdown of test scores.
4.5. Participant feedback
When asked about their feelings on the use of VR to learn new clinical skills in the future (n:48), forty-three said they agreed or strongly agreed that this should be the case (30 medical students and 13 doctors). Four medical students were neutral, and one strongly disagreed.
When asked about their views (n:34) as to whether VR is beneficial use of medical school’s budget twenty-nine agreed or strongly agreed (16 medical students and 13 doctors). Four medical students were neutral, and one strongly disagreed. Indicative responses to their experience of using the app included:
“Easier to see structures in the retina than would be in a real patient.”
“Makes it clearer than reading from textbook.”
“Was a different experience and more engaging than listening to a lecture.”
“Makes it easy to understand the processes behind fundoscopy. Pathology easy to identify and would make me more comfortable to do so in a real patient.”
“The descriptions about the pathologies showing you to look around and find it - thought this was useful and exactly what students need.”
“Easy to use and helpful to see clear pathology - much easier to see on a patient once you have used the app”
“New way of doing things - kinetic learning and intellectually stimulating”
“Realistic and you can take your time and repeat as you do not need to worry about patient comfort.”
5. Simulation development framework
During the creation of the app the authors have produced a formalised process for developing clinical simulations (). There are three main stages 1. Preparation and design, 2. Development and testing and 3. Evaluation and impact and is a hybrid between iterative and cascade.
Figure 2. Flow diagram of development process for medical simulations.
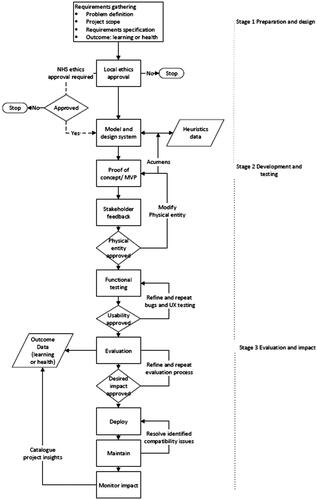
5.1. Preparation and design
The preparation and design phase is further broken down into requirements gathering and specifications, ethics, and design. During the first stage it is important to work closely with the the clinical teams to clearly identify what is required. This can be done using focus groups, journey mapping, structured interviews, surveys, or questionnaires. These meetings can be difficult to arrange owing to clinician’s availability so it is important to focus the conversations on what the program is required to do, what educational outcomes are to be expected, how will these be assessed, for example either internally, within the program itself, or through external evaluation. The underlying structure and nature of questions differ depending on the meeting setting. For example, open-ended questions are more appropriate for focus groups. Close-ended questions are typically more effective for surveys to maximise the rate of response to these surveys (Sommerville, Citation2011). The output is a requirement specifications document for the simulation.
Ethics approval is required when working with people both at the developers’ institute and within the NHS. Gaining local institutional ethics approval early on means that development will not be delayed. If NHS ethics approval is needed for the project this can be a lengthy process and is a requirement if patient participants are needed and are to be recruited via the NHS. However, when working with NHS staff the specific policies can be dependent upon the specific NHS Trust. Before starting the project, it is critical that the types of work and data collection have been discussed with them and where ethics approval is required as this should not be done retrospectively.
The design phase sets out the specification for the development. Ideally a written proposal outlines what is needed from the clinical teams and what features the simulation will have. If the simulation is a serious game, the game-based elements, mechanics, scoring systems and feedback systems are defined. This proposal indicates how the simulation will be built, what hardware platform(s) are to be targeted and what will be delivered in the proposed time frame. All these processes will be documented with the help of appropriate diagrams, sketches and flow charts which may also represent the required clinical processes that need to be modelled. Having poor access to essential clinical information, as well as ‘feature creep’ (where additional features are continually requested) are two factors which can comprise the success of projects. Therefore, the proposal is useful to clearly state the project’s intent to all parties involved. Working with hard-to-reach or vulnerable groups is even more challenging in terms of regular access to them to elicit feedback and update requirements where they need be. In this case heuristics may help (Wilson et al., Citation2017c). For the heuristics to fulfil their role, they need to be objective and representative of the stakeholders’ requirements. Given that the stakeholders can be hard to reach or vulnerable, it is unreasonable to assume that objective, representative thresholds can be set on these heuristics upfront. Maintaining a repository of heuristics data is essential for the continuous improvement of artefacts. Due to the iterative nature of heuristic-based design, the output of the design phase is a minimal viable product (MVP). This MVP is continually updated in each iteration of the design phase based on stakeholder feedback.
5.2. Development and testing
The development and testing are intended to move the concept into a functioning physical entity. Progress on any implementation can stall at the design stage if meetings are just confined to discussions. Therefore, a proof of concept/minimal viable product (MVP) is invaluable to keep discussions focused. This is because clinical teams may not be familiar with the capabilities that the technology can offer. By creating a basic product that they can interact with helps with more productive and guided dialogue between the developers and the clinical teams. Adopting a streamlined development approach, for example using rapid application development (RAD) (Martin, Citation1991) bugs can be identified and usability issues can be addressed. Initially this can be done with the help of internal review without needing the involvement of the clinicians at this stage. Subsequently the MVP can then be given to the clinical teams for them to give formative feedback on the design, usability issues and any adjustments needed for it to meet their desired clinical outcomes.
After the MVP has been created and initially approved by the clinical teams an iterative development process is then used to systematically refine any issues associated with usability, user experience and functionality. It is important to utilise standardised evaluation techniques, discussed in section 4.3, to standardise the notion of usability, user experience and functionality. As it is not always easy to continually get access to clinical teams to help with naïve users who lack technical skills, they are extremely useful to provide formative feedback on any issues. This group acts as a surrogate for the clinical teams as they too are less likely to be familiar with how the simulations work.
5.3. Evaluation
When the system and the clinical concepts are correct then it can enter the evaluation phase. Functional and non-functional evaluations that can be used include measures of effectiveness such as completion rates and the number of errors; efficiency such as task time, time-based efficiency, and overall relative efficiency. However, their choice can be dependent on the type of simulation and not all may be appropriate in the medical simulation’s context. Usability and user acceptance can be measured using the System Usability Scale (Brooke, Citation1996) and the Technology Acceptance Model (Davis, Citation1989). Acceptance thresholds can also be derived from the heuristic thresholds that were elicited in the design phase. Assessing whether the users improved their knowledge is usually measured by using pre-post test quizzes.
5.4. Deploying, maintaining, and documenting
Once the simulation has passed its evaluations and the team is confident that it can perform its intended task it can be deployed to the users. Depending on the type of simulation this may be made available through institutional eLearning portals, Google PlayTM, Apple StoreTM or managed through the host’s intranet.
Involvement with the host institutes (for example, the NHS IT team) is important in that they are confident that the simulation will not disrupt users’ devices and is safe to use. If the simulation has been created for use on mobile apps then the user needs to be aware that their device may not be supported. Users can either refer to the relevant guides supplied by the application programming interface (API) developer. As an initial alternative a free demonstration version with minimal functionality can be created so the users can see if the simulation is compatible with their device before, they use the full version, which may be paid for.
The rapid pace of change of technology can also pose problems for maintenance. The simulation may be compatible with certain models and types of mobile device, but as newer devices become available this means that the existing software may no longer work correctly. Changes to the API used may also result in backwards compatibility issues. The simulation may therefore only be viable for a set time frame. A confounding factor if easy to use and timely evaluation techniques are not used as lengthy delays can occur during this stage. If the resources are not available for on-going maintenance, then identifying commercial support, for example licensing out may be one solution for maintaining it over time. There are many cost models available in the literature which can help determine the resources required for on-going maintenance of the simulation (Ahn et al., Citation2003; Granja‐Alvarez & Barranco‐García, Citation1997; Hayes et al., Citation2004).
Although documentation is discussed at this point this is an ongoing process during development. It takes the form of a detailed description of the development of the software as well as an installation guide. The former is a technical document for the development team whereas the latter is for the user. The authors do not routinely create help guides for the user as the development of the simulations leverage instructional design processes (Gagne, Citation1987) which not only teach the clinical procedure, but the simulation also teaches the user how to use the technology.
Impact on an organisation will occur over time. Examples of important metrics may include quantifying how many medical students used the simulation and how often; calculating any reduction in the total amount of face-to-face contact hours clinical teachers needed to teach the skill; determining if there were any financial savings made because of using the simulation when compared to traditional teaching techniques. Other information may relate to how many organisations are using the simulation to train their students and were there any fundamental changes to policy whereby the simulations became a required teaching resource. This information will often be at other organisations so careful thought needs to be made how to collect it, potentially over many years, as well as considerations for maintaining data privacy. If the simulation is not subject to any patent application, then publishing in high quality peer reviewed academic venues where the development process and evaluation are documented is used by the clinical community as evidence of its validity and credibility.
6. Discussion
Computer-based clinical simulations have a key role in medical education and would benefit from a better definition of a roadmap for their creation and evaluation. In this work, the authors described the development of an inexpensive VR ophthalmology trainer and the processes used to create and evaluate it. This framework is in-line with NHS guidelines for commissioning educational technology (Department of Health, Citation2011; Health Education England, Citation2016) that is, it is educationally coherent, innovative and evidence based; it delivers high quality educational outcomes (impact) and value for money whilst ensuring equity of access and quality of provision.
The study results show that users highly rated the app for usability, improving their confidence and understanding of the skills and knowledge required to perform an ophthalmology examination. Factors such as whether they were a doctor or medical student, their age, gender or prior experience of using virtual education app did not influence their views on overall usability. All these groups stated usability was good. Self-reported digital literacy skills and gaming habits did influence views on usability. Those who never played video games or had low to neutral digital literacy skills were more likely to rate usability as acceptable compared to regular gamers or people with strong digital literacy skills who rated it as good. Taking the respondents enthusiasm for technology into account, those who were in favour of using it in their clinical teaching rated it as good, those who did not, rated it as acceptable, however there was no significant difference between these two groups. From the regression analyses, participants emphasized the importance of usability, ability to perform the task and ease of use as to why they would accept the use of this technology. Ease of use was the most significant influencer in this study indicating its importance when designing clinical teaching tools.
The responses to the technology acceptance statements further supported that the app was easy to use, and respondents felt they better understood the processes used in ophthalmology. More than three quarters of all respondents felt that they would have better confidence when performing this task on a person in future, with no difference in this statement between doctors and medical students.
When reviewing the effect of technical related skills on usability and technology acceptance it was unsurprising that the results showed that users who felt they were less digitally literate or had less prior experience of technology, in the form of video gaming, using VR education apps or their enthusiasm for technology found it more difficult to use. Regardless of their digital literacy skills, gaming habits, prior experience of using virtual education apps, enthusiasm for technology, age or gender, all groups were favourable about how the app improved their ability to perform ophthalmology tasks. This positive finding is also supported by all but the 28+ age group, where there were significant improvements in their knowledge and understanding of ophthalmology processes as demonstrated in their improved test results. Despite the lack of statistical significance, the oldest age group still increased their post test score over their pre-test score. The lowest rated response from all respondents related to their confidence to perform this task on a person in future. People with low digital literacy skills, infrequent gaming habit, no prior experience of using virtual education apps, enthusiasm for technology felt less confident to perform the task on a person in future compared to their more technically proficient counterparts. All age groups and genders rated this as the lowest too. Despite this statement being the lowest ranked only those with no prior experience of VR education apps rated it below 50%, with groups citing improved confidence between 66-100%. The authors appreciate some of the groups contain low numbers, however the information still provides useful insights into what characteristics can influence users’ views on the technology.
There were recurring themes in the statements for both SUS and technology acceptance, for example responses to the ease of use and cumbersome nature of the app. This may reflect the nature of Google CardboardTM, which is not as sophisticated as other commercially available products. However, it was chosen as it had to fit in with the requirement that the simulation be inexpensive. Other VR headsets can also be cumbersome, require a high technical specification computer to run them, and room scale VR is not relevant or appropriate for this type of specialist tool.
Responses to statements on their need for technical assistance to use the app may reflect that during this evaluation the respondents only used it once. Subjects who considered themselves less technical indicated in their responses to SUS and TA statements that they had lower confidence in using the app. The consistently highly rated statement ‘I would imagine most people would learn to use this technology very quickly’ is also indicative of potential confidence issues where respondents feel other people would be better using it than themselves. Given time and practice, they would become more familiar and confident with the app.
The app is intended to be a voluntary supplement to existing teaching methods and not mandatory as was originally specified by the clinical team. This is echoed in the majority of respondents (90%) being positive about using VR to learn new medical skills in future and would enjoy learning how innovative technologies can help in their clinical skills training (93%). However, respondents did not want to use this type of technology all the time, feeling that a range of complementary teaching and learning approaches would benefit them.
In the context of this study, it is not possible to assess direct benefit of the app in patient-facing clinical practice. This is because many medical students would not be applying their skills to patients at this time. Similarly longitudinal studies are not possible given the respondents would move on to other aspects of their clinical training and other hospitals and NHS Trusts. In the context of the requirements from the clinical team the purpose of the study was to see if the app improved participants confidence in undertaking this important diagnostic procedure in line with the work of Sim et al. (Citation2020) who had identified poor confidence in ability to perform this skill by practicing doctors.
The evaluations were conducted in a busy working hospital (where this type of clinical procedure is taught) rather than in a usability lab or classroom. This meant there were both strict limitations on the number and time there could be access to the clinical staff and medical students. It was decided to use validated tools such as SUS (Brooke, Citation1996) and TAM (Davis, Citation1989) because they could be administered quickly. It must be noted that the authors did not use the exact statements found in TAM. Rather, more appropriate ones were adapted from the original ones to reflect the statements that needed to be asked from the clinical participants in this evaluation. The authors appreciate this questionnaire is not validated; however, it is a starting point given that variations of the TAM have been proposed for VR (Sagnier et al., Citation2020) but these were still not applicable to this study. Given the venue it was not possible to have ideal subject groups to allow in-depth analyses, for example assessing both main and interaction effect. This was because many of the groupings would be too small to allow for these types of analyses. None-the-less the information provided by the analyses provides valuable insights into the views and perceptions of the different user profiles.
SUS (Brooke, Citation1996) and TAM (Davis, Citation1989) have been criticized for their limitations, yet they have been extensively used in many studies (Bangor et al., Citation2008). It has been previously highlighted that only high SUS scores are reported (Bangor et al., Citation2008) which is the case in this study. The reason for the high SUS scores resulted from ongoing formative feedback, during the app’s development, which addressed usability issues. SUS was only used during the final evaluation with its intended end users. The fact that usability was rated high also reflects how well the authors’ proposed development framework works. There has also been criticism of researchers looking at the individual SUS statements moving away from the intended one value SUS score (Bangor et al., Citation2008). The authors felt that this was an important aspect to look at so that any factors which would mean certain users would be less likely to engage with the app could be identified. Therefore, alternative teaching approaches could be offered to them, so as not to disadvantage any student. As reported by Kortum and Bangor (Citation2013) prior experience of product or technology can potentially bias results in a positive way. The authors would not assert their study was biased, more that it identified that more technical experienced subjects did rate the product higher than less technical ones. The results of the skill test clearly showed that irrespective of whether the users favoured technology or not, they all improved their understanding of how to perform diagnostic examination of the back of the eye. Despite reservation in the use of tools like SUS (Brooke, Citation1996), the authors have shown that when used in combination with questions based upon TAM (Davis, Citation1989) and pre-post testing they provided extremely useful insights into the users’ perceptions of the app and can be completed in a short space of time.
It cannot be understated the challenges that can be faced when trying to develop medical simulations, especially across organizations. Access to accurate information, expertise from clinical team and target demographics can be very difficult. The danger can be to create simulations without sufficient engagement with the stakeholders with the misconception that this is the best and most convenient approach for the developers. Therefore, the authors have also proposed an initial model for a structured process for the development of medical simulations which aims to mitigate some of these problems. This is with the intent to be as productive as possible when engaging with clinical teams. Similarly, to the work of Olszewski and Wolbrink (Citation2017), there are three key phases in this model i. preparation and design, ii. development and testing and iii. evaluation and impact. As mentioned in the introduction, the target problem for this contribution is the lack of technical-focused software development frameworks in clinical computer-based simulations. The process is user-centred in its approach and highlights the use of appropriate surrogates in the testing stages. Moreover, similar SDLCs operate assuming there is access to stakeholders throughout the life cycle, but this is not always true in clinical settings. The processes the authors have used can be compared to a series of criteria that are associated with a software development framework. These encompass a sequence of software production activities, a description of the artefacts that should be produced by the modelling language, managing, and directing team efforts, and providing criteria for monitoring and assessing project activities and outputs (Hesari et al., Citation2010). Comparing the authors’ work to this, the following features exist, coverage of generic phases: requirements, analysis, design, implementation, and test with smooth and seamless transitions between each. There is product adequacy and product consistency with minimum overlap between the output of the first and second phases of the process. However, there is high overlap between the output of the second and third phases. The design proposal and MVP show structural and functional views whereas the developed simulation shows the functional and behavioural views. The process supports product abstraction (analysis, design, or implementation levels), with analysis and design in the preparation and design phase and implementation in the development and testing phase. Product tangibility, testability and visibility are all supported. There are levels of documentation which are associated with support for the development team and during the installation of the simulation. Throughout the process users are involved. There are no role specifications explicitly defined in the process. In terms of management features risk, people and project management are all supported. Quality management is only partially supported whereas configuration management is not. summarises these comparisons.
Table 7. Comparison and conformance for software development frameworks (Hesari et al., Citation2010).
Given the user-focused nature of the proposed framework, it is comparable to the activities identified by the ISO-9241-210 standard for human-centred design. This standard was developed to “provide requirements and recommendations for human-centred design principles and activities throughout the life cycle of computer-based interactive systems. It is intended to be used by those managing design processes and is concerned with ways in which both hardware and software components of interactive systems can enhance human–system interaction” (International Organization for Standardization, Citation2010, p. 7). The rationale behind this standard is a more generic version of the rationale behind this paper’s framework: the lack of technical-focused software development frameworks in the field of clinical computer-based simulations.
The activities recommended by ISO-9241-210 are a) understanding and specifying the context of use, b) specifying the user requirements, c) producing design solutions, and d) evaluating the design (International Organization for Standardization, Citation2010). These activities map almost 1-1 to those proposed by this paper’s framework. Preparation and design maps to the first two activities from the standard, development, and testing maps to the third activity, and evaluation maps to the final activity in the standard. The main difference between the ISO-9241-210 standard and the proposed framework is the level of concreteness. The framework in this work specifies the tools to be used for the domain of clinical users to facilitate smooth adoption of the framework. The activities in the ISO-9241-210 standard, however, are not restrictive to being executed using specific tools. The authors’ framework is a domain-specific realisation of the ISO-9241-210 standard.
7. Conclusion
The authors have demonstrated the successful development of an inexpensive VR-based ophthalmology training app that can bridge the gap between theory and use on patients. Usability and user experience were highly rated by all the clinicians that used it. Those participants who considered themselves to be more digital literate were more likely to be more positive and confident in using the technology. However, all users demonstrably increased their understanding of how to successfully undertake the correct systematic process for the examination of the back of the eye, with users being able to distinguish between both normal eyes and those with pathologies. It improved users’ confidence in being able to perform this diagnostic procedure on patients, in future. The majority of users (90%) felt that this type of technology would be greatly beneficial in their clinical training but should not replace other forms of teaching. The app’s successful development was accomplished using a hybrid development framework reflective of the challenges that are associated with working in busy clinical environments. The resultant process provides a framework which can be further refined, adapted, or extended to other environments which also face similar challenges when working with hard to access groups.
Acknowledgements
The authors would like to thank all those people who volunteered to participate in the evaluation of the ophthalmology app.
Disclosure statement
No potential conflict of interest was reported by the author(s).
Data availability statement
All data generated or analysed during this study are included in this published article.
Additional information
Notes on contributors
Abhishek Rao
Abhishek Rao received his MBChB from the University of Manchester, UK. He currently works as a Gastroenterology Specialist Registrar at the George Eliot Hospital, Warwickshire. He has a keen interest in Medical Education and has previously worked as a Clinical Teaching Fellow and has received a PGCert in Clinical Education.
Sara Hassan
Sara Hassan received her MEng and PhD degrees from the University of Birmingham, UK. At present, she is a senior lecturer in software engineering at Birmingham City University, UK. Her research focuses on value-based software engineering, multi-objective software architectural design, and mental-health-aware software design.
Deborah Evans
Deborah Evans is in the College of Computing at Birmingham City University. Working extensively with industry on innovation projects her research interests relate to the use of non-traditional participatory methods and tools, which overcome the people, process, technology, and cultural barriers that restrict transformational digital change.
Rasheed Nassr
Rasheed Nassr is a lecturer in computer science at the College of Computing, Birmingham City University. His research centres around Natural Language Processing (NLP), sentiment analysis, user-intent discovery, and exploring the efficacy of medicine through patient feedback.
David Carruthers
David Carruthers Consultant Rheumatologist and honorary Professor, University of Birmingham. Prior head of Undergraduate Teaching Academy and Director of Medical Education at Sandwell and West Birmingham Trust.
Andrew Sean Wilson
Andrew Sean Wilson is a researcher in a wide range of digital health technologies. He focuses on evaluating the benefit that emerging technologies can have on clinical practice.
References
- Ahn, Y., Suh, J., Kim, S., & Kim, H. (2003). The software maintenance project effort estimation model based on function points. Journal of Software Maintenance and Evolution: Research and Practice, 15(2), 71–85. https://doi.org/10.1002/smr.269
- Bangor, A., Kortum, P. T., & Miller, J. T. (2008). An empirical evaluation of the system usability scale. International Journal of Human-Computer Interaction, 24(6), 574–594. https://doi.org/10.1080/10447310802205776
- Biousse, V., Bruce, B. B., & Newman, N. J. (2018). Ophthalmoscopy in the 21st century. Neurology, 90(4), 167–175. https://doi.org/10.1212/wnl.0000000000004868
- Brooke, J. (1996). SUS: A “quick and dirty” usability scale. In P. W. Jordan, B. Thomas, I. L McClelland, & B. Weerdmeester (Eds.), Usability evaluation in industry (pp. 189–194). Taylor & Francis. https://doi.org/10.1201/9781498710411
- Cook, D. A., Hatala, R., Brydges, R., Zendejas, B., Szostek, J. H., Wang, A. T., Erwin, P. J., & Hamstra, S. J. (2011). Technology-enhanced simulation for health professions education: A systematic review and meta-analysis. JAMA, 306(9), 978–988. https://doi.org/10.1001/jama.2011.1234
- Davis, F. D. (1989). Perceived usefulness, perceived ease of use, and user acceptance of information technology. MIS Quarterly, 13(3), 319–340. https://doi.org/10.2307/249008
- Department of Health (2011). A Framework for Technology Enhanced Learning. https://assets.publishing.service.gov.uk/government/uploads/system/uploads/attachment_data/file/215316/dh_131061.pdf
- Deterding, S., Dicon, D., Khaled, R., & Year, L. (2011). From Game Design Elements to Gamefulness: Defining “Gamification [Paper presentation].15th International Academic MindTrek Conference: Envisioning Future Media Environments, (pp 9–15). Association for Computing Machinery, New York, NY, USA. https://doi.org/10.1145/2181037.2181040
- Gagne, R. (1987). Instructional Technology Foundations. Taylor and Francis.
- General Medical Council (2019). Practical Skills and Procedures Practical-skills-and-procedures-a4_pdf-78058950.pdf
- Granja‐Alvarez, J. C., & Barranco‐García, M. J. (1997). A method for estimating maintenance cost in a software project: A case study. Journal of Software Maintenance: Research and Practice, 9(3), 161–175. https://doi.org/10.1002/(SICI)1096-908X(199705)9:3<161::AID-SMR148>3.0.CO;2-8
- Hayes, J. H., Patel, S. C., & Zhao, L. (2004). A metrics-based software maintenance effort model [Paper presentation]. Eighth European CSMR, In (pp 254–258). IEEE, Tampere, Finland. https://doi.org/10.1109/CSMR.2004.1281391
- Health Education England (2016). Guidelines for commissioning Technology Enhanced Learning in the NHS. https://www.hee.nhs.uk/sites/default/files/documents/Guidelines%20for%20commissioning%20technology%20enhanced%20learning%20in%20the%20NHS.pdf
- Hesari, S., Mashayekhi, H., & Ramsin, R. (2010). Towards a General Framework for Evaluating Software Development Methodologies [Paper presentation].34th COMPSAC, (pp 208–217). IEEE, Seoul. https://doi.org/10.1109/COMPSAC.2010.69
- International Organization for Standardization (2010). Ergonomics of human–system interaction—Part 210: Human-centred design for interactive systems (ISO 9241-210). ISO.
- Kortum, P. T., & Bangor, A. (2013). Usability ratings for everyday products measured with the system usability scale. International Journal of Human-Computer Interaction, 29(2), 67–76. https://doi.org/10.1080/10447318.2012.681221
- MacKay, D. D., Garza, P. S., Bruce, B. B., Newman, N. J., & Biousse, V. (2015). The demise of direct ophthalmoscopy: A modern clinical challenge. Neurology. Clinical Practice, 5(2), 150–157. https://doi.org/10.1212/CPJ.0000000000000115
- Martin, J. (1991). Rapid Application Development. Macmillan.
- Olszewski, A. E., & Wolbrink, T. A. (2017). Serious gaming in medical education: A proposed structured framework for game development. Simulation in Healthcare: Journal of the Society for Simulation in Healthcare, 12(4), 240–253. https://doi.org/10.1097/SIH.0000000000000212
- Pottle, J. (2019). Virtual reality and the transformation of medical education. Future Healthcare Journal, 6(3), 181–185. https://doi.org/10.7861/fhj.2019-0036
- Sagnier, C., Loup-Escande, E., Lourdeaux, D., Thouvenin, I., & Valléry, G. (2020). User acceptance of virtual reality: An extended technology acceptance model. International Journal of Human–Computer Interaction, 36(11), 993–1007. https://doi.org/10.1080/10447318.2019.1708612
- Sim, P. Y., La, C. J., Than, J., & Ho, J. (2020). National survey of the management of eye emergencies in the accident and emergency department by foundation doctors: Has anything changed over the past 15 years? Eye (London, England), 34(6), 1094–1099. https://doi.org/10.1038/s41433-019-0645-2
- Sommerville, I. (2011). Software Engineering. 9/E. Pearson Education India.
- Wilson, A. S., O'Connor, J., Taylor, L., & Carruthers, D. (2017a). A 3D virtual reality ophthalmoscopy trainer. The Clinical Teacher, 14(6), 427–431. https://doi.org/10.1111/tct.12646
- Wilson, A. S., O’Connor, J., Taylor, L., & Carruthers, D. (2017b). A case study into the use of virtual reality and gamification in ophthalmology training. In: M. Alcañiz, S. Göbel, M. Ma, M. Fradinho Oliveira, J. Baalsrud Hauge, T. Marsh (Eds), Vol 10622. Serious Games. JCSG. Lecture Notes in Computer Science (pp.158–169). Springer. https://doi.org/10.1007/978-3-319-70111-0_15
- Wilson, A. S., Broadbent, C., McGrath, B., & Prescott, J. (2017c). Factors associated with player satisfaction and educational value of serious games. In M. Ma., & A. Oikonomou (Eds.), Serious Games and Edutainment Applications (pp. 515–535). Springer. https://doi.org/10.1007/978-3-319-51645-5_23
- Zendejas, B., Wang, A. T., Brydges, R., Hamstra, S. J., & Cook, D. A. (2013). Cost: The missing outcome in simulation-based medical education research: A systematic review. Surgery, 153(2), 160–176. https://doi.org/10.1016/j.surg.2012.06.025